Interactive contribution of hyperinsulinemia, hyperglycemia, and mammalian target of rapamycin signaling to valvular interstitial cell differentiation and matrix remodeling
 Jessica I. Selig1 H. Viviana Krug1 Caroline Küppers1
  D. Margriet Ouwens2,3,4 Felix A. Kraft1 Elena Adler1
  Sebastian J. Bauer1† Artur Lichtenberg1
  Payam Akhyari1*†
  Mareike Barth1†
- 1Department of Cardiac Surgery, Medical Faculty, University Hospital Düsseldorf, Heinrich Heine University Düsseldorf, Düsseldorf, Germany
- 2Institute of Clinical Biochemistry and Pathobiochemistry, German Diabetes Center (DDZ), Düsseldorf, Germany
- 3German Center for Diabetes Research (DZD), Munich, Germany
- 4Department of Endocrinology, Ghent University Hospital, Ghent, Belgium
Diabetes and its major key determinants insulin resistance and hyperglycemia are known risk factors for calcific aortic valve disease (CAVD). The processes leading to molecular and structural alterations of the aortic valve are yet not fully understood. In previous studies, we could show that valvular interstitial cells (VIC) display canonical elements of classical insulin signaling and develop insulin resistance upon hyperinsulinemia and hyperglycemia accompanied by impaired glucose metabolism. Analyses of cultured VIC and aortic valve tissue revealed extracellular matrix remodeling and degenerative processes. Since PI3K signaling through mammalian target of rapamycin (mTOR) is involved in fibrotic processes of the heart, we aim at further functional investigation of this particular Akt-downstream signaling pathway in the context of diabetes-induced CAVD. Primary cultures of VIC were treated with hyperinsulinemia and hyperglycemia. Phosphorylation of mTOR(Ser2448) was determined by Western blot analysis after acute insulin stimulus. Inhibition of mTOR phosphorylation was performed by rapamycin. Phosphorylation of mTOR complex 1 (MTORC1) downstream substrates 4E-BP1(Thr37/46) and P70S6K(Thr389), and MTORC2 downstream substrate Akt(Ser473) as well as the PDK1-dependent phosphorylation of Akt(Thr308) was investigated. Markers for extracellular matrix remodeling, cell differentiation and degenerative changes were analyzed by Western blot analysis, semi-quantitative real-time PCR and colorimetric assays. Hyperinsulinemia and hyperglycemia lead to alterations of VIC activation, differentiation and matrix remodeling as well as to an abrogation of mTOR phosphorylation. Inhibition of mTOR signaling by rapamycin leads to a general downregulation of matrix molecules, but to an upregulation of α-smooth muscle actin expression and alkaline phosphatase activity. Comparison of expression patterns upon diabetic conditions and rapamycin treatment reveal a possible regulation of particular matrix components and key degeneration markers by MTORC1 downstream signaling. The present findings broaden the understanding of mitogenic signaling pathways in VIC triggered by hyperinsulinemia and hyperglycemia, supporting the quest for developing strategies of prevention and tailored treatment of CAVD in diabetic patients.
Introduction
Early disturbances in insulin sensitivity and hyperglycemia (HG) (1, 2) are risk factors for the development of diabetes (3), which is a global burden with increasing prevalence (4, 5). Diabetes in turn is associated with an elevated risk for cardiovascular diseases, including calcific aortic valve disease (CAVD) (6–9). Here, studies report that aortic valve leaflets of diabetics are more prone to inflammation (10), oxidative stress (11) and remodeling (12), and show an enhanced micro-calcification together with an up-regulation of pro-osteogenic markers (13).
In previous work, we could show that valvular interstitial cells (VIC) are sensitive to short-term treatment by diabetic conditions such as hyperinsulinemia (HI) and HG (14). Here, it could be shown that VIC express the insulin receptor, insulin-like growth factor 1 receptor and glucose transporter 1. Beside impaired glucose metabolism, VIC develop an insulin resistance upon HI and HG with disturbed Akt/GSK-3α/β signaling, whilst HG alone was sufficient to induce insulin resistance. Consecutively, alterations in VIC differentiation and early signs of remodeling could be observed (14). Further analysis of aortic valve tissue in a three-dimensional approach revealed that these processes are further modulated by their biomechanical environment and that particular mitogenic signaling pathways such as downstream PI3K signaling are involved (15). Nevertheless, it remains incompletely understood whether HI, HG or the combination of both trigger molecular alterations of VIC and whether downstream PI3K signaling or alternative insulin-sensitive pathways are responsible for these processes.
PI3K signaling through mammalian target of rapamycin (mTOR) is known to be involved in fibrotic processes of several organs and tissues including the myocardium (16). Here, especially the treatment of myocardial dysfunction with mTOR inhibitors like rapamycin has gained attention, particularly in diabetes-related pathologies [reviewed in (17)]. Downstream mTOR signaling is regulated through two mTOR containing complexes: mTOR complex 1 (MTORC1) and MTORC2, both of which have diverse downstream effects and mechanisms in the heart (18). MTORC1 consists amongst others of the adaptor proteins RAPTOR (regulatory-associated protein of mTOR) and DEPTOR (DEP domain containing mTOR-interacting protein). MTORC1 downstream signaling leads to phosphorylation of P70S6K (ribosomal protein S6 kinase 1) and 4E-BP1 (eukaryotic translation initiation factor 4E (eIF4E)-binding protein 1). MTORC2 comprises RICTOR (rapamycin-insensitive companion of mTOR) instead of RAPTOR and activates Akt signaling (17). MTORC1 and MTORC2 signaling have been investigated in the context of myocardial dysfunction and type 2 diabetes (17, 18), whereas knowledge about their role in CAVD and diabetes is still scarce. Understanding of signaling pathways involved in pathological diabetes-induced processes of aortic valve disease, however, is crucial for the development of future preventive or therapeutic strategies. Thus, the present work aims at the investigation of mTOR and mTOR downstream signaling and its role in CAVD.
Materials and methods
Primary ovine valvular interstitial cells and treatments
Primary ovine VIC were isolated from aortic valves of fresh ovine hearts (n = 7) derived from a local abattoir as described before (14). Aortic valve leaflets were dissected and minced into small pieces. Tissue pieces were incubated in either normoglycemic (NG; 1 g/L glucose) or HG (4.5 g/L glucose) medium in gelatin-covered flasks until VIC grew out. After three to four passages VIC were seeded in gelatin-covered 6-well plates and treated with NG or HG medium with or without 100 nM insulin (Sigma-Aldrich, St. Louis, MO, USA; cat. no. I5523) for 5 days with medium changes every second day [for details please refer to (14)]. Inhibition of mTOR phosphorylation was performed by chronic treatment with 10 nM rapamycin (cat. no. 9904, Cell Signaling, Dallas, TX, USA) using dimethyl sulfoxide (DMSO; Sigma-Aldrich; cat. no. D8418) as vehicle.
For the acute insulin stimulus, supernatant of the cells of all treatment groups was aspirated and the cells were washed twice with PBS. After a starvation period of 4 h in medium without FCS and insulin, VIC were treated with insulin (group: with acute insulin stimulus) or not (group: without acute insulin stimulus). To evaluate the optimal insulin concentration cells were initially treated either with 10 nM or with 100 nM insulin for 10 min. In the further process, 10 nM insulin was used for the acute stimulus. Afterward, cells were washed twice with cold PBS and were lysed for SDS-PAGE and Western blot as described before (14).
SDS-PAGE and Western blot analysis
Lysates were conducted to SDS-PAGE and separated proteins were blotted on nitrocellulose. Protein signals were detected using the following primary antibodies purchased from Cell Signaling: mTOR (cat. no. 2983); phospho-mTOR(Ser2448) (cat. no. 2971); 5′-adenosine monophosphate (AMP)-activated protein kinase (AMPKα; cat. no. 2603); phospho-AMPKα(Thr172) (cat. no. 2535); ribosomal protein S6 kinase beta-1 (P70S6K; cat. no. 2708); phospho-P70S6K(Thr389) (cat. no. 9234); 4E-BP1 (cat. no. 9452); phospho-4E-BP1(Thr37/46) (cat. no. 9459); Akt (cat. no. 4691), phospho-Akt(Ser473) (cat. no. 4060), and phospho-Akt(Thr308) (cat. no. 13038). Detection of housekeeping protein GAPDH (cat. no. 2118) or β-actin (cat. no. 4967) on the according membranes was used for normalization of protein signals. Signals of primary antibodies were detected by using the following secondary antibodies: Goat IgG anti-rabbit IgG (H + L)-HRP (cat. no. 111-035-003, Jackson ImmunoResearch, Ely, UK) and goat IgG anti-mouse IgG & IgM (H + L)-HRP (cat. no. 115-035-044, Jackson ImmunoResearch). Molecular weight was determined by using a PageRuler Prestained Protein ladder (cat. no. 26616; Thermo Fisher Scientific, Waltham, MA, USA). Detection of protein signals was performed by using an Amersham Imager 600 (GE Healthcare, Chalfont St Giles, UK) and intensity of protein bands was analyzed by Image Quant TL software (GE Healthcare). Detection of 4E-BP1 and Akt as well as the corresponding phosphorylated antibodies was performed with IRDye 800 CW goat anti rabbit (cat. no. 926-32211, LI-COR biosciences, Lincoln, NE, USA) and IRDye 680 LT goat anti mouse (cat. no. 926-68020, LI-COR biosciences) as secondary antibodies using an Odyssey scanner (LI-COR biosciences).
Western blot images of Supplementary Figure 1 and Figures 3, 4 were cropped since additional conditions have been tested for control experiments on these blots. Uncropped images of the appropriate blots are depicted in Supplementary Figures 2–4, respectively.
mRNA analysis by semi-quantitative real-time PCR
Isolation of total RNA, cDNA synthesis as well as semi-quantitative real-time PCR was performed as previously described (10). Primer sequences were as follows: collagen type 1 (COL1A1; forward 5′-AAGACATCCCACCAGTCACC-3′, reverse 5′-TAAGTTCGTCGCAGATCACG-3′), elastin (ELN; forward 5′- AGTTCCTGGAGGCGTCTTCT-3′, reverse 5′ CAC CTGGCTTAGCTGGTTTC-3′), biglycan (BGN; forward 5′-TCTGCTCCGCTACTCCAAGT-3′, reverse 5′-TTGTTGTCC AAGTGCAGCTC-3′), decorin (DCN; forward 5′ CCAAAGTG CGAAAGTCTGTG-3′, reverse 5′-TTCAATGCCTGAGCTCT TCA-3′), α-smooth muscle actin (ACTA2; forward 5′-GATA GAGCACGGCATCATCA-3′, reverse 5′-GAAGGGTTGGATG CTCTTCA-3′), osteopontin (OPN; forward 5′-GATGGCCG AGGTGATAGTGT-3′, reverse 5′-TCGTCTTCTTAGGTGCG TCA-3′), alkaline phosphatase (ALP; forward 5′-CAACACC AACGTGGCTAAGA-3′, reverse 5′-GTTGTGGTGGAGCTG ACCTT-3′), matrix metalloproteinase 2 (MMP2; forward 5′-TGACAAGGACGGCAAGTATG-3′, reverse 5′-GTAAGATGT GCCCTGGAAGC-3′), hyaluronic acid synthase 2 (HAS2; forward 5′-TCACCCAGTTGGTCTTGTCC-3′, reverse 5′-GG TCAAGCATGGTGTCTGAA-3′), and matrix metalloprotei nase 9 (MMP9; forward 5′-TAGCACGCACGACATCTTTC-3′, reverse 5′-GCCCACATAGTCCACCTGAT-3′). Relative mRNA expression analysis was performed by 2–ΔΔCt method using CT means of the following reference genes: β-tubulin (forward 5′-CCTACAACTGGACCGCATCT-3′, reverse 5′-AAAGGACCTGAGCGAACAGA-3′), 60S ribosomal protein L13a (RPL13a; forward 5′-GATCCCACCACCCTATGACA-3′, reverse 5′-CTTCAGACGCACAACCTTGA-3′), and 60S ribosomal protein L29 (RPL29; forward 5′-CCAAGTCCAAG AACCACACC-3′, reverse 5′-TATCGTTGTGATCGGGGTTT-3′). In the following, gene names are written in italics.
Detection of alkaline phosphatase activity
Using the PierceTM PNPP Substrate Kit (cat. no. 37620, Thermo Fisher Scientific), the concentration of cell released alkaline phosphatase (n = 3) was measured using supernatants of the media before inhibitor treatment and then every second day. The assay was performed according to the manufacturers’ instructions using a microplate reader (Infinite M1000 Pro) by measuring the absorbance at 405 nm.
Detection of cytotoxicity
The CyQUANT™ LDH cytotoxicity assay (cat. no. C20300, Thermo Fisher Scientific) was used to determine the amount of lactate dehydrogenase (LDH) released into the media of the cells. Therefore, supernatants were collected at the day of cell harvest and the colorimetric assay was performed according to the manufacturer’s instructions using a microplate reader (Infinite M1000 Pro). Data was normalized to total protein content.
Statistical analysis
Statistical analysis was performed using GraphPad Prism version 7 (GraphPad Software, San Diego, CA, USA). Data is presented as mean ± SEM. Statistical analysis of data originating from Western blot analysis was performed using two-way ANOVA with Sidak’s multiple comparison test. Statistical analysis of data originating from semi-quantitative real-time PCR, ALP and LDH analysis was performed using Kruskal–Wallis test with Dunn’s post hoc test. For comparison of two groups, Mann–Whitney U test or Wilcoxon signed rank test was applied. p-Values < 0.05 were considered as statistically significant.
Results
Hyperglycemia and hyperinsulinemia abrogate PI3K signaling in valvular interstitial cells
To elucidate the impact of diabetic conditions on PI3K signaling, Western blot analysis of mTOR signaling was performed in VIC (Figure 1). Acute insulin stimulation led to a significant increase in mTOR(Ser2448) phosphorylation (p = 0.012) under NG, an effect which was abrogated by treatment with HI or HG as well as by the combination of both treatments. Upon acute insulin stimulus, HI inhibited phosphorylation of mTOR(Ser2448) under NG treatment by 43% (p = 0.003) as well as under HG treatment by 48% (p = 0.009) (Figures 1A,B). Compared to NG conditions, the combination of HG and HI led to a significant decrease of mTOR(Ser2448) phosphorylation upon acute insulin stimulus by 57% (p < 0.0001). HG treatment alone did not lead to a significant decrease of mTOR(Ser2448) phosphorylation upon acute insulin stimulus compared to the appropriate NG condition. Basal phosphorylation (Figures 1A,B) as well as protein abundance of total mTOR (Figure 1B’) was not affected by diabetic conditions. In contrast to mTOR, AMPK signaling was not impaired by diabetic conditions (Figure 2).
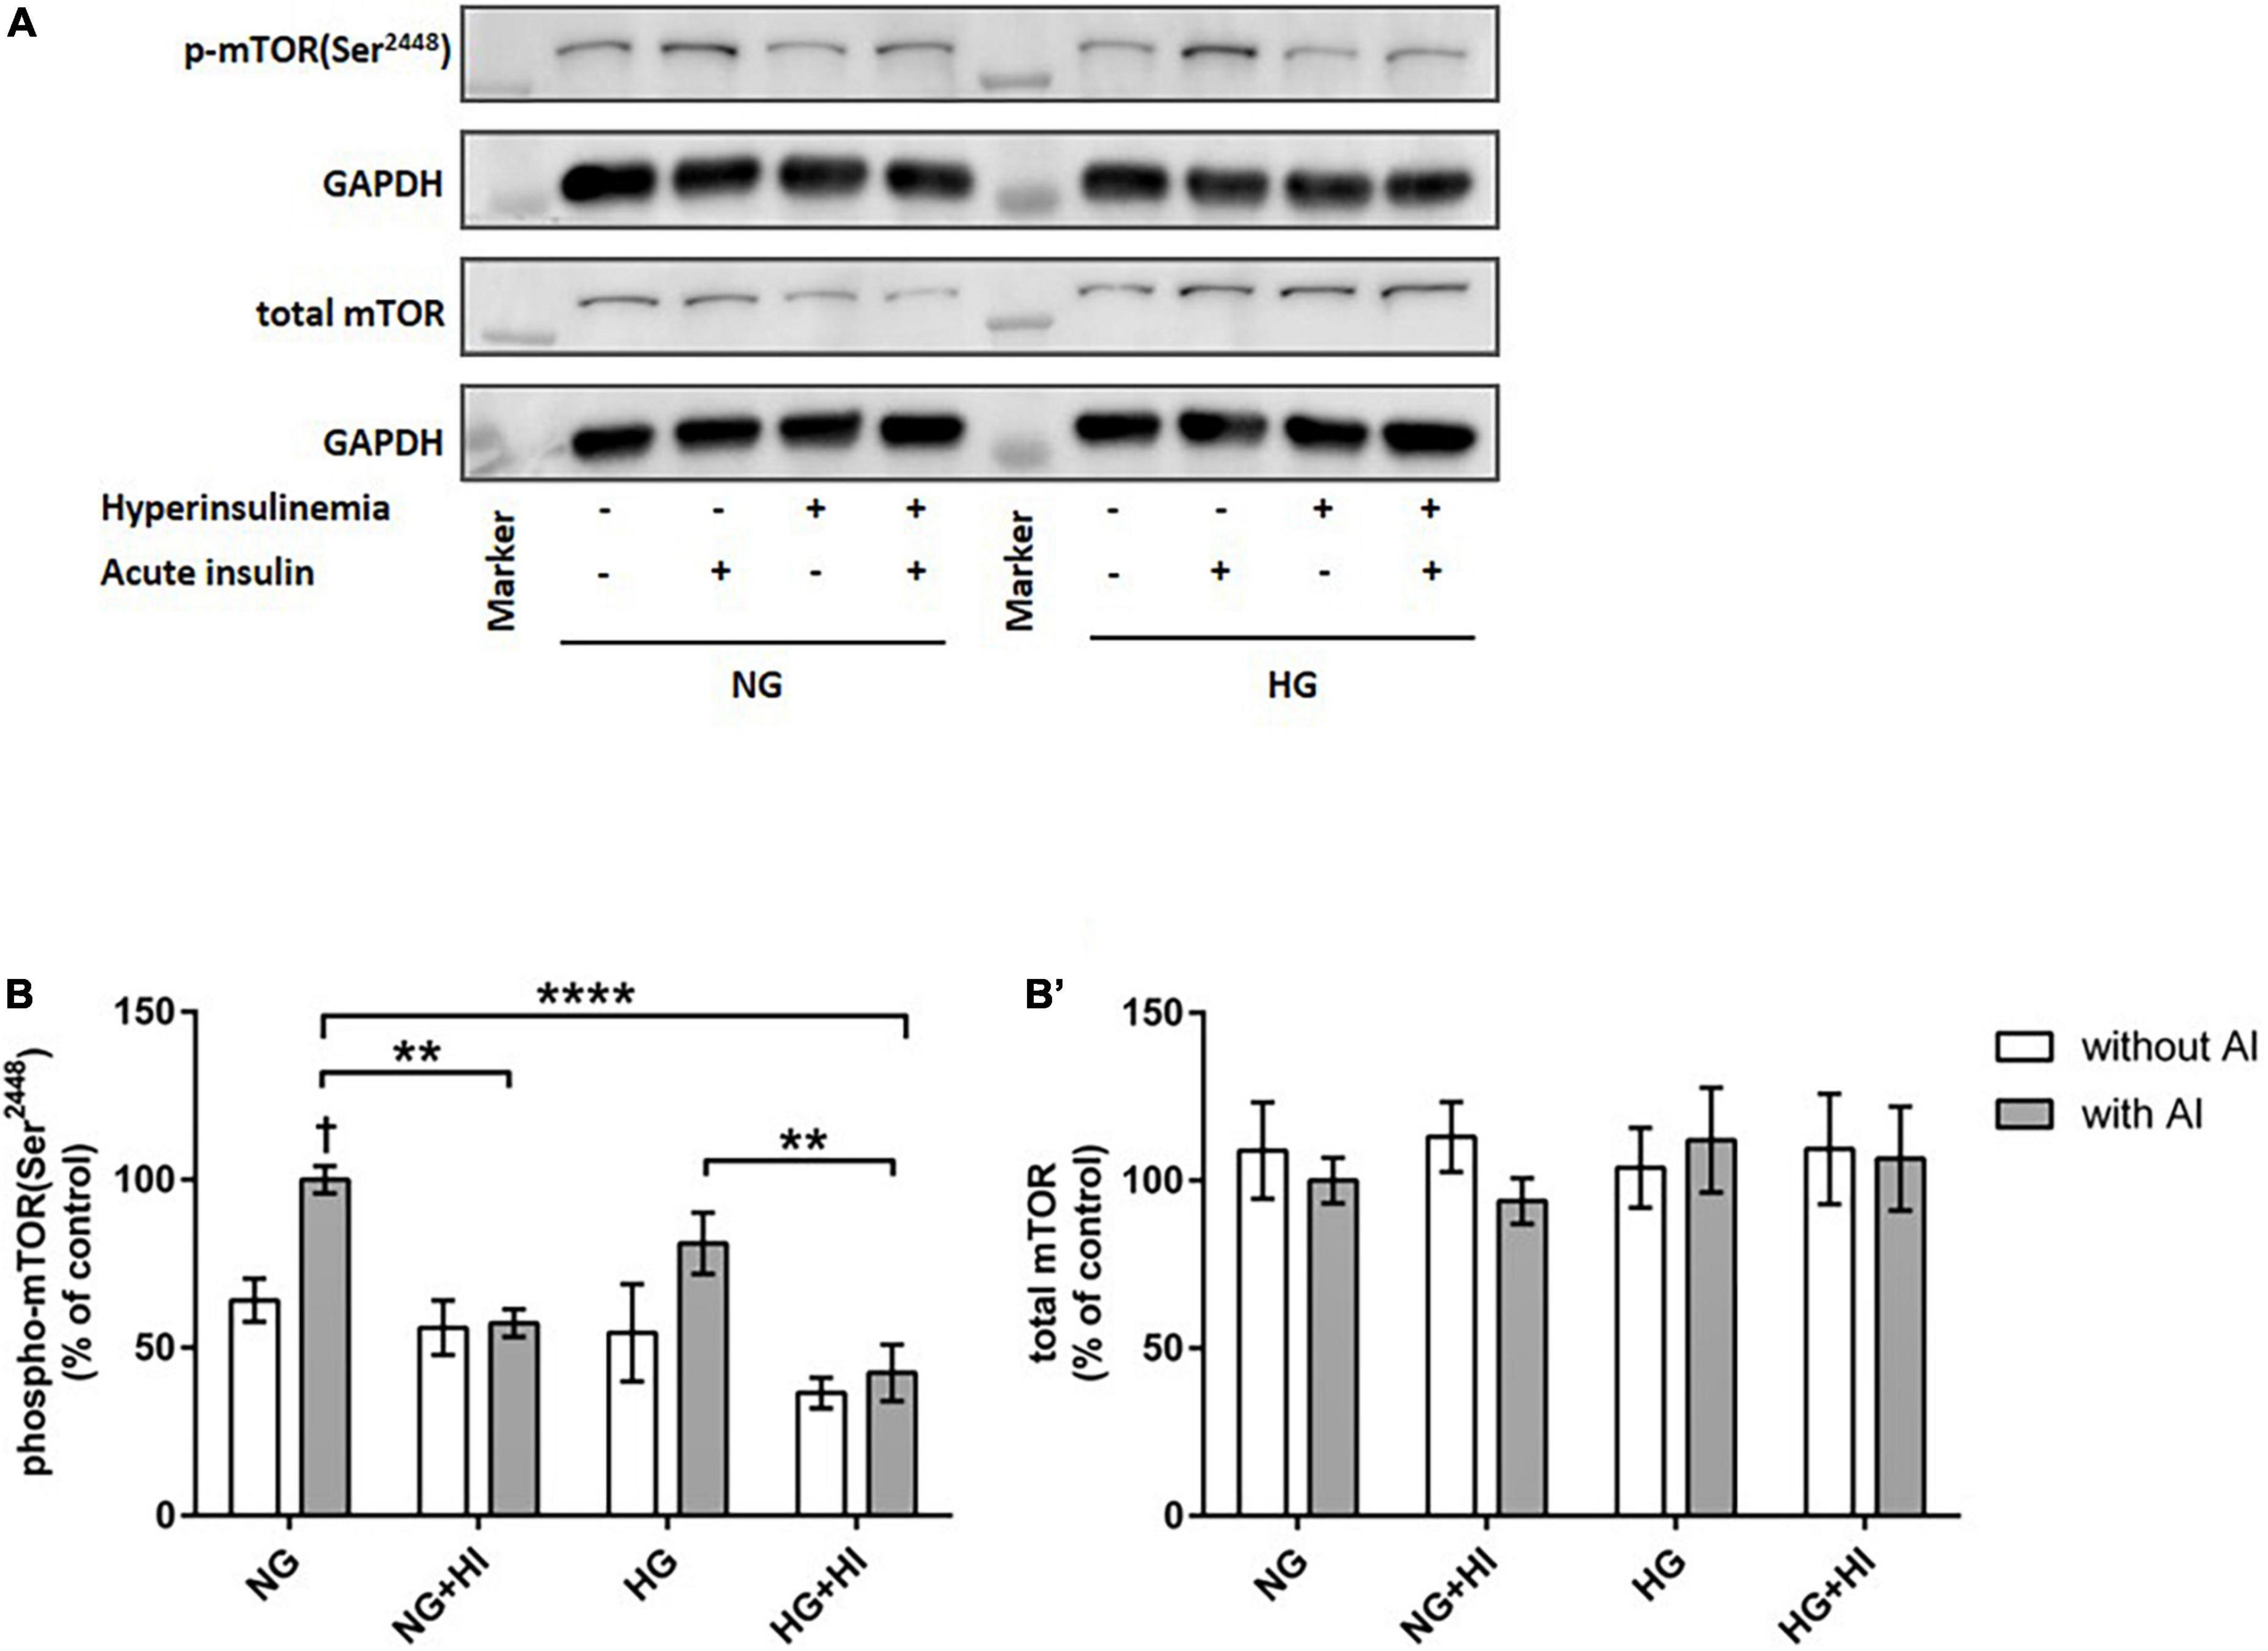
Figure 1. Diabetic conditions abrogate mTOR phosphorylation. Phosphorylation of mTOR(Ser2448) upon hyperinsulinemia under normoglycemia and hyperglycemia was measured in cultured ovine VIC (n = 7). Representative Western blot images show phosphorylated and total mTOR expression (A). Quantification of protein signals showed that hyperinsulinemia led to significantly decreased phosphorylation levels of mTOR(Ser2448) as well as to an abrogation of inducible phosphorylation upon acute insulin stimulus (B). Total amount of mTOR was not altered (B’). Data was normalized to GAPDH and expressed relative to normoglycemic conditions with acute insulin stimulus. NG, normoglycemia; HI, hyperinsulinemia; HG, hyperglycemia; AI, acute insulin stimulus. **p-Values < 0.01 and ****p-values < 0.0001 between indicated groups; †p-values < 0.05 compared to basal condition without acute insulin stimulus. Lanes of protein ladder represent 35 and 250 kDa, respectively.
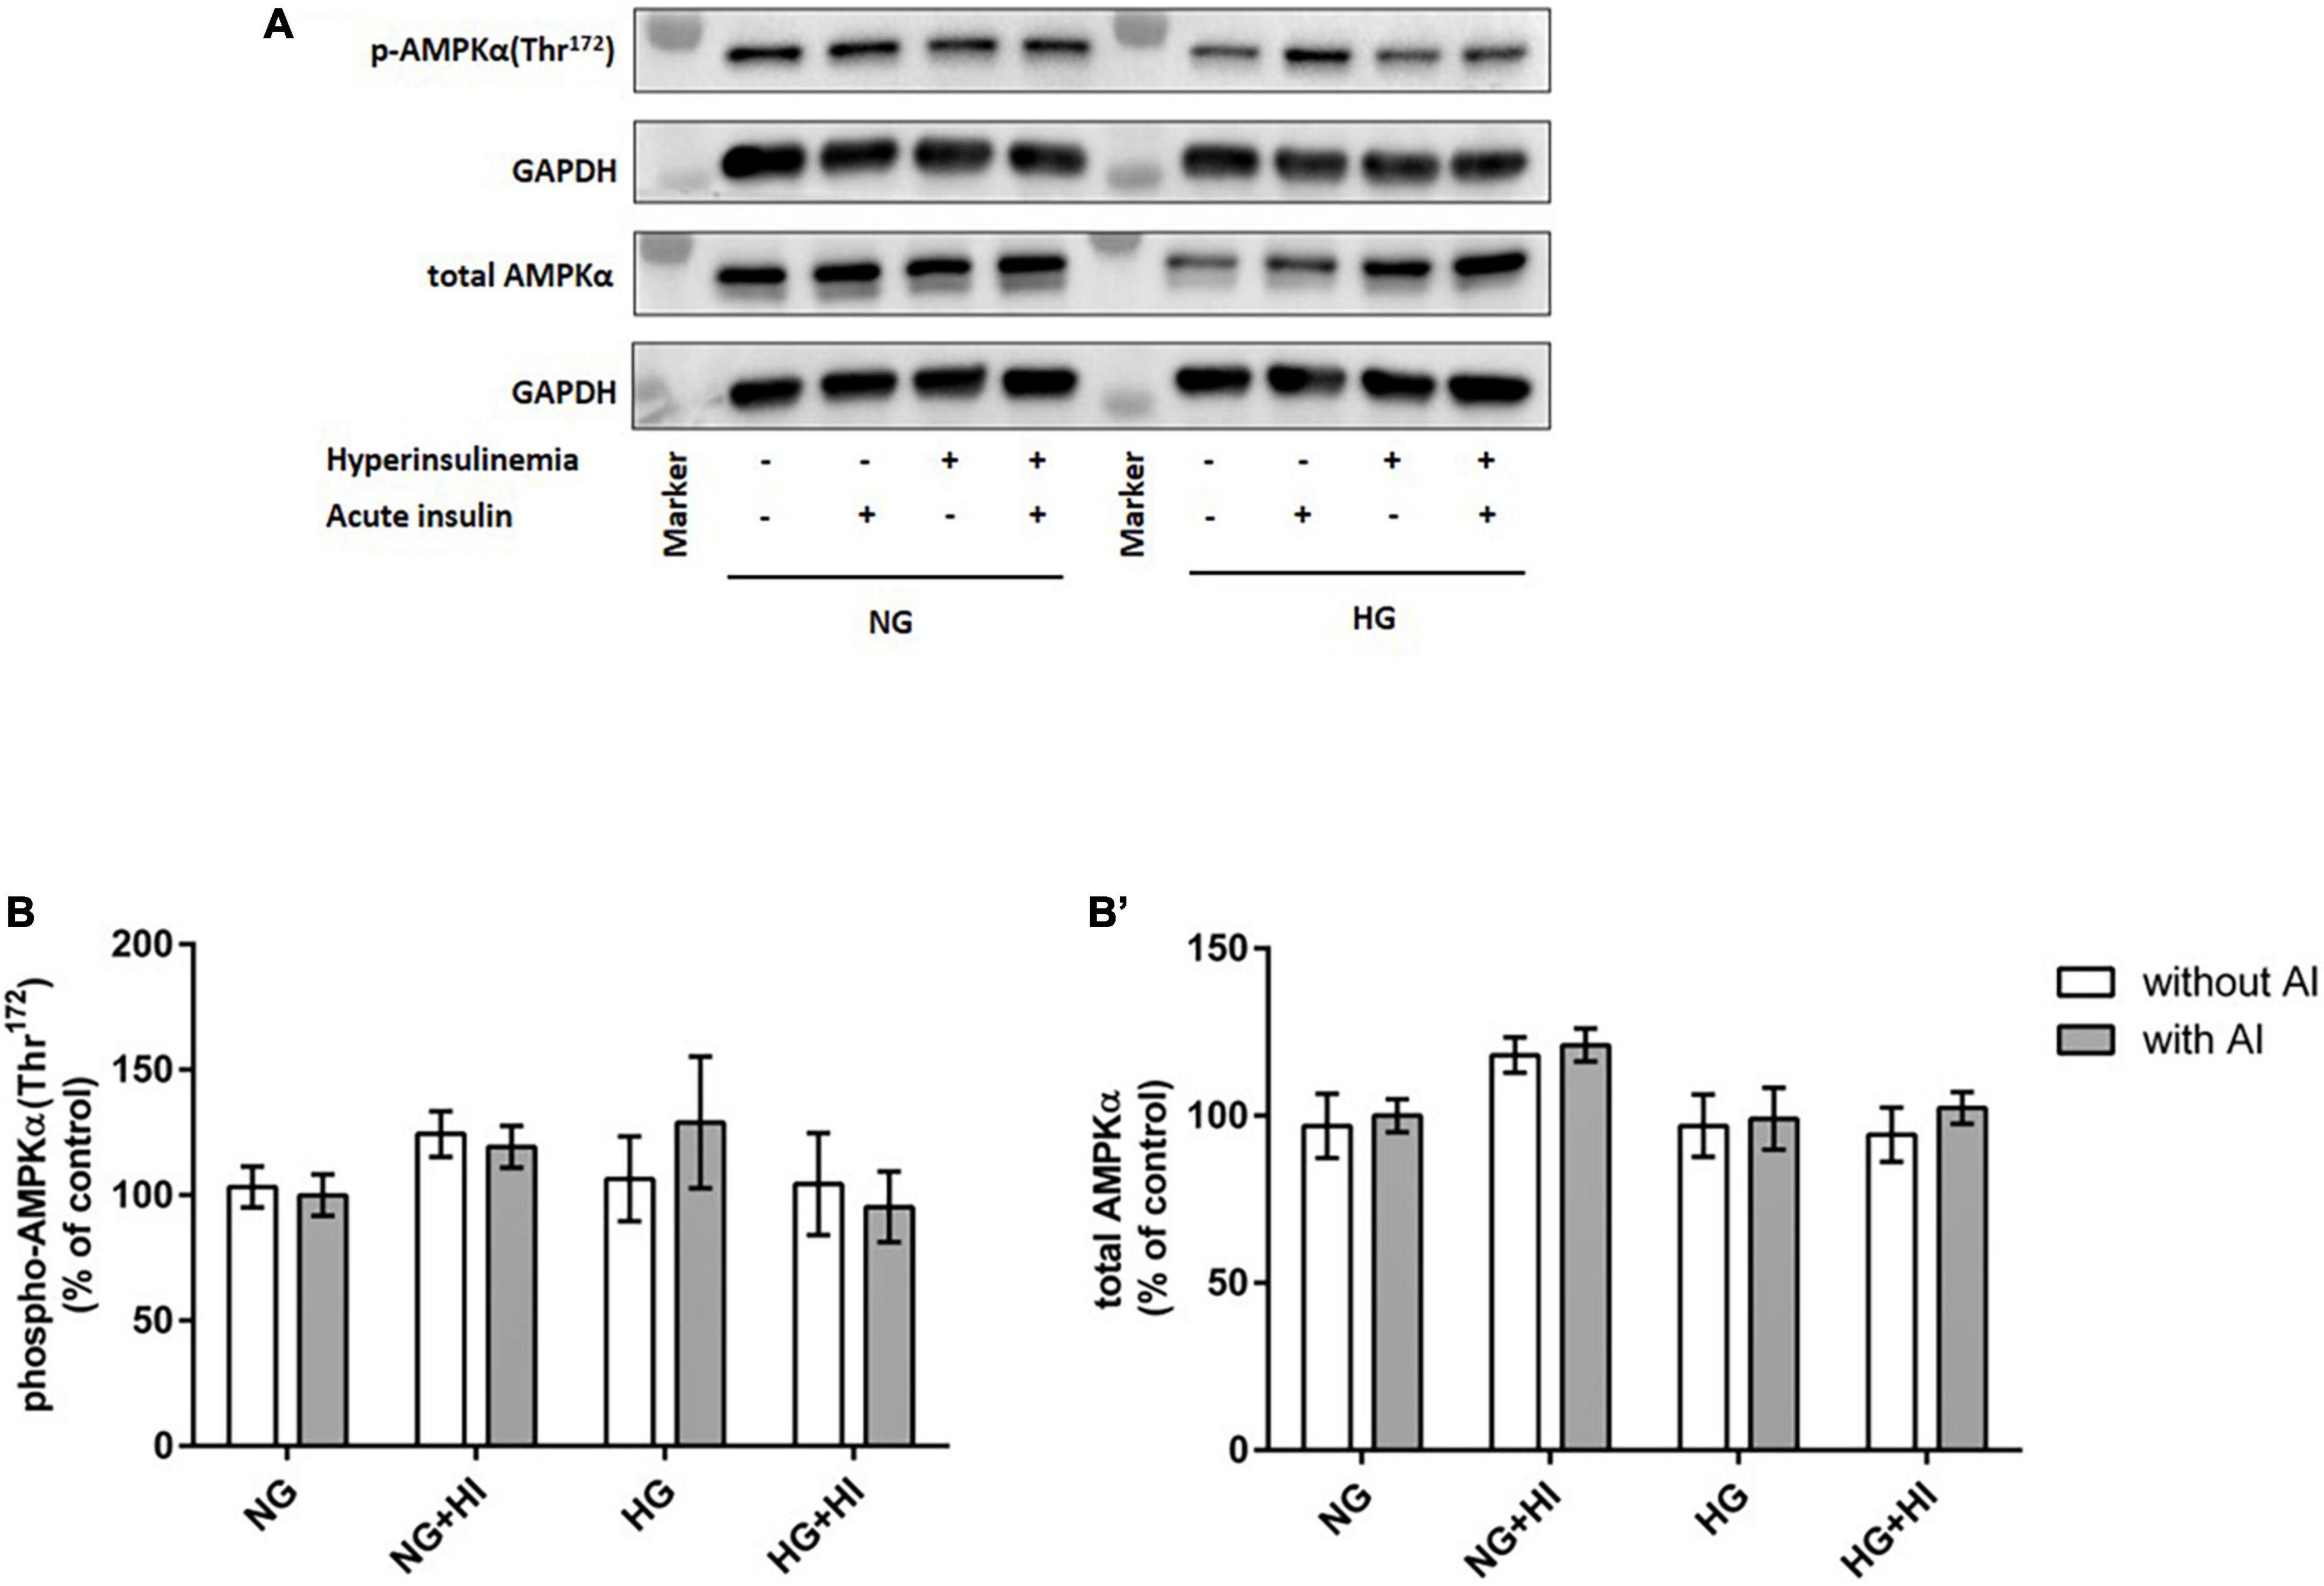
Figure 2. AMPK phosphorylation is not impaired by diabetic conditions. Phosphorylation of AMPK(Thr172) upon hyperinsulinemia under normoglycemia and hyperglycemia was measured in cultured ovine VIC (n = 7). Representative Western blot images show phosphorylated and total AMPKα expression (A). Quantification of protein signals showed that neither acute insulin stimulus nor hyperinsulinemia or hyperglycemia led to alterations in AMPK(Thr172) phosphorylation (B). Total amount of AMPK was not altered by the treatments (B′). Data was normalized to GAPDH and expressed relative to normoglycemic conditions with acute insulin stimulus. NG, normoglycemia; HI, hyperinsulinemia; HG, hyperglycemia; AI, acute insulin stimulus. Lanes of protein ladder represent 35 and 70 kDa, respectively.
Impact of diabetic conditions and mammalian target of rapamycin inhibition on mammalian target of rapamycin complex 1 and mammalian target of rapamycin complex 2 signaling
For rapamycin treatment, the optimal rapamycin concentration was evaluated, revealing that 10 nM rapamycin efficiently decreased basal phosphorylation of mTOR(Ser2448) (Supplementary Figure 1) whilst cell morphology was not affected (not shown). In order to evaluate mTOR signaling, downstream targets of MTORC1 and MTORC2 were investigated.
Mammalian target of rapamycin complex 1 signaling upon diabetic conditions and rapamycin treatment
Hyperinsulinemia under NG conditions led to a significantly higher 4E-BP1(Thr37/46) phosphorylation both under basal conditions (p = 0.0006) and upon acute insulin stimulus (p = 0.0006). Acute insulin stimulus led to a significant increase of 4E-BP1(Thr37/46) under NG (p = 0.007) as well as under HG (p = 0.038) conditions compared to the corresponding basal conditions, whereas HI treatment abrogated this effect. Rapamycin treatment led to attenuated inducible 4E-BP1(Thr37/46) phosphorylation by acute insulin (Figures 3A,B). Generally, upon acute insulin stimulus, rapamycin treatment led to a lower phosphorylation levels of 4E-BP1(Thr37/46) both under NG (p = 0.038) and NG + HI (p = 0.073) conditions as well as under HG (p = 0.018) and HG + HI (p = 0.014) conditions compared to the corresponding untreated group (Figures 3A,B). Basal phosphorylation as well as total 4E-BP1 abundance was not altered (Figure 3B’). Phosphorylation of P70S6K(Thr389) was not altered by rapamycin treatment (Figures 3C,D). Total P70S6K was not altered (Figure 3D’).
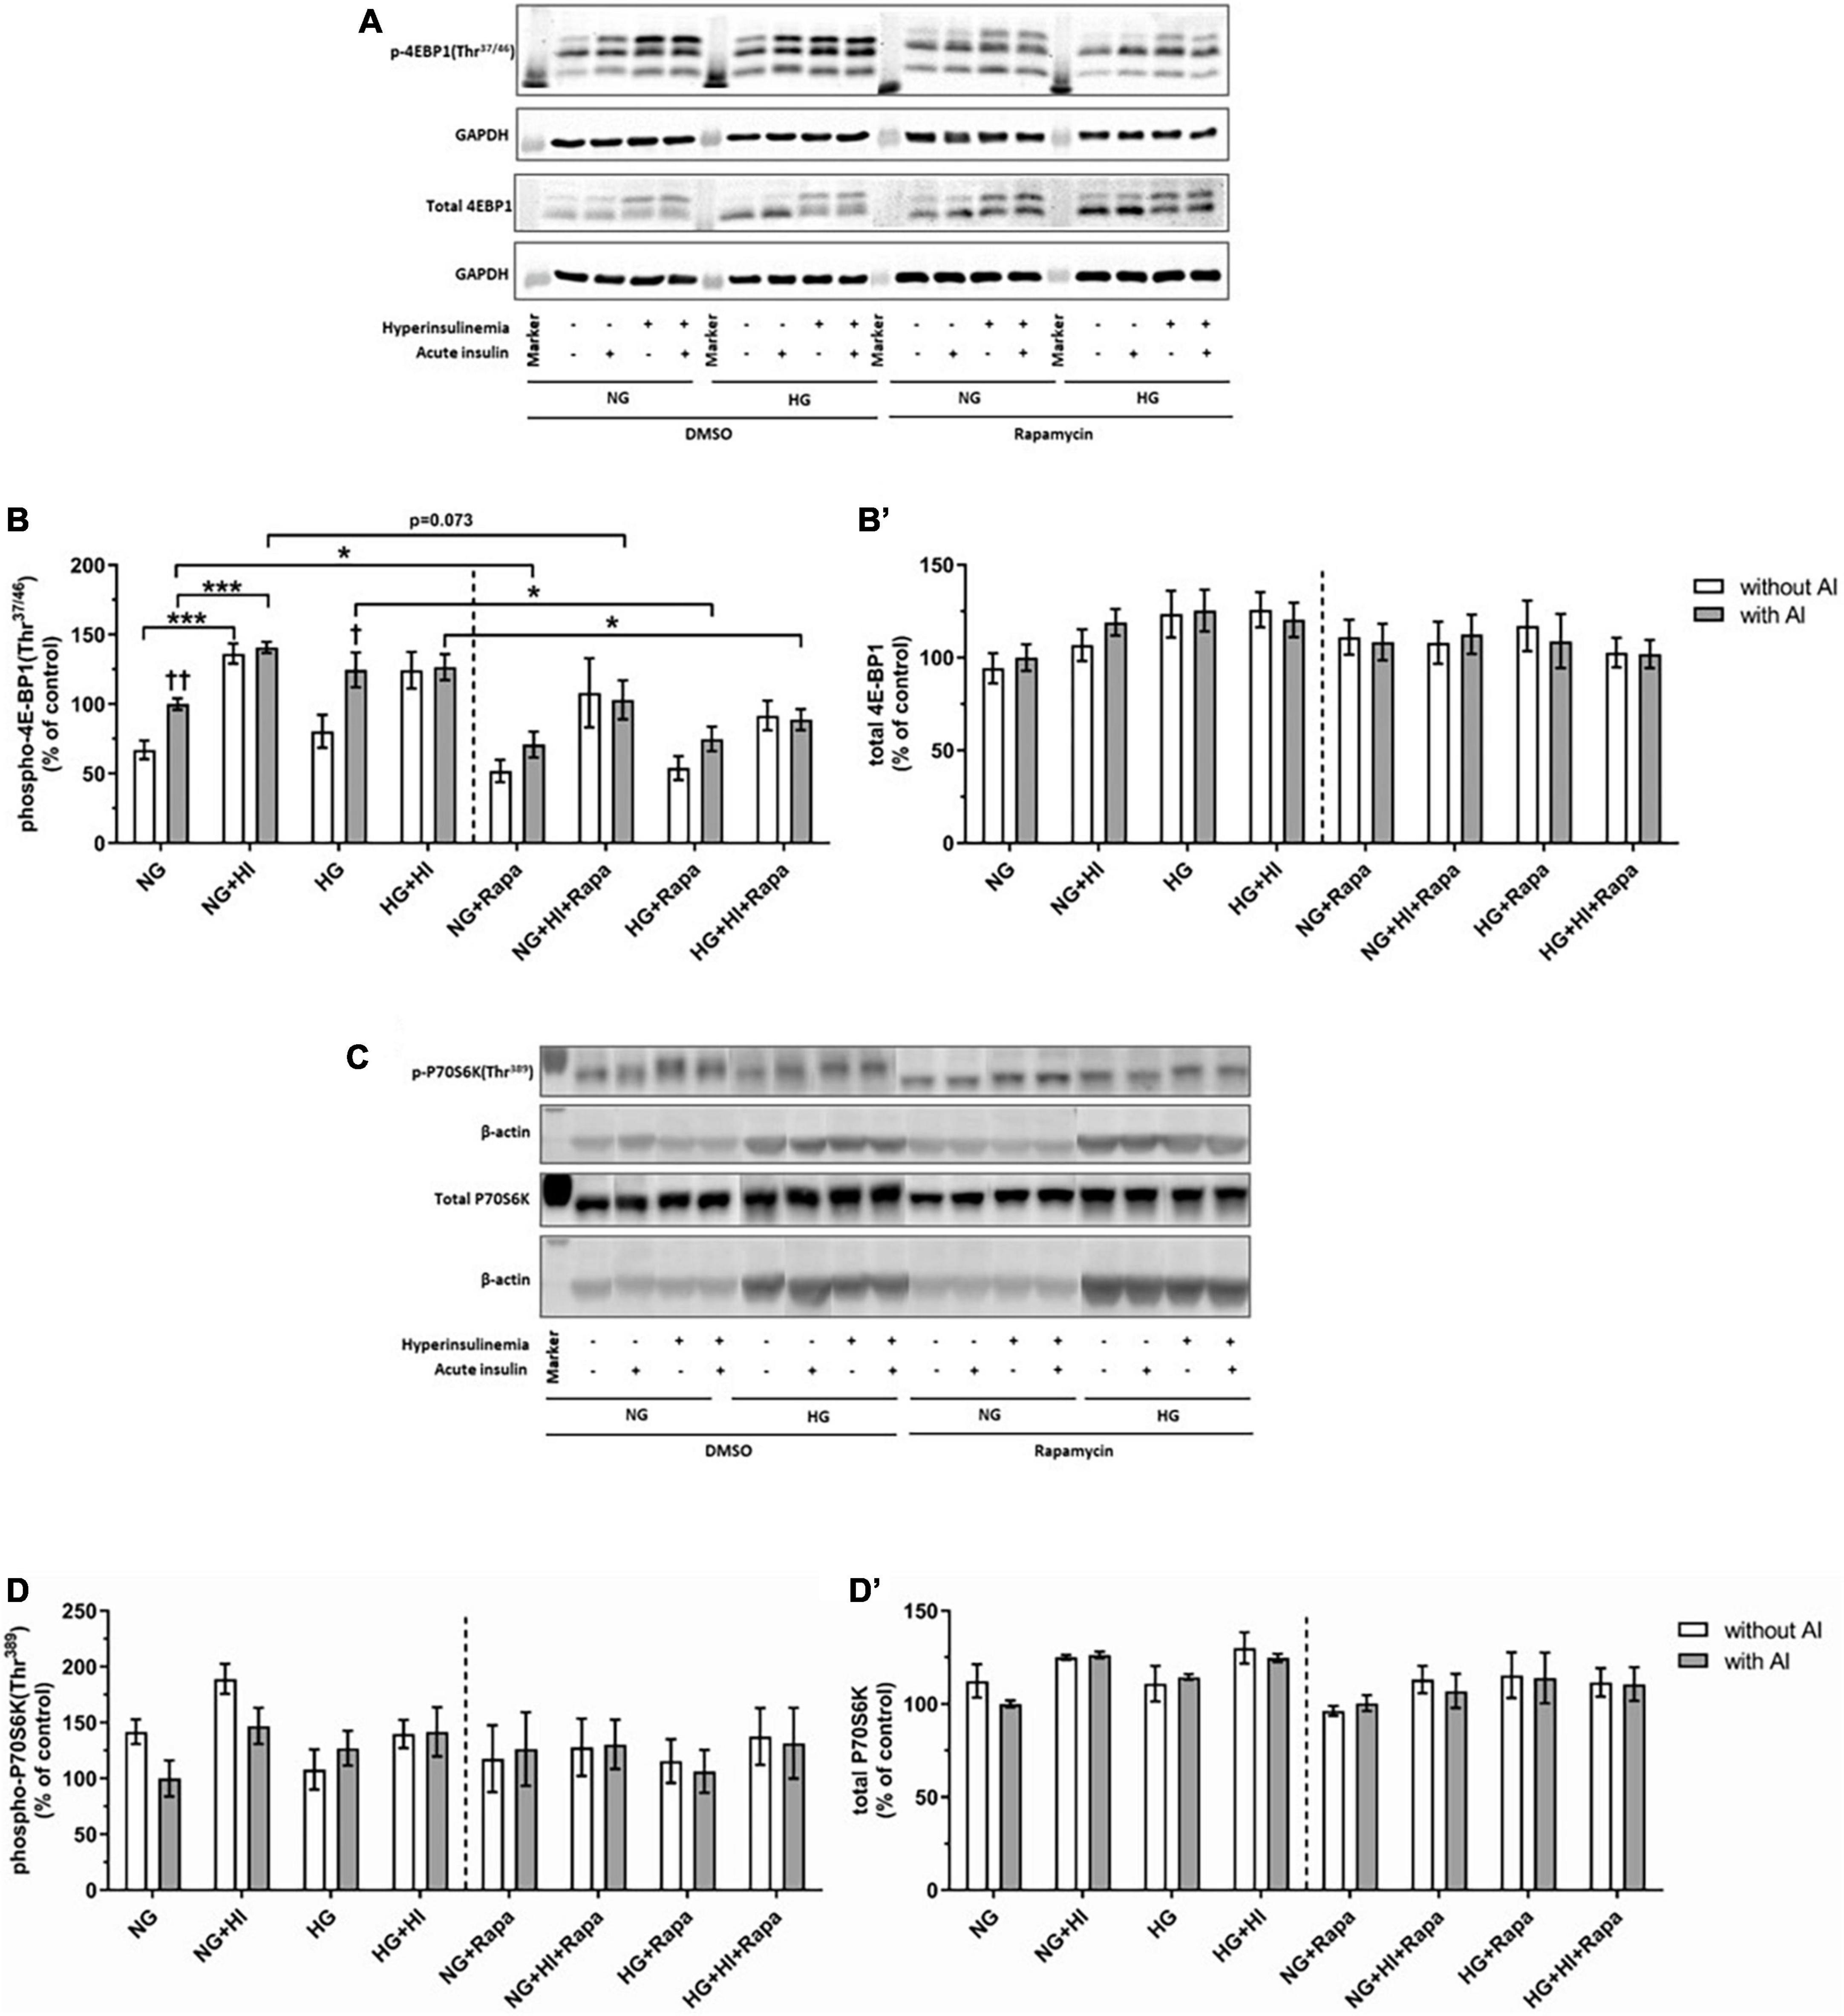
Figure 3. Mammalian target of rapamycin complex 1 signaling upon diabetic conditions and rapamycin treatment. Phosphorylation of 4E-BP1(Thr37/46) and P70S6K(Thr389) upon hyperinsulinemia under normoglycemia and hyperglycemia was measured in cultured ovine VIC (n = 6 for 4E-BP1 and n = 4 for P70S6K). Representative Western blot images show phosphorylated and total 4E-BP1 (A) and P70S6K expression (C). Quantification of 4E-BP1 protein signals showed that rapamycin treatment led to generally lower phosphorylation levels of 4E-BP1(Thr37/46) upon acute insulin stimulus. In absence of rapamycin, acute insulin stimulus led to significantly higher phosphorylation levels of 4E-BP1(Thr37/46) whilst hyperinsulinemia abolished the effect of inducible phosphorylation (B). Total amount of 4E-BP1 was not altered (B′). Quantification of P70S6K protein signals showed that neither acute insulin stimulus nor hyperinsulinemia or hyperglycemia led to alterations in P70S6K(Thr389) phosphorylation (D). Total amount of P70S6K was not altered by the treatments (D′). Data was normalized to GAPDH or β-actin, and expressed relative to normoglycemic conditions with acute insulin stimulus. NG, normoglycemia; HI, hyperinsulinemia; HG, hyperglycemia; AI, acute insulin stimulus; Rapa, rapamycin. *p-Values < 0.05 and ***p-values < 0.001 between indicated groups; †p-values < 0.05 and ††p-values < 0.01 compared to basal condition without acute insulin stimulus. Lanes of protein ladder represent 15 kDa (4E-BP blots) and 35 kDa (GAPDH blots) as well as 70 kDa (P70S6K blots) and 35 kDa (β-actin blots), respectively.
Mammalian target of rapamycin complex 2 signaling upon diabetic conditions and rapamycin treatment
Compared to the corresponding basal group, acute insulin stimulus led to a significantly increased phosphorylation of Akt(Ser473) under NG (p = 0.002) and HG (p = 0.002) treatment (Figures 4A,B). HI treatment abrogated inducible phosphorylation of Akt(Ser473) and led to a significantly reduced Akt(Ser473) phosphorylation under NG + HI (p = 0.0022) as well as under HG + HI treatment (p = 0.0026) upon acute insulin stimulus compared to NG and HG alone. A similar effect was observed upon rapamycin treatment; here, phosphorylation was increased under NG (p = 0.004) and HG (p = 0.002) treatment upon acute insulin stimulus compared to basal conditions and was abrogated by HI treatment. Generally, treatment with rapamycin led to a significantly increased phosphorylation level of Akt(Ser473) upon acute insulin stimulus under NG (p = 0.002), NG + HI (p = 0.004), HG (p = 0.002) and HG + HI (p = 0.002) conditions (Figures 4A,B) compared to the according untreated group.
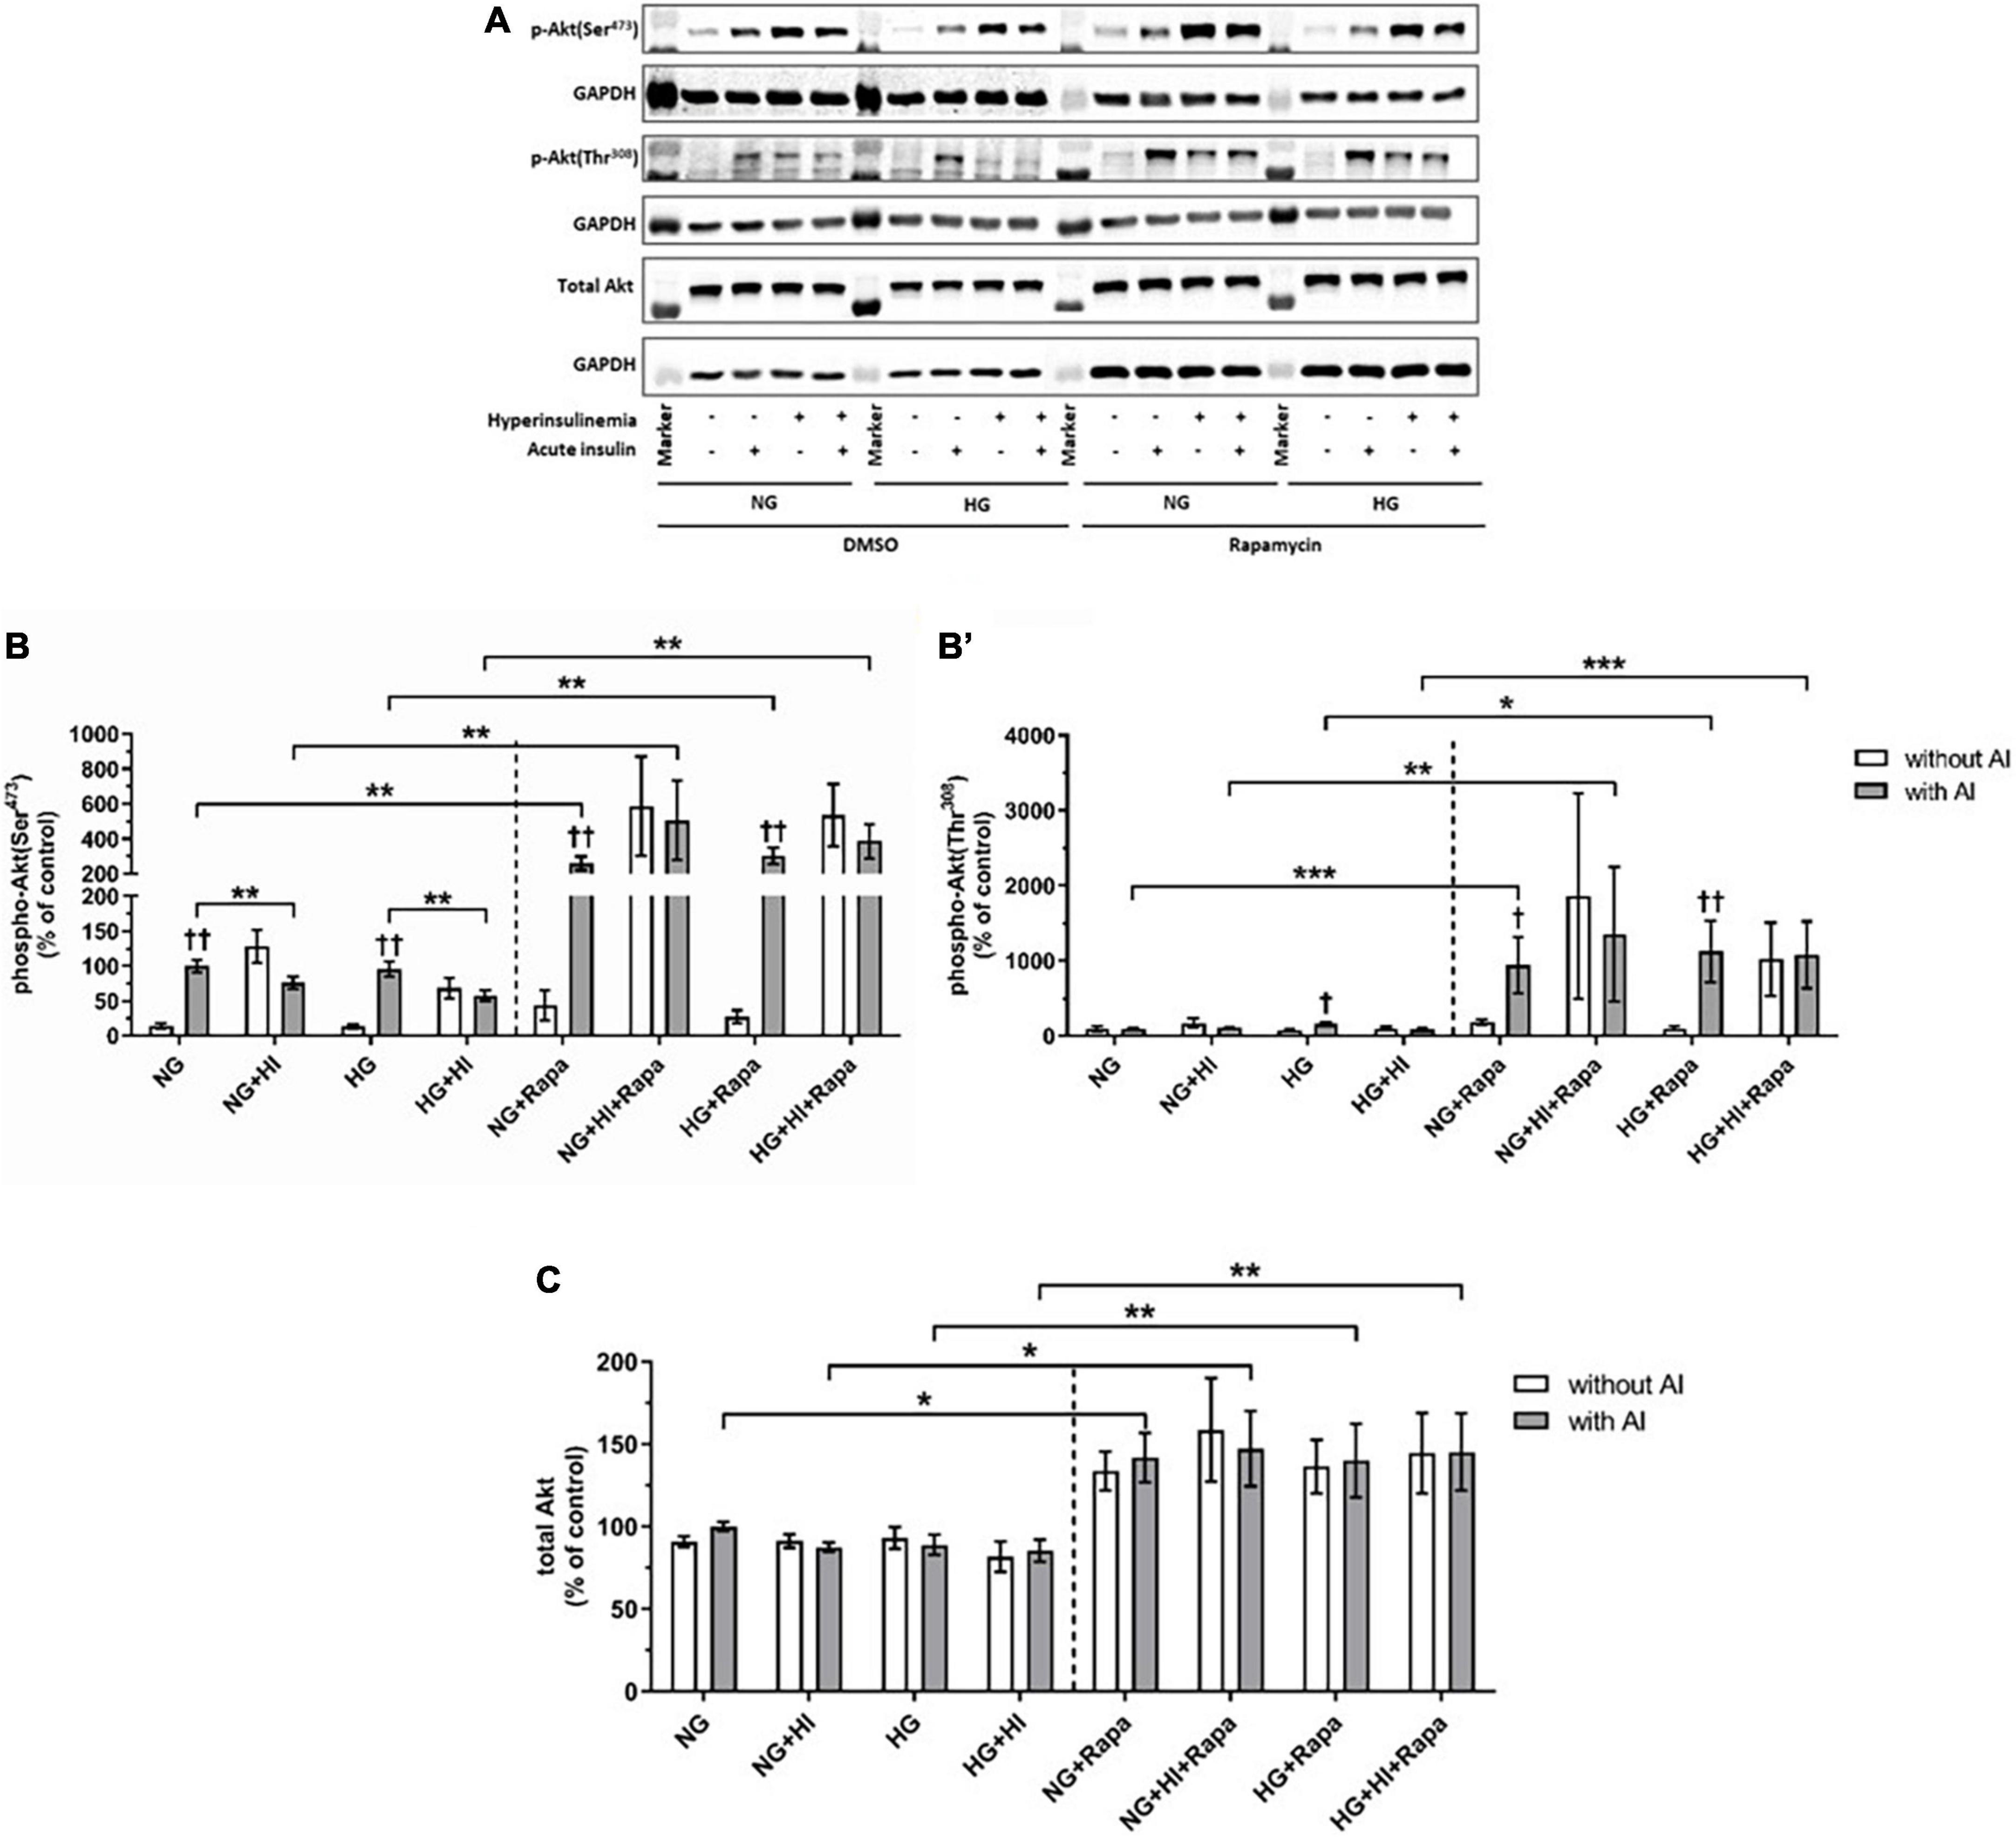
Figure 4. Mammalian target of rapamycin complex 2 signaling upon diabetic conditions and rapamycin treatment. Phosphorylation of Akt(Ser473) and Akt(Thr308) upon hyperinsulinemia under normoglycemia and hyperglycemia was measured in cultured ovine VIC (n = 6). Representative Western blot images show phosphorylated and total Akt expression (A). Quantification of Akt protein signals showed that rapamycin treatment led to a generally higher Akt(Ser473) (B) and Akt(Thr308) (B′) phosphorylation upon acute insulin stimulus. Acute insulin stimulus led to significantly higher phosphorylation levels of Akt(Ser473) whilst hyperinsulinemia abolished the effect of inducible phosphorylation under control conditions as well as upon rapamycin treatment (B). Akt(Thr308) phosphorylation was significantly upregulated by acute insulin stimulus under HG conditions (B′). Upon rapamycin treatment, hyperinsulinemia abolished inducible phosphorylation Akt(Thr308) by acute insulin stimulus (B′). Total amount of Akt showed a generally higher expression level upon rapamycin treatment, whereas neither acute insulin stimulus nor hyperinsulinemia or hyperglycemia led to alterations of Akt expression (C). Data was normalized to GAPDH and expressed relative to normoglycemic conditions with acute insulin stimulus. NG, normoglycemia; HI, hyperinsulinemia; HG, hyperglycemia; AI, acute insulin stimulus; Rapa, rapamycin. *p-Values < 0.05, **p-values < 0.01, and ***p-values < 0.001 between indicated groups; †p-values < 0.05 and ††p-values < 0.01 compared to basal condition without acute insulin stimulus. Lanes of protein ladder represent 70 and 55 kDa (Akt blots) and 35 kDa (GAPDH blots), respectively.
Detection of Akt(Thr308) phosphorylation proved to be difficult due to generally low expression levels and unspecific binding (Figure 4B’). Acute insulin stimulus led to an increased phosphorylation under HG conditions in the untreated group (p = 0.011), whereas phosphorylation was not inducible under NG (p = 0.620), NG + HI (p = 0.805) and HG + HI (p = 0.710) conditions. Under rapamycin treatment, acute insulin stimulus led to an increased Akt(Thr308) phosphorylation compared to the according basal condition under NG (p = 0.018) as well as under HG (p = 0.007) conditions. HI treatment abrogated this effect (Figure 4B’). Similar to phosphorylation of Akt(Ser473), rapamycin treatment led to generally higher expression levels of phosphorylated Akt(Thr308) upon acute insulin stimulus compared to the according untreated groups (NG: p = 0.0006; NG + HI: p = 0.005; HG: p = 0.018; HG + HI: p = 0.0006). Total Akt abundance was not influenced by acute insulin stimulus compared to basal conditions. However, rapamycin led to generally higher Akt expression levels compared to the untreated groups (Figure 4C).
Valvular interstitial cells differentiation and matrix remodeling under diabetic conditions and mammalian target of rapamycin inhibition
Next, we analyzed the impact of diabetic conditions as well as the impact of rapamycin as an inhibitor of mTOR signaling on VIC differentiation and matrix remodeling. For rapamycin treatment, the optimal rapamycin concentration was evaluated, revealing that 10 nM rapamycin efficiently decreased basal phosphorylation of mTOR(Ser2448) (Supplementary Figure 1) whilst cell morphology was not affected (not shown).
Valvular interstitial cells activation and viability
Upon stress or tissue damage, VIC change their quiescent fibroblastoidal phenotype toward an activated myofibroblastoidal phenotype with higher contractility, which is indicated by an increased expression of ACTA2 (19–21). The term “VIC activation” used in this work thus refers to this phenomenon, and does not necessarily involve concomitant enhanced matrix remodeling as commonly described for pathological changes in CAVD (recently reviewed in (22).
Hyperinsulinemia treatment led to a significant downregulation of ACTA2 gene expression in VIC under NG (p = 0.016) as well as under HG conditions (p = 0.047) compared to NG control conditions. HG treatment alone had no effect (p = 0.469). Inhibition of mTOR signaling by rapamycin treatment led to a significant upregulation of ACTA2 gene expression under NG (p = 0.016) as well as under HG conditions (p = 0.031) compared to NG control conditions. HI treatment seemed to mitigate these effects. Comparison between rapamycin and HI treatment revealed opposed effects with highly significant difference (p = 0.0005; Figure 5A). LDH activity as a marker for cytotoxicity was not significantly altered by diabetic conditions, nor by rapamycin treatment under NG conditions. Rapamycin treatment in combination with HG treatment, however, led to a significantly higher LDH activity both without HI (p = 0.047) and with HI (p = 0.047) when compared to NG conditions (Figure 5B).
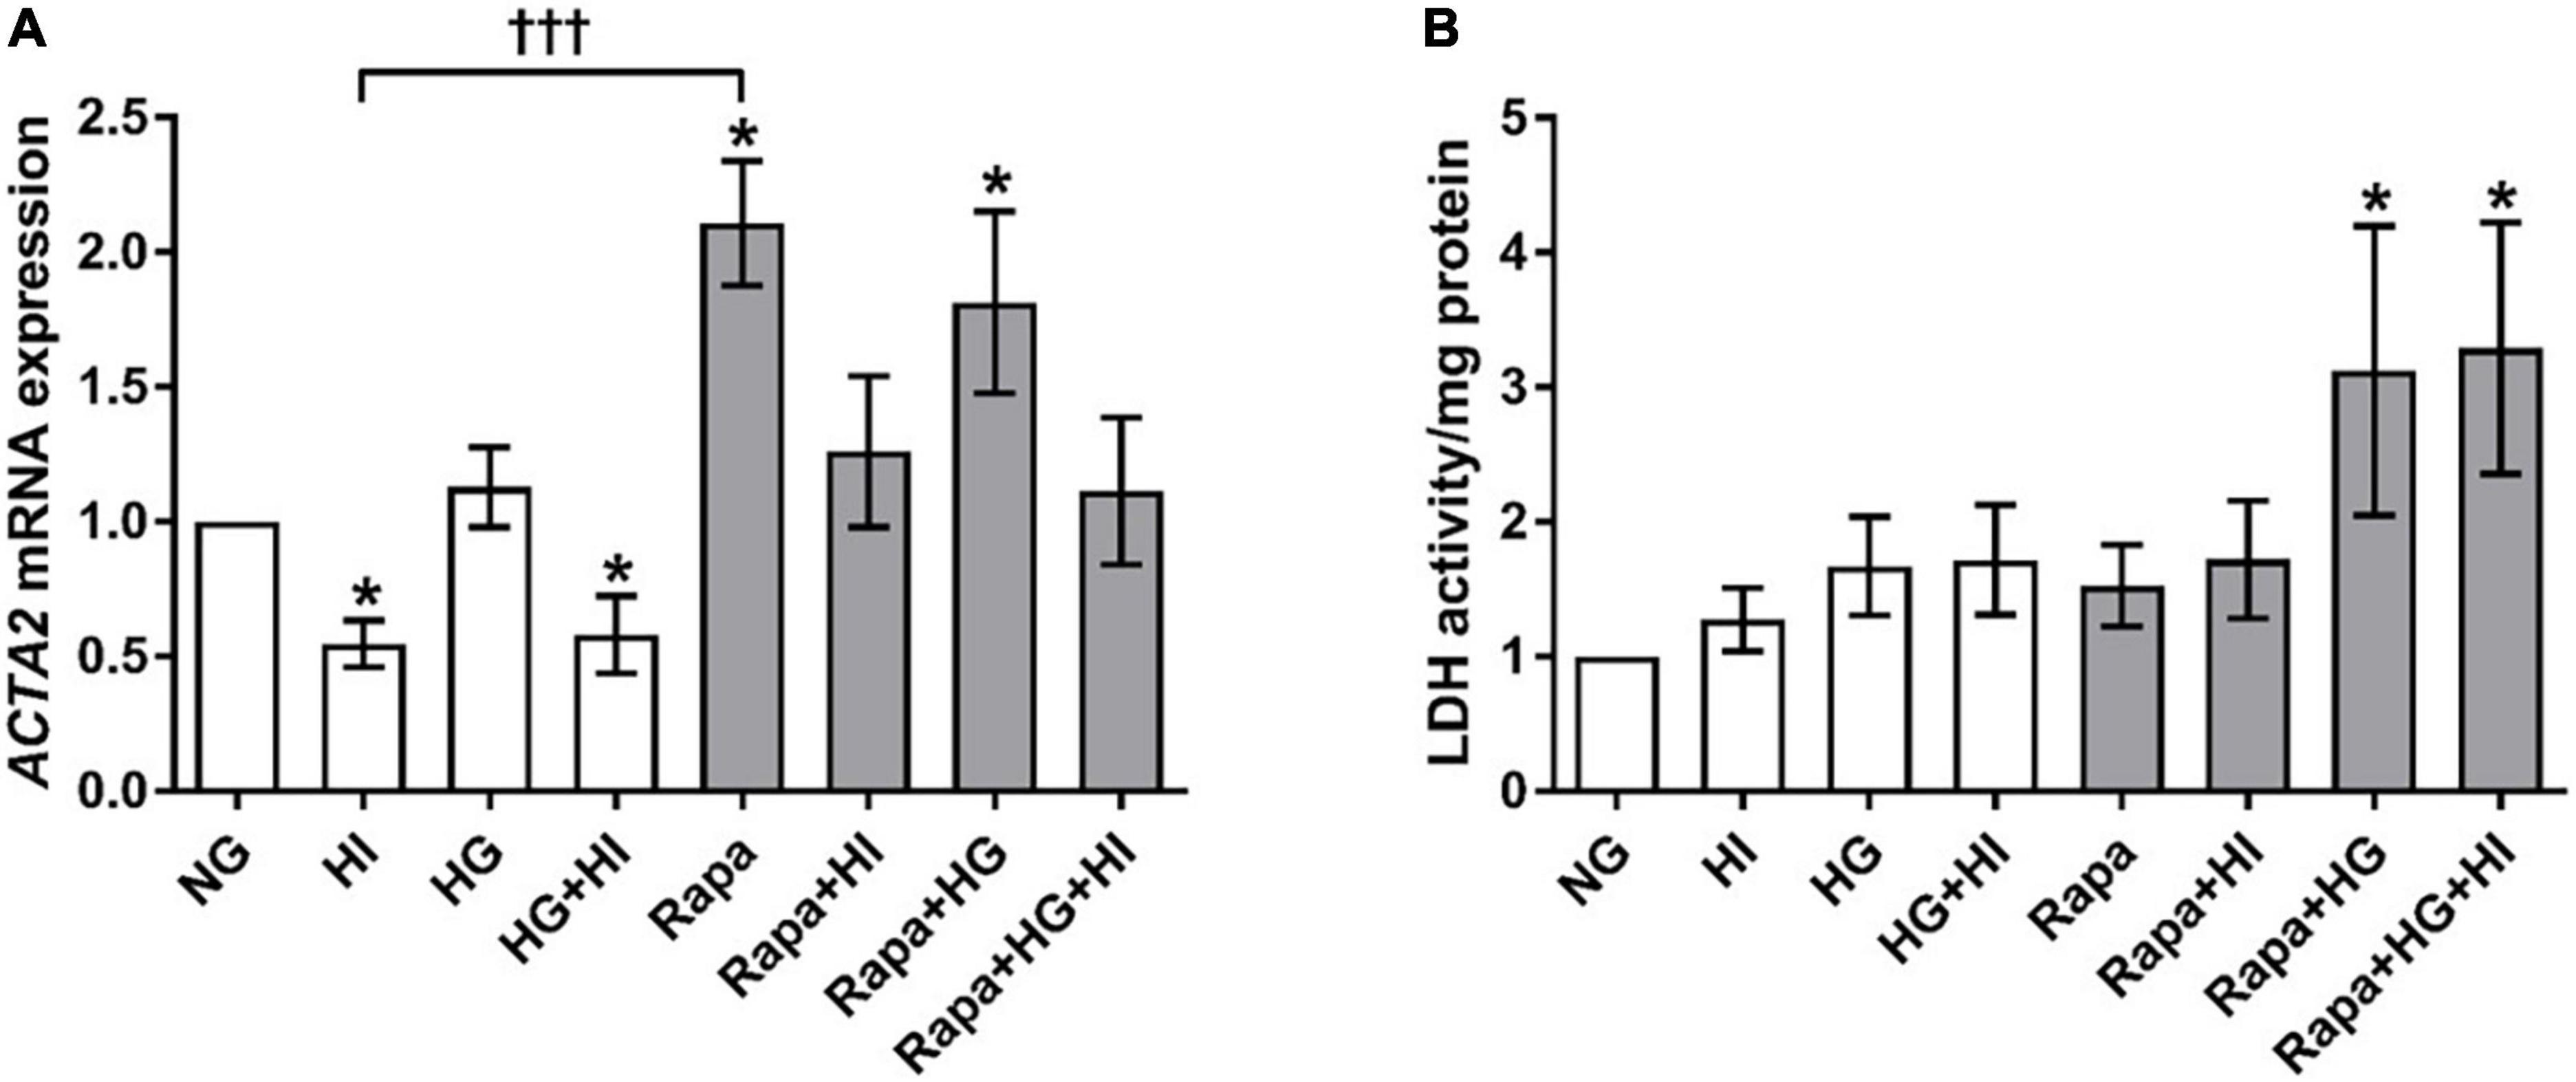
Figure 5. Valvular interstitial cells activation and viability under diabetic conditions and mTOR inhibition. Impact of diabetic conditions and mTOR inhibition on gene expression of ACTA2 (A) and on LDH activity (B) was analyzed. HI led to a decrease of ACTA2 gene expression, whereas rapamycin led to a remarkable and statistically highly significant opposite effect. ACTA2, α-smooth muscle actin; LDH, lactate dehydrogenase; HI, hyperinsulinemia; HG, hyperglycemia; Rapa, rapamycin. *p-Values < 0.05 of direct comparison to normoglycemic control; †††p-value < 0.001 of intergroup comparisons.
Structural extracellular matrix molecules and matrix metalloproteinases
COL1A1 gene expression was not significantly altered by diabetic conditions. Rapamycin treatment in contrast, led to significantly decreased COL1A1 gene expression compared to NG control conditions independent of diabetic conditions (p = 0.016; Figure 6A). Comparison between rapamycin and HI treatment revealed significantly lower COL1A1 gene expression under rapamycin treatment (p = 0.033). Gene expression of ELN was significantly downregulated by HG + HI treatment with similar effect upon rapamycin treatment alone (p = 0.016) as well as in combination with HI (p = 0.031) when compared to NG control conditions (Figure 6B). Combined treatment of rapamycin with HG or HG + HI conditions led to a slight trend toward lower ELN gene expression in comparison to NG control conditions (p = 0.078). MMP2 gene expression was significantly upregulated under HI conditions (p = 0.016) and by a slight trend under HG + HI conditions (p = 0.078; Figure 6C). Comparison between HI and rapamycin treatment revealed a visible difference, however not statistically different (p = 0.323), whereas comparison between HI and HI + rapamycin showed a significant opposed effect (p = 0.018). MMP9 gene expression levels were not detectable (not shown).
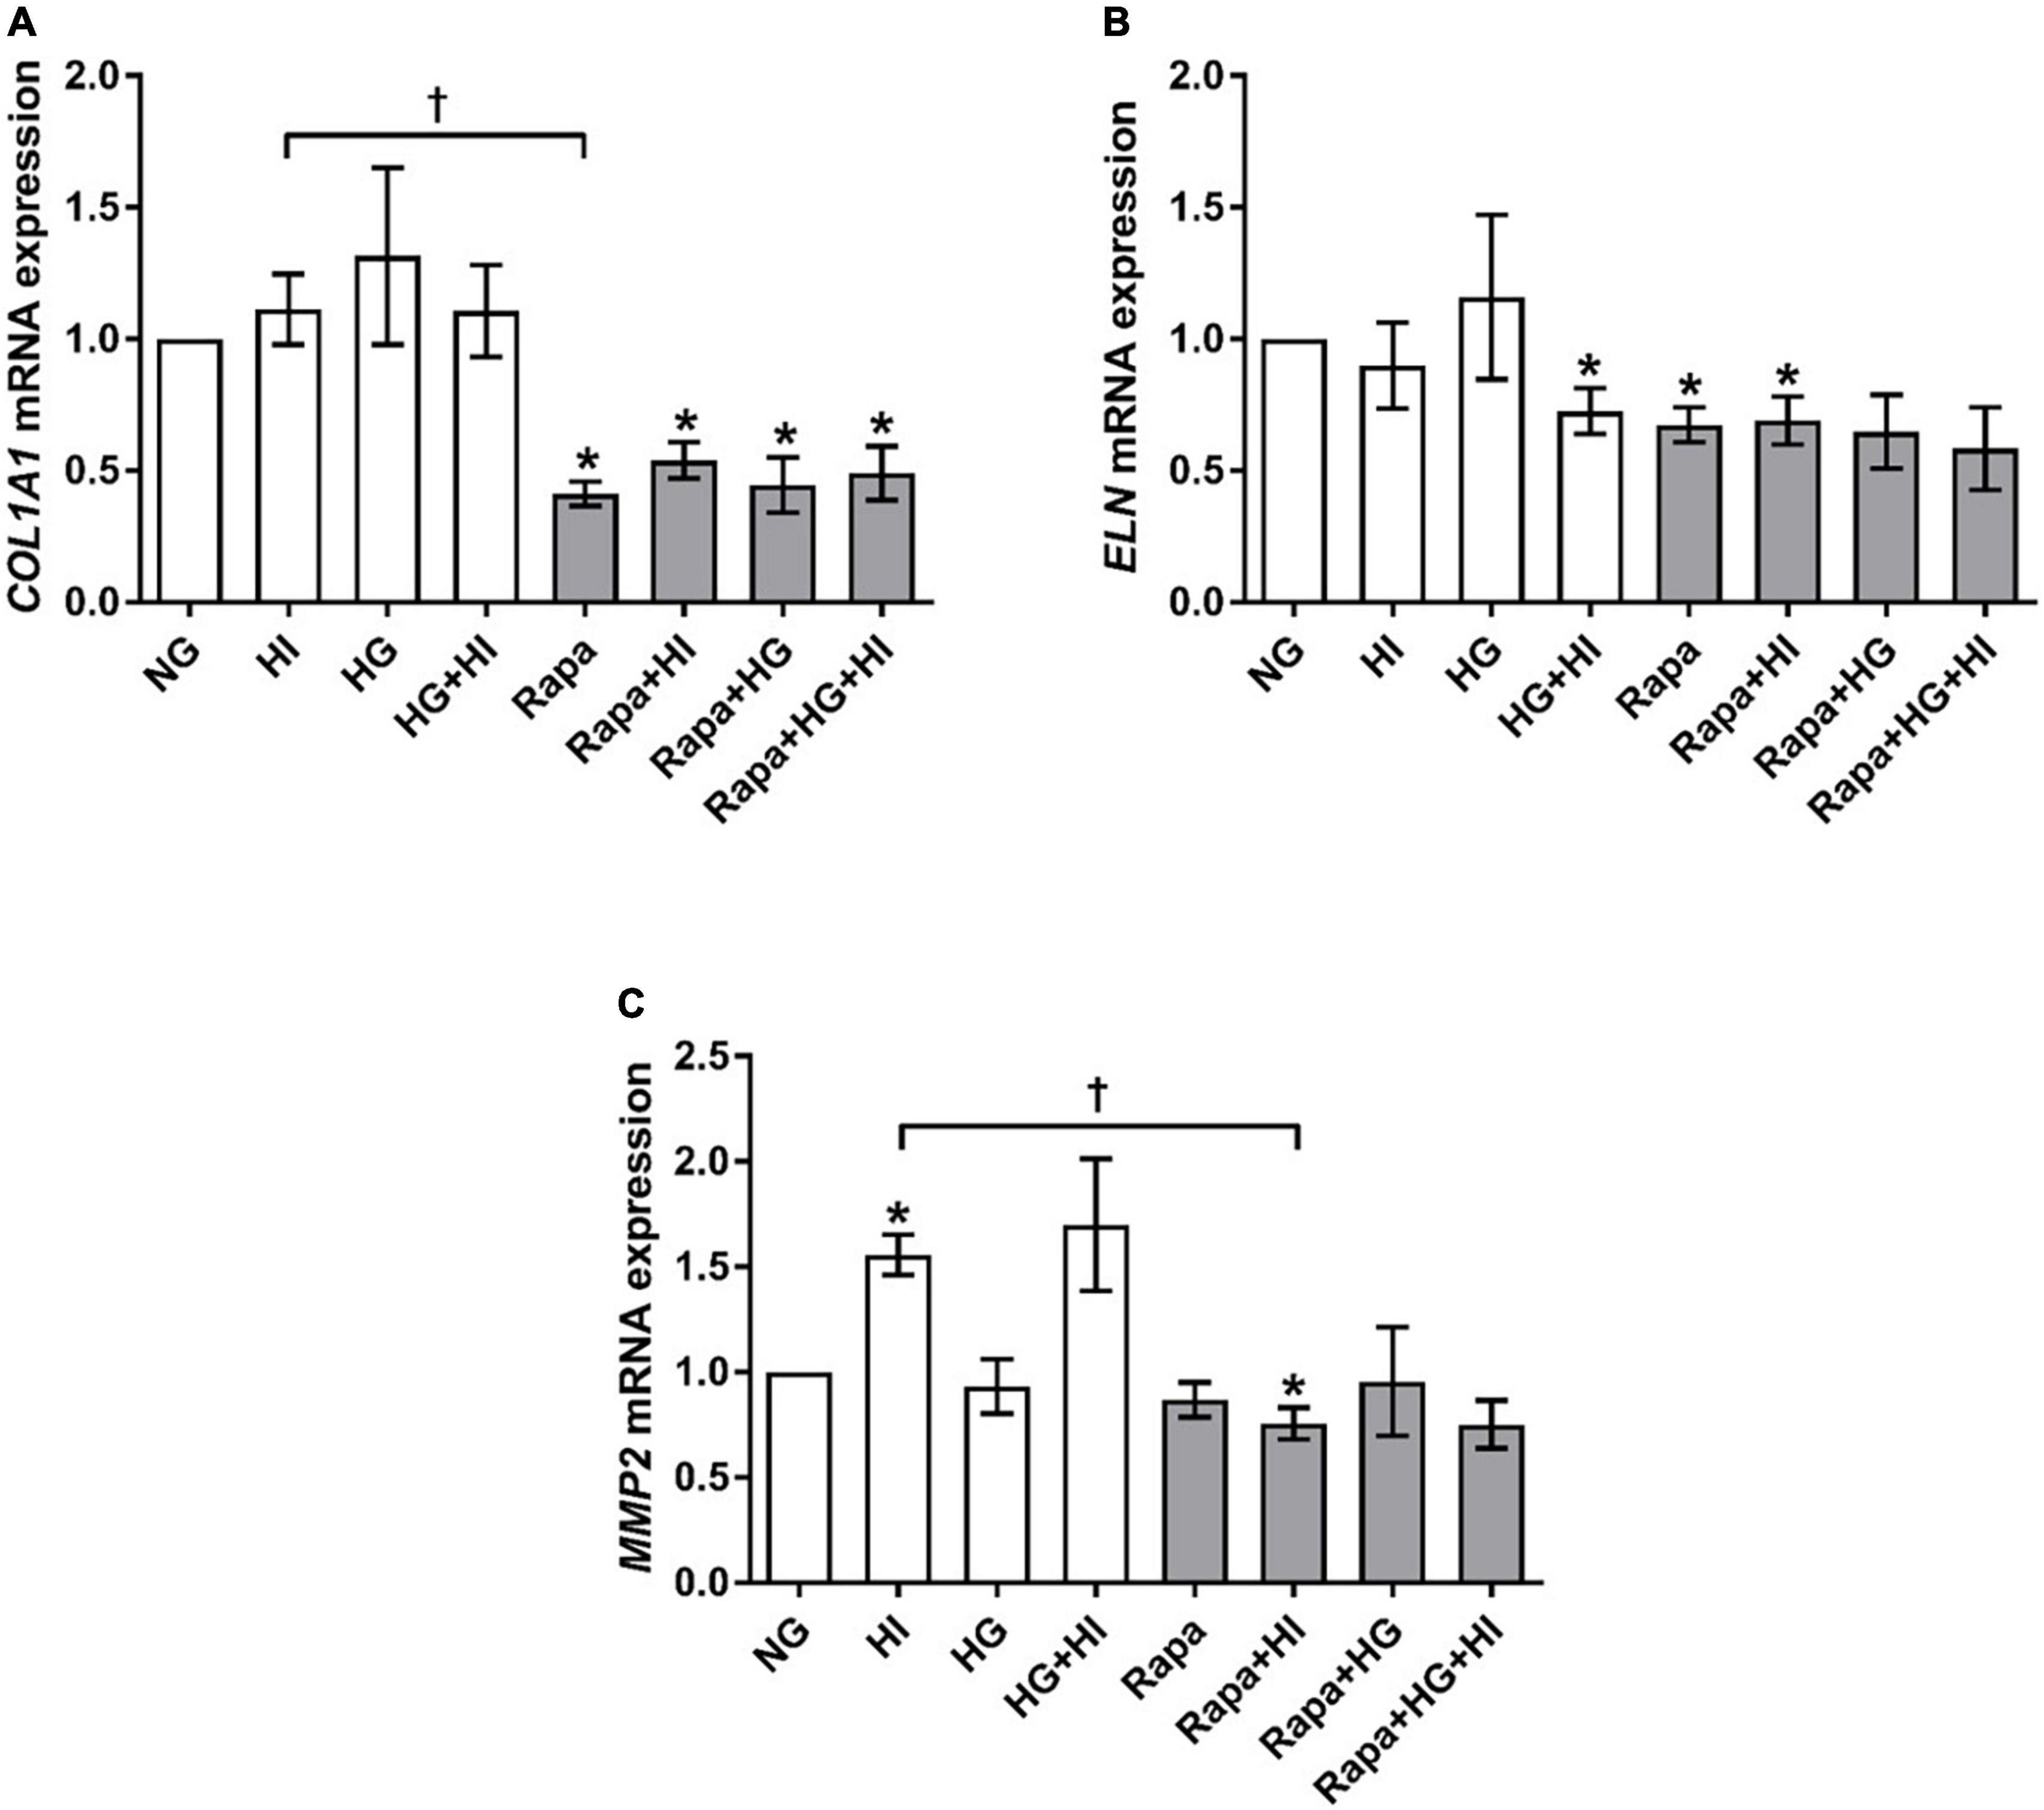
Figure 6. Expression of structural extracellular matrix molecules and matrix metalloproteinase under diabetic conditions and mTOR inhibition. Impact of diabetic conditions and mTOR inhibition on gene expression of COL1A1 (A), ELN (B), and MMP2 (C) was analyzed. Diabetic conditions had no significant impact on COL1A1 gene expression, whereas rapamycin treatment led to a reduction of COL1A1 gene expression (A). ELN gene expression was reduced by HG + HI as well as by rapamycin treatment compared to NG conditions (B). MMP2 gene expression was induced by HI. Rapamycin + HI led to decreased MMP2 gene expression. COL1A1, collagen type 1; MMP2, matrix metalloproteinase 2; ELN, elastin; HI, hyperinsulinemia; HG, hyperglycemia; Rapa, rapamycin. *p-Values < 0.05 of direct comparison to normoglycemic control; †p-values < 0.05 of intergroup comparisons.
Glycosylated matrix molecules
Analysis of glycosylated matrix molecules revealed a significant upregulation of BGN gene expression upon HI treatment (p = 0.031) as well as upon HG + HI treatment (p = 0.016; Figure 7A). Rapamycin treatment led to a numerically small effect but significantly lower BGN gene expression when compared to NG control conditions (p = 0.031). Comparison between HI and rapamycin treatment showed significantly different gene expression of BGN (p = 0.010). Interestingly, when the subset of rapamycin-containing treatments is considered, rapamycin entirely abolished the effects of diabetic conditions on the expression of BGN as observed within the subset of conditions without rapamycin. DCN gene expression was in general upregulated by diabetic conditions when compared to NG control conditions (p = 0.016; Figure 7B). Rapamycin treatment in combination with HI or HG conditions led to numerically small but significantly lower DCN gene expression when compared to NG control conditions (p = 0.016). Comparison between HI and rapamycin treatment showed significantly different gene expression of DCN (p = 0.008). Similar to the observations on BGN gene expression, rapamycin led to a general abrogation of the elevating effect of diabetic conditions on DCN gene expression. HAS2 gene expression was significantly upregulated by diabetic conditions either by HI (p = 0.003), HG (p = 0.019) or combined treatment with HI + HG (p = 0.037; Figure 7C). Rapamycin treatment in contrast, did not alter HAS2 gene expression, whereas additional stimulation with HI led to significantly higher HAS2 gene expression when compared to NG control conditions (p = 0.016). Comparison between HI and rapamycin treatment showed significantly different HAS2 gene expression levels (p = 0.0004), with an overall inhibition of the stimulatory impact of diabetic conditions on HAS2 gene expression.
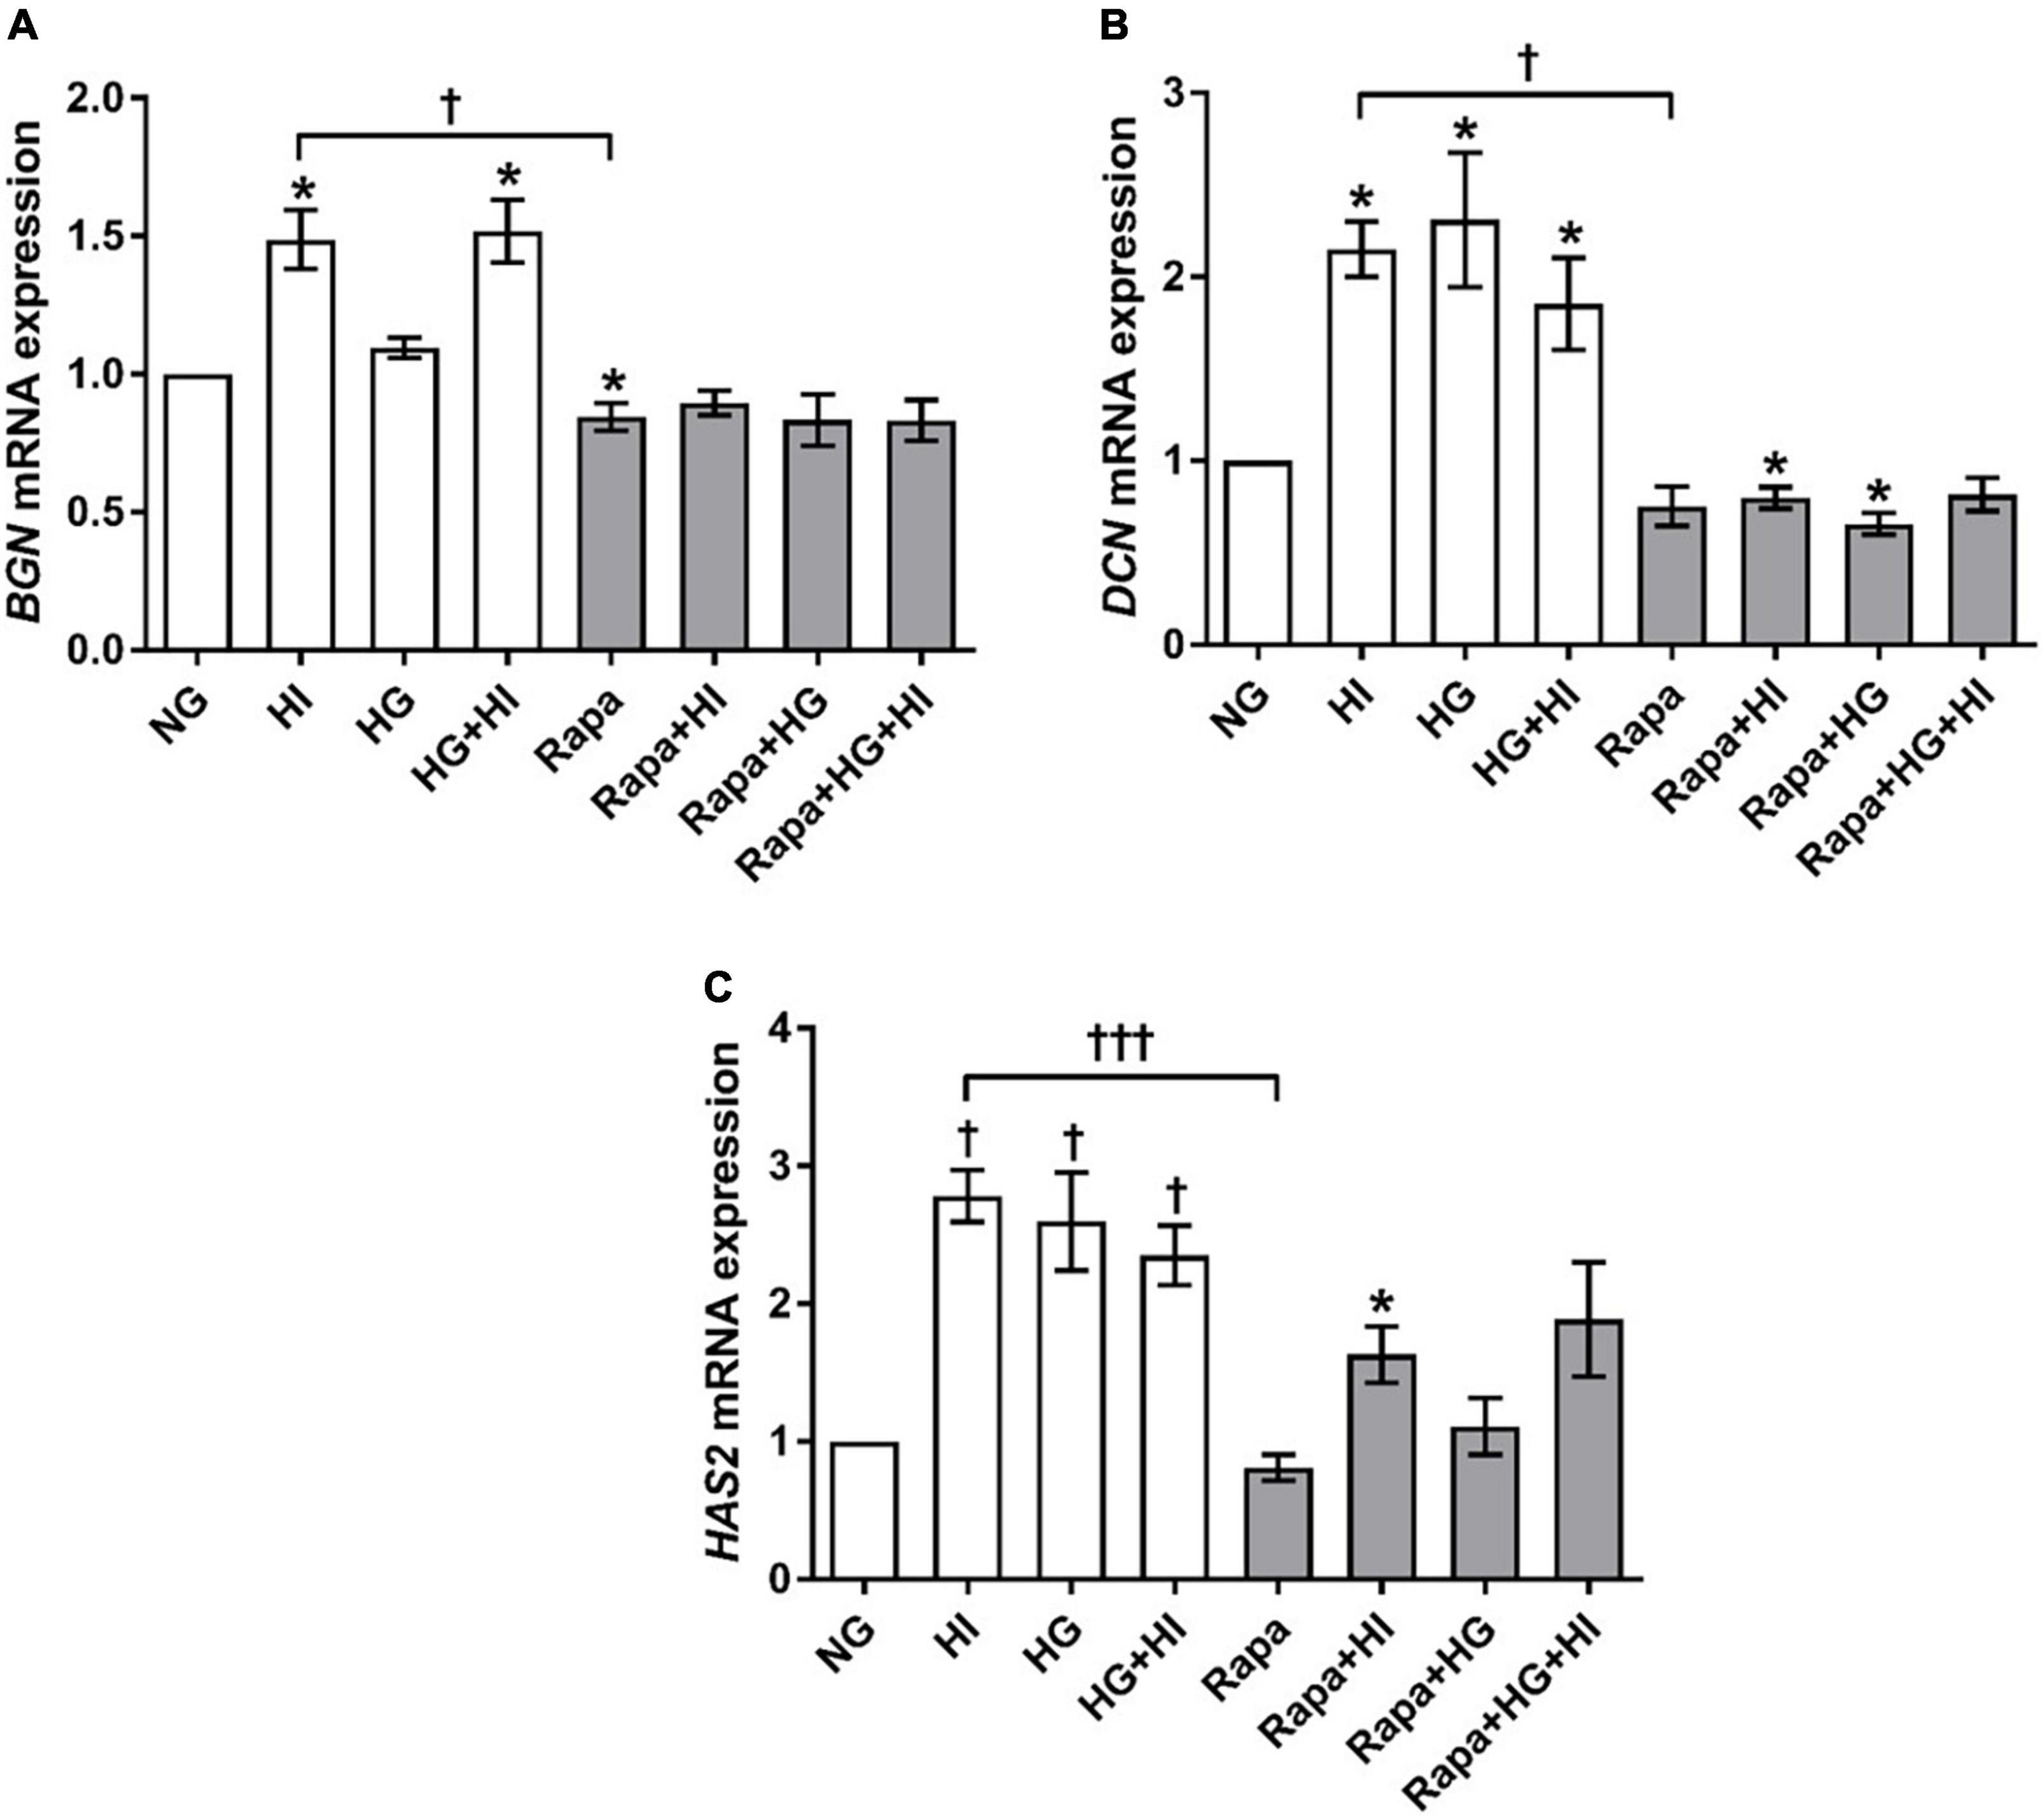
Figure 7. Expression of glycosylated matrix molecules under diabetic conditions and mTOR inhibition. Impact of diabetic conditions and mTOR inhibition on BGN (A), DCN (B), and HAS2 (C) gene expression was analyzed. BGN gene expression is upregulated by HI but downregulated by rapamycin treatment (A). DCN gene expression was upregulated by diabetic conditions, whereas rapamycin treatment did not alter DCN gene expression (B). HAS2 gene expression was upregulated by diabetic condition. Rapamycin treatment alone did not alter HAS2 gene expression, whereas combination with HI led to increased expression levels (C). BGN, biglycan; DCN, decorin; HAS2, hyaluronic acid synthase 2; HI, hyperinsulinemia; HG, hyperglycemia; Rapa, rapamycin. *p-Values < 0.05 of direct comparison to normoglycemic control; †p-values < 0.05 of intergroup comparisons in relation to NG treatment; †††p-values < 0.001 of intergroup comparisons.
Valvular interstitial cells chondro-osteogenic differentiation
OPN gene expression was significantly upregulated by HG treatment (p = 0.023). Rapamycin treatment did not alter OPN gene expression. However, OPN gene expression levels upon HI or HI + HG treatment were comparable to those under rapamycin treatment (Figure 8A). HI and HG + HI treatment led to significantly decreased ALP activity when compared to NG control conditions (p = 0.031; Figure 8B). Rapamycin treatment, however, led to a generally higher ALP activity when compared to NG control conditions (p = 0.031) except for the combination with HG + HI which led to a trend toward higher ALP activity (p = 0.063). Comparison between HI and rapamycin treatment revealed significantly opposed effects on ALP activity (p = 0.027). Collectively, rapamycin abrogated the inducing effect of HG on OPN gene expression and had a strong enhancing effect on ALP activity that contrasts the effects observed under HI.
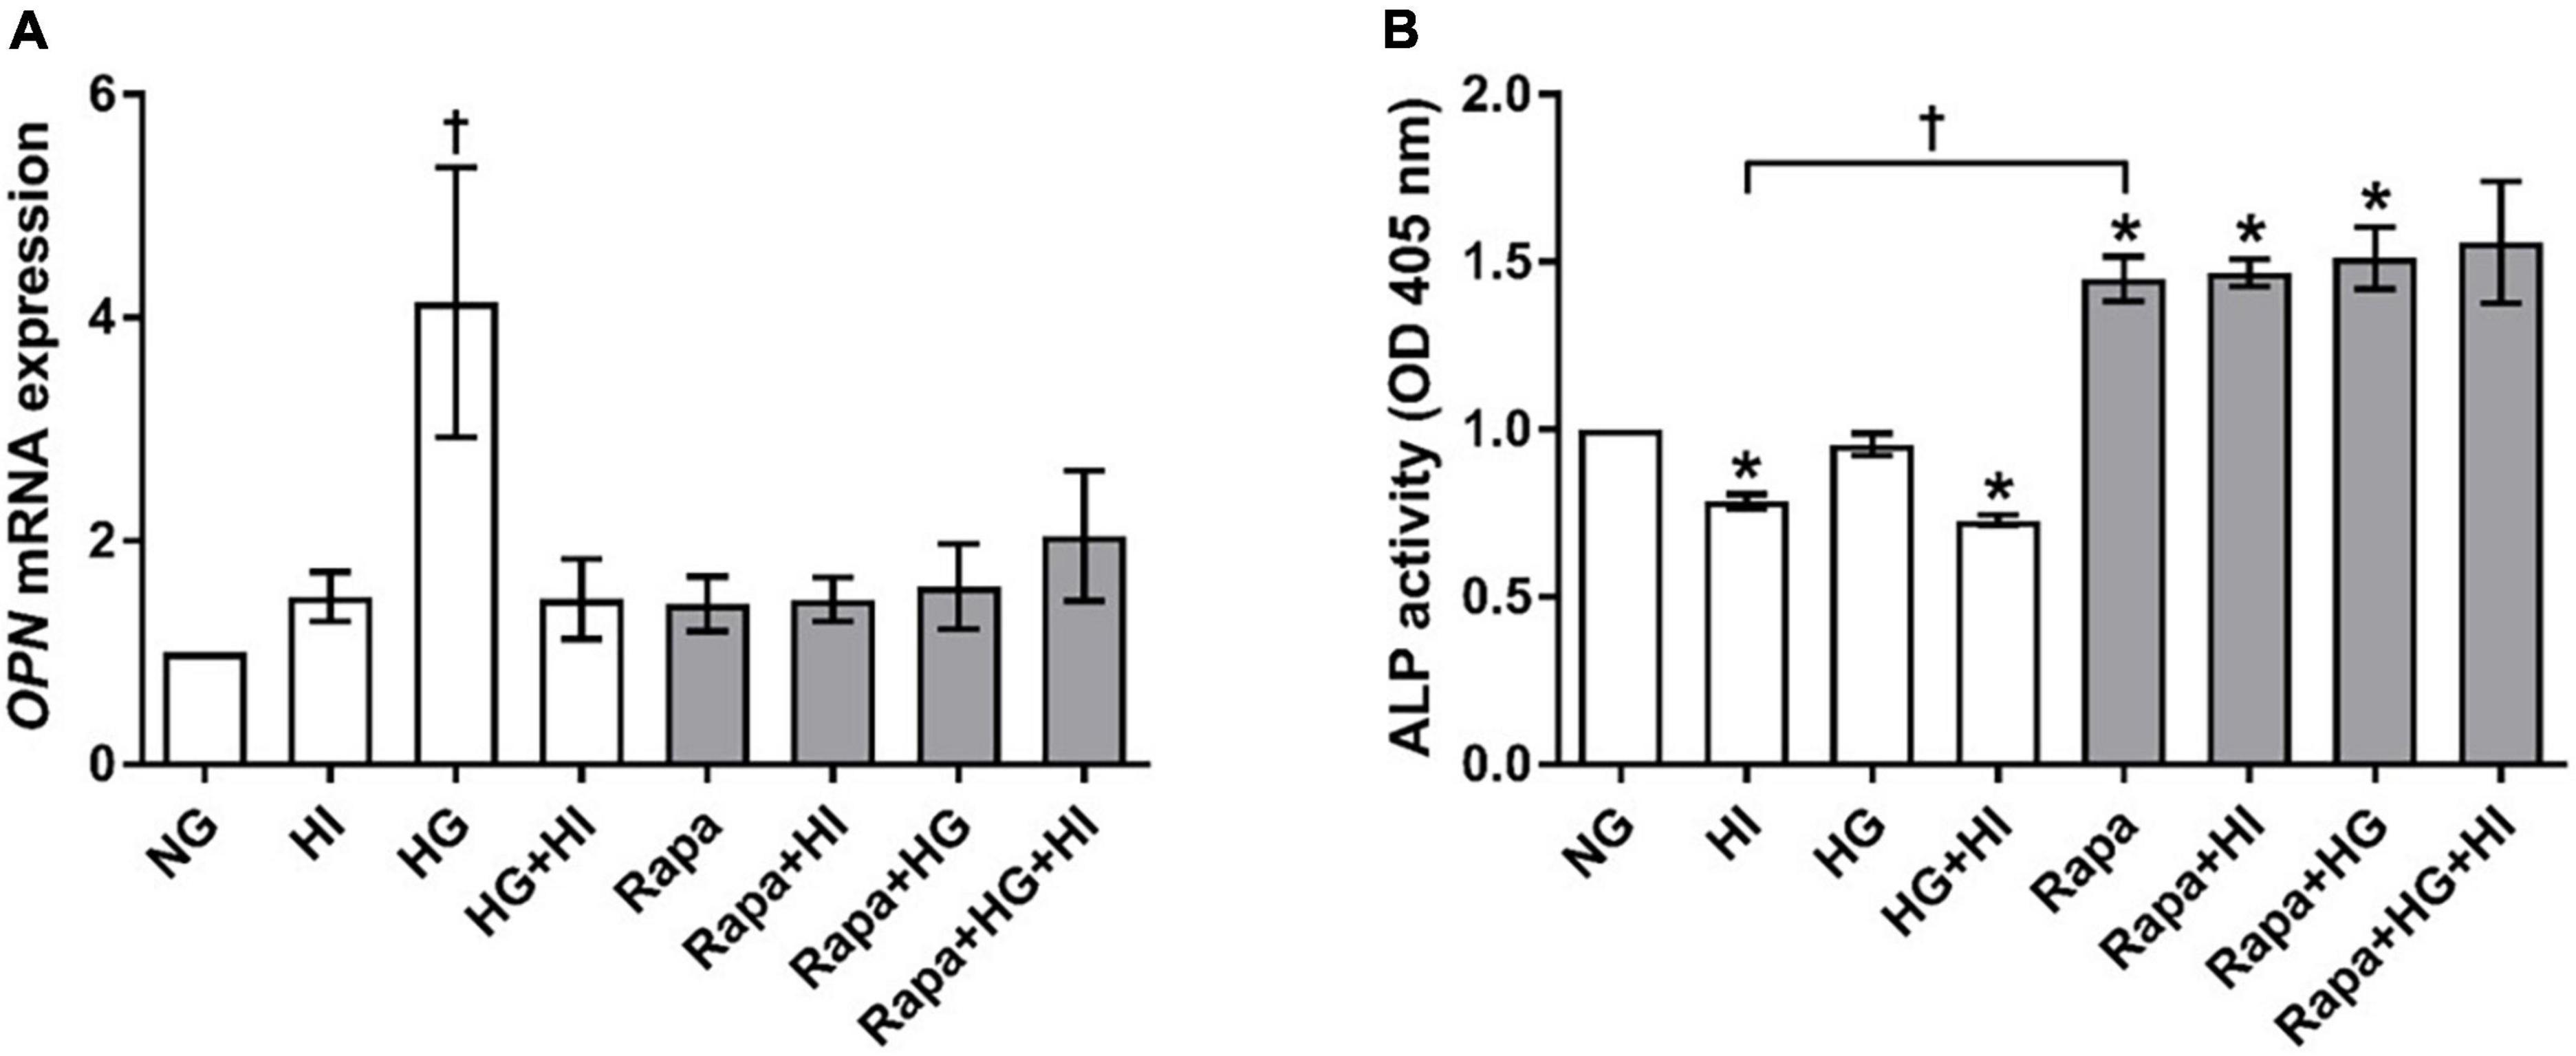
Figure 8. Expression of degeneration markers under diabetic conditions and mTOR inhibition. Impact of diabetic conditions and mTOR inhibition on OPN gene expression (A) and ALP activity (B) was analyzed. HG treatment led to a significant upregulation of OPN gene expression, whereas HI as well as rapamycin treatment kept OPN gene expression low (A). ALP activity was reduced by HI treatment, whereas rapamycin treatment led to increased ALP activity. OPN, osteopontin; ALP, alkaline phosphatase; HI, hyperinsulinemia; HG, hyperglycemia; Rapa, rapamycin. *p-Values < 0.05 of direct comparison to normoglycemic control; †p-values < 0.05 of intergroup comparisons as indicated or in relation to NG treatment.
Discussion
The present work shows that chronic insulin treatment leads to decreased mTOR signaling by abrogating mTOR phosphorylation in VIC. Chronic insulin exposure as well as HG conditions in turn lead to VIC activation, chondro-osteogenic differentiation, and matrix remodeling. Inhibition of mTOR signaling by rapamycin altered the impact of diabetic conditions with respect to various components of the extracellular matrix as well as of markers of activation and chondro-osteogenic differentiation. Remarkably, the effect of mTOR inhibition in front of effects observed for diabetic conditions was not uniform: Rapamycin treatment resulted in a modulation of VIC regulation, partly resembling an amplification of HI or HG induced effects whilst also reflecting a marked inhibitory impact on other factors. These results suggest that mTOR is involved in intracellular transmission of diabetic stimulus on VIC but is not the only signaling pathway by which diabetic conditions regulate aortic valve morphology.
Mammalian target of rapamycin complex 1 and mammalian target of rapamycin complex 2 signaling under diabetic conditions
Hyperinsulinemia led to a decreased susceptibility of 4E-BP1(Thr37/46) for phosphorylation upon acute insulin stimulus. This might be indicative for an impaired MTORC1 downstream signaling in VIC upon chronic diabetic conditions, as it has been described before for HUVECS and smooth muscle cells in vitro. Here, impaired phosphorylation of 4E-BP1 has been observed even after 5 min of HI (23). However, skeletal muscle of diabetics did not show alterations in 4E-BP1 phosphorylation (24). In contrast to reports on renal epithelial cells showing increased 4E-BP1 phosphorylation under HG treatment (25), this was not the case for VIC under HG treatment. Response to diabetic conditions thus seems to differ between different cell types and tissues and the presented results suggest that VIC share an alternating subset of features with several other cell types. Similar to 4E-BP1(Thr37/46), a decrease of P70S6K(Thr389) phosphorylation has been described in vitro in HUVECS and smooth muscle cells after a short-time incubation with HI (23). Reports focused on cancer cells showed an increase in phosphorylation levels of P70S6K after 15 min of HI followed by an adaptation to long-term exposure to HI (26). In the present work, phosphorylation levels of P70S6K(Thr389) did not show significant changes under diabetic conditions in VIC which might be related to specific differences in short-term vs. long-term HI treatments. Time course experiments as well as examination of valvular tissue of diabetics might therefore lead to a better understanding of diabetes-induced P70S6K(Thr389) phosphorylation in VIC. However, it has been shown that P70S6K acts via different phosphorylation sites by MTORC1 activation alone or in combination with other kinases (27, 28). Thus, future experiments might also aim at the investigation of alternative phosphorylation sites of P70S6K besides (Thr389).
As we have shown before, in the present work HI led to impaired Akt(Ser473) signaling under NG as well as under HG conditions (14). Under the applied conditions, Akt(Thr308) phosphorylation is not as sensitive to HI as Akt(Ser473) phosphorylation. Moreover, Akt(Thr308) phosphorylation seems to be mainly impaired by HG conditions. Susceptibility of both Akt(Ser473) and Akt(Thr308) phosphorylation to impaired signaling upon HI is more pronounced under rapamycin treatment. Here, Akt(Thr308) phosphorylation shows a similar pattern as Akt(Ser473) phosphorylation. This effect here seen in VIC might probably be due to MTORC1 inhibition by rapamycin and a resulting inhibition of the negative feedback loop, which then enhances activation of Akt(Ser473) signaling (29) thereby triggering subsequent Akt(Thr308) signaling. However, enhanced susceptibility of Akt(Thr308) phosphorylation by prior Akt(Ser473) activation has been shown already by Sarbassov et al. (30).
Mammalian target of rapamycin complex 1 and mammalian target of rapamycin complex 2 signaling under mammalian target of rapamycin inhibition
Rapamycin was initially considered as a potent inhibitor of translation and thus, e.g., inhibiting tumor growth through inhibition of MTORC1 complex and downstream inhibition of 4E-BP1 and P70S6K signaling (31). However, inhibition of 4E-BP1 phosphorylation of, e.g., 4E-BP1(Thr37/46) by rapamycin seems to be unstable in long-term treatment (48 h +) and is particularly described to be cell type dependent (32). However, the effect of rapamycin on MTORC1 downstream signaling and especially on 4E-BP1 and P70S6K phosphorylation has scarcely been described for VIC (33). Our data show that rapamycin is able to decrease 4E-BP1(Thr37/46) phosphorylation in VIC upon acute insulin stimulus even after 5 days of treatment. In addition, rapamycin also reduces the susceptibility of 4E-BP1 to inducible phosphorylation by acute insulin stimulus.
Moreover, phosphorylation of P70S6K(Thr389) was not influenced by rapamycin treatment in VIC. This might be due to the relatively low rapamycin concentration chosen for our experiments (10 nM), whereas others also reported cell line dependent responsiveness with this concentration (34). Murine VIC treated with 100 nM rapamycin showed a decrease in P70S6K phosphorylation (35), which might be indicative for the need of higher concentrations of rapamycin. Apart from the mentioned report based upon a 1-h treatment with rapamycin (35), to our knowledge, long-term effects on P70S6K have not yet been reported for VIC. However, adverse effects of rapamycin or time-dependent suspension of mTOR pathway inhibition has been reported before for other cells (32). Effects of in vivo long-term rapamycin treatment on MTORC1 downstream targets P70S6K and 4E-BP1 have been described recently for vascular tissue showing a reduction of these both MTORC1 targets (36). Interestingly, inhibition of the phosphorylation of these two MTORC1 downstream targets by rapamycin is described to be temporarily different. In the reported model, inhibition of P70S6K phosphorylation alleviates over time, whereas inhibition of 4E-BP1 phosphorylation aggravates after day 7 after administration (36). Evaluation of a time- and/or dose-dependent rapamycin action or the impact or more specific mTOR inhibitors like torin on the responsiveness of VIC therefore might be necessary to investigate the role of 4E-BP1 and P70S6K in this setting in detail.
Previous reports have suggested that short-term rapamycin treatment inhibits MTORC1 whereas long-term treatment inhibits also MTORC2 and impairs subsequent Akt signaling (37). The definition of “long-term” treatment though is ambiguous since clinical application certainly is not comparable to in vitro experimental treatments. However, impact of rapamycin treatment on MTORC2 has been described to be cell type dependent (37) and dependent on the time of rapamycin treatment or administration, respectively. Reports on administration of rapamycin in vivo up to 21 days describe unchanged MTORC2 downstream activation in vascular tissue (36) whereas in vitro treatment of fibroblasts with rapamycin for 4 days abolished Akt signaling (38).
Based on this, it is not clear whether MTORC2 is impaired by 5 days treatment with rapamycin in our approach, since we do not see impaired Akt signaling but rather increased Akt phosphorylation of both Akt(Ser473) und Akt(Thr308). Since Akt(Thr308) is not mTOR dependent, we did not expect a decrease here, but would have excepted an impaired Akt(Ser473) phosphorylation. Increase in Akt signaling in VIC might therefore be due to a not yet sufficient inhibition of MTORC2 together with the inhibition of the negative feedback loop of MTORC1 leading to enhanced activation of Akt signaling (29, 39). As Sarbassov et al. have reported earlier, also PI3K/PDK1 regulated Akt(Thr308) phosphorylation depends on Akt(Ser473) phosphorylation (30) and can be influenced by rapamycin treatment, which has been also shown recently in CRISPR/Cas9-based knockout of RICTOR (40). Nevertheless, our data on Akt signaling cannot dissect whether a possible inactivation of MTORC2 took place and if so, to which extend this would influence Akt(Ser473) phosphorylation when compared to the enhanced activation due to a loss of MTORC1 negative feedback. In conclusion, interplay of MTORC1/MTORC2 in the balance of Akt phosphorylation is delicate and cell type specific, even more so with respect to the question of the impact of long-term usage of rapamycin.
Impact of diabetic conditions on valvular interstitial cells differentiation and valvular matrix
Diabetes is associated with a higher risk to develop aortic stenosis (7, 9) however, knowledge about the impact of HI and HG on aortic valve molecular composition is still limited. Aortic valves of diabetics are more prone to chondro-osteogenic differentiation and matrix remodeling than the valves of non-diabetics (11- 13). Animal studies analyzing the pathophysiology of the aortic valve in presence of diabetes further support the findings of clinical observations (41, 42). The present work shows that HI and HG as hallmarks of diabetes significantly alter the aortic valve on a cellular level, i.e., VIC differentiation and matrix remodeling. Similar to previous investigations, HI suppresses activation of VIC (14), whereas HG alone did not alter ACTA2 expression, which was also observed by others (43). Diabetic conditions generally increased matrix remodeling, indicated by elevated expression of MMP2 and proteoglycans, mainly but not exclusively due to HI treatment. HG treatment alone altered DCN and HAS2 gene expression but was not sufficient to alter other matrix molecules as has been reported for VIC in three-dimensional in vitro approaches (43). Here, biomechanical stimuli seem to enhance some effects on matrix remodeling, an observation which we could corroborate in previous studies involving aortic valve tissue culture in different biomechanical environments (15).
It is surprising that ALP activity in VIC is rather downregulated by HI, since aortic valve tissue of human diabetics (13) as well as aortic valve tissue in a murine diabetes-induced atherosclerosis model (42) showed increased levels of ALP. Discrepancies in these findings may be due to the isolated investigation of VIC with selected stimuli, i.e., HG and HI, versus the complex pathophysiology involving dyslipidemia and inflammation, both of which have been described to take place in diabetes. Taken together, HI and HG treatment lead to molecular alterations of VIC, which can be also found in preclinical models of diabetes-induced aortic valve degeneration.
Impact of rapamycin on valvular interstitial cells differentiation and valvular matrix
Mammalian target of rapamycin signaling mediates fibrotic remodeling of several tissues including the myocardium (16). Inhibition of mTOR by rapamycin or so-called “rapalogs” is used to prevent heart failure and cardiac remodeling [reviewed in (18, 44)]. Such pharmacological intervention has also been suggested as a promising approach to prevent myocardial dysfunction in diabetes (45, 46). Nevertheless, reports on the role of mTOR in degenerative changes in cardiac valves, and specifically in VIC are scarce (47). In the present work, rapamycin treatment of VIC evokes a general downregulation of gene expression of several matrix components like COL1A1, ELN as well as of BGN and DCN. However, effects of mTOR inhibitors vary amongst cell types of different origin and with diverse actions of rapalogs of different generations or depending on the applied techniques (e.g., RNA interference vs. Rapalink-1), providing heterogeneous or even contrary findings, e.g., for proteoglycans (48, 49) or matrix metalloproteinases (50, 51). In the present work, rapamycin treatment led to an increased gene expression of ACTA2. Interestingly, especially the effect on alpha smooth muscle actin (α-SMA) activation seems to be cell type dependent as well as susceptible to different mTOR inhibitors. For example, an increase in α-SMA expression was reported for vascular smooth muscle cells (52) and mesangial cells upon sirolimus treatment (53). In contrast, an inhibitory effect of rapamycin on α-SMA expression could be shown in endothelial-like cells (38) and fibroblasts (39). Long-term treatment with rapamycin led to a reduced α-SMA expression together with impaired MTORC2 downstream signaling via Akt in fibroblasts (38). A lack of decreased ACTA2 expression in our approach thus might imply that our 5 days rapamycin treatment has yet not been enough to provoke inhibition of MTORC2 signaling with subsequent inhibition of myofibroblastoidal differentiation of VIC. However, these effects seem to be highly dependent on the starving status of the cells, since opposite effects have been described for unstarved cells (38).
Osteogenic markers such as osteopontin or alkaline phosphatase in contrast, seem to be in general rather downregulated by rapamycin as it has been shown for VIC (48) as well as for vascular smooth muscle cells (52). Discrepancies between our findings of unchanged OPN gene expression and an increased ALP activity and reports on downregulation of these markers might therefore be due to different treatment durations, an issue that is also discussed in the clinical application of mTOR inhibitors (54). Taken together, in our setting, rapamycin treatment leads to an activation of VIC together with an upregulation of ALP activity. Thus, the role of ALP may be subjected to further translational studies and might be a promising candidate for clinical investigation.
Potential involvement of mammalian target of rapamycin signaling in valvular interstitial cells differentiation and matrix remodeling under diabetic conditions
Our analyses show that chronic insulin treatment leads to an abrogation of mTOR phosphorylation in VIC even after short-time cultivation. In contrast to findings on upstream Akt signaling (14), HG conditions alone are not sufficient to impair mTOR signaling. Here, the reduction of mTOR phosphorylation was highest under combined HG conditions and chronic insulin exposure. Furthermore, AMPK is characterized as an upstream mTOR inhibitor, sensing glucose changes and inhibiting mTOR in episodes of glucose starvation (55, 56). In the present work, AMPK phosphorylation was not altered by varying glucose concentrations, which might be indicative for a mainly aerobic metabolism of VIC (57). Moreover, previous studies have shown that VIC mainly express the insulin-independent glucose transporter 1 but not glucose transporter 4 (14), which would be regulated by AMPK in case of metabolic imbalance (58).
In front of the background that diabetic conditions deplete mTOR signaling, the question arises which mitogenic effect induced by diabetic conditions can be ascribed to a regulation by mTOR signaling. Here, effects of rapamycin treatment should lead to similar expression patterns if not even further pronounced patterns as compared to the treatment with diabetic conditions. This effect was present for the gene expression of ELN, a structural matrix component, which was significantly downregulated both by treatment with HI + HG as well as by rapamycin treatment. The same holds true for OPN expression as a marker for chondro-osteogenic differentiation of VIC, which is upregulated by HG treatment, whereas HI treatment impedes this effect. Here, rapamycin treatment led to similar expression patterns. This is indicative for diabetes induced matrix remodeling and differentiation being mediated by mTOR signaling at this point. Most of the other investigated targets in the present work did not show comparable patterns of reaction. Concerning certain effects, even contrary reactions between diabetic conditions and rapamycin treatment were observed, e.g., in case of ACTA2, MMP2, and BGN gene expression as well as in case of ALP activity. In the case of latter subjects, the alterations induced by diabetic conditions do not seem to be mediated by mTOR signaling but rather by alternative pathways such as sonic hedgehog signaling, which has been described as relevant for osteoblastic differentiation under HG (59).
Concerning the question whether these observations can be attributed to mTOR downstream signaling via MTORC1 or MTORC2, similar effects in VIC provoked by diabetic conditions and rapamycin treatment might be seen in MTORC1 downstream 4E-BP1 signaling, where HI impairs susceptibility of VIC to induced phosphorylation, which can be also shown for rapamycin. Nevertheless, future investigations are needed to dissect the detailed involvement of MTORC1 downstream signaling in the course of VIC differentiation, remodeling and degeneration under diabetic conditions and mTOR inhibition.
Conclusion
Diabetic conditions lead to molecular alterations of VIC as well as to impaired mTOR signaling with different susceptibility to HG and HI. Inhibition of mTOR signaling by rapamycin treatment results in decreased matrix expression but also in an activation of VIC together with an upregulation of ALP activity. Particular matrix components and chondro-osteogenic markers reveal an mTOR-mediated reaction of VIC to diabetic conditions with potential involvement of MTORC1 downstream signaling via impaired 4E-BP1 phosphorylation. However, these data underscore the need for further investigations using MTORC1-specific inhibitors. Moreover, these findings foster the hypothesis of diabetes-induced initiation and progression of CAVD and further suggest that the involved molecular events may be only partly mediated by mTOR signaling. Further investigations therefore might aim at tailored treatment with mTOR inhibitors considering patients at increased risk for the development of CAVD, i.e., diabetics.
Limitations of the study
Hyperinsulinemia and HG are hallmarks of diabetic complications. However, isolated application of these two factors does not reflect the pathophysiology of diabetes with its complex aspects of inflammation, disturbed protein metabolism and dyslipidemia. Thus, the findings of the present work focus on the isolated effects of insulin and glucose on mTOR signaling, which should be further validated in translational studies, i.e., animal models of diabetes.
The use of in vitro [two-dimensional (2D)] cell culture bears several limitations, e.g., the influence of the interaction with other cell types of the tissue of origin, the lack of cell–matrix interactions or, especially in the case of the aortic valve, the lack of shear stress-induced mechanisms. Thus, findings of in vitro experiments have to be regarded with great attention concerning their comparability with whole tissue examinations and need to be confirmed by three-dimensional analysis and in translational approaches. Nevertheless, in vitro culture environments offer advantages for basic studies of isolated parameters if used in a reproducible and stable model.
The use of a non-human (i.e., ovine) VIC cell source is also afflicted with limitations, since these cells will differ from the corresponding human source in relation to mechanics, physiology, and immunology. Although ovine VIC have advanced to a reliable model for functional studies on CAVD, direct comparability to human-derived VIC is restricted and validation in human-derived cell lines therefore is inevitable. Our approach using ovine VIC is mainly owed to the lack of human healthy donor valves and a heterogeneous population of patients concerning age, medication and co-morbidities. Ovine VIC therefore represent a “healthy” phenotype that is hardly achievable with human specimen and allows analysis without patient-related side effects.
Although rapamycin is a clinically proven agent for the treatment of heart failure and post-infarction cardiac remodeling, it might lead to conflicting or confounding results in vitro, since it is inferior in completely blocking MTORC1 together with MTORC2 in comparison to, e.g., torin (60, 61). Thus, findings concerning rapamycin-induced effects on MTORC1 have to be interpreted carefully.
In the present investigations, DMSO was used as a solvent for rapamycin. DMSO is known to have unwarranted effects on cell proliferation and differentiation, which we sought to minimize by using concentrations of 0.1% DMSO.
Data availability statement
The original contributions presented in this study are included in the article/Supplementary material, further inquiries can be directed to the corresponding author.
Author contributions
MB and JS: conceptualization, formal analysis, and project administration. MB, JS, DO, and PA: methodology. JS, MB, and PA: validation. HK, CK, FK, and EA: investigation. AL: resources. HK and MB: data curation and visualization. MB and PA: writing—original draft preparation. MB, JS, AL, DO, SB, and PA: writing—review and editing. JS, MB, AL, and PA: supervision. JS: data curation and visualization. All authors contributed to the article and approved the submitted version.
Funding
This research was funded by German Research Foundation (DFG) to MB (grant number: 421961956).
Acknowledgments
We thank K. Bartkowski and K. Freidel for their competent assistance with Western blots. Moreover, we also thank the S. Bunnenberg Foundation for the generous support of the Cardiovascular Research Facilities at the Heinrich Heine University Düsseldorf.
Conflict of interest
The authors declare that the research was conducted in the absence of any commercial or financial relationships that could be construed as a potential conflict of interest.
Publisher’s note
All claims expressed in this article are solely those of the authors and do not necessarily represent those of their affiliated organizations, or those of the publisher, the editors and the reviewers. Any product that may be evaluated in this article, or claim that may be made by its manufacturer, is not guaranteed or endorsed by the publisher.
Supplementary material
The Supplementary Material for this article can be found online at: https://www.frontiersin.org/articles/10.3389/fcvm.2022.942430/full#supplementary-material
References
1. Beulens J, Rutters F, Ryden L, Schnell O, Mellbin L, Hart HE, et al. Risk and management of pre-diabetes. Eur J Prev Cardiol. (2019) 26:47–54.
2. Vas PRJ, Alberti KG, Edmonds ME. Prediabetes: moving away from a glucocentric definition. Lancet Diabetes Endocrinol. (2017) 5:848–9. doi: 10.1016/S2213-8587(17)30234-6
4. Makaroff LE. The need for international consensus on prediabetes. Lancet Diabetes Endocrinol. (2017) 5:5–7.
5. Guariguata L, Whiting DR, Hambleton I, Beagley J, Linnenkamp U, Shaw JE. Global estimates of diabetes prevalence for 2013 and projections for 2035. Diabetes Res Clin Pract. (2014) 103:137–49. doi: 10.1016/j.diabres.2013.11.002
6. Yan AT, Koh M, Chan KK, Guo H, Alter DA, Austin PC, et al. Association between cardiovascular risk factors and aortic stenosis: the CANHEART aortic stenosis study. J Am Coll Cardiol. (2017) 69:1523–32. doi: 10.1016/j.jacc.2017.01.025
7. Larsson SC, Wallin A, Hakansson N, Stackelberg O, Back M, Wolk A. Type 1 and type 2 diabetes mellitus and incidence of seven cardiovascular diseases. Int J Cardiol. (2018) 262:66–70.
8. Ljungberg J, Johansson B, Engstrom KG, Albertsson E, Holmer P, Norberg M, et al. Traditional cardiovascular risk factors and their relation to future surgery for valvular heart disease or ascending aortic disease: a case-referent study. J Am Heart Assoc. (2017) 6:5.
9. Cai X, Zhang Y, Li M, Wu JH, Mai L, Li J, et al. Association between prediabetes and risk of all cause mortality and cardiovascular disease: updated meta-analysis. BMJ. (2020) 370:m2297.
10. Natorska J, Wypasek E, Grudzien G, Sobczyk D, Marek G, Filip G, et al. Does diabetes accelerate the progression of aortic stenosis through enhanced inflammatory response within aortic valves? Inflammation. (2012) 35:834–40. doi: 10.1007/s10753-011-9384-7
11. Kopytek M, Za̧bczyk M, Mazur P, Undas A, Natorska J. Accumulation of advanced glycation end products (AGEs) is associated with the severity of aortic stenosis in patients with concomitant type 2 diabetes. Cardiovasc Diabetol. (2020) 19:92. doi: 10.1186/s12933-020-01068-7
12. Barth M, Selig JI, Klose S, Schomakers A, Kiene LS, Raschke S, et al. Degenerative aortic valve disease and diabetes: implications for a link between proteoglycans and diabetic disorders in the aortic valve. Diab Vasc Dis Res. (2019) 16:254–69. doi: 10.1177/1479164118817922
13. Mosch J, Gleissner CA, Body S, Aikawa E. Histopathological assessment of calcification and inflammation of calcific aortic valves from patients with and without diabetes mellitus. Histol Histopathol. (2017) 32:293–306. doi: 10.14670/HH-11-797
14. Selig JI, Ouwens DM, Raschke S, Thoresen GH, Fischer JW, Lichtenberg A, et al. Impact of hyperinsulinemia and hyperglycemia on valvular interstitial cells - a link between aortic heart valve degeneration and type 2 diabetes. Biochim Biophys Acta Mol Basis Dis. (2019) 1865:2526–37. doi: 10.1016/j.bbadis.2019.05.019
15. Selig JI, Boulgaropoulos J, Niazy N, Ouwens DM, Preuss K, Horn P, et al. Crosstalk of diabetic conditions with static versus dynamic flow environment-impact on aortic valve remodeling. Int J Mol Sci. (2021) 22:13. doi: 10.3390/ijms22136976
16. Jimenez-Uribe AP, Gomez-Sierra T, Aparicio-Trejo OE, Orozco-Ibarra M, Pedraza-Chaverri J. Backstage players of fibrosis: NOX4, mTOR, HDAC, and S1P; companions of TGF-beta. Cell Signal. (2021) 87:110123. doi: 10.1016/j.cellsig.2021.110123
17. Suhara T, Baba Y, Shimada BK, Higa JK, Matsui T. The mTOR signaling pathway in myocardial dysfunction in type 2 diabetes mellitus. Curr Diab Rep. (2017) 17:38.
18. Sciarretta S, Forte M, Frati G, Sadoshima J. The complex network of mTOR signalling in the heart. Cardiovasc Res. (2022) 118:424–39.
19. Stephens EH, Han J, Trawick EA, Di Martino ES, Akkiraju H, Brown LM, et al. Left-ventricular assist device impact on aortic valve mechanics, proteomics and ultrastructure. Ann Thorac Surg. (2018) 105:572–80. doi: 10.1016/j.athoracsur.2017.08.030
20. Barth M, Mrozek L, Niazy N, Selig JI, Boeken U, Sugimura Y, et al. Degenerative changes of the aortic valve during left ventricular assist device support. ESC Heart Failure. (2022) 9:270–82.
21. Ma H, Killaars AR, DelRio FW, Yang C, Anseth KS. Myofibroblastic activation of valvular interstitial cells is modulated by spatial variations in matrix elasticity and its organization. Biomaterials. (2017) 131:131–44. doi: 10.1016/j.biomaterials.2017.03.040
22. Dayawansa NH, Baratchi S, Peter K. Uncoupling the vicious cycle of mechanical stress and inflammation in calcific aortic valve disease. Front Cardiovas Med. (2022) 9:783543. doi: 10.3389/fcvm.2022.783543
23. Terruzzi I, Pellegatta F, Luzi L. Differential p70S6k and 4E-BP1 regulation by insulin and amino acids in vascular endothelial and smooth muscle cells. Acta Diabetol. (2005) 42:139–46. doi: 10.1007/s00592-005-0193-z
24. Møller AB, Kampmann U, Hedegaard J, Thorsen K, Nordentoft I, Vendelbo MH, et al. Altered gene expression and repressed markers of autophagy in skeletal muscle of insulin resistant patients with type 2 diabetes. Sci Rep. (2017) 7:43775. doi: 10.1038/srep43775
25. Lu Q, Chen YB, Yang H, Wang WW, Li CC, Wang L, et al. Inactivation of TSC1 promotes epithelial-mesenchymal transition of renal tubular epithelial cells in mouse diabetic nephropathy. Acta Pharmacol Sin. (2019) 40:1555–67.
26. Baricevic I, Roberts DL, Renehan AG. Chronic insulin exposure does not cause insulin resistance but is associated with chemo-resistance in colon cancer cells. Hormone Metab Res Hormon Und Stoffwechselforschung Hormones Metab. (2014) 46:85–93.
27. Arif A, Jia J, Willard B, Li X, Fox PL. Multisite phosphorylation of S6K1 directs a kinase phospho-code that determines substrate selection. Mol Cell. (2019) 73:446–57e6. doi: 10.1016/j.molcel.2018.11.017
28. Bahrami BF, Ataie-Kachoie P, Pourgholami MH, Morris DL. p70 Ribosomal protein S6 kinase (Rps6kb1): an update. J Clin Pathol. (2014) 67:1019–25. doi: 10.1136/jclinpath-2014-202560
29. O’Reilly KE, Rojo F, She QB, Solit D, Mills GB, Smith D, et al. mTOR inhibition induces upstream receptor tyrosine kinase signaling and activates Akt. Cancer Res. (2006) 66:1500–8.
30. Sarbassov DD, Guertin DA, Ali SM, Sabatini DM. Phosphorylation and regulation of Akt/PKB by the rictor-mTOR complex. Science. (2005) 307:1098–101.
31. Fingar DC, Blenis J. Target of rapamycin (TOR): an integrator of nutrient and growth factor signals and coordinator of cell growth and cell cycle progression. Oncogene. (2004) 23:3151–71.
32. Choo AY, Yoon SO, Kim SG, Roux PP, Blenis J. Rapamycin differentially inhibits S6Ks and 4E-BP1 to mediate cell-type-specific repression of mRNA translation. Proc Natl Acad Sci USA. (2008) 105:17414–9. doi: 10.1073/pnas.0809136105
33. Tan Y, Wang JY, Yi RL, Qiu J. [Effect of rapamycin on proliferation of rat heart valve interstitial cells in vitro]. Nan Fang Yi Ke Da Xue Xue Bao J Southern Med Univ. (2016) 36:572–6.
34. Bernard S, Poon AC, Tam PM, Mutsaers AJ. Investigation of the effects of mTOR inhibitors rapamycin and everolimus in combination with carboplatin on canine malignant melanoma cells. BMC Veterinary Res. (2021) 17:382. doi: 10.1186/s12917-021-03089-0
35. Ghatak S, Misra S, Moreno-Rodrigue RA, Hascall VC, Leone GW, Markwald RR. Periostin/β1integrin interaction regulates p21-activated kinases in valvular interstitial cell survival and in actin cytoskeleton reorganization. Biochimica Biophys Acta General Subjects. (2019) 1863:813–29. doi: 10.1016/j.bbagen.2018.12.015
36. Guo X, Fereydooni A, Isaji T, Gorecka J, Liu S, Hu H, et al. Inhibition of the Akt1-mTORC1 axis alters venous remodeling to improve arteriovenous fistula patency. Sci Rep. (2019) 9:11046.
37. Sarbassov DD, Ali SM, Sengupta S, Sheen JH, Hsu PP, Bagley AF, et al. Prolonged rapamycin treatment inhibits mTORC2 assembly and Akt/PKB. Mol Cell. (2006) 22:159–68. doi: 10.1016/j.molcel.2006.03.029
38. Bernard M, Dieudé M, Yang B, Hamelin K, Underwood K, Hébert MJ. Autophagy fosters myofibroblast differentiation through MTORC2 activation and downstream upregulation of CTGF. Autophagy. (2014) 10:2193–207. doi: 10.4161/15548627.2014.981786
39. Wan X, Harkavy B, Shen N, Grohar P, Helman LJ. Rapamycin induces feedback activation of Akt signaling through an IGF-1R-dependent mechanism. Oncogene. (2007) 26:1932–40. doi: 10.1038/sj.onc.1209990
40. Ruicci KM, Plantinga P, Pinto N, Khan MI, Stecho W, Dhaliwal SS, et al. Disruption of the RICTOR/mTORC2 complex enhances the response of head and neck squamous cell carcinoma cells to PI3K inhibition. Mol Oncol. (2019) 13:2160–77.
41. Le Quang K, Bouchareb R, Lachance D, Laplante MA, El Husseini D, Boulanger MC, et al. Early development of calcific aortic valve disease and left ventricular hypertrophy in a mouse model of combined dyslipidemia and type 2 diabetes mellitus. Arterioscler Thromb Vasc Biol. (2014) 34:2283–91. doi: 10.1161/ATVBAHA.114.304205
42. Tucureanu MM, Filippi A, Alexandru N, Ana Constantinescu C, Ciortan L, Macarie R, et al. Diabetes-induced early molecular and functional changes in aortic heart valves in a murine model of atherosclerosis. Diab Vasc Dis Res. (2019) 16:562–76. doi: 10.1177/1479164119874469
43. Ciortan L, Macarie RD, Cecoltan S, Vadana M, Tucureanu MM, Mihaila AC, et al. Chronic high glucose concentration induces inflammatory and remodeling changes in valvular endothelial cells and valvular interstitial cells in a gelatin methacrylate 3D model of the human aortic valve. Polymers. (2020) 12:12. doi: 10.3390/polym12122786
44. Sciarretta S, Forte M, Frati G, Sadoshima J. New insights into the role of mTOR signaling in the cardiovascular system. Circ Res. (2018) 122:489–505.
45. Samidurai A, Ockaili R, Cain C, Roh SK, Filippone SM, Kraskauskas D, et al. Differential regulation of mTOR complexes with miR-302a attenuates myocardial reperfusion injury in diabetes. iScience. (2020) 23:101863. doi: 10.1016/j.isci.2020.101863
46. Das A, Durrant D, Koka S, Salloum FN, Xi L, Kukreja RC. Mammalian target of rapamycin (mTOR) inhibition with rapamycin improves cardiac function in type 2 diabetic mice: potential role of attenuated oxidative stress and altered contractile protein expression. J Biol Chem. (2014) 289:4145–60. doi: 10.1074/jbc.M113.521062
47. Deng XS, Meng X, Song R, Fullerton D, Jaggers J. Rapamycin decreases the osteogenic response in aortic valve interstitial cells through the stat3 pathway. Ann Thorac Surg. (2016) 102:1229–38. doi: 10.1016/j.athoracsur.2016.03.033
48. Nie D, Zhou Y, Wang W, Zhang J, Wang JH. Mechanical overloading induced-activation of mtor signaling in tendon stem/progenitor cells contributes to tendinopathy development. Front Cell Dev Biol. (2021) 9:687856. doi: 10.3389/fcell.2021.687856
49. Mavrogonatou E, Papadopoulou A, Fotopoulou A, Tsimelis S, Bassiony H, Yiacoumettis AM, et al. Down-regulation of the proteoglycan decorin fills in the tumor-promoting phenotype of ionizing radiation-induced senescent human breast stromal fibroblasts. Cancers. (2021) 13:8. doi: 10.3390/cancers13081987
50. Chi OZ, Liu X, Cofano S, Patel N, Jacinto E, Weiss HR. Rapalink-1 increased infarct size in early cerebral ischemia-reperfusion with increased blood-brain barrier disruption. Front Physiol. (2021) 12:706528. doi: 10.3389/fphys.2021.706528
51. Wang X, Li L, Li M, Dang X, Wan L, Wang N, et al. Knockdown of mTOR by lentivirusmediated RNA interference suppresses atherosclerosis and stabilizes plaques via a decrease of macrophages by autophagy in apolipoprotein Edeficient mice. Int J Mol Med. (2013) 32:1215–21. doi: 10.3892/ijmm.2013.1494
52. Xu Z, Liu X, Wang Z, Tao J, Han Z, Gu M, et al. Effect of sirolimus on arteriosclerosis induced by advanced glycation end products via inhibition of the ILK/mTOR pathway in kidney transplantation recipients. Eur J Pharmacol. (2017) 813:1–9. doi: 10.1016/j.ejphar.2017.06.038
53. Esposito C, Valentino R, Villa L, Serpieri N, Mangione F, Grosjean F, et al. Effects of sirolimus on human mesangial cells. Trans Proc. (2010) 42:1344–6.
54. Bellumkonda L, Patel J. Recent advances in the role of mammalian target of rapamycin inhibitors on cardiac allograft vasculopathy. Clin Trans. (2020) 34:e13769.
55. Inoki K, Zhu T, Guan KL. TSC2 mediates cellular energy response to control cell growth and survival. Cell. (2003) 115:577–90.
56. Gwinn DM, Shackelford DB, Egan DF, Mihaylova MM, Mery A, Vasquez DS, et al. AMPK phosphorylation of raptor mediates a metabolic checkpoint. Mol Cell. (2008) 30:214–26.
57. Bertrand L, Auquier J, Renguet E, Ange M, Cumps J, Horman S, et al. Glucose transporters in cardiovascular system in health and disease. Pflugers Arch. (2020) 472:1385–99.
58. Yang J, Holman GD. Insulin and contraction stimulate exocytosis, but increased AMP-activated protein kinase activity resulting from oxidative metabolism stress slows endocytosis of GLUT4 in cardiomyocytes. J Biol Chem. (2005) 280:4070–8. doi: 10.1074/jbc.M410213200
59. Jiang ZL, Jin H, Liu ZS, Liu MY, Cao XF, Jiang YY, et al. Lentiviralmediated Shh reverses the adverse effects of high glucose on osteoblast function and promotes bone formation via sonic hedgehog signaling. Mol Med Rep. (2019) 20:3265–75. doi: 10.3892/mmr.2019.10540
60. Thoreen CC, Kang SA, Chang JW, Liu Q, Zhang J, Gao Y, et al. An ATP-competitive mammalian target of rapamycin inhibitor reveals rapamycin-resistant functions of mTORC1. J Biol Chem. (2009) 284:8023–32.
Keywords: valvular interstitial cells (VIC), calcific aortic valve disease (CAVD), rapamycin, insulin resistance, hyperinsulinemia, hyperglycemia, mammalian target of rapamycin (mTOR), MTORC1/2
Citation: Selig JI, Krug HV, Küppers C, Ouwens DM, Kraft FA, Adler E, Bauer SJ, Lichtenberg A, Akhyari P and Barth M (2022) Interactive contribution of hyperinsulinemia, hyperglycemia, and mammalian target of rapamycin signaling to valvular interstitial cell differentiation and matrix remodeling. Front. Cardiovasc. Med. 9:942430. doi: 10.3389/fcvm.2022.942430
Received: 12 May 2022; Accepted: 12 October 2022;
Published: 31 October 2022.
Edited by:
Maria Nunes, Federal University of Minas Gerais, BrazilReviewed by:
Joshua D. Hutcheson, Florida International University, United StatesRobert Kiss, McGill University, Canada
Copyright © 2022 Selig, Krug, Küppers, Ouwens, Kraft, Adler, Bauer, Lichtenberg, Akhyari and Barth. This is an open-access article distributed under the terms of the Creative Commons Attribution License (CC BY). The use, distribution or reproduction in other forums is permitted, provided the original author(s) and the copyright owner(s) are credited and that the original publication in this journal is cited, in accordance with accepted academic practice. No use, distribution or reproduction is permitted which does not comply with these terms.
*Correspondence: Payam Akhyari, Pakhyari@ukaachen.de
†Present Address: Sebastian J. Bauer, Payam Akhyari and Mareike Barth, Department of Cardiac Surgery, University Hospital Rheinisch-Westfälische Technische Hochschule (RWTH), Aachen, Germany