Predictive Added Value of Selected Plasma Lipids to a Re-estimated Minimal Risk Tool
 Antonella Bodini1*
  Elena Michelucci2
  Nicoletta Di Giorgi2
  Chiara Caselli2,3
  Giovanni Signore4,5
  Danilo Neglia3 Jeff M. Smit6 Arthur J.H.A. Scholte6
  Pierpaolo Mincarone7
  Carlo G. Leo8 Gualtiero Pelosi2
  Silvia Rocchiccioli2
- 1Institute for Applied Mathematics and Information Technologies “E. Magenes,” National Research Council, Milan, Italy
- 2Institute of Clinical Physiology, National Research Council, Pisa, Italy
- 3Cardiovascular Department, Fondazione Toscana G. Monasterio, Pisa, Italy
- 4NEST, Scuola Normale Superiore, Pisa, Italy
- 5Fondazione Pisana per la Scienza, San Giuliano Terme, Italy
- 6Department of Cardiology, Leiden University Medical Centre, Leiden, Netherlands
- 7Institute for Research on Population and Social Policies, National Research Council, Brindisi, Italy
- 8Institute of Clinical Physiology, National Research Council, Lecce, Italy
Background: Lipidomics is emerging for biomarker discovery in cardiovascular disease, and circulating lipids are increasingly incorporated in risk models to predict cardiovascular events. Moreover, specific classes of lipids, such as sphingomyelins, ceramides, and triglycerides, have been related to coronary artery disease (CAD) severity and plaque characteristics. To avoid unnecessary testing, it is important to identify individuals at low CAD risk. The only pretest model available so far to rule out the presence of coronary atherosclerosis in patients with chest pain, but normal coronary arteries, is the minimal risk tool (MRT).
Aim: Using state-of-the-art statistical methods, we aim to verify the additive predictive value of a set of lipids, derived from targeted plasma lipidomics of suspected CAD patients, to a re-estimated version of the MRT for ruling out the presence of coronary atherosclerosis assessed by coronary CT angiography (CCTA).
Methods: Two hundred and fifty-six subjects with suspected stable CAD recruited from five European countries within H2020-SMARTool, undergoing CCTA and blood sampling for clinical biochemistry and lipidomics, were selected. The MRT was validated by regression methods and then re-estimated (reMRT). The reMRT was used as a baseline model in a likelihood ratio test approach to assess the added predictive value of each lipid from 13 among ceramides, triglycerides, and sphingomyelins. Except for one lipid, the analysis was carried out on more than 240 subjects for each lipid. A sensitivity analysis was carried out by considering two alternative models developed on the cohort as baseline models.
Results: In 205 subjects, coronary atherosclerosis ranged from minimal lesions to overt obstructive CAD, while in 51 subjects (19.9%) the coronary arteries were intact. Four triglycerides and seven sphingomyelins were significantly (p < 0.05) and differentially expressed in the two groups and, at a lesser extent, one ceramide (p = 0.067). The probability of being at minimal risk was significantly better estimated by adding either Cer(d18:1/16:0) (p = 0.01), SM(40:2) (p = 0.04), or SM(41:1) at a lesser extent (p = 0.052) to reMRT than by applying the reMRT alone. The sensitivity analysis confirmed the relevance of these lipids. Furthermore, the addition of SM(34:1), SM(38:2), SM(41:2), and SM(42:4) improved the predictive performance of at least one of the other baseline models. None of the selected triglycerides was found to provide an added value.
Conclusions: Plasma lipidomics can be a promising source of diagnostic and prognostic biomarkers in cardiovascular disease, exploitable not only to assess the risk of adverse events but also to identify subjects without coronary atherosclerosis, thus reducing unnecessary further testing in normal subjects.
Introduction
The latest European Society of Cardiology (ESC) guidelines for the diagnosis and management of chronic coronary syndromes (1) recommend coronary CT angiography (CCTA) as the first-line diagnostic test for patients with low–intermediate clinical likelihood of obstructive coronary artery disease (CAD). One of the novelties of the latest ESC guidelines is the concept of clinical likelihood of CAD, which utilizes several conventional risk factors of CAD as pretest probability modifiers (1, 2). Among the existing validated pretest probability (PTP) models of obstructive CAD, a few can be used to rule out CAD (1, 3). The minimal risk tool (MRT) model has been recently introduced as a novel PTP model using only conventional variables measured in clinical practice to identify patients with chest pain, normal coronary arteries, and no adverse events at follow-up who derive minimal benefit and value from first-line diagnostic tests of CAD such as CCTA (4). The performance of MRT has been tested in different populations (5, 6), and an updated model has been proposed (6). Furthermore, thanks to the current advancements in analytical technologies, many additional metabolites and lipids can be easily measured in plasma samples and tested as candidate biomarkers of cardiometabolic risk. Metabolomics and lipidomics are promising sources of novel biomarkers of cardiovascular disease (7): in particular, specific plasma lipid species have been suggested to play a role in the pathogenesis of atherosclerosis (8–11), metabolic disorders, and clinical manifestations of cardiovascular disease in general (12). In addition, we have recently demonstrated that, even under optimal cholesterol-lowering treatments, CAD severity and atherosclerotic non-calcific plaque burden are significantly associated with specific circulating lipid species among the classes of sphingomyelins (SMs) and phosphatidylethanolamines (PEs), supporting their clinical exploitation as biomarkers of obstructive CAD with potentially vulnerable lesions (13).
In agreement with Hlatky et al. (14) and Moons et al. (15), a new-generation biomarker should not only have a diagnostic value per se, i.e., a statistically significant association with the outcome, but it should also provide a significant added value to the improvement of risk estimation when combined with other risk markers. Recently, for instance, the discrimination improvement of the polygenic risk scores with respect to the pooled cohort risk equations was called into question by statistical analyses carried out on large populations (16).
In this proof-of-concept study, we evaluated the value of lipidomics-derived markers in the existing pretest for the diagnostic workup of CAD patients using state-of-the-art statistical methods (17). We first carried out a full validation of the MRT on a population with a relatively low prevalence of subjects at minimal risk. Then, for the first time, in stable CAD patients (H2020-689068-SMARTool Project clinical trial, ClinicalTrials.gov identifier: NCT04448691), we evaluated whether and which plasma lipids can significantly contribute to improve the identification of subjects at minimal risk. Finally, a sensitivity analysis was conducted by considering also their added value to two alternative models predicting minimal risk inspired by PTP models of CAD.
Materials and Methods
Patient Population
The study population consists of 256 subjects from the clinical trial of the SMARTool Project (H2020-689068-SMARTool Project clinical trial, Clinicaltrial.gov identifier: NCT04448691). Subjects with suspected coronary artery disease and a median pretest probability of obstructive CAD of 65% (interquartile range, 33–75%)—intermediate risk (18)—were recruited in seven clinical centers from five European countries (Finland, Italy, Poland, Spain, and Switzerland). Clinical data, risk factors, clinical biochemistry, and stored plasma samples were retrospectively collected. Coronary atherosclerosis was assessed by CCTA, and plasma samples were used for standard clinical biochemistry and lipidomics analysis. Previous cardiac surgery, coronary revascularization, or major adverse cardiovascular events in the last 6 months, chronic kidney disease and atrial fibrillation were the main exclusion criteria.
Clinical and Laboratory Data
All variables included in the MRT were evaluated for this analysis, except for symptoms of physical/mental stress, unknown for all subjects, and ethnicity, the entire population being Caucasian. Hypertension was defined as a blood pressure >140/90 mmHg on at least two occasions (>130/80 mmHg for patients with diabetes) or requiring antihypertensive treatment. Diabetes was defined as a history of diabetes, an elevated fasting serum glucose >126 mg/dl (7 mmol/l), or antidiabetic therapy. Dyslipidemia was defined as an elevated cholesterol level [total cholesterol >200 mg/dl (5.18 mmol/l), low-density lipoprotein >130 mg/dl (3.37 mmol/l), or high-density lipoprotein <40 mg/dl (1.04 mmol/l) in men and <50 mg/dl (1.30 mmol/l) in women] or treatment with cholesterol-lowering medications. Smoking history was defined as current or past smoking. Plasma concentrations of cardiac troponin T were measured using the high-sensitive method on COBAS E411 with Elecsys Troponin T-hs STAT by Roche Diagnostics (Basel, Switzerland) (19).
Plasma Lipid Measurements
The plasma samples of all patients were stored in the IFC Biobank. For lipid extraction, they were thawed at room temperature and immediately processed. Total lipid extraction from an aliquot of plasma was performed according to the procedure of Folch et al. (20). The specific quantitative procedure used for HPLC-MS/MS analysis is reported in Michelucci et al. (13).
Coronary CCTA Analysis
Coronary CCTA was performed according to a predefined standard operating procedure to ensure optimal image quality. All images were analyzed blinded to clinical data by a separate Core Laboratory (Leiden University Medical Center) by two independent cardioradiologists. The coronary arteries were assessed according to the modified 17-segment American Heart Association classification (21) and the Coronary Artery Disease Reporting and Data System (CAD-RADS) guidelines (22). Patients were defined as either normal or with CAD according to the following criteria: normality was defined as no evidence of coronary atherosclerosis at CCTA scan, a coronary calcium score of 0, and no previous cardiovascular events at clinical history; the presence of CAD was assessed by CCTA (CAD-RADS classes 1–5) and/or a calcium score >0. All normal subjects were also free of adverse events in the following 4–8 years, in agreement with (4).
Descriptive Statistical Analysis
Continuous variables were described using means and standard deviations (μ ± σ), or medians (μ0.5) and interquartile ranges (IQRs, reported as the lower–upper quartile interval) when data distributions showed a marked lack of symmetry and/or the presence of several suspected outliers. Categorical variables were described using frequencies and percentages. Group comparisons with respect to continuous variables were performed using either the t-test or the Mann–Whitney test, when graphical indications of non-normality existed; Pearson's chi-square test or Fisher's exact test was used for comparisons with respect to categorical variables. Two-tailed tests were considered, and the significance level was set at α = 0.05. All analyses were performed using R Statistical Software (R Project for Statistical Computing, RRID:SCR_001905) (23).
Missing data imputation has been applied with a threshold of <1% to ensure that the analysis and its results were not significantly guided by the imputation method selected. The mean or the median has been considered each time as the imputed value, and the gender of the subject has also been taken into account when the distribution of the variable in the genders differed significantly.
MRT Validation
Calibration of the MRT model on our cohort was visually checked by plotting the predicted vs. the observed risk within each decile of risk, as estimated by the MRT, and then tested for significance with the Hosmer–Lemeshow (HL) statistic, as usual. The validation analysis was then deepened by testing calibration in-the-large, as well as both the overall and specific effects of the predictors by logistic regression techniques (24), even by re-estimating the model, if necessary.
LRT Analysis
The capability of each lipid statistically associated with the outcome to improve the prediction of subjects at minimal risk was evaluated by a likelihood ratio test (LRT) between the (possibly re-estimated) MRT as the baseline model and an enhanced model obtained by adding the lipid to the baseline model (25, 26). To apply the test, we firstly computed the logit transformation, xi, of the risks predicted by the baseline model (i.e., xi is the linear combination obtained from the estimated parameters and the selected risk factors in the baseline model). Then, the LRT evaluates the incremental value brought by any lipid to the estimation of the binary outcome of being at minimal risk, yi, by comparing the likelihood of the logistic model corresponding to the baseline linear combination (univariable, yi = α0 + α1xi) to the likelihood of the enhanced linear combination (bivariable, yi = β0+β1li+β2xi) obtained by adding (on top) the lipid of interest, li, to the baseline linear prediction risk. The calibration in-the-large of the baseline model on the subset of subjects defined by the considered lipid was checked and the goodness-of-fit verified by the Hosmer–Lemeshow test, each time. Log transformations of lipids were also considered for skewed distributions. The LRT was carried out by using the R package “lmtest” (27).
A possibly re-estimated minimal risk tool is our main baseline model. To carry out a sensitivity analysis on the added value of the considered set of lipids, two other baseline models based on current literature have been developed on the SMARTool cohort. Firstly, a multivariable logistic regression model including age, sex, and typicality of chest pain (basic model) has been estimated. The choice of predictors is clearly inspired by the Diamond–Forrester model and by the ESC guidelines, commonly used as the basis for any comparison when CAD is addressed. Of course, the basic model is a completely new model due to the minimal risk endpoint here considered. Secondly, a multivariable logistic regression model including age, sex, typicality of chest pain, and high-sensitive cardiac troponin T (basic-hs-cTnT model) has been considered as per the recently recognized role of high-sensitive troponin as an independent predictor of coronary artery disease (28–31). The validity of these two models as baseline models was checked by the Hosmer–Lemeshow test and c-statistics [area under the receiver operating characteristic (ROC) curve (AUC) value].
Finally, a multivariable logistic regression model was also fitted using the backward variable selection method with all the lipids that resulted in a significantly incremental predictive value for at least one of the considered baseline models. The final combination of lipids was in turn tested for improvement by the LRT approach.
Results
Study Population
The cohort consisted of 96 women (37.5%) and 160 men; the mean age was 62.4 (±8.1) years, and 16 subjects (6.3%, four women) were <50 years old. The mean age was not significantly different between the two sexes (63.3 vs. 61.8 years, p = 0.14). Only statins were used as lipid-lowering therapies, and 52.3% of subjects were on statins (52.1% of women and 52.5% of men). The demographic and clinical characteristics of the 256 subjects are listed in Table 1 according to their classification in the two groups. The summary values do not account for imputation. Subjects defined as normal (51, 19.9%) were mostly females (72.5 vs. 28.8%, p ≪ 0.001), were significantly younger (mean = 58.4 vs. 63.4 years, p ≪ 0.001), and had a lower prevalence of hypertension (52.9 vs. 70.7%, p = 0.024) and diabetes (9.8 vs. 24.9%, p = 0.032) than the CAD patients. They also had significantly higher high-density lipoprotein cholesterol (HDL-C; median = 56.0 mg/dl, IQR = 47.5–62.5 mg/dl) than the other subjects (median = 50.0 mg/dl, IQR = 41.0–59.0 mg/dl, p = 0.016). These results are in line with the findings obtained both in the derivation cohort by Fordyce et al. (4) and in the Dan-NICAD validation cohort (6). Moreover, significantly fewer subjects at minimal risk used angiotensin-converting enzyme (ACE) inhibitors/angiotensin receptor blocker (ARBs) (p = 0.006). The difference in the use of either statins or aspirin was only weakly significant (p < 0.065).
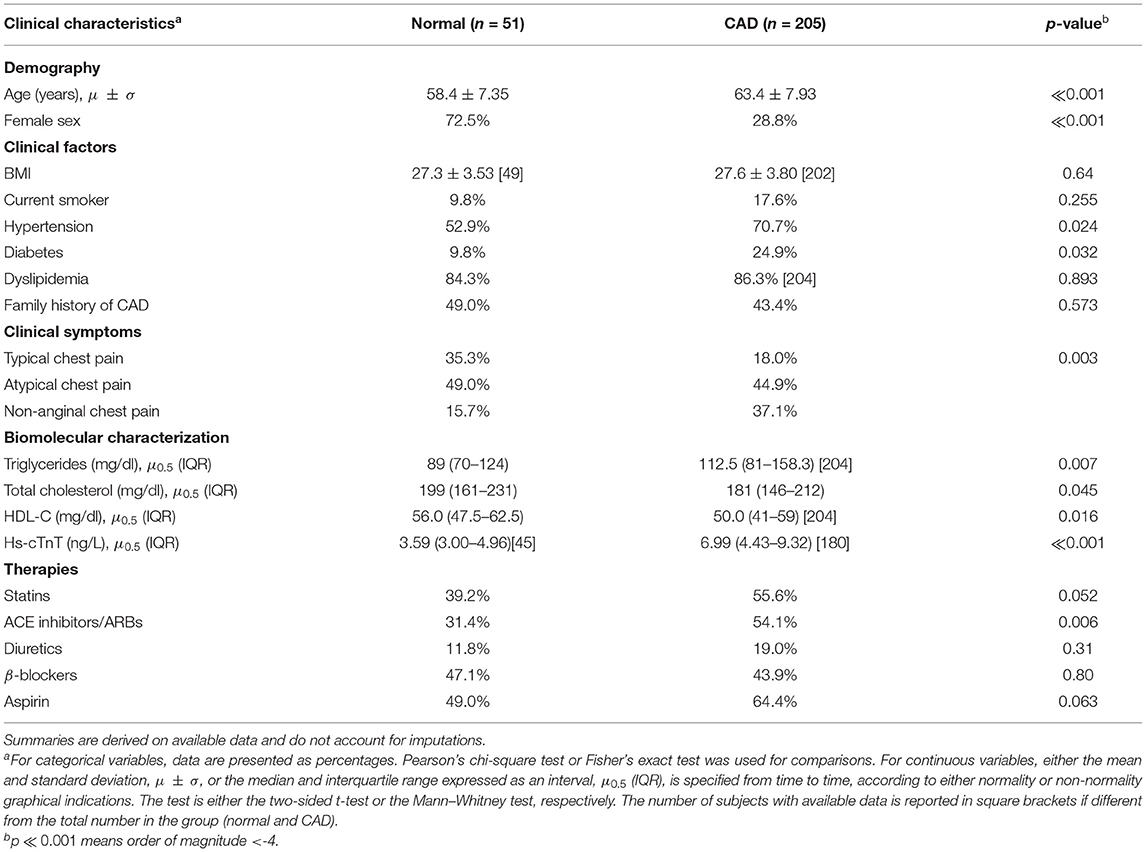
Table 1. Selected demographic and clinical characteristics.
While traditional risk factors and most of the lipids had at most 0.1% missing data, a stronger presence of missing data was found for high-sensitive cardiac troponin T (hs-cTnT), Cer(d18:1/18:0), SM(34:1), SM(40:3), and SM(40:1). In the former case, we imputed the missing data to either the mean/median or the prevalent category. In the latter, no imputation technique was applied.
Table 2 shows the summary statistics of the distributions of the 20 selected lipids according to the two groups of normal and CAD subjects. All but Cer(d18:1/18:0), TG(50:1), TG(50:2), SM(40:1), and SM(42:1) were proven to have strongly significantly different distributions in the two groups, while Cer(d18:1/16:0) showed only a weakly significant difference (p = 0.067). In particular, the triglyceride (TG) levels are lower in the normal group while SMs are higher, as well as Cer(d18:1/16:0). All the lipids with significant p-values were considered for improvement testing. Additionally, despite its weaker significance, Cer(d18:1/16:0) was retained due to its established relevance in the assessment of the severity of stenosis (32).
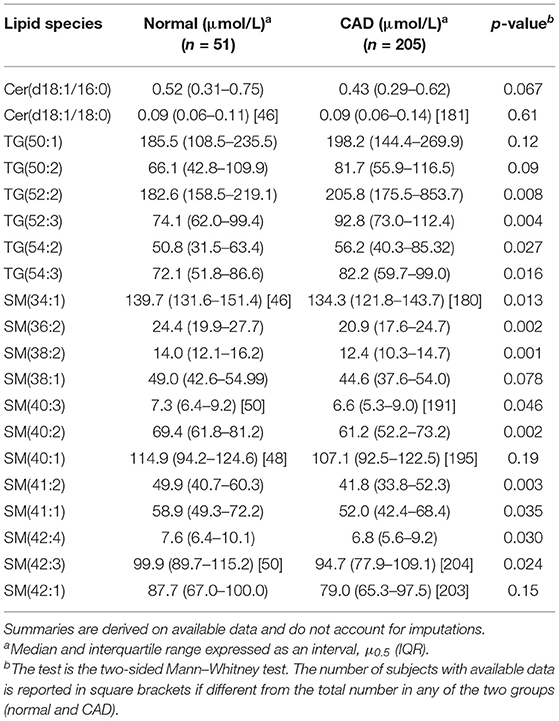
Table 2. Considered ceramides, triglycerides, and sphingomyelins.
MRT Validation and Re-Estimation
The probability of minimal risk in the SMARTool cohort was firstly computed using the published MRT coefficients (4). Regression assessment of calibration-in-the-large did not show a significant difference between the mean observed outcome and the MRT predicted probability (19.9 vs. 21.1%, p = 0.62). The predicted vs. observed risk plots (Supplementary Figure 1) highlighted possible miscalibration, in men especially (HL-p = 0.09): the overall HL test based on the default of 10 groups (deciles) resulted in a good fit (p = 0.20), but the test was proven to be highly sensitive to the choice of group number (33), as indicated by HL-p values close to the significance level (p < 0.075) for the group numbers from 5 to 9 and for a few higher group numbers. The overall effect of the MRT predictors was significantly reduced in our cohort (p = 0.003), and in particular, the effect of sex was significantly smaller in the PROMISE cohort than that in the SMARTool population (p = 0.001). These results indicated that the model required updating. Among the MRT variables, only age, sex, smoking, diabetes, and hypertension were retained by the backward selection procedure (Table 3). The re-estimated model (reMRT) demonstrated an improved and more stable overall goodness of fit (p = 0.14) in men as well (p = 0.57), while the fit was worse in women (p = 0.02). The discrimination capability of reMRT was slightly higher (0.8463 vs. 0.8327, p = 0.31; 95% De Long confidence interval = 0.7856–0.9071) than that of the MRT, but the difference was not significant (see the comparison of the two ROC curves in Figure 1).
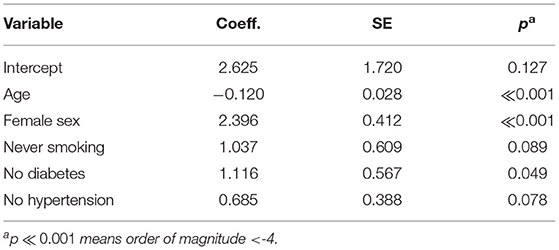
Table 3. Updated minimal risk tool: estimated coefficients.
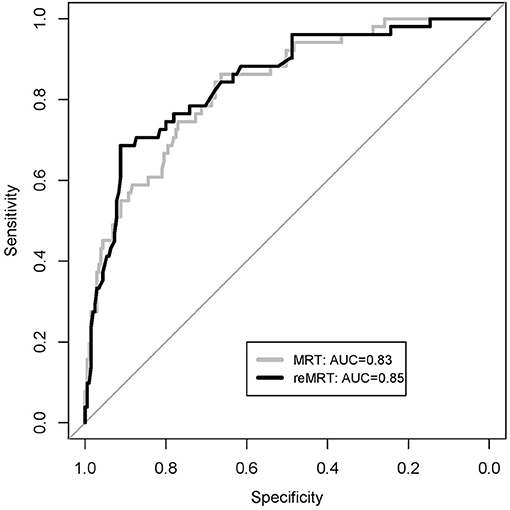
Figure 1. Receiver operating characteristic (ROC) curves of the minimal risk tool (MRT) model and the re-estimated MRT model (reMRT) on the SMARTOOL cohort.
To better understand the effect of re-estimation, changes in risk classification due to updating have been described by the net reclassification index (NRI) at event rate (34). Table 4 shows that the reMRT improved the correct classification of CAD patients (NRI– = 0.117, lower limit = 0.06, upper limit = 0.17), while it slightly worsened the classification of normal subjects (NRI+ = −0.098, lower limit = −0.20, upper limit = 0). The total NRI(p) at p = 19.9% was 0.019 (lower limit = −0.09, upper limit = 0.13).
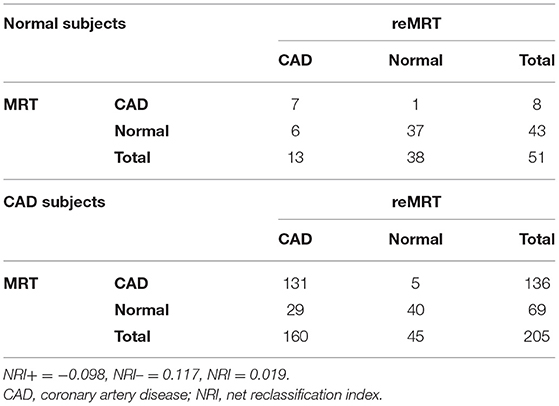
Table 4. Reclassification tables between the minimal risk tool (MRT) original model and the re-estimated model (reMRT) on the SMARTOOL cohort.
LRT Analysis: Predictive Improvement of Lipids
Except for SM(34:1) with only 226 values, the LRT was carried out on a subset of at least 240 subjects for each lipid (see Table 2). The probability of being at minimal risk was significantly better estimated by adding either Cer(d18:1/16:0) (p = 0.01), SM(40:2) (p = 0.04), or SM(41:1) at a lesser extent (p = 0.052) to reMRT than by applying the reMRT alone. The sensitivity analysis confirmed this result, as shown in Table 5. In fact, both the basic model and the basic-hsTnT model were suitable for the sensitivity analysis due to a good fit to the data (HL-p>0.50) and a high discrimination capability (AUC values of 0.8323 and 0.8807, respectively), as shown in Supplementary Table 1. Moreover, a few additional contributions were identified. Compared to reMRT, the prediction capabilities of the basic model were also enhanced by SM(34:1) (p = 0.003) and SM(41:2) (p = 0.03). Finally, compared to the previous two baseline models, the prediction capabilities of the basic-hs-cTnT model were also improved by SM(38:2) and SM(42:2) (p = 0.03 in both cases).
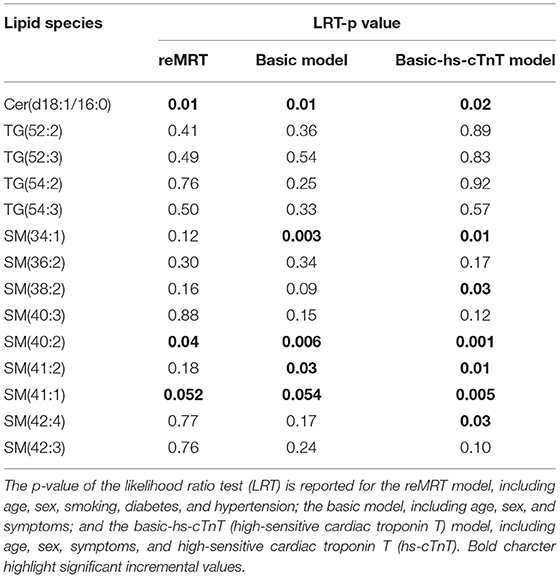
Table 5. Significance of the incremental values of selected lipids over the re-estimated minimal risk tool (reMRT) and the two alternative baseline models for the purpose of sensitivity analysis.
As a further step, the lipids Cer(d18:1/16:0), SM(40:2), SM(34:1), SM(41:1), SM(41:2), SM(38:2), and SM(42:4) were simultaneously considered in a multivariable logistic model to evaluate their joint value for predictive improvement. The model was fitted on the 226 subjects with complete data on all these variables. With the backward selection method, SM(41:1) and SM(41:2) were discarded.
The selected model is summarized in Table 6. The enhanced linear predictor was then obtained by adding (on top) the linear predictor coming from Table 6 to the reMRT and the other baseline models. The LRT indicated a very strong predictive improvement when Cer(d18:1/16:0), SM(40:2), SM(34:1), SM(38:2), and SM(42:4) are jointly considered (p < 0.00001), regardless of the baseline model.
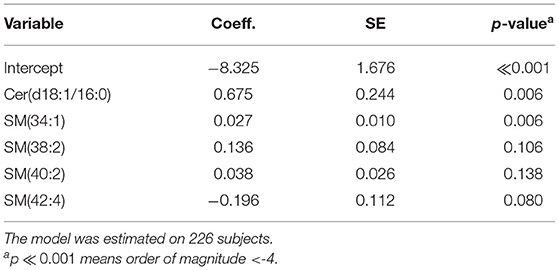
Table 6. Multivariable logistic regression estimated model.
Table 5 shows that none of the differently expressed triglycerides brought significant added value, regardless of the baseline model (p≥0.25).
Discussion
It is well-known that coronary artery disease is present only in a percentage of patients referred to diagnostic testing for chest pain and that as many as one-fourth of the CCTAs performed as the recommended first-line test are unnecessary. Therefore, the application in clinical practice of a predictive model able to directly exclude the majority of patients without coronary lesions from unnecessary diagnostic testing before referral is highly relevant to optimize patient management and for cost effectiveness (35–37). Minimizing unnecessary tests, procedures, and costs is an increasing need in the last years (4, 24, 38). The usually suggested way of ruling out CAD is based on a pretest probability of obstructive CAD lower than a given threshold, usually from 5 to 15%, for instance (1, 39, 40).
Such a rule-out strategy may not be completely efficient, as also recently demonstrated (41). When a model built to discriminate obstructive CAD like ESC-PTP is used to also discriminate the absence of atherosclerosis, this eventuality is part of the game, as also noted by Adamson et al. (5). Indeed, when predictive probability models are empirically derived, a set of variables proving to be good predictors of obstructive CAD can fail to discriminate subjects at minimal risk, and vice versa (42, 43). The major novelty introduced by the MRT is its being the first model proposing an endpoint directly aimed at identifying those subjects with normal arteries (3), and for this reason, we have chosen it as the baseline model for testing the added value of a few targeted lipids as novel and useful biomarkers to rule out CAD.
Several serum sphingolipids have been proposed as independent biomarkers of clinically manifest CAD. Lipid-based test scores, such as CERT2 (10), are widely recognized for their prognostic value for any type of cardiovascular event, and significant associations with non-calcified coronary artery plaque burden assessed by CCTA have been reported (44). Recently, it has been found that, in statin users, the CAD severity and atherosclerotic lipid burden assessed by CCTA are significantly associated with specific circulating lipid species among the classes of SMs and PEs (13). Sphingolipids play an important role in intracellular signal transduction and regulate cellular processes such as proliferation, maturation, and apoptosis; they are also involved in cellular stress responses. It is known that atherosclerosis can increase sphingomyelinase (SMase) activity, consequently altering ceramide and sphingomyelin plasma concentrations (45). Additionally, SMs are reported to be the second most abundant phospholipid component and the major sphingolipid in HDL particles (46), which play a crucial role in atheroprotection by driving reverse cholesterol transport, and lipid changes in HDL composition can reduce their cholesterol efflux capacity. In details, the beneficial role attributed to HDL-C actually is thought to reflect the multiple cardioprotective properties of HDL particles, which primarily include its capacity to efflux cholesterol from peripheral cells (reverse cholesterol transport, RCT), but may also involve antioxidative, anti-inflammatory, anti-apoptotic, anti-thrombotic, anti-infectious, and anti-diabetic activities (47). Nevertheless, conflicting evidences are recently emerging on the protective role of HDL-C in cardiovascular health. Observations of hereditary syndromes featuring scant HDL-C in the absence of premature atherosclerotic disease and very high levels of this lipoprotein that do not appear to grant additional benefits indicate that HDL-C level per se may not be a good predictor of cardiovascular disease. Indeed, current knowledge suggests that the biological activity of HDL may not depend solely on its concentration but also on its quality, as alterations in various structural components lead to a state of dysfunction independently of their serum concentrations (48). In this context, the cholesterol efflux capacity of HDL appears a more effective feature in predicting cardiovascular disease than does the HDL-C level. SM species are reported to be one of the most abundant lipid components in HDL particles and, according to their surface distributions, play a key role on cholesterol efflux capacity. Dysfunctional HDL exhibits 25% less lipids per milligram of protein, reflecting lower contents of SM and PC, and a substitution of 50% of cholesteryl ester for TG (49). These lipid changes can alter the anti-atherogenic HDL assets, reducing their cholesterol efflux capacity and hindering RCT. Accordingly, from a pathophysiological point of view, the dysregulation of particular lipid species might reflect the functionality of HDLs better than the overall HDL-C plasma level.
The results of the present proof-of-concept study extend the clinical relevance of all these previous evidences by demonstrating that the plasma concentrations of some plasma sphingolipids, which are significantly associated with coronary atherosclerosis per se, provide an increased predictive value when added to the MRT model for ruling out CAD.
We validated the MRT on a small population with a low prevalence of subjects at minimal risk. In principle, the MRT is an appropriate pretest stratification model also for our population, where no links between patient-reported symptom presentation and obstructive CAD is observed, in agreement with previous studies (50–52). At a first analysis, the model has shown calibration in-the-large on the SMARTool cohort and a good fit. A more in-depth validation procedure, however, allowed us to gain deeper insights into the need for a model re-estimation, essentially due to a significantly higher effect of the gender variable in our cohort than that in the PROMISE cohort. The re-estimated model, reMRT, did not include the basic lipid profile of the patients (dyslipidemia and HDL) or a family history of CAD in the selected predictors. From a methodological point of view, a comparison with the validations carried out on the SCOT-HEART (5) and the Dan-NICAD (6) populations is not possible. In the former case, erroneous coefficients were used (4, 52); in the latter, a different validation procedure based on calibration plots was applied.
Then, the reMRT was used as a baseline model to assess the improvements provided by each of a few targeted lipids in the prediction of subjects at minimal risk. Among the considered outcome-associated lipids, one ceramide, Cer(d18:1/16:0), and two sphingomyelins, SM(40:2) and SM(41:1), were able to add predictive value to the model in ruling out coronary atherosclerosis.
The sensitivity analysis confirmed the results obtained in reMRT: Cer(d18:1/16:0), SM(40:2), and SM(41:1) added significant value to the other two different models as well, slightly weaker in the case of SM(41:1) only.
In addition, when the basic-hs-cTnT model is considered as a baseline model, also SM(34:1), SM(38:2), SM(41:2), and SM(42:4) added a significant value. This finding supports the potential additive predictive value of SMs also in combination with a novel sensitive biomarker such as high-sensitive troponin T (hs-cTnT), currently regarded as a marker of not only myocardial injury in acute coronary syndrome but also of CAD severity in stable ischemic heart disease (53). In our analysis, hs-cTnT, which had a strong association with the normal condition in our study population (p ≪ 0.001), is in turn able to significantly increase the probability of excluding the presence of CAD when added to the reMRT model (p = 0.008). Moreover, when we limited to the subpopulation of 225 subjects with complete data on all the variables, the basic-hs-cTnT model showed the highest discrimination capability among the three baseline models [0.8807 vs. 0.8467 (reMRT) and 0.8392 (basic), DeLong 95% confidence interval = 0.8288–0.9327], albeit not statistically significant when compared to reMRT (p = 0.20), as expected due to the high AUC values and small sample size (54).
The major limitation of this study is the low absolute number of subjects in the two groups (normal and CAD) undergoing plasma lipidomics and CCTA. Moreover, the lipid and hs-cTnT concentrations were not available in about one-tenth of patients, further reducing the study cohort in part of the analysis. Finally, an unbalance in gender, with a low number of females in the overall cohort (37.5%) due to an enrollment strategy focused on suspected coronary artery disease and indication to perform CCTA and a strong prevalence (72.5%) of females in the group of normal subjects, must be acknowledged. Although this limit has been partially addressed by recalibration and re-estimation of the MRT model in our cohort, we cannot completely exclude a gender effect on the main findings of our study. This would represent a major concern when developing a clinical PTP model based on the current results: a larger and more gender-balanced derivation and validation population would then be necessary, as already planned for future development.
Conclusions
We found that the plasma concentrations of specific sphingolipids [Cer(d18:1/16:0), SM(40:2), and SM(41:1)] can improve the accuracy of pretest stratification of suspected CAD patients referred to CCTA when added to the MRT model. The correct identification of these subjects, who derive minimal benefit and value from diagnostic tests such as the CCTA, meets the clinical need of a more cost-efficient use of diagnostic imaging with a reduction of unnecessary radiation exposure for subjects and operators. The results of our proof-of-concept study support the future exploitation of plasma lipidomics-derived biomarkers in clinical practice, not only to improve the prediction of obstructive CAD, vulnerable plaques, or long-term adverse cardiovascular outcomes but also to help ruling out coronary atherosclerosis in patients referred to CCTA as the first-line test for suspected CAD.
Data Availability Statement
The original contributions presented in the study are included in the article/Supplementary Material, further inquiries can be directed to the corresponding author/s.
Ethics Statement
The studies involving human participants were reviewed and approved by Ethical Commitee of Area Vasta Nord-Ovest (Italy). The patients/participants provided their written informed consent to participate in this study.
Author Contributions
AB designed the statistical approach, conducted the statistical analysis, and wrote the original draft of the manuscript. EM, ND, CC, and GS conducted the experimental investigation on lipidomics and biohumoral data and helped review the manuscript. DN, JS, and AS conducted the patient enrollment and CCTA image analysis. PM and CL provided feedback on statistical analysis and methodology and helped write and review the manuscript. GP collected and organized all data from clinical to CCTA and lipidomics and wrote and reviewed the manuscript. SR wrote and reviewed the manuscript, managed the project, and obtained research funding. All authors have read and agreed to the published version of the manuscript.
Funding
This research was funded by the European Commission: Project SMARTool, Simulation Modeling of coronary ARTery disease: a tool for clinical decision support—SMARTool (GA no. 689068).
Conflict of Interest
The authors declare that the research was conducted in the absence of any commercial or financial relationships that could be construed as a potential conflict of interest.
Acknowledgments
We would like to thank all SMARTool Clinical Investigators who make possible patient enrollments and the availability of clinical data, CCTAs, and blood samples.
Supplementary Material
The Supplementary Material for this article can be found online at: https://www.frontiersin.org/articles/10.3389/fcvm.2021.682785/full#supplementary-material
References
1. Knuuti J, Wijns W, Saraste A, Capodanno D, Barbato E, Funck-Brentano C, et al. ESC Scientific Document Group, 2019 ESC Guidelines for the diagnosis and management of chronic coronary syndromes: the Task Force for the diagnosis and management of chronic coronary syndromes of the European Society of Cardiology (ESC). Eur Heart J. (2020) 41:407–77. doi: 10.1093/eurheartj/ehz425
2. Knuuti J, Ballo H, Juarez-Orozco LE, Saraste A, Kolh P, Rutjes AWS, et al. The performance of non-invasive tests to rule-in and rule-out significant coronary artery stenosis in patients with stable angina: a meta-analysis focused on post-test disease probability. Eur Heart J. (2018) 39:3322–30. doi: 10.1093/eurheartj/ehy267
3. Mincarone P, Bodini A, Tumolo MR, Vozzi F, Rocchiccioli S, Pelosi G, et al. Validated models for pre-test probability of stable coronary artery disease: a systematic review suggesting how to improve validation procedures. BMJ Open. (2021) 1–19.
4. Fordyce CB, Douglas PS, Roberts RS, Hoffmann U, Al-Khalidi HR, Patel MR, et al. Prospective Multicenter Imaging Study for Evaluation of Chest Pain (PROMISE) Investigators. Identification of patients with stable chest pain deriving minimal value from noninvasive testing: the PROMISE minimal-risk tool, a secondary analysis of a randomized clinical trial. JAMA Cardiol. (2017) 2:400–8. doi: 10.1001/jamacardio.2016.5501
5. Adamson PD, Fordyce CB, McAllister DA, Udelson JE, Douglas PS, Newby DE. Identification of patients with stable chest pain deriving minimal value from coronary computed tomography angiography: an external validation of the PROMISE minimal-risk tool. Int J Cardiol. (2018) 252:31–4. doi: 10.1016/j.ijcard.2017.09.033
6. Rasmussen LD, Nissen L, Westra J, Knudsen LL, Madsen LH, Holm NR, et al. Validation and update of the minimal risk tool in patients suspected of chronic coronary syndrome. Int J Cardiovasc Imaging. (2020) 20:1982. doi: 10.1007/s10554-020-01982-7
7. McGarrah RW, Crown SB, Zhang GF, Shah SH, Newgard CB. Cardiovascular Metabolomics. Circ Res. (2018) 122:1238–58. doi: 10.1161/CIRCRESAHA.117.311002
8. Ekroos K, Jänis M, Tarasov K, Hurme R, Laaksonen R. Lipidomics: a tool for studies of atherosclerosis. Curr Atheroscler Rep. (2010) 12:273–81. doi: 10.1007/s11883-010-0110-y
9. Mantovani A, Bonapace S, Lunardi G, Canali G, Dugo C, Vinco G, et al. Associations between specific plasma ceramides and severity of coronary-artery stenosis assessed by coronary angiography. Diabetes Metab. (2020) 46:150–7. doi: 10.1016/j.diabet.2019.07.006
10. Hilvo M, Meikle PJ, Pedersen ER, Tell GS, Dhar I, Brenner H, et al. Development and validation of a ceramide- and phospholipid-based cardiovascular risk estimation score for coronary artery disease patients. Eur Heart J. (2020) 41:371–80. doi: 10.1093/eurheartj/ehz387
11. Poss AM, Maschek JA, Cox JE, Hauner BJ, Hopkins PN, Hunt SC, et al. Machine learning reveals serum sphingolipids as cholesterol-independent biomarkers of coronary artery disease. J Clin Invest. (2020) 130:1363–76. doi: 10.1172/JCI131838
12. Ding M, Rexrode KM. A review of lipidomics of cardiovascular disease highlights the importance of isolating lipoproteins. Metabolites. (2020) 10:163. doi: 10.3390/metabo10040163
13. Michelucci E, Di Giorgi N, Finamore F, Smit JM, Scholte AJHA, Signore G, et al. Lipid profile in statin users with coronary artery disease annotated by Coronary Computed Tomography Angiography. Nat Sci Rep. (2021) 11:12899. doi: 10.1038/s41598-021-92339-0
14. Hlatky MA, Greenland P, Arnett DK, Ballantyne CM, Criqui MH, Elkind MSV, et al. Criteria for evaluation of novel markers of cardiovascular risk: a scientific statement from the American Heart Association. Circulation. (2009) 119:2408–16. doi: 10.1161/CIRCULATIONAHA.109.192278
15. Moons KGM, de Groot JAH, Linnet K, Reitsma JB. Bossuyt PMM. Quantifying the added value of a diagnostic test or marker. Clin Chem. (2012) 58:1408–17. doi: 10.1373/clinchem.2012.182550
16. Khan SS, Cooper R, Greenland P. Do polygenic risk scores improve patient selection for prevention of coronary artery disease? JAMA. (2020) 323:614–5. doi: 10.1001/jama.2019.21667
17. Cook NR. Quantifying the added value of new biomarkers: how and how not. Diagn Progn Res. (2018) 2:14. doi: 10.1186/s41512-018-0037-2
18. Diamond GA, Forrester JS. Analysis of probability as an aid in the clinical diagnosis of coronary-artery disease. N Engl J Med. (1979) 300:1350–8. doi: 10.1056/NEJM197906143002402
19. Caselli C, Prontera C, Liga R, De Graaf MA, Gaemperli O, Lorenzoni V, et al. Effect of coronary atherosclerosis and myocardial ischemia on plasma levels of high-sensitivity troponin T and NT-proBNP in patients with stable angina. Arterioscler Thromb Vasc Biol. (2016) 36:757–64. doi: 10.1161/ATVBAHA.115.306818
20. Folch J, Lees M, Sloane Stanley GHA. simple method for the isolation and purification of total lipides from animal tissues. J Biol Chem. (1957) 226:497–509. doi: 10.1016/S0021-925864849-5
21. Austen WG, Edwards JE, Frye RL, Gensini GG, Gott VL, Griffith LS, et al. A reporting system on patients evaluated for coronary artery disease report of the ad hoc Committee for Grading of Coronary Artery Disease, Council on Cardiovascular Surgery. Am Heart Assoc Circul. (1975) 51:5–40. doi: 10.1161/01.CIR.51.4.5
22. Cury RC, Abbara S, Achenbach S, Agatston A, Berman DS, Budoff MJ, et al. CAD-RADS(TM) coronary artery disease - reporting and data system. An expert consensus document of the Society of Cardiovascular Computed Tomography (SCCT), the American College of Radiology (ACR) and the North American Society for Cardiovascular Imaging (NASCI) Endorsed by the American College of Cardiology. J Cardiovasc Comput Tomogr. (2016) 10:269–81. doi: 10.1016/j.jcct.2016.04.005
23. R Core Team. R: A Language and Environment for Statistical Computing. Vienna: R Foundation for Statistical Computing. (2018). Available online at: https://www.R-project.org/ (accessed October 1, 2020).
24. Genders TS, Steyerberg EW, Alkadhi H, Leschka S, Desbiolles L, Nieman K, et al. A clinical prediction rule for the diagnosis of coronary artery disease: validation, updating, and extension. Eur Heart J. (2011) 32:1316–30. doi: 10.1093/eurheartj/ehr014
25. Vickers AJ, Cronin AM, Begg CB. One statistical test is sufficient for assessing new predictive markers. BMC Med Res Methodol. (2011) 11:13. doi: 10.1186/1471-2288-11-13
26. Pepe MS, Kerr KF, Longton G, Wang Z. Testing for improvement in prediction model performance. Stat Med. (2013) 32:1467–82. doi: 10.1002/sim.5727
27. Zeileis A, Hothorn T. Diagnostic Checking in Regression Relationships. R News (2002). p. 7–10. Available online at: https://cran.r-project.org/doc/Rnews/Rnews_2002-3.pdf (accessed October 1, 2020).
28. Korosoglou G, Lehrke S, Mueller D, Hosch W, Kauczor HU, Humpert PM, et al. Determinants of troponin release in patients with stable coronary artery disease: insights from CT angiography characteristics of atherosclerotic plaque. Heart. (2011) 97:823–31. doi: 10.1136/hrt.2010.193201
29. Rusnak J, Fastner C, Behnes M, Mashayekhi K, Borggrefe M, Akin I. Biomarkers in stable coronary artery disease. Curr Pharm Biotechnol. (2017) 18:456–71. doi: 10.2174/1389201018666170630120805
30. Welsh P, Preiss D, Hayward C, Shah ASV, McAllister D, Briggs A, et al. Cardiac troponin T and troponin I in the general population. Circulation. (2019) 139:2754–64. doi: 10.1161/CIRCULATIONAHA.118.038529
31. Brophy JM, Dagenais GR, Boyer L, Garcia-Labbé D, Bogaty P. Variability in high-sensitivity cardiac troponin T testing in stable patients with and without coronary artery disease. Can J Cardiol. (2019) 35:1505–12. doi: 10.1016/j.cjca.2019.08.022
32. Tu C, Xie L, Wang Z, Zhang L, Wu H, Ni W, et al. Association between ceramides and coronary artery stenosis in patients with coronary artery disease. Lipids Health Dis. (2020) 19:151. doi: 10.1186/s12944-020-01329-0
33. Hosmer DW, Lemeshow S. Applied Logistic Regression. 2nd ed. Wiley-Interscience Publication (2000). p. 375. doi: 10.1002/0471722146
34. Pencina MJ, Steyerberg EW, D'Agostino RB. Net reclassification index at event rate: properties and relationships. Statist Med. (2017) 36: 4455–67. doi: 10.1002/sim.7041
35. Butala NM. Cardiac noninvasive diagnostic testing for outpatient chest pain: rethinking “less is more”. J Am Heart Assoc. (2020) 9:e017408. doi: 10.1161/JAHA.120.017408
36. Siontis George CM, Dimitris M, Greenwood John P, Bernadette C, Adriani N, Peter J, et al. Outcomes of non-invasive diagnostic modalities for the detection of coronary artery disease: network meta-analysis of diagnostic randomised controlled trials. BMJ. (2018) 360:k504. doi: 10.1136/bmj.k504
37. Roifman I, Sivaswamy A, Chu A, Austin PC, Ko DT, Douglas PS, et al. Clinical effectiveness of cardiac noninvasive diagnostic testing in outpatients evaluated for stable coronary artery disease. J Am Heart Assoc. (2020) 9:e015724. doi: 10.1161/JAHA.119.015724
38. Genders TSS, Steyerberg EW, Nieman K, Galema TW, Mollet NR, Krestin GP, et al. Prediction model to estimate presence of coronary artery disease: retrospective pooled analysis of existing cohorts. BMJ. (2012) 344:e3485. doi: 10.1136/bmj.e4476
39. Bittencourt MS, Hulten E, Polonsky TS, Hoffman U, Nasir K, Abbara S, et al. European society of cardiology-recommended coronary artery disease consortium pretest probability scores more accurately predict obstructive coronary disease and cardiovascular events than the diamond and forrester score: the partners registry. Circulation. (2016) 134:201–11. doi: 10.1161/CIRCULATIONAHA.116.023396
40. Zhang Y, Liu Y, Zhang H, Zhou J. Impact of sex-specific differences in calculating the pretest probability of obstructive coronary artery disease in symptomatic patients: a coronary computed tomographic angiography study. Coron Artery Dis. (2019) 30:124–30. doi: 10.1097/MCA.0000000000000696
41. Rasmussen L, Nissen L, Westra J, Knudsen LL, Madsen LH, Johansen JK, et al. Combining minimal risk stratification and prediction of obstructive CAD – clinical utility of a dual pre-test probability model. Eur Heart J. (2020) 41(Suppl.2):ehaa946.1376. doi: 10.1093/ehjci/ehaa946.1376
43. Kadane JB, Lazar NA. Methods and criteria for model selection. J Am Statist Assoc. (2004) 99:279–90. doi: 10.1198/016214504000000269
44. Ellims AH, Wong G, Weir JM, Lew P, Meikle PJ, Taylor AJ. Plasma lipidomic analysis predicts non-calcified coronary artery plaque in asymptomatic patients at intermediate risk of coronary artery disease. Eur Heart J Cardiovasc Imaging. (2014) 15:908–16. doi: 10.1093/ehjci/jeu033
45. Borodzicz S, Czarzasta K, Kuch M, Cudnoch-Jedrzejewska A. Sphingolipids in cardiovascular diseases and metabolic disorders. Lipids Health Dis. (2015) 14:55. doi: 10.1186/s12944-015-0053-y
46. Martínez-Beamonte R, Lou-Bonafonte JM, Martínez-Gracia MV, Osada J. Sphingomyelin in high-density lipoproteins: structural role and biological function. Int J Mol Sci. (2013) 14:7716–41. doi: 10.3390/ijms14047716
47. Camont L, Chapman MJ, Kontush A. Biological activities of HDL subpopulations and their relevance to cardiovascular disease. Trends Mol Med. (2011) 17:594–603. doi: 10.1016/j.molmed.2011.05.013
48. Salazar J, Olivar LC, Ramos E, Chávez-Castillo M, Rojas J, Bermúdez V. Dysfunctional high-density lipoprotein: an innovative target for proteomics and lipidomics. Cholesterol. (2015) 2015:296417. doi: 10.1155/2015/296417
49. Pruzanski W, Stefanski E, de Beer FC, de Beer MC, Ravandi A, Kuksis A. Comparative analysis of lipid composition of normal and acute-phase high density lipoproteins. J Lipid Res. (2000) 41:1035–47. doi: 10.1016/S0022-227532007-1
50. Alexander KP, Newby LK, Cannon CP, Armstrong PW, Gibler WB, Rich MW, et al. American Heart Association Council on Clinical Cardiology; Society of Geriatric Cardiology. Acute coronary care in the elderly, part I: Non-ST-segment-elevation acute coronary syndromes: a scientific statement for healthcare professionals from the American Heart Association Council on Clinical Cardiology: in collaboration with the Society of Geriatric Cardiology. Circulation. (2007) 115:2549–69. doi: 10.1161/CIRCULATIONAHA.107.182615
51. Alexander KP, Newby LK, Armstrong PW, Cannon CP, Gibler WB, Rich MW, et al. American Heart Association Council on Clinical Cardiology; Society of Geriatric Cardiology. Acute coronary care in the elderly, part II: ST-segment-elevation myocardial infarction: a scientific statement for healthcare professionals from the American Heart Association Council on Clinical Cardiology: in collaboration with the Society of Geriatric Cardiology. Circulation. (2007) 115:2570–89. doi: 10.1161/CIRCULATIONAHA.107.182616
52. Edlinger M, Wanitschek M, Dörler J, Ulmer H, Alber HF, Steyerberg EW. External validation and extension of a diagnostic model for obstructive coronary artery disease: a cross-sectional predictive evaluation in 4,888 patients of the Austrian Coronary Artery disease Risk Determination In Innsbruck by diaGnostic ANgiography (CARDIIGAN) cohort. BMJ Open. (2017) 7:e014467. doi: 10.1136/bmjopen-2016-014467
53. White HD. Clinically important improvements in risk assessment by adding high-sensitivity troponin level to cholesterol guidelines. JAMA Cardiol. (2020) 5:1263–4. doi: 10.1001/jamacardio.2020.2996
Keywords: biomarkers evaluation, coronary artery disease, lipidomics, coronary computed tomography angiography, likelihood ratio test, pre-test clinical models
Citation: Bodini A, Michelucci E, Di Giorgi N, Caselli C, Signore G, Neglia D, Smit JM, Scholte AJHA, Mincarone P, Leo CG, Pelosi G and Rocchiccioli S (2021) Predictive Added Value of Selected Plasma Lipids to a Re-estimated Minimal Risk Tool. Front. Cardiovasc. Med. 8:682785. doi: 10.3389/fcvm.2021.682785
Received: 19 March 2021; Accepted: 10 June 2021;
Published: 16 July 2021.
Edited by:
Zhonghua Sun, Curtin University, AustraliaReviewed by:
Timothy P. Fitzgibbons, University of Massachusetts Medical School, United StatesNhat Tu Le, Houston Methodist Research Institute, United States
Copyright © 2021 Bodini, Michelucci, Di Giorgi, Caselli, Signore, Neglia, Smit, Scholte, Mincarone, Leo, Pelosi and Rocchiccioli. This is an open-access article distributed under the terms of the Creative Commons Attribution License (CC BY). The use, distribution or reproduction in other forums is permitted, provided the original author(s) and the copyright owner(s) are credited and that the original publication in this journal is cited, in accordance with accepted academic practice. No use, distribution or reproduction is permitted which does not comply with these terms.
*Correspondence: Antonella Bodini, antonella.bodini@mi.imati.cnr.it