Multiparametric vs. Inferior Vena Cava–Based Estimation of Right Atrial Pressure
 Matteo Toma1,2
  Stefano Giovinazzo1
  Gabriele Crimi1 Giovanni Masoero1 Manrico Balbi1,2
  Fabrizio Montecucco2,3 Marco Canepa1,2 Italo Porto1,2
  Pietro Ameri1,2*
- 1Cardiovascular Disease Unit, Istituto di Ricerca e Cura a Carattere Scientifico Ospedale Policlinico San Martino, IRCCS Italian Cardiology Network, Genova, Italy
- 2Department of Internal Medicine, University of Genova, Genova, Italy
- 3First Clinic of Internal Medicine, IRCCS Ospedale Policlinico San Martino, IRCCS Italian Cardiology Network, Genova, Italy
Background: Right atrial pressure (RAP) can be estimated by echocardiography from inferior vena cava diameter and collapsibility (eRAPIVC), tricuspid E/e′ ratio (), or hepatic vein flow (eRAPHV). The mean of these estimates (eRAPmean) might be more accurate than single assessments.
Methods and Results: eRAPIVC, , eRAPHV (categorized in 5, 10, 15, or 20 mmHg), eRAPmean (continuous values) and invasive RAP (iRAP) were obtained in 43 consecutive patients undergoing right heart catheterization [median age 69 (58–75) years, 49% males]. There was a positive correlation between eRAPmean and iRAP (Spearman test r = 0.66, P < 0.001), with Bland–Altman test showing the best agreement for values <10 mmHg. There was also a trend for decreased concordance between eRAPIVC, , eRAPHV, and iRAP across the 5- to 20-mmHg categories, and iRAP was significantly different from and eRAPHV for the 20-mmHg category (Wilcoxon signed-rank test P = 0.02 and P < 0.001, respectively). The areas under the curve in predicting iRAP were nonsignificantly better for eRAPmean than for eRAPIVC at both 5-mmHg [0.64, 95% confidence interval (CI) 0.49–0.80 vs. 0.70, 95% CI 0.53–0.87; Wald test P = 0.41] and 10-mmHg (0.76, 95% CI 0.60–0.92 vs. 0.81, 95% CI 0.67–0.96; P = 0.43) thresholds.
Conclusions: Our data suggest that multiparametric eRAPmean does not provide advantage over eRAPIVC, despite being more complex and time-consuming.
Introduction
Right atrial pressure (RAP) is an important prognostic factor in pulmonary hypertension (PH), regardless of whether this latter is due to pulmonary vascular disease, especially pulmonary arterial hypertension (PAH), or heart failure (HF) (1–3).
RAP estimation (eRAP) is usually performed by echocardiography, by assigning a value on a 5-mmHg scale based on inferior vena cava (IVC) diameter and respiratory variation (eRAPIVC) (4–6). Alternatively, RAP may be estimated by assessing the tricuspid E/e′ ratio () or by analyzing the hepatic vein (HV) pulsed wave (PW) Doppler spectra (eRAPHV) (4, 7–10). All these approaches have limited accuracy (11–13), and it has recently been suggested that the mean of eRAPIVC, and eRAPHV (eRAPmean) is more accurate than eRAPIVC (14). However, this method has been tested only in patients with a left ventricular assist device (LVAD) (14).
The scope of this study was to investigate the correlation between eRAPmean and its components, including eRAPIVC, and invasively measured RAP (iRAP) in a cohort of subjects undergoing right heart catheterization (RHC) for different reasons.
Methods
Study Population
In this prospective, observational, single-center study, we consecutively enrolled the patients who underwent RHC between September 2018 and January 2020 and had at least two components of eRAPmean measurements. For subjects undergoing multiple RHC during the study period, only the first one was considered. As per institutional policy on admission, all patients signed an informed consent to the use of their anonymized clinical data for research purposes. The study protocol was conducted in accordance with the ethical guidelines of the 1975 Declaration of Helsinki.
Echocardiography
A two-dimensional transthoracic echocardiogram was performed by two cardiologists (M.T. and S.G.) blinded to the results of RHC, on the same day of the hemodynamic assessment.
Standard images were acquired with the patient in the lateral decubitus position. Left ventricular (LV) dimensions and function were evaluated in the parasternal long-axis and apical four-chamber views. Mitral and aortic regurgitations were evaluated using color Doppler and continuous-wave Doppler in the apical four- and five-chamber views. LV diastolic function was examined through PW Doppler of the transmitral flow (E-wave and A-wave peak velocities, E/A ratio, deceleration time of the E-wave) and pulsed-tissue Doppler-derived e′ velocity of the septal mitral annulus. Right ventricular (RV) end-diastolic basal diameter, tricuspid annular plane systolic excursion (TAPSE), Tissue Doppler S′ peak velocity, fractional area change, and tricuspid regurgitation peak velocity (TRV) were assessed in the RV-focused apical four chamber view (4, 9, 15, 16). RV systolic pressure was computed from TRV with the simplified Bernoulli equation (4, 9).
IVC diameter was measured in the subcostal view just proximal to the junction of the HV, at end-expiration and then end-inspiration to determine the respiratory variation (4–6, 9). HV flow was evaluated by PW Doppler in the subcostal view. Peak systolic and diastolic wave velocities (Vs and Vd, respectively) and the relevant velocity-time intervals (VTIs and VTId) were measured, and then the HV systolic filling fraction (HVFF) was calculated as VTIs/(VTIs + VTId) (4, 7, 10). Tricuspid E/e′ ratio was derived by the tricuspid inflow E wave velocity (as determined by PW Doppler, with the sample volume at the tips of the leaflets during the RV-focused apical four-chamber view) and tricuspid lateral annulus e′ wave velocity (with tissue Doppler imaging) (4, 8, 9). As tricuspid inflow and HV flow are highly sensitive to the respiratory phase, measurements from multiple beats were averaged.
eRAPIVC, , and eRAPHV were given a value between 5 and 20 mmHg on a 5-mmHg scale as summarized in Table 1 and exemplified in Figure 1. eRAPmean was calculated as (eRAPIVC + + eRAPHV)/3 and thereby consisted of continuous values.
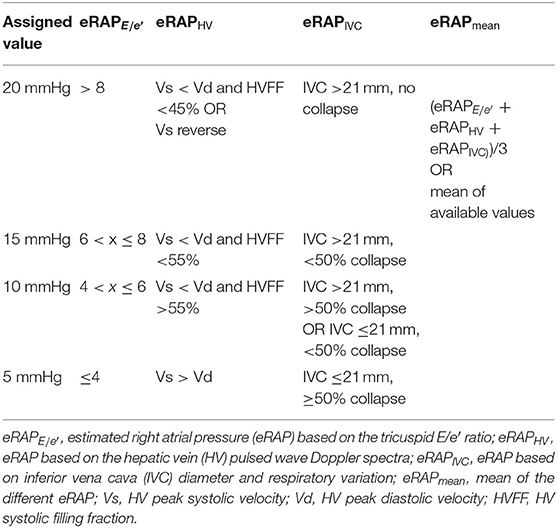
Table 1. Scoring system of right atrial pressure as estimated by echocardiography.
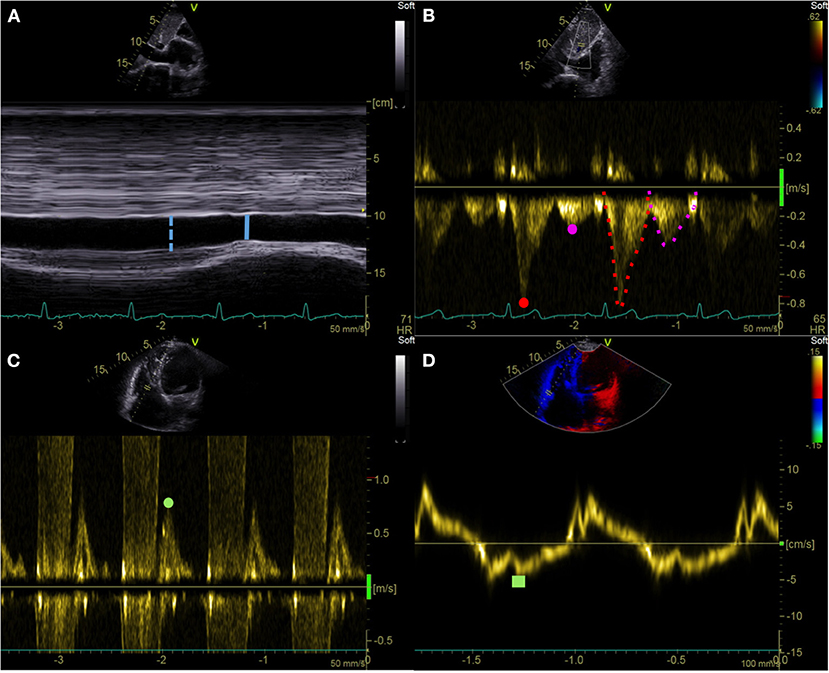
Figure 1. Echocardiographic right atrial pressure estimation. (A) IVC end-expiratory diameter (blue dotted line) and respiratory variation (solid line). (B) HV pulsed wave Doppler assessment: Vs (red dot), Vd (purple dot), VTIs (red dotted line), and VTId (purple dotted line). (C,D) Tricuspid E/e′ ratio: pulsed wave Doppler tricuspid inflow early E-wave peak velocity (green dot) and tricuspid lateral annulus tissue Doppler imaging e′ wave velocity (green square). IVC, inferior vena cava; HV, hepatic vein; Vs, hepatic vein peak systolic velocity; Vd, hepatic vein peak diastolic velocity; VTIs, velocity-time interval of the HV systolic wave; VTId, velocity-time interval of the HV diastolic wave.
Interobserver variability was quantified by weighted κ analysis, with k values of < 0.21, 0.21–0.40, 0.41–0.60, 0.61–0.80, and 0.81–1 being considered poor, fair, moderate, good, and very good agreement, respectively (17).
Right Heart Catheterization
RHC was performed under local anesthesia in the cardiac catheterization laboratory by other cardiologists (G.C., M.B., I.P., and P.A.), who were unaware of the results of the echocardiography. A balloon-tipped Swan-Ganz catheter was introduced through a sheath inserted into the femoral, antecubital, or jugular vein. The zero reference level was set at the midthoracic level. The catheter was advanced through the right heart chambers to the pulmonary artery, and pressures were measured. Then, the balloon was inflated, and the catheter was pushed forward up to the wedge position to record pulmonary artery wedge pressure. Finally, RV pressures and iRAP (mean over 5 cardiac cycles) were measured during catheter pull-back. Cardiac output was obtained by means of the thermodilution technique or Fick's indirect method (Dehmer formula), with the latter one being preferred in the presence of intracardiac or extracardiac shunts or severe tricuspid regurgitation.
Statistical Analysis
Statistical analyses were performed using IBM SPSS Statistics version 25.0. GraphPad Prism was also used to make the Figures.
Normality was assessed with the Kolmogorov–Smirnov test. Continuous variables are presented as mean ± standard deviation or median with interquartile range, as appropriate. Categorical variables are reported as absolute count and percentages. The relationship between iRAP and IVC diameter, tricuspid E/e′ ratio, HVFF, or eRAPmean was analyzed by Spearman correlation ρ test. The correlation between eRAPmean and iRAP was also visually appraised by the Bland–Altman method. Furthermore, the correspondence between iRAP and eRAPIVC, , and eRAPHV values was evaluated using the Wilcoxon signed-rank test. The 5- and 10-mmHg eRAP thresholds were tested against the same iRAP thresholds by receiver operating characteristic (ROC) areas under the curve (AUCs), and the eRAPHV, , and eRAPmean AUC were compared with the eRAPIVC AUC by means of the Wald test.
Because eRAPmean and its components had not been compared before, no expected difference between these assessments was available to set a minimum number of enrolled patients.
Results
Forty-three patients were included in the analysis. Their characteristics are shown in Table 2. The reasons for RHC were PH diagnosis (29 subjects, of whom 6 were found with PAH, 5 with chronic thromboembolic PH, and 4 with left heart disease–associated PH, and 14 did not actually have PH), PAH reassessment (10 subjects), or evaluation of HF eligibility to LVAD or heart transplant (4 subjects). Median age was 69 (58–75) years, and 28 (65%) patients were older than 65 years; male and female genders were equally distributed. Functional class was most often II, and median N-terminal pro–brain natriuretic peptide was 462 (114–2,045) ng/L. At the hemodynamic evaluation, median iRAP was 7 (3–11) mmHg, and 67% of the patients had an iRAP value below the 8-mmHg cutoff that identifies a higher risk of mortality (1, 18).
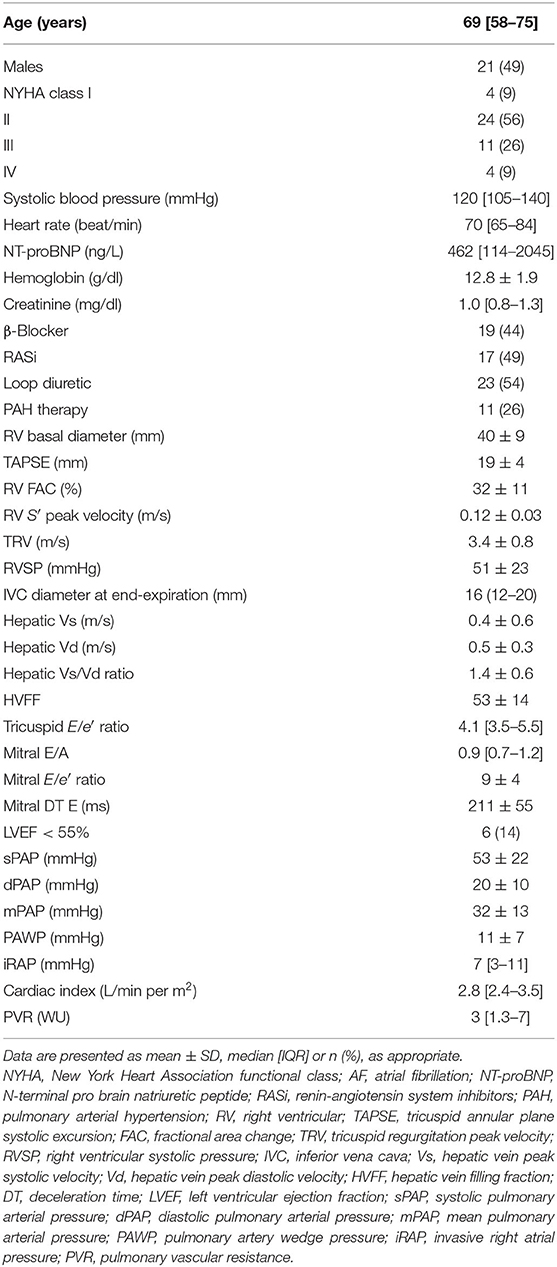
Table 2. Clinical, echocardiographic and hemodynamic characteristics of the study population.
Echocardiographic assessment of IVC was feasible in the entire study population, whereas HV parameters and tricuspid E/e′ ratio were not determinable in 4 and 2 patients, respectively. Interobserver agreement was very good (weighted k = 0.84, 0.90, and 0.87 for eRAPIVC, , eRAPHV, respectively). Median eRAPIVC, , eRAPHV, and eRAPmean were 5 (5–10), 5 (5–20), 10 (5–10), and 6.7 (5–11.7) mmHg, respectively.
The parameters from which eRAPIVC, , and eRAPHV are derived were positively correlated with iRAP: r was 0.47 for IVC diameter (P = 0.002), 0.44 for tricuspid E/e′ ratio (P = 0.004), and 0.46 for HVFF (P = 0.007). Consistently, there was also a positive correlation between eRAPmean and iRAP (r = 0.66, P < 0.001; Figure 2, left). The Bland–Altman plot showed that eRAPmean was in agreement with iRAP especially when ≤ 10 mmHg (Figure 2, right). For all eRAP components, 5 mmHg was the most frequent estimate, and the actual iRAP was not significantly different from it (Figure 3). For the 10-mmHg category, the concordance between eRAP components and iRAP was less frequent, particularly for and eRAPHV, although not to a statistically significant extent. For the 15-mmHg value, it was possible to test only the correlation between iRAP and eRAPIVC (no significant difference), as the number of and eRAPHV was too low. A statistically significant difference between iRAP and (P = 0.02) and eRAPHV (P < 0.001) was instead found for the 20-mmHg threshold (Figure 3).
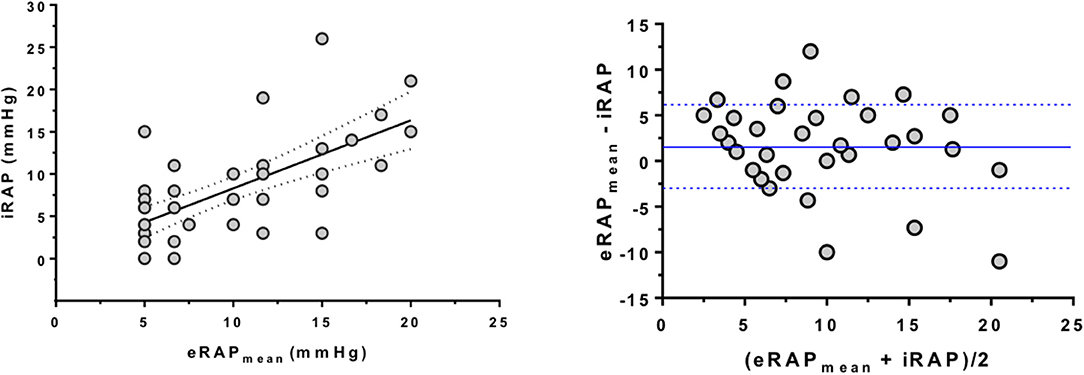
Figure 2. Correlation between multiparametric estimation and invasive measurement of right atrial pressure. (Left) Positive correlation between eRAPmean and iRAP as assessed by RHC (Spearman correlation test). (Right) Bland–Altman plot showing that estimation of iRAP by eRAPmean was especially good for values <10 mmHg. The blue lines represent the average ± 1 standard deviation of (eRAPmean and iRAP). Note that in both analyses some subjects had the same values, hence the relevant dots overlap in the graphs. eRAPmean, multiparametric estimated RAP; iRAP, invasive RAP; RHC, right heart catheterization.
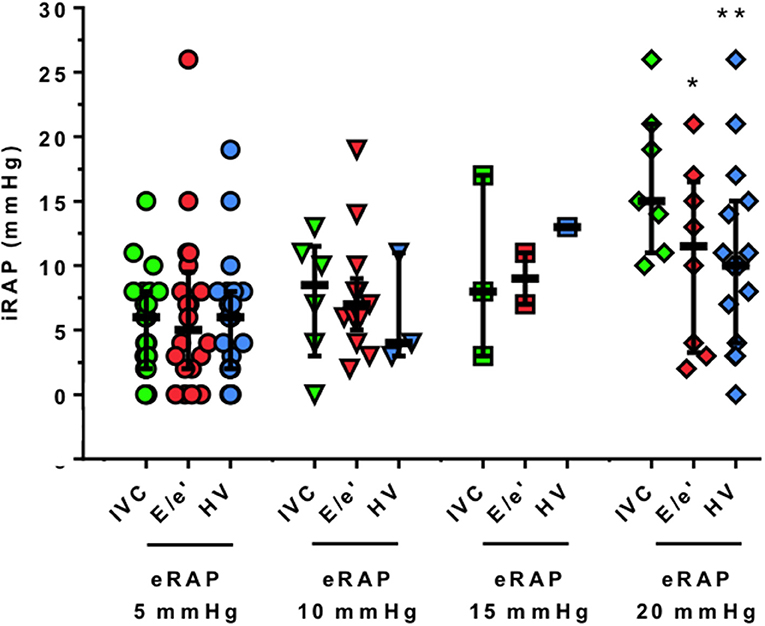
Figure 3. Correlation between single-parameter estimation and invasive measurement of right atrial pressure. The actual values of iRAP obtained during RHC are presented for each 5-mmHg threshold and by eRAP component. Horizontal bars indicate medians and interquartile ranges, *P < 0.05 and **P < 0.001, respectively (Wilcoxon signed-rank test). iRAP, invasive right atrial pressure; eRAP, estimated right atrial pressure; IVC, inferior vena cava; E/e′ ratio of pulsed wave Doppler tricuspid inflow early E-wave peak velocity and tricuspid lateral annulus tissue Doppler imaging e′ wave velocity; HV, hepatic veins.
The accuracy in predicting iRAP was numerically highest for eRAPmean for both the 5- and the 10-mmHg categories (Table 3 and Figure 4). Nonetheless, the AUC of eRAPmean was not significantly different from that of eRAPIVC, nor were the AUC of eRAPHV and (Table 3).
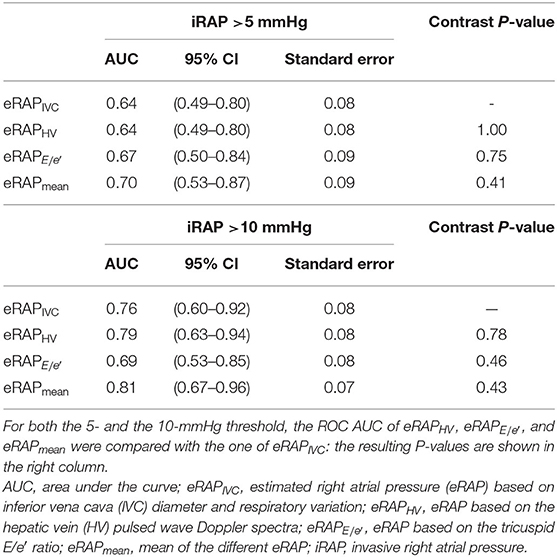
Table 3. Accuracy of the different methods for estimating right atrial pressure.
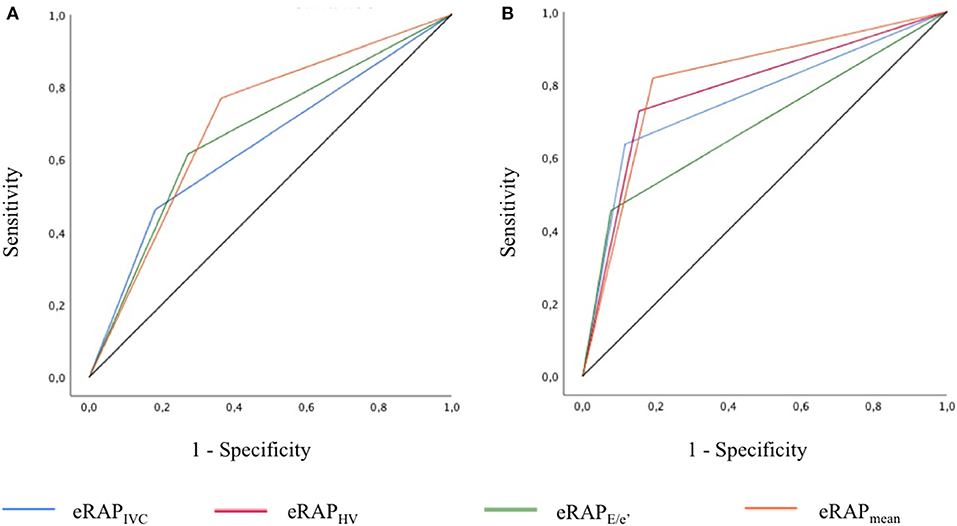
Figure 4. ROC curves showing the accuracy of the different modalities of estimation of right atrial pressure in predicting the actual value, as measured during right heart catheterization, for the 5-mmHg (A) and 10-mmHg (B) thresholds. In (A), the AUC of eRAPIVC and eRAPHV overlap. eRAPIVC, estimated right atrial pressure (eRAP) based on inferior vena cava (IVC) diameter and respiratory variation; eRAPHV, eRAP based on the hepatic vein (HV) pulsed wave Doppler spectra; eRAPE/e', eRAP based on the tricuspid E/e′ ratio; eRAPmean, mean of the different eRAP.
Discussion
eRAP is part of the standard transthoracic echocardiographic examination and provides important information. It is fundamental in the diagnostic workup of PH, as systolic pulmonary artery pressure is calculated as the sum of eRAP and RV systolic pressure (1, 4, 9). Furthermore, elevated eRAP is associated with worse prognosis in HF (19, 20) and PAH (21).
In clinical practice, eRAP is obtained by examining the dimension and respiratory collapsibility of IVC (6). Other methods for eRAP exist, but have not been validated across different populations (11). Hence, eRAPIVC is recommended as the default approach, with other modalities being complementary (4, 22). Nonetheless, eRAPIVC is approximate. A semiautomated assessment of IVC collapsibility and pulsatility has recently been proposed to overcome the limitations of eRAPIVC (23). Alternatively, eRAP could be more precise if the estimates attained with different techniques were incorporated into a multiparametric scoring system (13).
On this background, we determined the accuracy of averaging the values of eRAP derived from the evaluation of IVC, HV PW Doppler profiles, and tricuspid E/e′ ratio. Although eRAPmean did correlate with iRAP, it did not perform significantly better than eRAPIVC in predicting iRAP.
Individual comparisons of eRAPIVC, , and eRAPHV with iRAP have already been drawn (6–8, 24–27). By contrast, to our knowledge, only one recent investigation with LVAD patients considered eRAPIVC, , and eRAPHV together to compute eRAPmean (14). In this study like in ours, eRAPmean had the greatest AUC for the detection of iRAP >10 mmHg. However, the authors focused on the value of eRAPmean in combination with several other echocardiographic variables in guiding LVAD management, and no statistical comparison between ROC was performed, precluding any conclusion about the higher accurateness of eRAPmean over eRAPIVC. It is also notable that we included a heterogeneous cohort of subjects, a crucial step to understand the potential clinical value of eRAPmean.
For each eRAPmean component (eRAPIVC, , and eRAPHV), echocardiographic and invasive values were more often similar when eRAP was <10 mmHg. As a consequence, the correspondence between eRAPmean and iRAP also appeared to be looser for eRAPmean values >10 mmHg. The highest discordance with iRAP was found for and eRAPHV >10 mmHg. Consistent with our results, the cutoffs beyond which was less reliable in previous studies were also <10 mmHg (8, 28).
Overall, the present work supports the systematic use of eRAPIVC in the clinical arena, as it is the simplest way to estimate RAP. Moreover, an extensive literature indicates that the echocardiographic evaluation of IVC offers diagnostic and prognostic cues per se, regardless of which value is assigned to eRAPIVC. Demonstration of a dilated and/or non-collapsible IVC may be sufficient to identify patients with HF and increased LV filling pressures (29) and has been associated with HF hospitalization and mortality (19, 30, 31). In addition, a larger IVC size at discharge was related to a higher risk of readmission after a first hospitalization for HF (32, 33). An independent prognostic role of IVC dilation and reduced collapsibility has also been shown in PAH (34). However, and eRAPHV may be more convenient in specific populations. can be helpful in patients with a poor subcostal ultrasound window (24), and HVFF has specifically been evaluated in mechanically ventilated patients (7).
Until eRAPIVC remains the reference in clinical practice, efforts to improve it are desirable, for instance, by tracking the respirophasic movements of the IVC in echocardiographic videoclips (23).
We acknowledge that the sample we examined was small and mostly made of subjects with a low iRAP. Thus, the data presented here should be viewed as preliminary to bigger studies with a wider range of iRAP. On the other hand, this work is the first one addressing the performance of eRAPmean in a series of consecutive patients with different cardiac disorders. It is also remarkable that eRAP and iRAP were assessed on the same day and, in most cases, few hours apart by reciprocally blinded investigators.
Conclusions
The optimal approach for eRAP during transthoracic echocardiography is debated; recently, it has been suggested that incorporating the analysis of IVC, tricuspid E/e′ ratio, and HV is better than relying only on IVC assessment.
In this prospective cohort of patients in whom RAP was invasively measured, however, multiparametric eRAP was not more precise than the estimate based on IVC, tricuspid E/e′ ratio, or HV.
While awaiting for additional studies, we conclude that, at present, evaluation of IVC diameter and collapsibility is preferable for eRAP.
Data Availability Statement
The raw data supporting the conclusions of this article will be made available by the authors, without undue reservation.
Ethics Statement
The studies involving human participants were reviewed and approved by IRCCS Ospedale Policlinico San Martino Institutional Review Board. The patients/participants provided their written informed consent to participate in this study.
Author Contributions
MT and PA designed the study, collected and data, and wrote the article. SG, GC, GM, MB, and IP collected data. GC and MC analyzed data. FM wrote the article. All authors contributed to the article and approved the submitted version.
Conflict of Interest
The authors declare that the research was conducted in the absence of any commercial or financial relationships that could be construed as a potential conflict of interest.
References
1. Galiè N, Humbert M, Vachiery JL, Gibbs S, Lang I, Torbicki A, et al. 2015 ESC/ERS Guidelines for the diagnosis and treatment of pulmonary hypertension: The Joint Task Force for the Diagnosis and Treatment of Pulmonary Hypertension of the European Society of Cardiology (ESC) and the European Respiratory Society (ERS): Endorsed by: Association for European Paediatric and Congenital Cardiology (AEPC), International Society for Heart and Lung Transplantation (ISHLT). Eur Heart J. 2016 37:67–119. doi: 10.1093/eurheartj/ehv317
2. Brinkley DM Jr, Ho KKL, Drazner MH, Kociol RD. The prognostic value of the relationship between right atrial and pulmonary capillary wedge pressure in diverse cardiovascular conditions. Am Heart J. 2018 199:31–36. doi: 10.1016/j.ahj.2018.01.006
3. McCullough SA, Fifer MA, Mohajer P, Lowry PA, Reen CO, Baggish AL, et al. Clinical Correlates and Prognostic Value of Elevated Right Atrial Pressure in Patients With Hypertrophic Cardiomyopathy. Circ J. 2018 82:1405–11. doi: 10.1253/circj.CJ-17-0959
4. van den Bosch AE, Badano LP, Grapsa J. Right ventricle and pulmonary arterial pressure. In: The EACVI Textbook of Echocardiography. Oxford University Press (2017). p. 171–84.
5. Moreno FL, Hagan AD, Holmen JR, Pryor TA, Strickland RD, Castle CH. Evaluation of size and dynamics of the inferior vena cava as an index of right-sided cardiac function. Am J Cardiol. 1984 53:579–85. doi: 10.1016/0002-9149(84)90034-1
6. Kircher BJ, Himelman RB, Schiller NB. Noninvasive estimation of right atrial pressure from the inspiratory collapse of the inferior vena cava. Am J Cardiol. 1990 66:493–6. doi: 10.1016/0002-9149(90)90711-9
7. Nagueh SF, Kopelen HA, Zoghbi WA. Relation of mean right atrial pressure to echocardiographic and Doppler parameters of right atrial and right ventricular function. Circulation. 1996 93:1160–9. doi: 10.1161/01.cir.93.6.1160
8. Nageh MF, Kopelen HA, Zoghbi WA, Quiñones MA, Nagueh SF. Estimation of mean right atrial pressure using tissue Doppler imaging. Am J Cardiol. 1999 84:1448-51. doi: 10.1016/s0002-9149(99)00595-0
9. Rudski LG, Lai WW, Afilalo J, Hua L, Handschumacher MD, Chandrasekaran K, et al. Guidelines for the echocardiographic assessment of the right heart in adults: a report from the American Society of Echocardiography endorsed by the European Association of Echocardiography, a registered branch of the European Society of Cardiology, and the Canadian Society of Echocardiography. J Am Soc Echocardiogr. 2010 23:685–713. doi: 10.1016/j.echo.2010.05.010
10. Scheinfeld MH, Bilali A, Koenigsberg M. Understanding the spectral Doppler waveform of the hepatic veins in health and disease. Radiographics. 2009 29:2081–98. doi: 10.1148/rg.297095715
11. Tsutsui RS, Borowski A, Tang WH, Thomas JD, Popović ZB. Precision of echocardiographic estimates of right atrial pressure in patients with acute decompensated heart failure. J Am Soc Echocardiogr. 2014 27:1072–8.e2. doi: 10.1016/j.echo.2014.06.002
12. Magnino C, Omedè P, Avenatti E, Presutti D, Iannaccone A, Chiarlo M, et al. Inaccuracy of Right Atrial Pressure Estimates Through Inferior Vena Cava Indices. Am J Cardiol. 2017 120:1667–73. doi: 10.1016/j.amjcard.2017.07.069
13. Beigel R, Cercek B, Luo H, Siegel RJ. Noninvasive evaluation of right atrial pressure. J Am Soc Echocardiogr. 2013 26:1033–42. doi: 10.1016/j.echo.2013.06.004
14. Frea S, Centofanti P, Pidello S, Giordana F, Bovolo V, Baronetto A, et al. Noninvasive assessment of hemodynamic status in HeartWare left ventricular assist device patients: validation of an echocardiographic approach. JACC Cardiovasc Imaging. 12(7 Pt1):1121–31. doi: 10.1016/j.jcmg.2018.01.026
15. Lang RM, Badano LP, Mor-Avi V, Afilalo J, Armstrong A, Ernande L, et al. Recommendations for cardiac chamber quantification by echocardiography in adults: an update from the American Society of Echocardiography and the European Association of Cardiovascular Imaging. Eur Heart J Cardiovasc Imaging. 2015 16:233–70. doi: 10.1093/ehjci/jev014
16. Nagueh SF, Smiseth OA, Appleton CP, Byrd BF 3rd, Dokainish H, Edvardsen T, et al. Recommendations for the Evaluation of Left Ventricular Diastolic Function by Echocardiography: An Update from the American Society of Echocardiography and the European Association of Cardiovascular Imaging. Eur Heart J Cardiovasc Imaging. 2016 17:1321–60. doi: 10.1093/ehjci/jew082
17. Tagliafico AS, Ameri P, Bovio M, Puntoni M, Capaccio E, Murialdo G, et al. Relationship between fatty degeneration of thigh muscles and vitamin D status in the elderly: a preliminary MRI study. AJR Am J Roentgenol. 2010 194:728–34. doi: 10.2214/AJR.09.3130
18. Kovacs G, Olschewski H. Cardiac catheterization. Pulmonary circulation. In: Peacock AJ, Naeije R, Rubin LJ, editors. Diseases and Their Treatment. (2016) 4th ed. Boca Ratori, FL: CRC Press. p. 186–95.
19. Pellicori P, Shah P, Cuthbert J, Urbinati A, Zhang J, Kallvikbacka-Bennett A, et al. Prevalence, pattern and clinical relevance of ultrasound indices of congestion in outpatients with heart failure. Eur J Heart Fail. 2019 21:904–16. doi: 10.1002/ejhf.1383
20. Ghosh S, Majumder B, Guharay T, Tandel V, Gupta S, Chatterjee S. Prognostic significance of inferior vena caval diameter in patients with chronic heart failure. J Assoc Physicians India. 2018 66:40–2.
21. Austin C, Alassas K, Burger C, Safford R, Pagan R, Duello K, et al. Echocardiographic assessment of estimated right atrial pressure and size predicts mortality in pulmonary arterial hypertension. Chest. 2015 147:198–208. doi: 10.1378/chest.13-3035
22. Blank N, Grapsa J, Rudski LG. The right atrium. ASE's Comprehensive Echocardiography. 2nd ed. Philadelphia, PA: Elsevier Saunders (2016). p. 161–5.
23. Albani S, Pinamonti B, Giovinazzo T, de Scordilli M, Fabris E, Stolfo D, et al. Accuracy of Right Atrial Pressure Estimation Using a Multi-Parameter Approach Derived From Inferior Vena Cava Semi-Automated Edge-Tracking Echocardiography: A Pilot Study in Patients With Cardiovascular Disorders. Int J Cardiovasc Imaging. 2020 36:1213–25. doi: 10.1007/s10554-020-01814-8
24. Sade LE, Gulmez O, Eroglu S, Sezgin A, Muderrisoglu H. Noninvasive estimation of right ventricular filling pressure by ratio of early tricuspid inflow to annular diastolic velocity in patients with and without recent cardiac surgery. J Am Soc Echocardiogr. 2007 20:982–8. doi: 10.1016/j.echo.2007.01.012
25. Said K, Shehata A, Ashour Z, El-Tobgi S. Value of conventional and tissue Doppler echocardiography in the noninvasive measurement of right atrial pressure. Echocardiography. 2012 29:779–84. doi: 10.1111/j.1540-8175.2012.01700.x
26. Watanabe R, Amano H, Saito F, Toyoda S, Sakuma M, Abe S, et al. Echocardiographic surrogates of right atrial pressure in pulmonary hypertension. Heart Vessels. 2019 34:477–83. doi: 10.1007/s00380-018-1264-8
27. Ommen SR, Nishimura RA, Hurrell DG, Klarich KW. Assessment of right atrial pressure with 2-dimensional and Doppler echocardiography: a simultaneous catheterization and echocardiographic study. Mayo Clin Proc. 2000 75:24–9. doi: 10.4065/75.1.24
28. Sundereswaran L, Nagueh SF, Vardan S, Middleton KJ, Zoghbi WA, Quiñones MA, et al. Estimation of left and right ventricular filling pressures after heart transplantation by tissue Doppler imaging. Am J Cardiol. 1998 82:352–7. doi: 10.1016/s0002-9149(98)00346-4
29. Berthelot E, Jourdain P, Bailly MT, Bouchachi A, Gellen B, Rouquette A, et al. Echocardiographic Evaluation of Left Ventricular Filling Pressure in Patients With Heart Failure With Preserved Ejection Fraction: Usefulness of Inferior Vena Cava Measurements and 2016 EACVI/ASE Recommendations. J Card Fail. (2020) 26:507–14. doi: 10.1016/j.cardfail.2020.01.018
30. Pellicori P, Carubelli V, Zhang J, Castiello T, Sherwi N, Clark AL, et al. IVC diameter in patients with chronic heart failure: relationships and prognostic significance. JACC Cardiovasc Imaging. 2013 6:16–28. doi: 10.1016/j.jcmg.2012.08.012
31. Curbelo J, Aguilera M, Rodriguez-Cortes P, Gil-Martinez P, Suarez Fernandez C. Usefulness of inferior vena cava ultrasonography in outpatients with chronic heart failure. Clin Cardiol. 2018 41:510–7. doi: 10.1002/clc.22915
32. Goonewardena SN, Gemignani A, Ronan A, Vasaiwala S, Blair J, Brennan JM, et al. Comparison of hand-carried ultrasound assessment of the inferior vena cava and N-terminal pro-brain natriuretic peptide for predicting readmission after hospitalization for acute decompensated heart failure. JACC Cardiovasc Imaging. 2008 1:595–601. doi: 10.1016/j.jcmg.2008.06.005
33. Carbone F, Bovio M, Rosa GM, Ferrando F, Scarrone A, Murialdo G, et al. Inferior vena cava parameters predict re-admission in ischaemic heart failure. Eur J Clin Invest. 2014 44:341–9. doi: 10.1111/eci.12238
Keywords: right atrial pressure, echocardiograghy, right heart catheterization, heart failure, pulmonary hypertension
Citation: Toma M, Giovinazzo S, Crimi G, Masoero G, Balbi M, Montecucco F, Canepa M, Porto I and Ameri P (2021) Multiparametric vs. Inferior Vena Cava–Based Estimation of Right Atrial Pressure. Front. Cardiovasc. Med. 8:632302. doi: 10.3389/fcvm.2021.632302
Received: 23 November 2020; Accepted: 01 February 2021;
Published: 08 March 2021.
Edited by:
Micha Tobias Maeder, Kantonsspital St. Gallen, SwitzerlandReviewed by:
Paolo Denti, San Raffaele Hospital (IRCCS), ItalyErnest Spitzer, Erasmus University Rotterdam, Netherlands
Copyright © 2021 Toma, Giovinazzo, Crimi, Masoero, Balbi, Montecucco, Canepa, Porto and Ameri. This is an open-access article distributed under the terms of the Creative Commons Attribution License (CC BY). The use, distribution or reproduction in other forums is permitted, provided the original author(s) and the copyright owner(s) are credited and that the original publication in this journal is cited, in accordance with accepted academic practice. No use, distribution or reproduction is permitted which does not comply with these terms.
*Correspondence: Pietro Ameri, pietroameri@unige.it