Changes in population biology of three coral reef fishes in the South China Sea between 1998–1999 and 2016–2019
 Jun Zhang1,2,3,4*
  Yancong Cai1,2
  Jiajun Li1,2
  Kui Zhang1,2,3
  Yuyan Gong1,2 Sen Chen1
  Zuozhi Chen1,2,3,4*
- 1South China Sea Fisheries Research Institute, Chinese Academy of Fishery Sciences, Guangzhou, China
- 2Key Laboratory for Sustainable Utilization of Open-Sea Fishery, Ministry of Agriculture and Rural Affairs, Guangzhou, China
- 3Southern Marine Science and Engineering Guangdong Laboratory (Guangzhou), Guangzhou, China
- 4Key Laboratory of Big Data for South China Sea Fishery Resources and Environment, Chinese Academy of Fishery Sciences, Guangzhou, China
The decline of coral reefs and their fish has attracted worldwide attention. The South China Sea is the important center of coral reefs. Reef-fish is a crucial component in coral reef ecosystem. However, studies on the long-term variation in the biololgy of coral reef fish in the South China Sea are very lacking. To enhance our understanding of variation in reef fish biology in the South China Sea, we investigated long-term changes in some biological indicators of three dominant coral reef fishes (Lutjanus kasmira, Gnathodentex aureolineatus, and Cephalopholis urodeta) at the Yongshu Reef of the South China Sea between 1998–1999 and 2016–2019, and examined the effects of fishing and sea surface temperature on their biology. Compared with 1998–1999, average body length, average body mass, large fish indicator, feeding level and relative fatness of Lutjanus kasmira and Gnathodentex aureolineatus decreased in 2016–2019, but Cephalopholis urodeta did not. The relative fatness was positively correlated with the feeding level, which indicated that the decline of feeding level decreased the relative fatness. Fishing had the most important negative impact on biological changes. In the past two decades, Lutjanus kasmira had the most obvious decline in size and relative fatness, followed by Gnathodentex aureolineatus, but Cephalopholis urodeta had almost no decline. We hypothesized that different coral reef fishes have different abilities to maintain population stability under external pressures, and the differences in vulnerability of three fish species were the main reasons for their different responses to external pressures. To promote the conservation of coral reef fish, we recommend taking rigorous management to protect habitat.
Introduction
Coral reefs are among the most productive and diverse marine ecosystems; they provide a multitude of valuable ecosystem services and support a myriad of fishes (Noonan et al., 2012; Rummer and Munday, 2017). As important components of coral reefs, coral reef fishes have significant functions by participating in various ecological processes, and they also provide necessary animal protein for many millions of people (Mora et al., 2003; Bell et al., 2006). Over the past few decades, coral reefs have sharply degraded and the associated fishes have also suffered rapid declines because of multiple threats, such as accelerated habitat degradation, increasing harvesting pressure and unsustainable fishing (Munday et al., 2008; Allgeier et al., 2016; Rummer and Munday, 2017).
The South China Sea (SCS) is the largest marginal sea in the west Pacific Ocean, and is geographically surrounded by six densely populated countries and regions. The SCS is recognized as the global center of coral reefs and has the largest areas of coral reefs of any tropical sea, with thousands of marine fish species, more than one-third of which are coral reef fishes (Mora et al., 2003; Li et al., 2007; Arai, 2015). Due to the effects of human activities and climate change, the coral reefs and associated reef fishes in the SCS have severely declined within the past few decades (Hughes et al., 2013; Zhao et al., 2016; Zhang et al., 2021).
Fish population is the basic unit of fish community, and is also the specific target of fishing industry. For any exploited reef fishes, understanding their population state is critical for true scientific management and protection. In the SCS, previous studies of coral reef fish mainly focused on the temporary status of diversity, community structure and biology (Li et al., 2007; Arai, 2015; Zhang et al., 2015). However, studies on the long-term variation in the biology of coral reef fish and its influencing factors are very lacking (Hughes et al., 2013; Zhao et al., 2016; Hughes et al., 2017; Li et al., 2017).
In the past surveys of coral reef fish in the SCS, Lutjanus kasmira, Gnathodentex aureolineatus, and Cephalopholis urodeta were representative species with high occurrence. These reef fishes are widely distributed in both the SCS and the Indo-Pacific waters. They are usually caught with handline, gill nets, and in traps. L. kasmira and G. aureolineatus are important edible fish. Because of its small size, C. urodeta is not of much interest as a food fish. All three examined species were assessed as “Least Concern” based on the International Union for Conservation of Nature (IUCN) Red List of Threatened Species categories (Carpenter et al., 2016; Russell et al., 2016; Cabanban, 2018).There were some studies on their habitat, feeding habit, age and growth, and life history (Fry et al., 2006; Pothin et al., 2006; Vignon et al., 2008; Zhang et al., 2015). However, studies on the long-term variation in their biology are extremely poor. In this article, we report the long-term variation in the biology of L. kasmira, G. aureolineatus, and C. urodeta in the SCS over the past 20 years, including body size structure, large fish indicator, feeding level, and relative fatness. We also analyze the changes of fishing intensity and sea surface temperature in the region and their effects on the fish biology.
Materials and methods
Survey area and fish specimen collection
The fish surveys were carried out at Yongshu Reef of the SCS (Figure 1). Yongshu Reef (9°37′N, 112°58′E) is approximately 7.8 km wide and 26 km long, and covers an area of 108 km2. The Reef is a long elliptical atoll; its lagoon has a depth of 14.6–40.0 m.
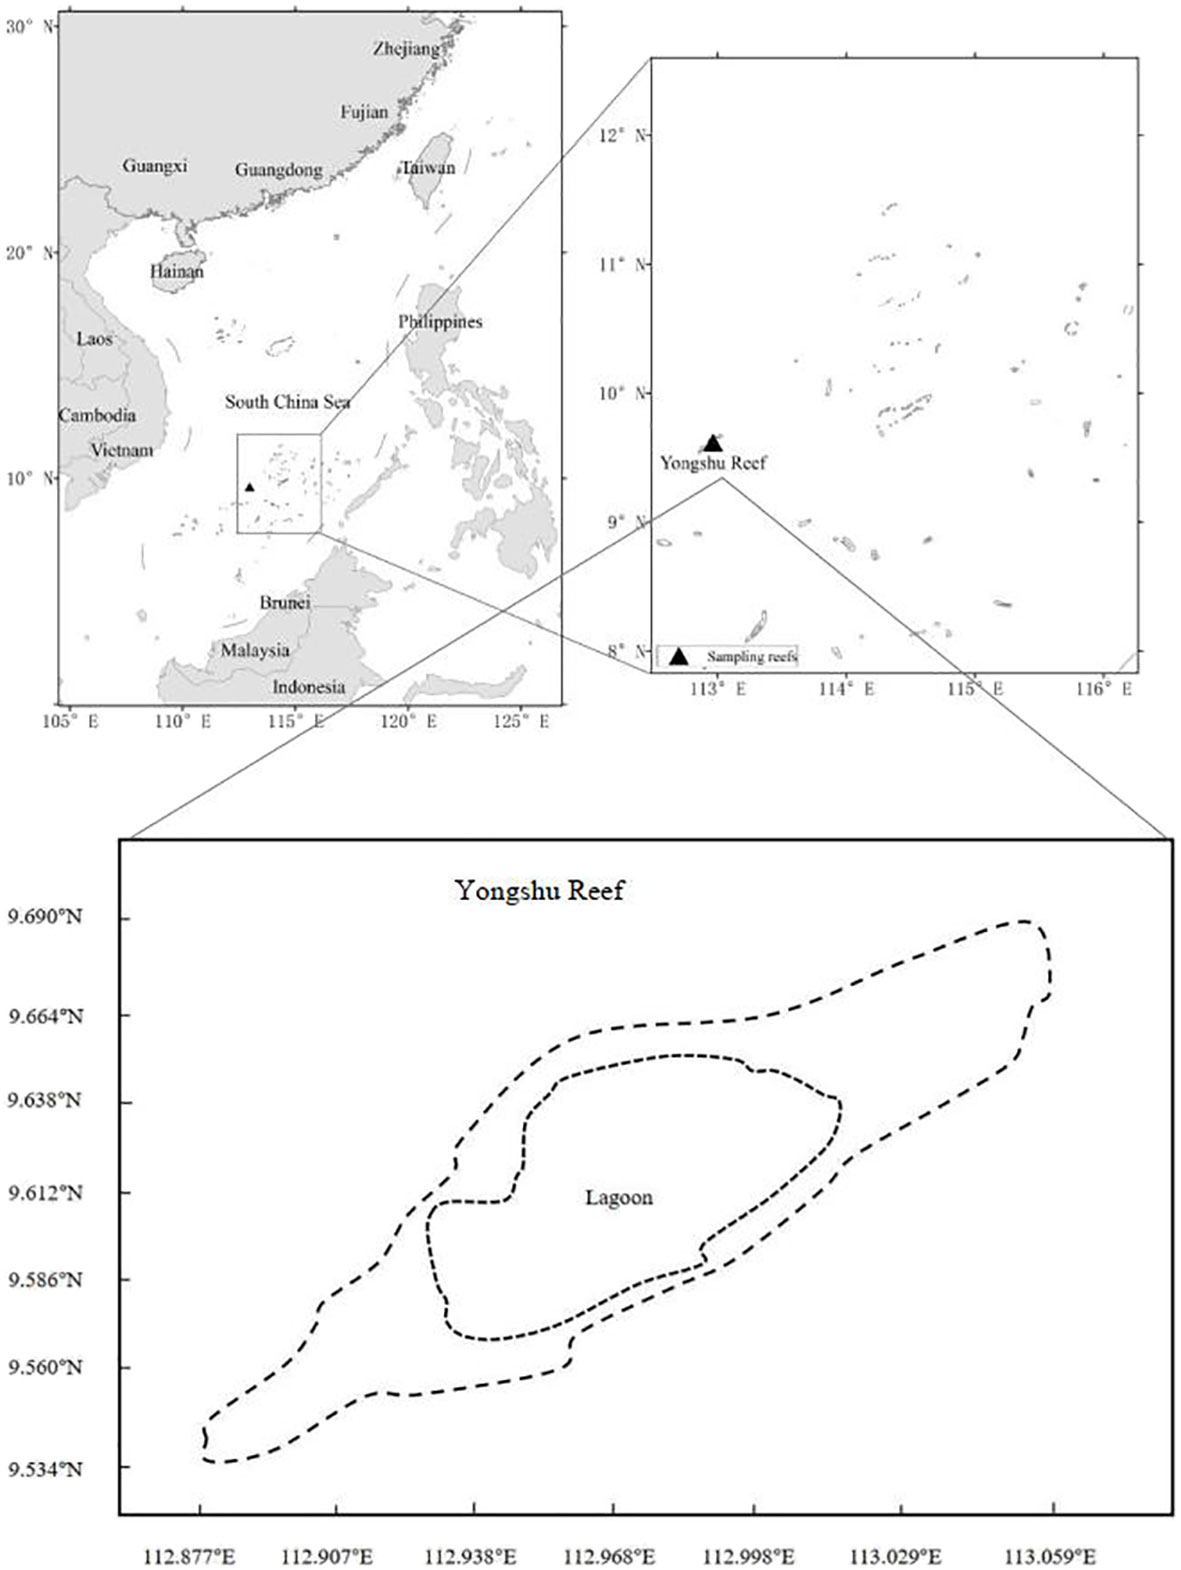
Figure 1 Study location: Yongshu Reef in the South China Sea.
L. kasmira specimens were collected by handline in May of 1998–1999 and 2016–2017. G. aureolineatus and C. urodeta specimens were collected by handline in May of 1999, 2016–2017 and 2019. The bait was fresh shrimp. The South China Sea Fisheries Research Institute conducted all surveys. The specifications of handline gear were 26.0 mm long, 10.0 mm wide, 1.0 mm thick, and 0.330 mm diameter nylon wire. The working depth of the gear was 10–20 m. Fish specimens were collected in the lagoon. Handline fishing was conducted during the day (07:00–10:00) and at night (19:00–21:00).
After catching fish, specimens were immersed in seawater and frozen (−20°C) for shore-based analysis. In May of 1998 and 1999, the surveys were undertaken onboard the R/V Fisheries Administration (300 GT, 44.40 m long, 8.00 m wide) and the commercial fishing vessel F/V Yueyu 730 (98 GT, 26.5 m long, 5.3 m wide). During 2016–2017 and 2019, the surveys were undertaken onboard the R/V Nanfeng (1537 t GT, 66.66 m long, 12.40 m wide) equipped with a motorboat, and fish were collected onboard the motorboat (1 GT, 7.85 m long, 1.50 m wide) with a compression ignition internal combustion engine.
The total specimen sizes were determined for 516 individuals of L. kasmira (28, 32, 208 and 248 individuals in 1998, 1999, 2016 and 2017, respectively), 374 individuals of G. aureolineatus (26, 73, 28 and 247 individuals in 1999, 2016, 2017 and 2019) and for 128 individuals of C. urodeta (40,26, 24 and 38 individuals in 1999, 2016, 2017, and 2019, respectively).
Specimen processing
Specimen information, including body length (BL, 1 mm), wet body mass (BW, 0.1 g), and feeding level were measured at a shore-based laboratory. Fish feeding level was recorded by the degree of stomach fullness on five scales: (0) stomach empty, (1) little content, (2) stomach less than half-full, (3) stomach more than half-full, (4) full stomach (Fei and Zhang, 1990). For each survey, the mean feeding level (MFL) of fish was calculated by the following formula:
where i is the feeding level (0, 1, 2, 3, or 4) in all specimens, and the P% is the percent of the individuals in each of those stomach fullness categories. Taking into account the difference in time of fish feeding, this study only compared the feeding level of specimens that were collected within the same or similar time period among all surveys, including in 1999, 2016, 2017 and 2019. One-way analysis of variance (ANOVA) was used to analyze the interannual variation of the MFL at a significance level of 0.05, and the significance level of all non-significant results was ≥ 0.05.
Size structure
All specimens were arranged by size and divided into groups at 10 mm intervals. Kolmogorov-smirnov (K-S) test was used to inspect the interannual differences of the BL distribution. Levene’s test was used to determine whether the BL and BW composition were homogeneous. If the results were homogeneous, ANOVA was used to compare the interannual differences of the average body length (ABL) and average body mass (ABM). Otherwise, Tamhane and Dunnett tests were used to compare the interannual differences of the ABL and ABM. For all analyses, a significance level of 0.05 was assumed, and the significance level of all non-significant results was ≥ 0.05.
Large fish indicator
Large fish indicator (LFI) describes the proportion (by weight) of the fish community that is larger than some length threshold, so expresses a well-understood community response to exploitation–the curtailment of age and size structure, and is sensitive to fishing pressure (Greenstreet et al., 2011). In this study, we used the third quartile BL of specimens from small to large in 1998 for L. kasmira and G. aureolineatus and in 1999 for C. urodeta as the BL threshold to calculate the corresponding LFI values by weight in different years:
where Wi, BL≥DBL . and Wi are the total weight of specimens with BL ≥ BL threshold and the total weight of all specimens in the ith survey, respectively. We used ANOVA to test the interannual differences of LFI values at a significance level of 0.05, and the significance level of all non-significant results was ≥ 0.05.
Relative fatness
Relative fatness (RF) reflects the growth status of fish (Froese, 2006). Relative fatness assumes that, for a given length, heavier fish is in better condition. In this study, the relative fatness of fish across populations among different surveys was calculated as follows:
where am and bm is the geometric mean of constant condition parameter a and the arithmetic mean of allometric growth parameter b across all available, non-questionable length–weight relationships as follows:
a and b was estimated using the transformed logarithmic expression and least squares method, and outliers was removed from the data by log–log plots (Froese, 2006):
For the three fish species collected in the same survey, there were no obvious sexual differences in the relative fatness (T–test, p > 0.05). To reduce the effect of BL differences, we selected the specimens in the same BL range across populations among surveys to calculate the relative fatness. Given coexisting BL range and specimen number among surveys, we used specimens that were 13.0–18.0 cm, 13.2–17.0 cm, and 9.0–12.0 cm long to calculate the relative fatness of unsexed L. kasmira, G. aureolineatus, and C. urodeta, respectively. We used ANOVA to test the interannual differences of relative fatness at a significance level of 0.05, and the significance level of all non-significant results was ≥ 0.05.
Fish vulnerability
The vulnerability is measured as population vulnerability score (VS) in the total score of 100. The higher the score, the higher the population vulnerability. Vulnerability data of three reef fishes were from FishBase (Froese and Pauly, 2022) and literatures (Cheung et al., 2005; Froese et al., 2017). The vulnerability scores of L. kasmira, G. aureolineatus, and C. urodeta were 40 (moderate vulnerability), 30 (low to moderate vulnerability), and 14 (low vulnerability), respectively.
In this study, the ratios of average biological indicators (ABL, ABM, LFI, RF and MFL) in 2016–2019 to those in 1998–1999 were determined. Linear regression between ratios of average biological indicators and vulnerability scores at a significance level of 0.05 was investigated, and the significance level of all non-significant results was ≥ 0.05.
Sea surface temperature and relative fishing intensity
In the Yongshu Reef, sea surface temperature (SST) derived from the Moderate Resolution Imaging Spectroradiometer (MODIS) satellite measurements was obtained from the Ocean Color website (http://oceancolor.gsfc.nasa.gov/). We downloaded a daily temporal resolution and a spatial resolution of 0.04° corresponding to the geographic scope of specimens collected from 1998 and 2019. We used the May datasets to analyze the SST change.
The total catches of coral reef fish in the SCS including Yongshu Reef were not counted. Thus, we tried to use the reconstructed catch data from seaaroundus database (http://www.seaaroundus.org) to estimate the fishing pressure of coral reef fish in the SCS (Pauly et al., 2020). In the database, there was no total catch of coral reef fish, hence we used the sorted catch of parrotfish (Scaridae) from China during 1998–2018 to indicate the fishing pressure. As typical coral reef fish, the catch of parrotfish is appropriate to reflect the relative fishing intensity on coral reef. Of course, this approach has many flaws in interpreting the effects of fishing intensity on fish in the Yongshu Reef, but it is helpful to understand the trends in human fishing on reef fish.
Results
Body length and body mass
For L. kasmira, the BL distribution in 1998–1999 significantly differed from that in 2016–2017 (K-S test, p< 0.01). ABL and ABM in 1998–1999 were significantly larger than those in 2016–2017 (ANOVA, p< 0.05) (Figure 2).
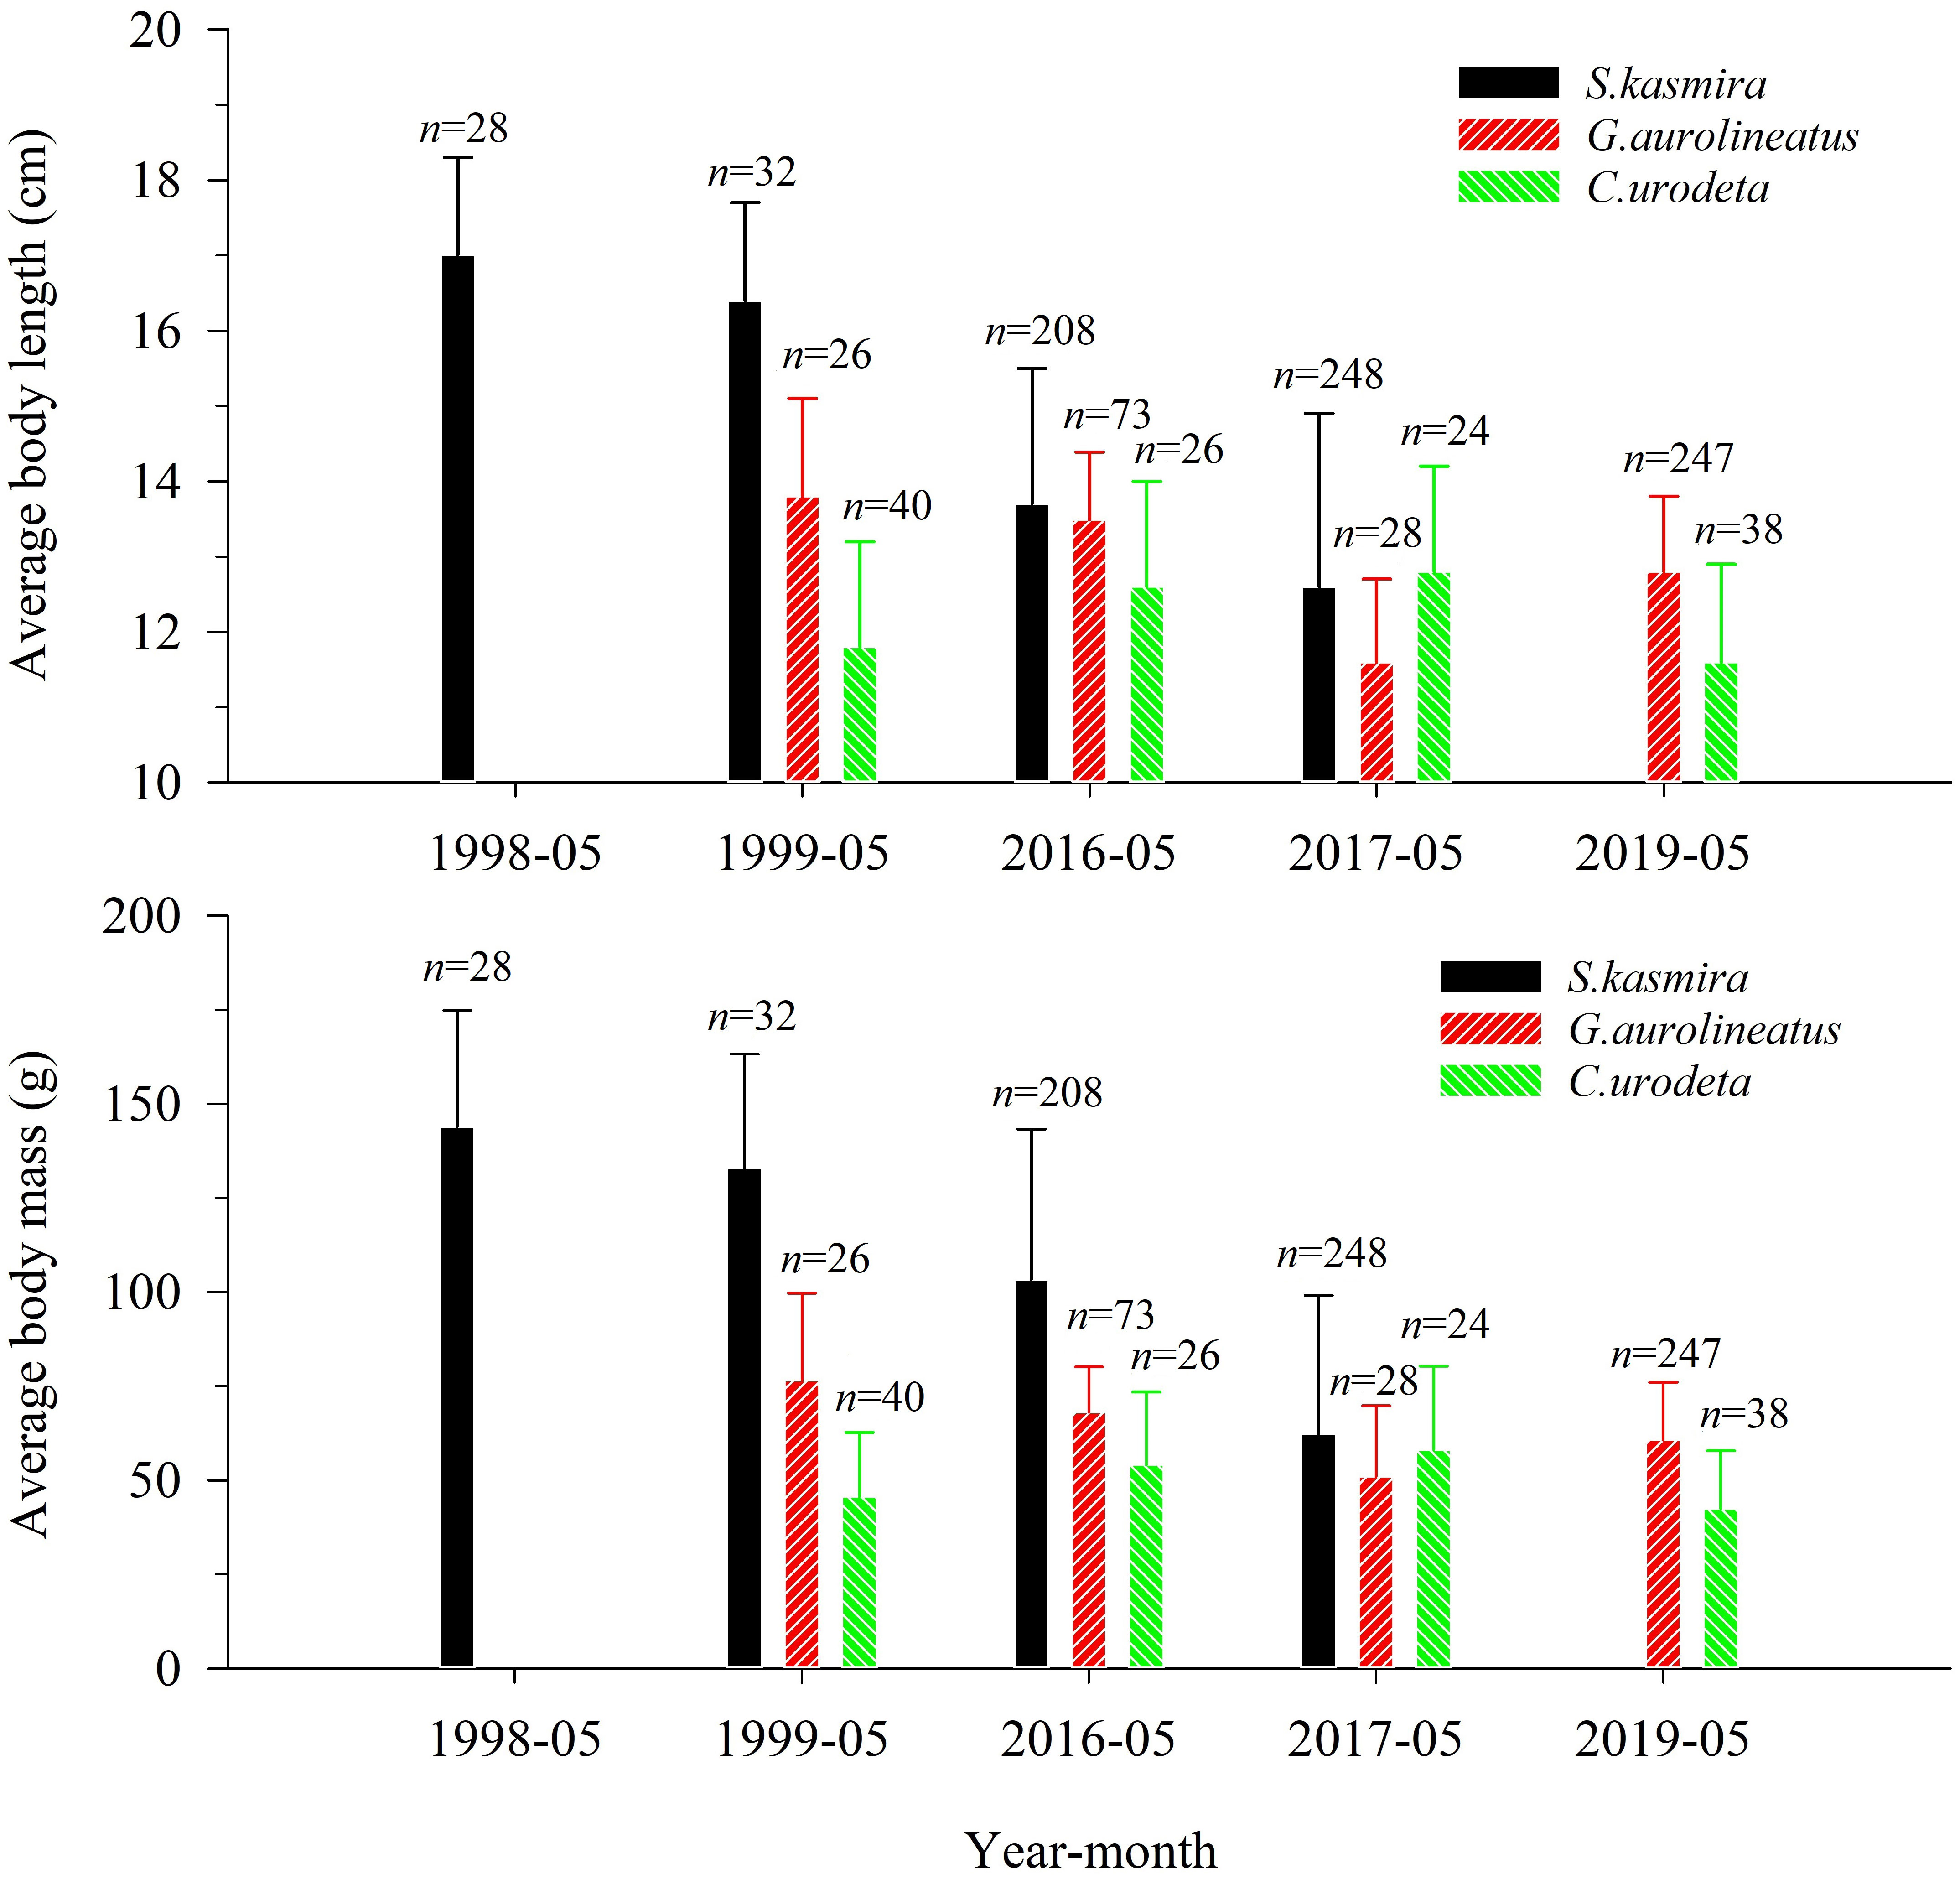
Figure 2 Average body length and average body mass of Lutjanus kasmira, Gnathodentex aureolineatus and Cephalopholis urodeta during 1998–2019 in the Yongshu Reef, South China Sea. The error bars represents the corresponding standard deviation. The n above the error bar represents the number of corresponding replicate samples.
For G. aureolineatus, the BL distribution in 1999 was significantly different from that in 2016 (K-S test, p< 0.01), but not significantly different from that in 2017 and 2019 (K-S test, p > 0.05). ABL and ABM in 1999 were not significantly different from those in 2016–2017 and 2019 (ANOVA, p > 0.05), but ABL and ABM in 2016–2017 and 2019 were only 91.3% and 79.2% of those in 1999 (Figure 2).
For C. urodeta, the BL distribution in 1999 was not significantly different from that in 2016–2017 and 2019 (K-S test, p > 0.05). ABL and ABM in 1999 were not significantly different from those in 2016–2017 and 2019 (ANOVA, p > 0.05), and ABL and ABM in 2016–2017 and 2019 were 1.04 times and 1.13 times that in 1999 (Figure 2).
Large fish indicator and feeding level
The BL thresholds of L. kasmira, G. aureolineatus, and C. urodeta were 17.7 cm, 14.6 cm, and 13.0 cm, respectively. The average LFI of L. kasmira in 2016–2017 was 29.2% of that in 1998–1999 (Figure 3), but ANOVA indicated that the LFI in 1998–1999 was not significantly different from that in 2016–2017 (p > 0.05). The average LFI of G. aureolineatus in 2016–2017 and 2019 was 25.9% of that in 1999 (Figure 3), but the difference was not significant (ANOVA, p > 0.05). The LFI of C. urodeta was almost unchanged in other years except for lower in 2019, and the LFI in 1999 was not significantly different from that in 2016–2017 and 2019 (ANOVA, p > 0.05).
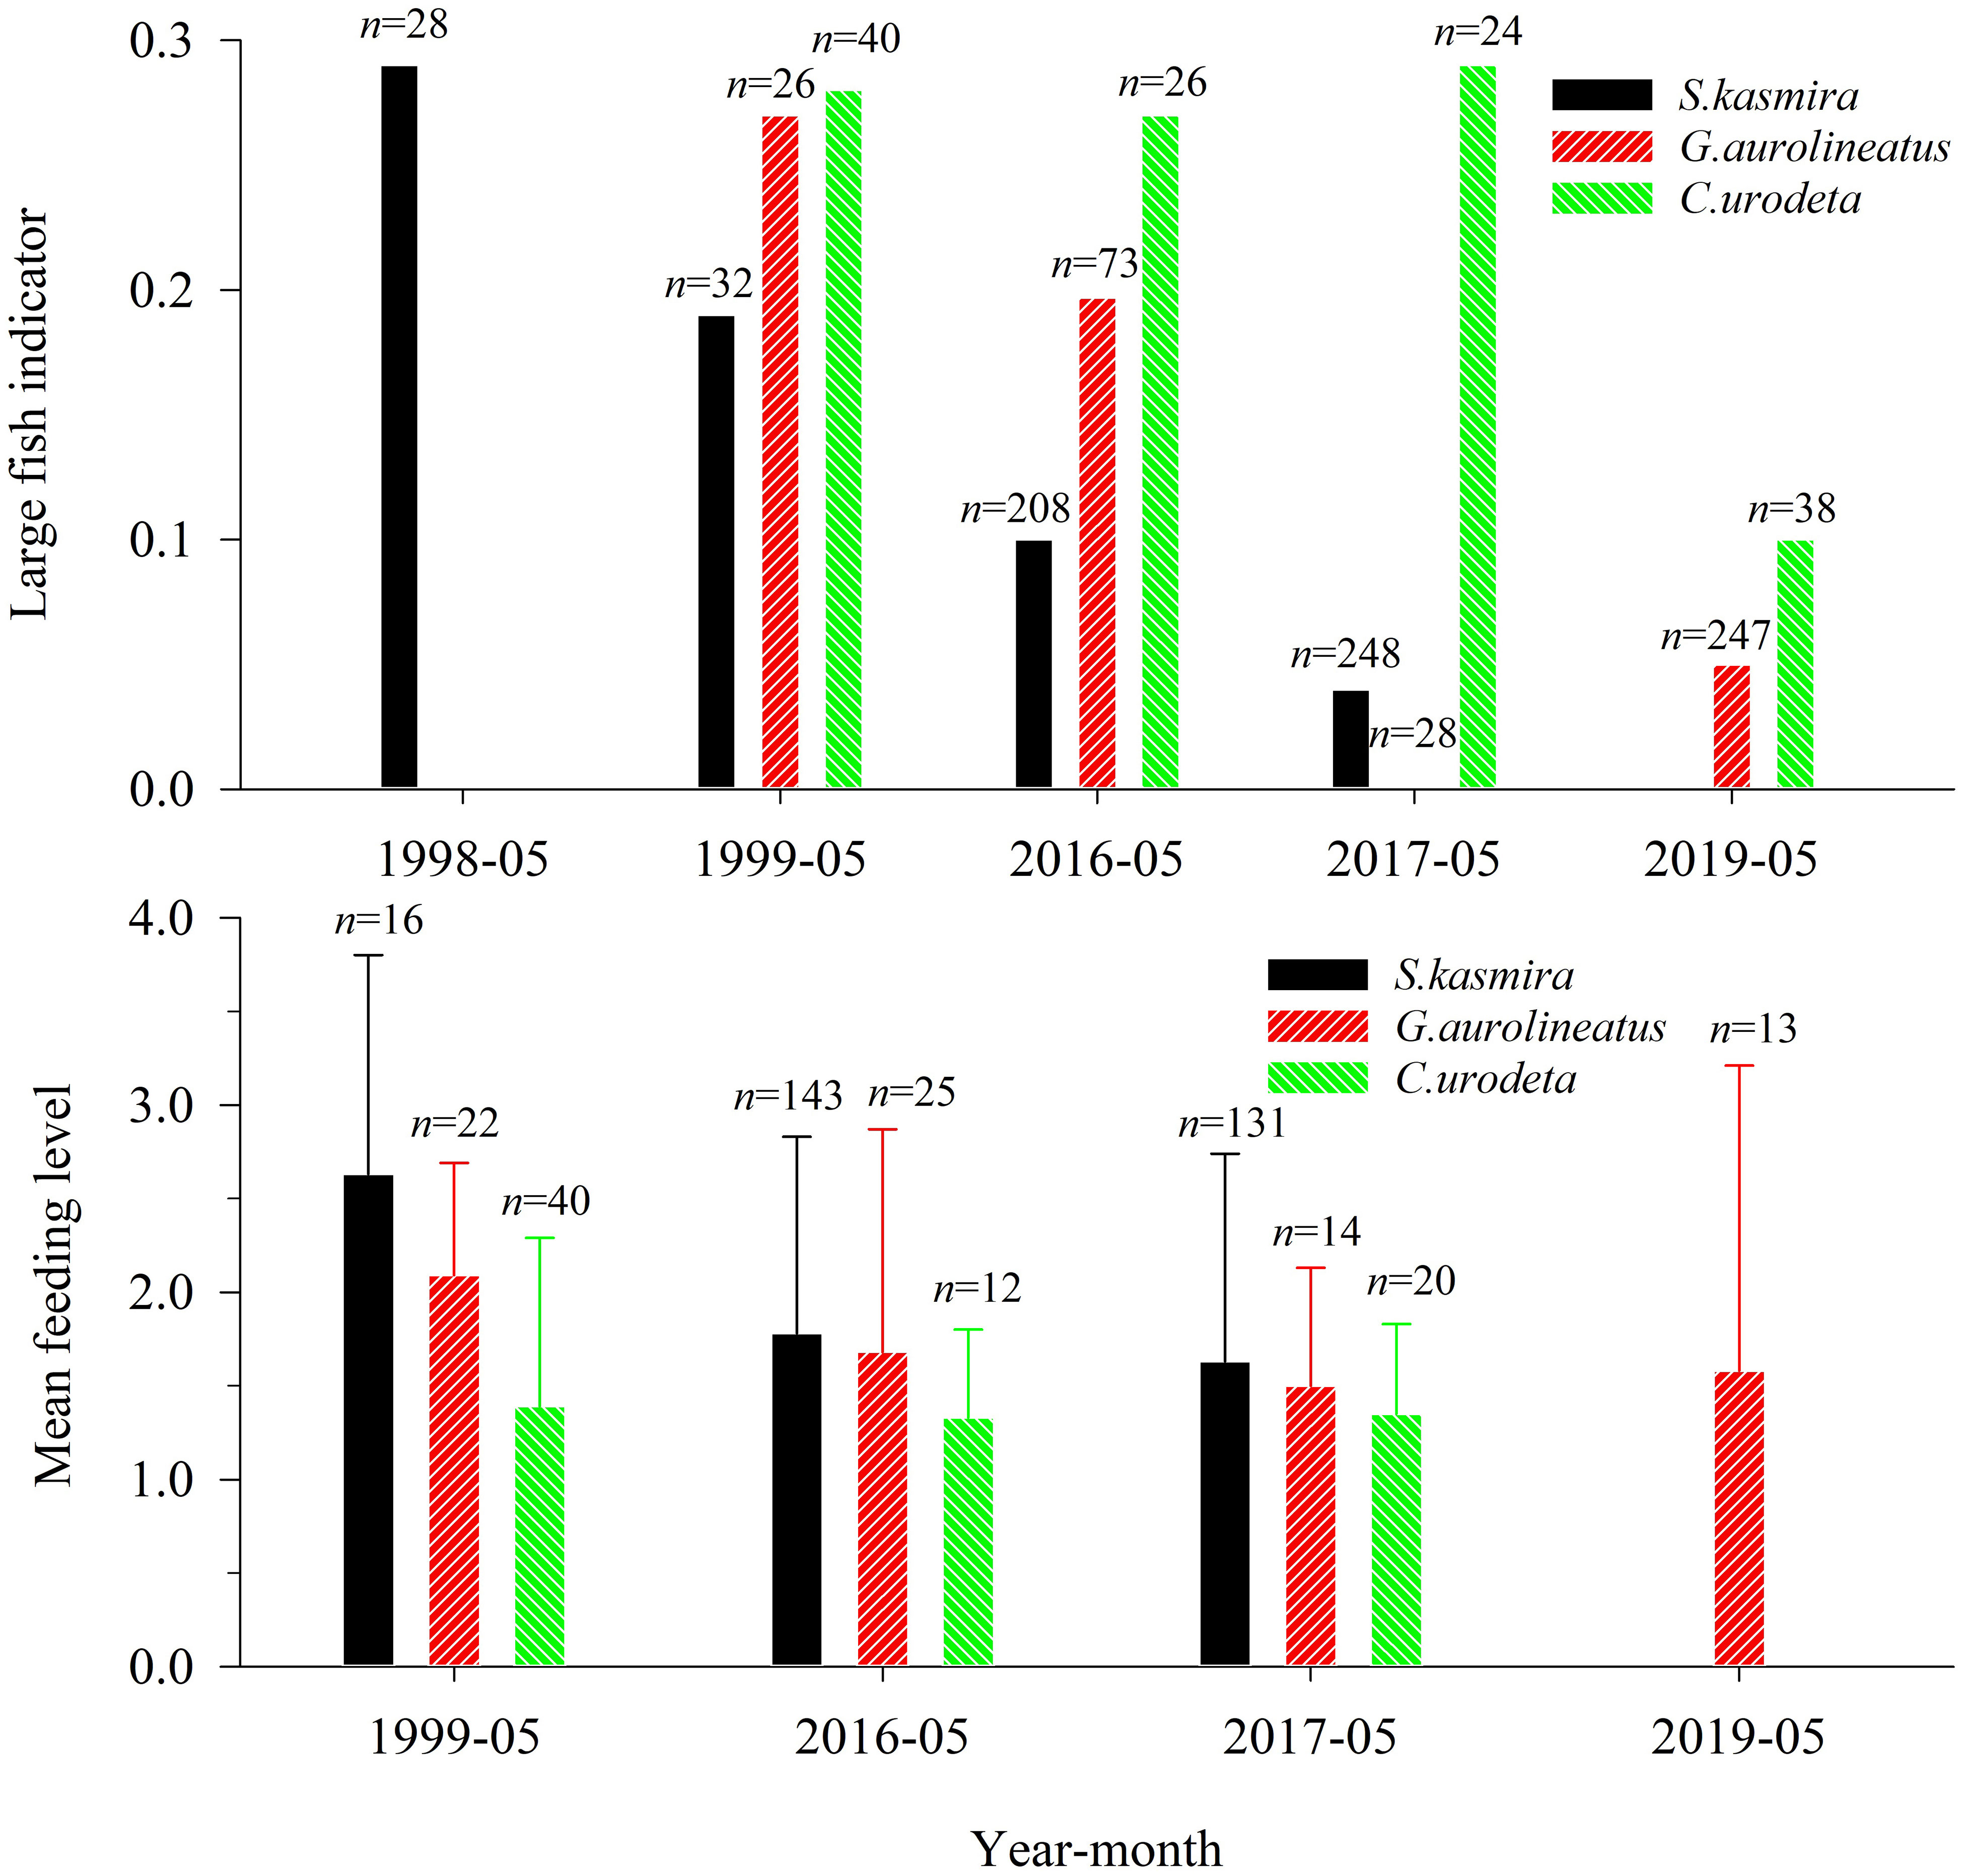
Figure 3 Large fish indicator and mean feeding level of Lutjanus kasmira, Gnathodentex aureolineatus and Cephalopholis urodeta during 1998–2019 in the Yongshu Reef, South China Sea. The error bar represents the corresponding standard deviation. The n above the error bar represents the number of corresponding replicate samples.
Compared with 1999, the MFL of L. kasmira and G. aureolineatus in 2016–2019 significantly decreased (ANOVA, p< 0.05), which indicated a decline of available prey (Figure 3). For C. urodeta, there was no significant difference in MFL between 1999 and 2016–2017 and 2019 (ANOVA, p > 0.05).
Relative fatness
For L. kasmira, G. aureolineatus and C. urodeta, their corresponding am and bm are 0.0332 and 2.9420, 0.0373 and 2.873, 0.0173 and 3.171, respectively; their relative fatness is shown in Figure 4. The relative fatness of L. kasmira in 1998–1999 was significantly larger than that in 2016–2017 (ANOVA, p< 0.05). The average relative fatness of G. aureolineatus in 2016 and 2019 was 88.3% of that in 1999, but the difference was not significant (ANOVA, p > 0.05). The average relative fatness of C. urodeta in 2016–2017 and 2019 was almost equal to that in 1999, and the difference was also insignificant (ANOVA, p > 0.05).
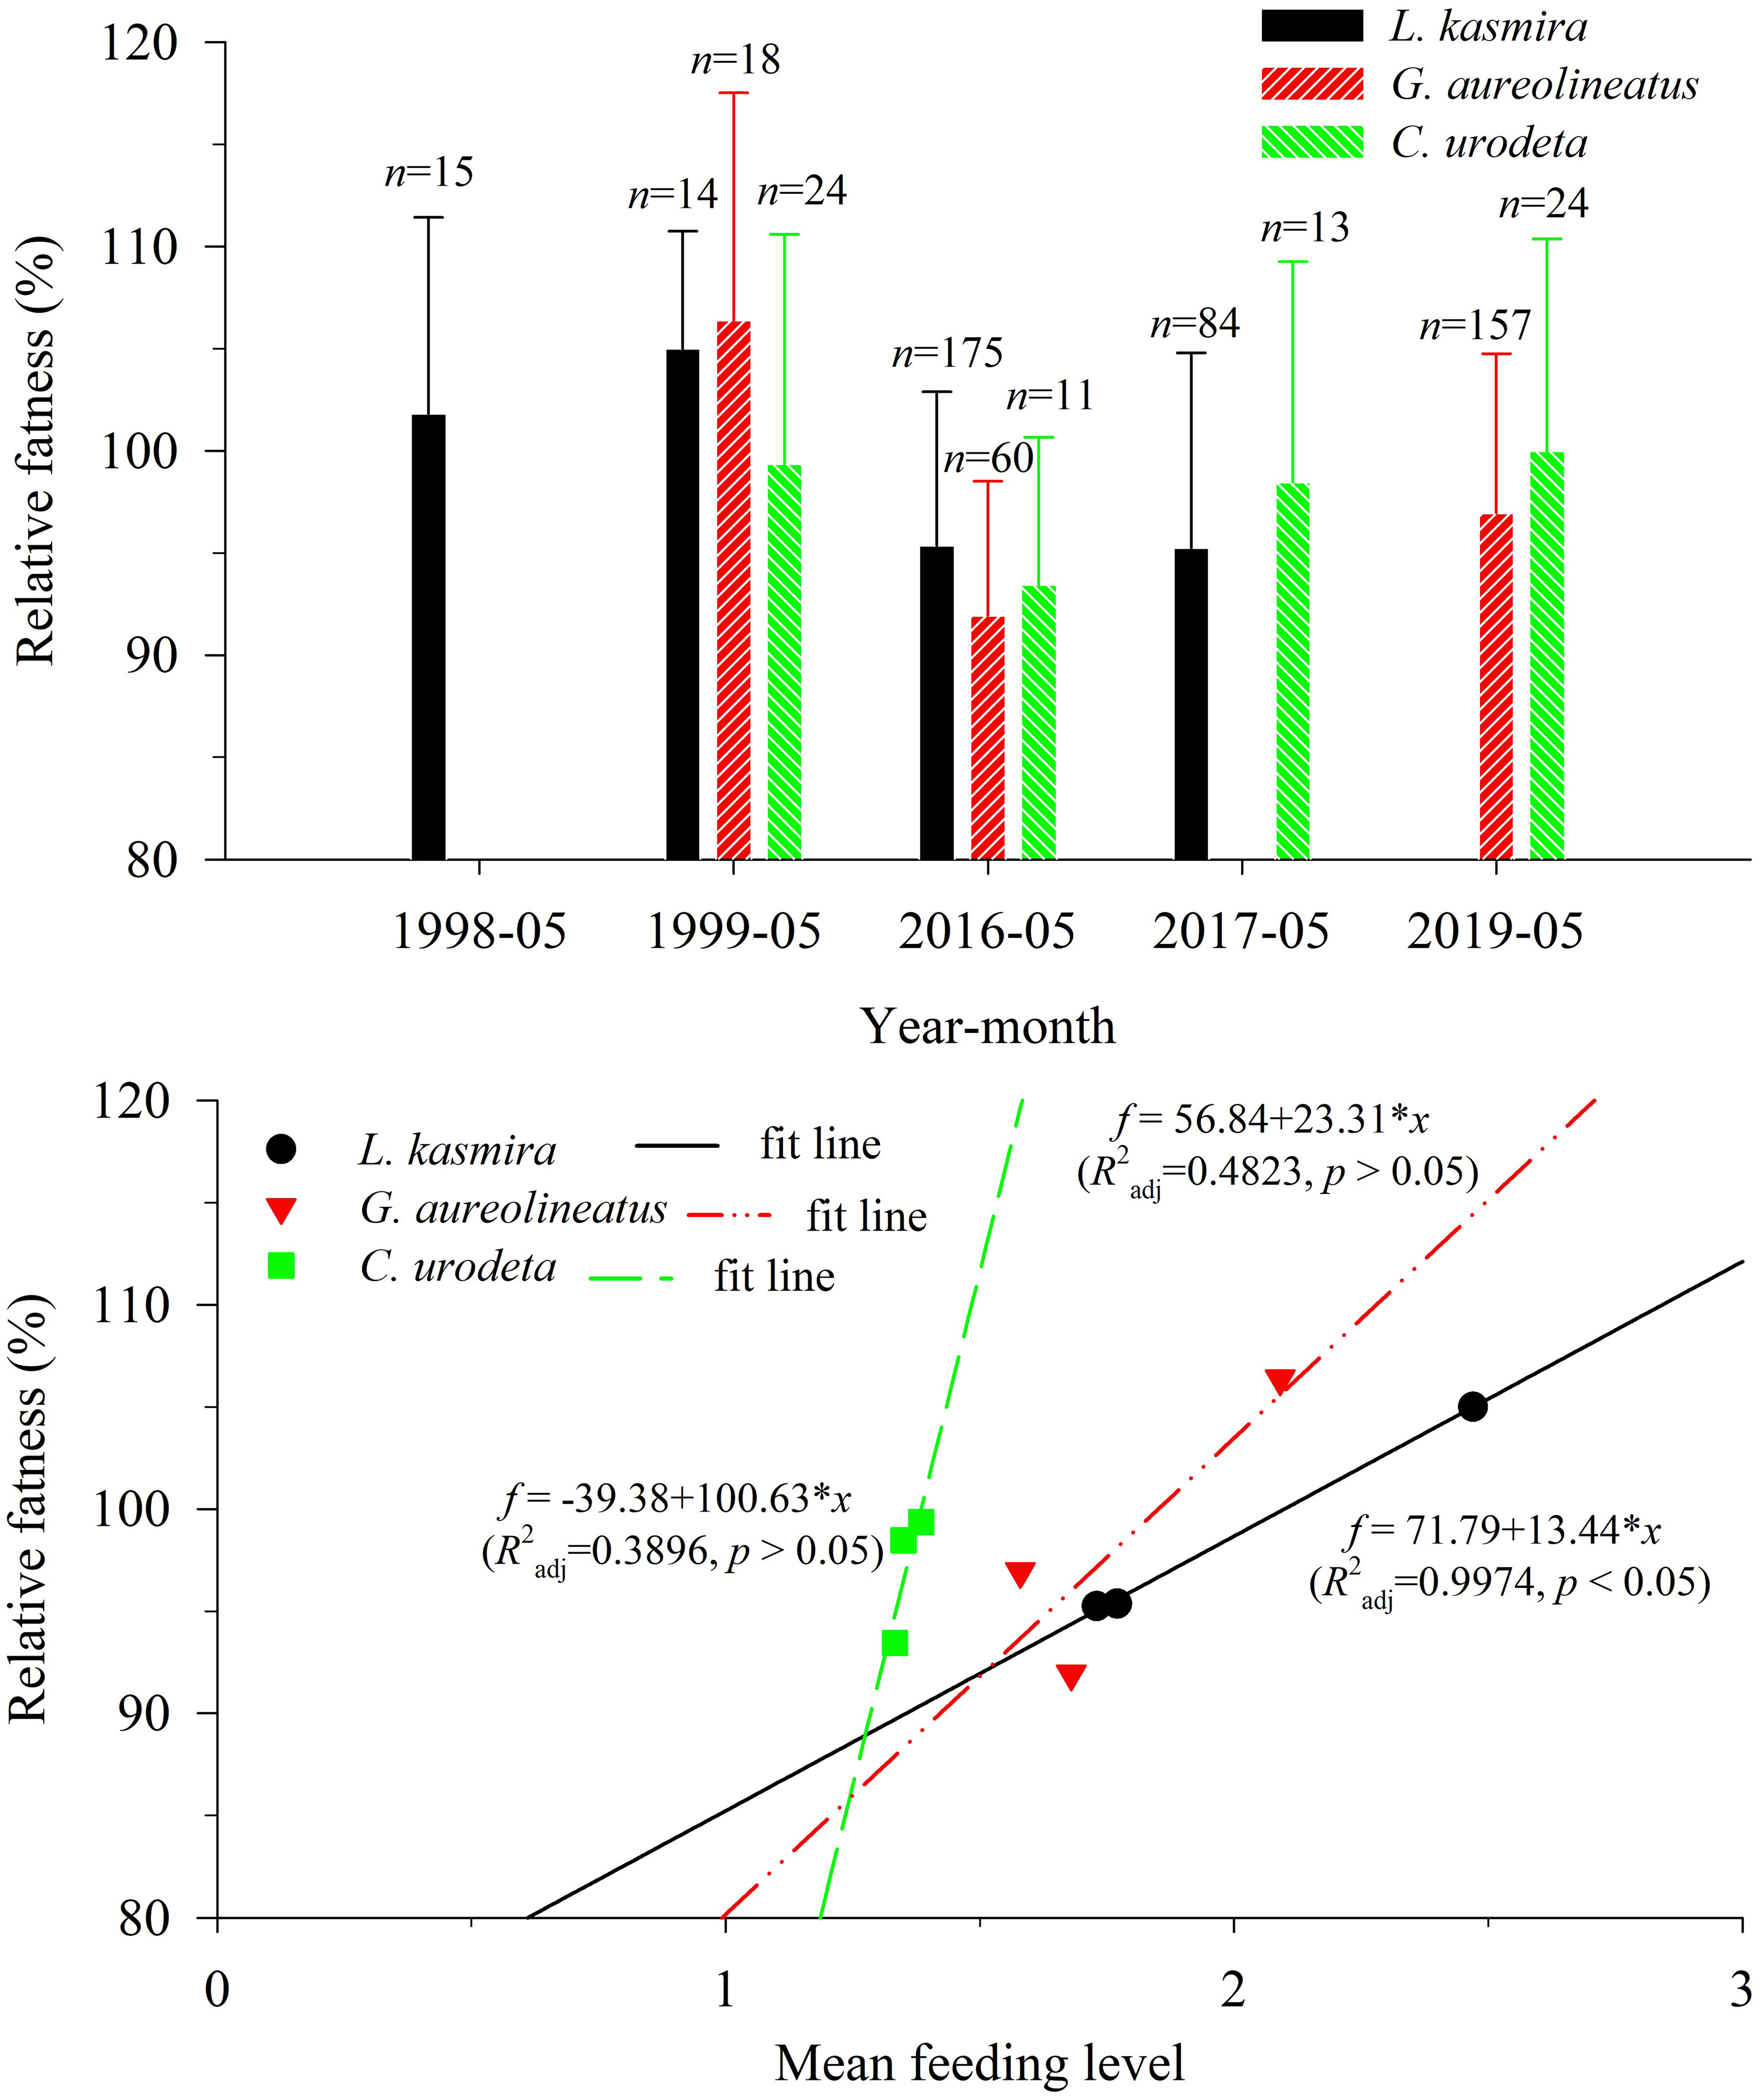
Figure 4 Variation in the relative fatness of Lutjanus kasmira, Gnathodentex aureolineatus and Cephalopholis urodeta in the Yongshu Reef, South China Sea and trend of relative fatness with mean feeding level. The error bar represents the corresponding standard deviation. The n above the error bar represents the number of corresponding replicate samples.
There were good linear relationships between the relative fatness and the corresponding MFL, which indicated that a drop in the MFL might drive a drop in the relative fatness (Figure 4). For L. kasmira, the linear relationship was significant (R2adj = 0.9974, p< 0.05). For G. aureolineatus and C. urodeta, the linear relationships were insignificant (R2adj = 0.4823, p > 0.05; R2adj = 0.3896, p > 0.05).
Fish vulnerability, SST and fishing intensity
Among three fish species, L. kasmira had the highest VS and the greatest biological decline; C. urodeta had the smallest VS and least biological changes (Figure 5). The ratios of the biological indicators of C. urodeta in 2016–2019 to those in 1999 were much greater than L. kasmira and G. aureolineatus. In terms of linear fit analysis, ABM was the most obvious indicator of variation with VS, followed by LFI, while MFL varied the least with VS (Figure 5).
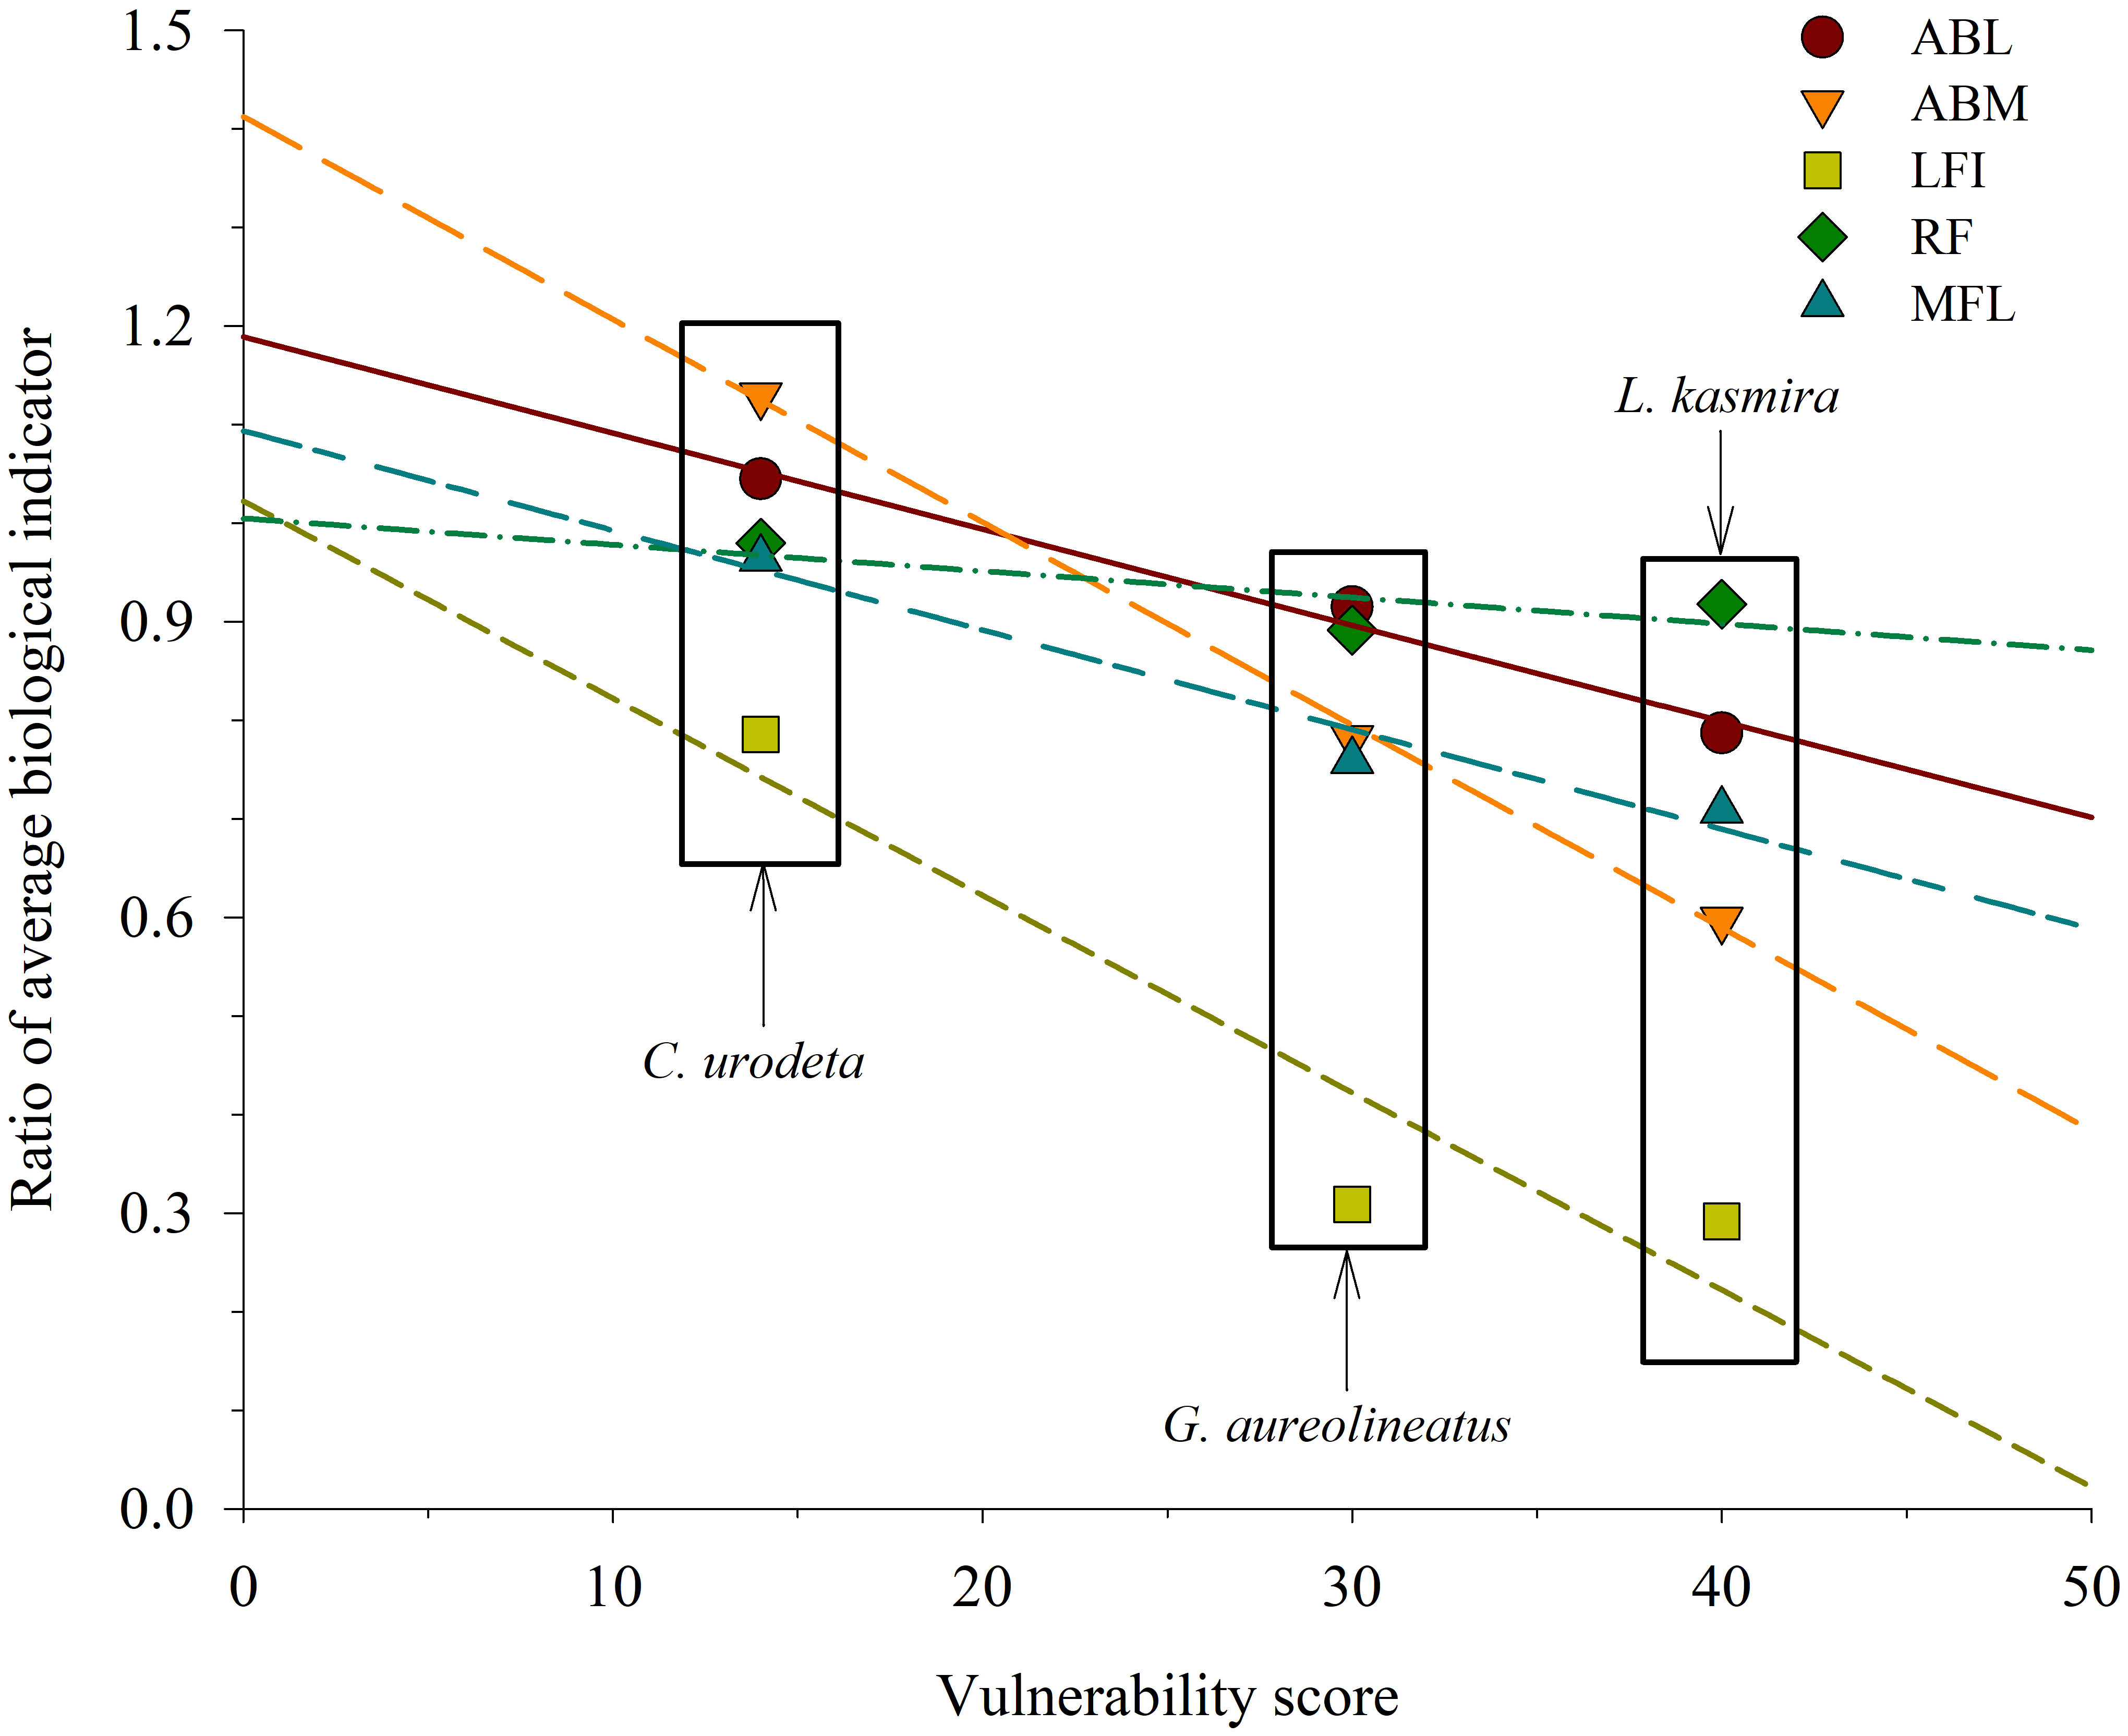
Figure 5 Linear fit between ratios of average biological indicators of Lutjanus kasmira, Gnathodentex aureolineatus and Cephalopholis urodeta in 2016–2019 to those in 1998–1999 and vulnerability score in the Yongshu Reef, South China Sea. ABL = -0.0097*VS + 1.1889 (R2adj = 0.9676, p< 0.05), ABM = -0.0206*VS + 1.4123 (R2adj = 0.9962, p< 0.05), LFI = -0.0200* VS + 1.0222 (R2adj = 0.7506, p > 0.05), RF = -0.0027* VS + 1.0046 (R2adj = 0.1970, p > 0.05), MFL = -0.0101* VS + 1.0935 (R2adj = 0.9189, p > 0.05).
The mean SST in annual May in the Yongshu Reef has been rising significantly since 2013 (Figure 6), and the mean SST in 2016–2018 was much higher than that in 1998–1999 (ANOVA, p< 0.05). In addition, two El Niño events with higher SST occurred in 1998 and 2015 in the SCS, causing massive coral bleaching and death.
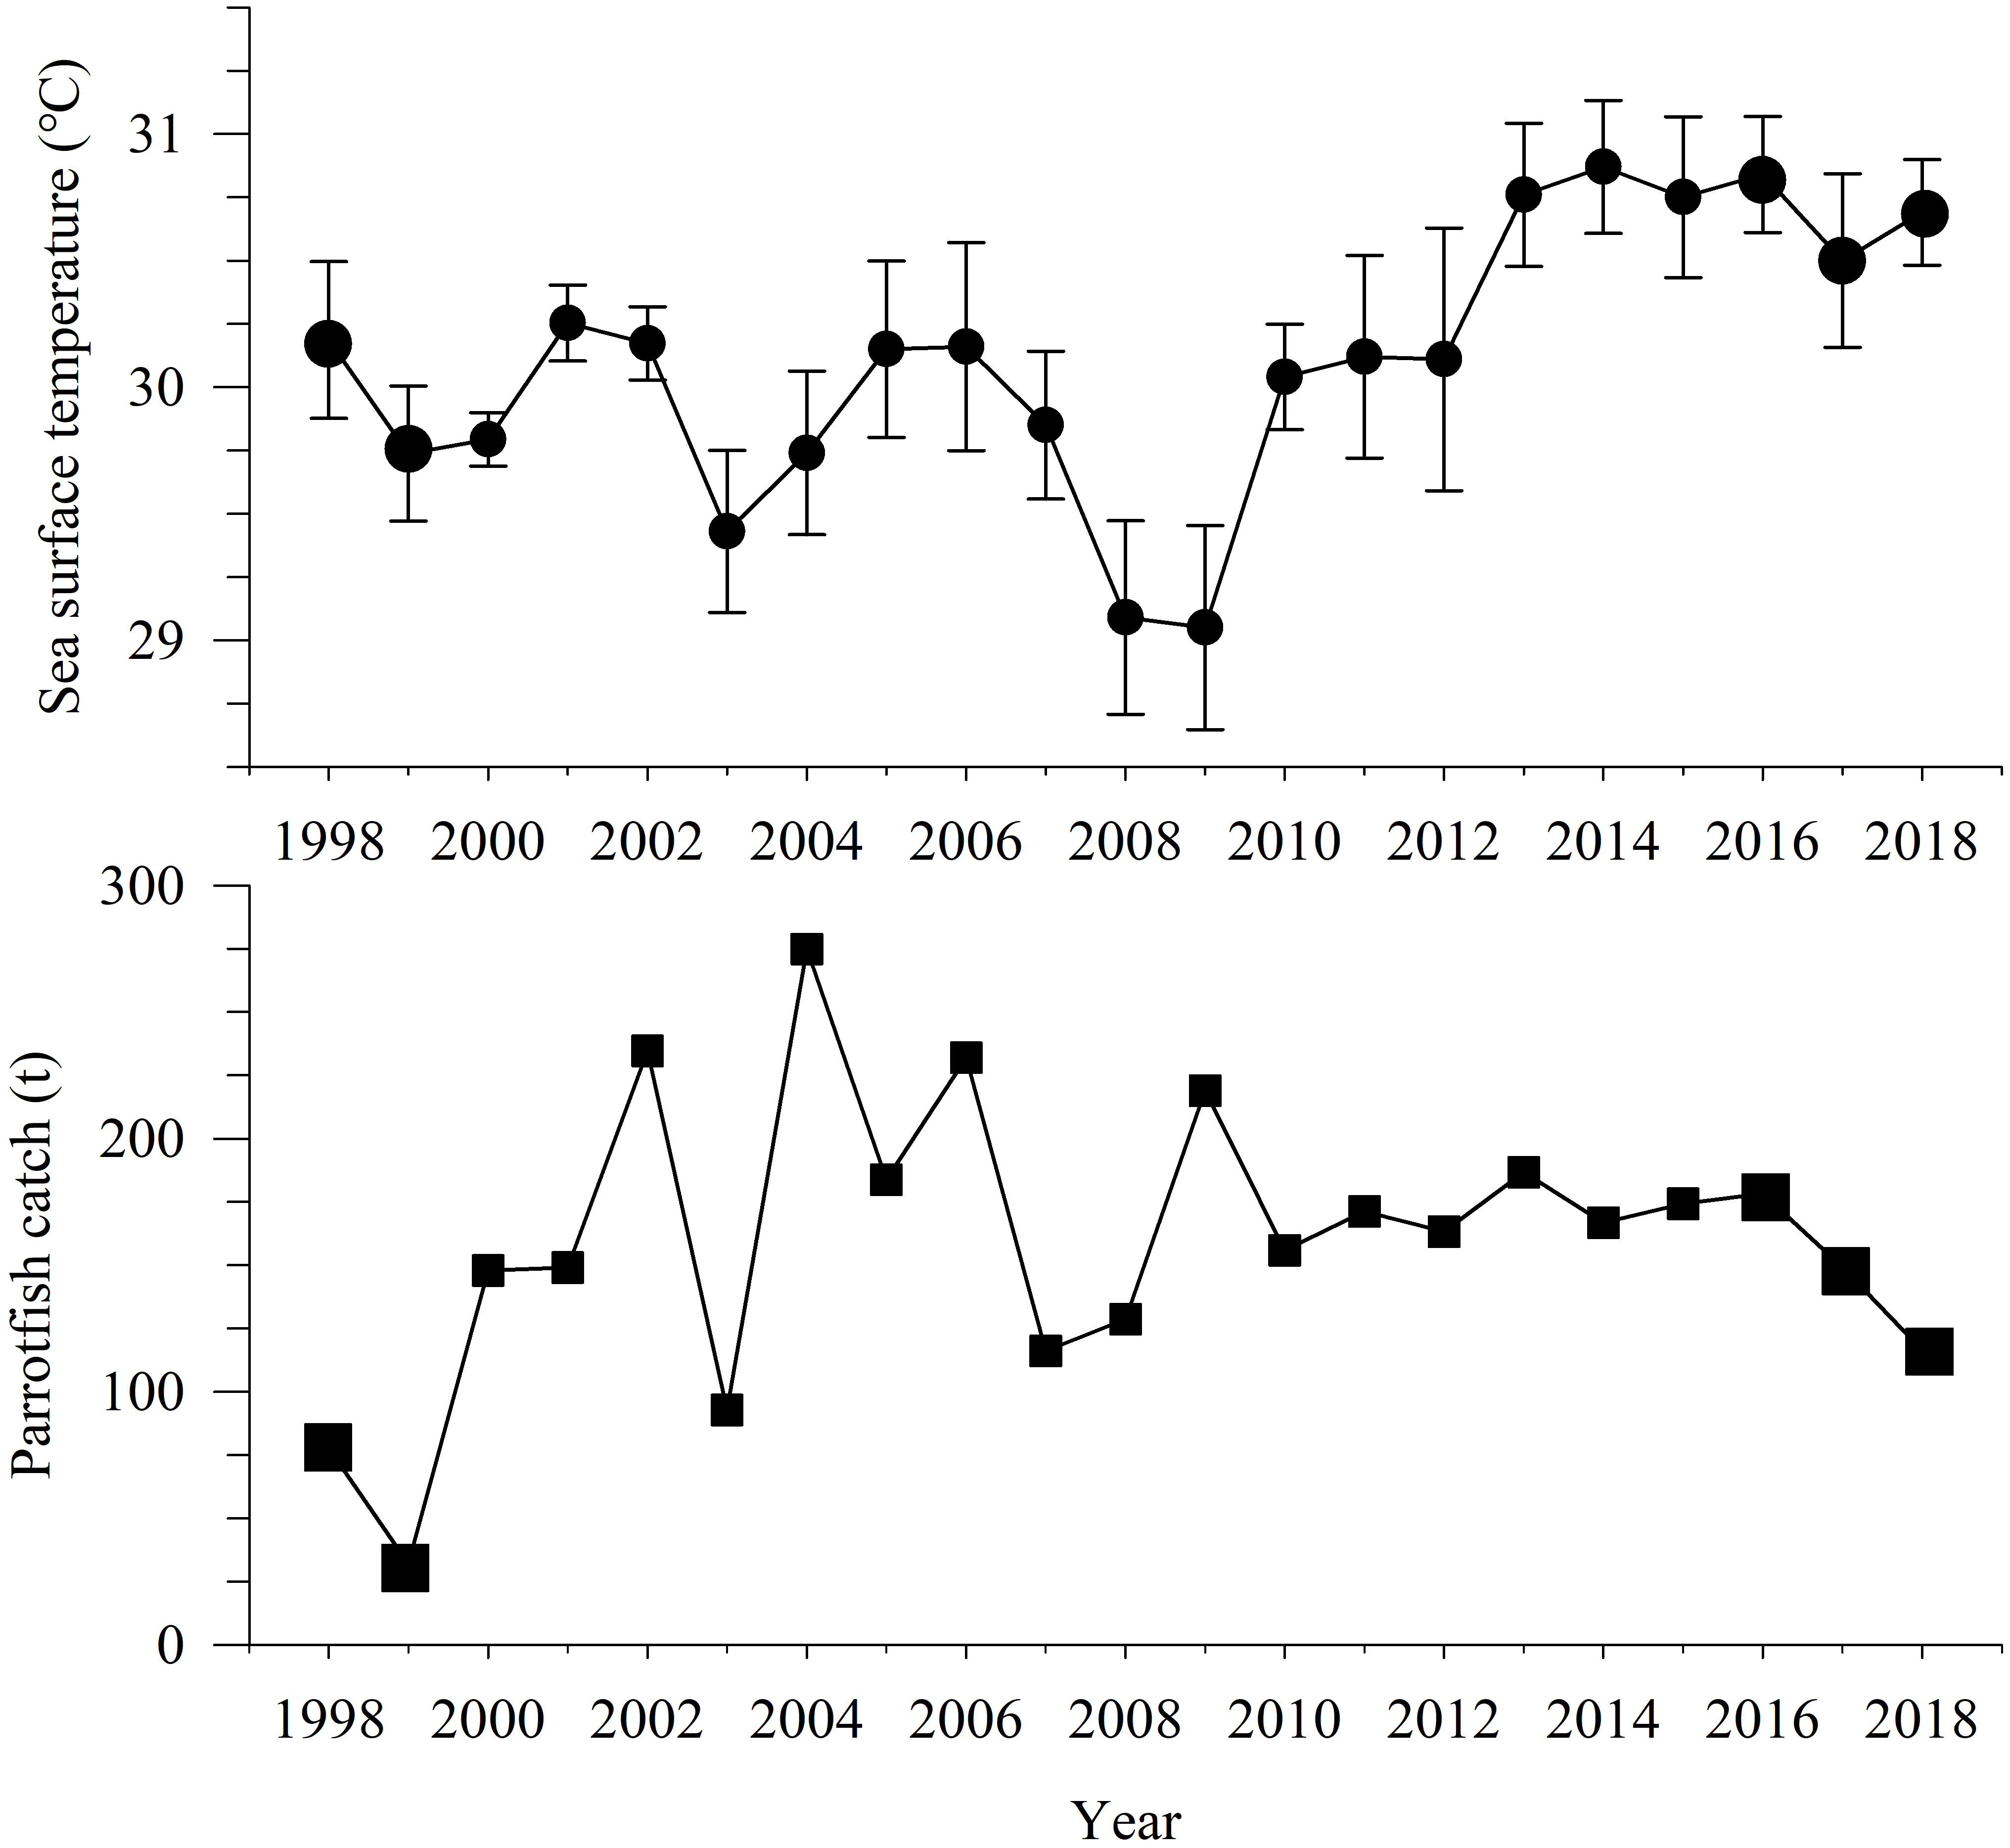
Figure 6 Variation of mean sea surface temperature in May 1998–2018 in the Yongshu Reef and catches of parrotfish from China1998–2018 in the South China Sea. The error bar represents the corresponding standard deviation.
From 1998–2018, the annual catch of parrotfish from China in the SCS experienced an increase and then a decrease, and the annual catch of parrotfish overall rose with the peak catch of 274.800 t in 2004 (Figure 6). The catch in 1998–1999 was very low (average: 54.905 t), the catch in 2016–2018 was 178.241–116.500 t (average: 147.983 t). The mean annual catch of parrotfish in 2016–2018 was much higher than that in 1998–1999 (ANOVA, p< 0.05).
Pearson correlation showed that fishing had the greatest effect on population size of L. kasmira, followed by G. aureolineatus and almost no effect on C. urodeta (Table 1). The effect of SST on RF was the most obvious in L. kasmira and least in C. urodeta. As for the effect of SST on MFL, the correlation coefficients of the three fish species were very high.
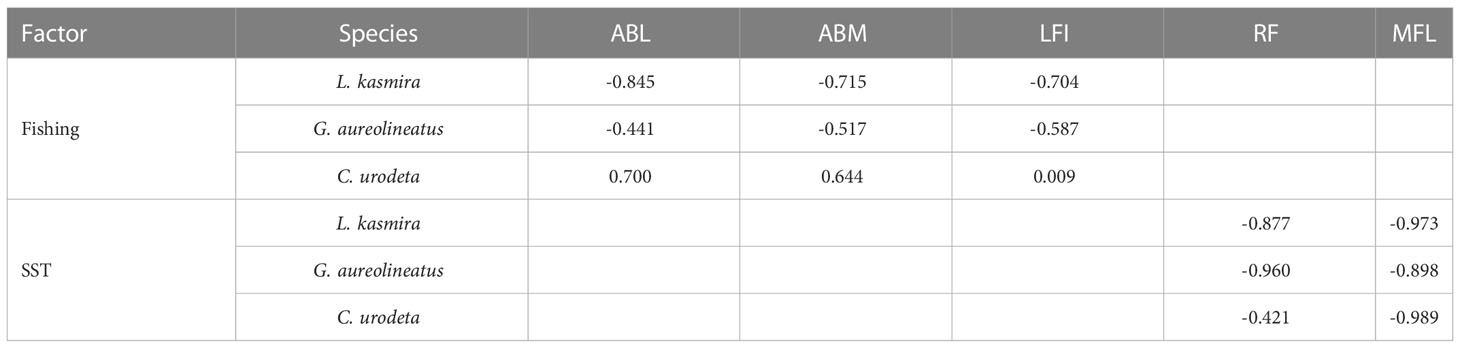
Table 1 Pearson correlation between fish biology and parrotfish catches and SST.
Discussion
Population size
For L. kasmira and G. aureolineatus, the ABL, ABM and LFI significantly decreased. The ABL and ABM of L. kasmira in 2016–2017 were only 79.0% and 59.8%, respectively, of those in 1998–1999. Similarly, the ABL and ABM of G. aureolineatus in 2016–2017 and 2019 were only 91.3% and 79.2% of those in 1999, respectively. Therefore, the sizes of L. kasmira and G. aureolineatus in the Yongshu Reef may have shown a trend of miniaturization. The miniaturization of commercial fishes in offshore ecosystems has long been commonplace (Claudet et al., 2010), such as Trichiurus haumela in the East China Sea (Zhou et al., 2002), Larimichthys polyactis in the Yellow Sea (Li et al., 2011) and Evynnis cardinalis in the SCS (Zhang et al., 2020). There were also many reports on the disappearance or decline of large coral reef fishes, such as sharks, barracudas, and other large fishes (Graham et al., 2005; Hughes et al., 2013; Allgeier et al., 2016; Robinson et al., 2017). In light of our visit and observations, L. kasmira, G. aureolineatus and C. urodeta were caught commercially by fishermen in diving, gillnet and handline at the Yongshu, with L. kasmira being the most fished and C. urodeta the least. Our study shows that L. kasmira and G. aureolineatus, which are not traditional large coral reef fish, are also undergoing miniaturization.
The biological changes of C. urodeta were different from those of L. kasmira and G. aureolineatus. The ABL and ABM of C. urodeta during 2016–2017 and 2019 were greater than that in 1999. Compared with 1999, the LFI of C. urodeta was not significantly different during 2016–2017 and 2019 either. We hypothesized that C. urodeta has not shown miniaturization. Thus, different coral reef fishes differ in their ability to maintain a stable population under external stress. The vulnerability of C. urodeta is lower than that of L. kasmira and G. aureolineatus, while the resilience of the former is higher than that of the latter (Cheung et al., 2005; Froese et al., 2017). This may be an extremely important reason why the biological changes of C. urodeta were smaller than those of the other two species.
Relative fitness
Over the past few decades, the proportion of L. kasmira and G. aureolineatus specimens with low feeding intensity continuously increased and the proportion of corresponding specimens with high feeding intensity significantly decreased, which caused MFL decrease. However, the MFL of C. urodeta in 2016–2017 was almost unchanged from that in 1999. In terms of prey, L. kasmira feed on fishes, benthic invertebrates, cephalopods, planktonic crustaceans, and a variety of algae; G. aureolineatus feed on benthic invertebrates and occasionally on small fish; C. urodeta mainly feed on small fishes and occasionally on crustaceans, but are mainly piscivores (Froese and Pauly, 2022). Therefore, C. urodeta has a higher trophic level in the food chain than L. kasmira and G. aureolineatus. In coral reefs, regime shifts from coral- to algae-dominated states significantly alter the assemblage of small-bodied reef fishes associated with coral and shorten food chains for meso-predators with potential sublethal effects, which results in potential population declines in the longer term (Hempson et al., 2018). Because of the higher trophic level, the effect of regime shifts may lag in C. urodeta compared with L. kasmira and G. aureolineatus. Compared with 1998–1999, the relative fitness of L. kasmira and G. aureolineatus significantly declined in 2016–2019, which indicated their food and habitat deterioration (Froese, 2006). For L. kasmira, G. aureolineatus and C. urodeta, the positive correlation between the relative fitness and the MFL indicated that the increasingly deteriorating food supply might be the main direct cause of relative fitness decline.
It is especially worth noting that we found chicken in the stomach of L. kasmira in 2017. It is not yet clear whether that was accidental or hungry predation of L. kasmira. Regardless, it is undoubtedly direct evidence that human activities affect the food chain of coral reef fish, which should catch our attention. In our study, chicken was not used for bait. The Yongshu Reef is inhabited and has a UNESCO marine observatory. But as far as we know, there are complete garbage collection and treatment facilities on the reef. Because fishermen fish on Yongshu Reef, sometimes they also go to Yongshu Reef to take shelter from the wind. These fishermen are not strict with the disposal of domestic waste, so the chicken should probably come from these commercial fishing vessels. To reduce the negative impact of human activities on coral reef fish, rigorous protection regulations in the coral reef must been formulated and implemented to prevent eutrophication, invasion of foreign substances, and physical destruction.
Threats to coral reef fish
Climate change and human activity are two primary factors that cause changes in fish biology (Zaneveld et al., 2016; Robinson et al., 2017; Rummer and Munday, 2017). Ocean temperature increase is one of the most concerning climate changes disrupting coral reef ecosystems (Munday et al., 2008). The abnormal increase of ocean temperature leads to the bleaching and death of corals, which in turn leads to the degradation of habitat and decline of associated fish by reducing the fecundity, survival rate, and growth rate of reef fishes (Richardson et al., 2017; Hempson et al., 2018; Kingsbury et al., 2020). The overall SST on the Yongshu Reef and nearby waters increased from 1998 to 2019. In 1998 and 2015, there were also two El Niño events in the SCS, which caused SST to be 2–6°C higher than the maximum temperature in normal years; this led to widespread bleaching and death of coral (Hughes et al., 2013; Zhao et al., 2013; DeCarlo et al., 2017; Hughes et al., 2017). On offshore atolls and archipelagos in the SCS, coral cover has drastically declined, which has been accompanied by outbreaks of harmful species, diseases and regime shifts in the coral reef (Hughes et al., 2013; Arai, 2015; Zhao et al., 2016). The potential decline in coral cover and habitat is a likely explanation for the changes in the body size and condition that have been observed by our study. However, it is a shame that there is no coral cover data from Yongshu Reef. Unlike corals, most reef fishes are probably not living very close to their lethal thermal limits. Nevertheless, increased sea temperature could have significant effects on individual performance (Mora and Ospina, 2001). Fishes are ectotherms and temperature changes of a few degrees Celsius can influence factors such as their physiological condition, growth rate, and reproductive performance (Wood and Mcdonald, 1997).
Fishing is a leading human activity that causes the reduction or loss of large fish in coral reefs and both degrades size structure of reef fish communities and reduces their trophic level (Allgeier et al., 2016; Robinson et al., 2017). Graham et al. (2005) found that the size spectra slope of reef fish assemblages became steeper and the height declined with increasing fishing intensity, and concluded that steepening of the slope with increasing fishing intensity largely resulted from reductions in the relative abundance of large fish and not from the ecological release of small fish following depletion of their predators. According to our analysis, the increased fishing intensity obviously caused the decline of biological indicators of L. kasmira and G. aureolineatus. While fishing appeared to have a significant impact on the size structure of fish in the Yongshu Reef. We believed that selective fishing was the main reason for L. kasmira and G. aureolineatus to get smaller.
Destructive fishing is also an important threat to coral reef fish. Some studies reported that destructive fishing, such as poison and blast fishing, has damaged more than 50% of coral reefs in the SCS (Hughes et al., 2013; Arai, 2015; Zhao et al., 2016). In the SCS, there are far greater impacts of unfriendly and unsustainable human activities on the regression of coral coverage compared with climate change (Hughes et al., 2013). The impact of destructive fishing on coral reefs and their fishes is profound, with devastating and long-term consequences that are difficult to measure; it directly causes the death of corals and fishes, completely destroys the habitats on which fish depend, and also leads to the overall degradation of coral reef structure and function. Other human activities, such as sedimentation and contamination, are also important factors that kill coral reef fish (Zaneveld et al., 2016; Zhao et al., 2016).
China’s management of coral reefs in the SCS is becoming stricter. In the coral reefs under China’s jurisdiction, the water ecosystems are protected and their indicators are measured, and fishing has been strictly regulated since 2015. However, in the coral reefs of the SCS managed by other countries, destructive fishing is still a problem that needs resolution (Arai, 2015). The conservation of coral reefs and their fishes in the SCS, where six countries claim sovereignty over offshore reefs and atolls, is a severe problem that involves multiple sets of players. Putting aside disputes, sincere cooperation, and responsible attitudes will be the only way to save the coral reefs and their fishes.
Conclusion
Over a 20 years period, L. kasmira and G. aureolineatus at the Yongshu Reef shown a trend of miniaturization, while C. urodeta did not. We hypothesized that different coral reef fishes have different abilities to maintain population stability under external pressures for different population vulnerability.
Compared with 1998–1999, the mean feeding level and relative fitness of L. kasmira and G. aureolineatus significantly declined in 2016–2019, which indicated their food and habitat deterioration. However, the mean feeding level and relative fitness of C. urodeta in 2016–2019 was almost unchanged from that in 1999. The positive correlation between the relative fitness and the MFL indicated that the increasingly deteriorating food supply might be the main direct cause of relative fitness decline. The effect of regime shifts may lag in C. urodeta compared with L. kasmira and G. aureolineatus.
The increased fishing intensity obviously caused the decline of biological indicators of L. kasmira and G. aureolineatus. While fishing appeared to have a significant impact on the size structure of fish in the Yongshu Reef. To reduce the negative impact of human activities on coral reef fish, rigorous protection regulations in the coral reef must been formulated and implemented.
Data availability statement
The original contributions presented in the study are included in the article/Supplementary Material. Further inquiries can be directed to the corresponding authors.
Ethics statement
The animal study was reviewed and approved by South China Sea Fisheries Research Institute Animal welfare committee.
Author contributions
JZ wrote the first draft. JZ, YC, YG, SC and ZC carried out survey, specimen collection and data analyses. JL and KZ performed data curation and analyses. ZC reviewed the first draft. All authors contributed to the article and approved the submitted version.
Funding
This study was supported by funding from the Guangdong Basic and Applied Basic Research Foundation (2021A1515011025), National Natural Science Foundation of China (31902374), Key Special Project for Introduced Talents Team of Southern Marine Science and Engineering Guangdong Laboratory (Guangzhou) (GML2019ZD0605), the Special Agricultural Finance Project (NFZX2021), the Central Public interest Scientific Institution Basal Research Fund, CAFS (2020TD05), the Central Public Interest Scientific Institution Basal Research Fund, South China Sea Fisheries Research Institute, CAFS (2021SD01).
Acknowledgments
We thank the crew of the R/V NanFeng for their support.
Conflict of interest
The authors declare that the research was conducted in the absence of any commercial or financial relationships that could be construed as a potential conflict of interest.
Publisher’s note
All claims expressed in this article are solely those of the authors and do not necessarily represent those of their affiliated organizations, or those of the publisher, the editors and the reviewers. Any product that may be evaluated in this article, or claim that may be made by its manufacturer, is not guaranteed or endorsed by the publisher.
References
Allgeier J. E., Valdivia A., Cox C., Layman C. A. (2016). Fishing down nutrients on coral reefs. Nat. Commun. 7 (1), 12461. doi: 10.1038/ncomms12461
Arai T. (2015). Diversity and conservation of coral reef fishes in the Malaysian south China Sea. Rev. Fish Biol. Fisheries 25 (1), 85–101. doi: 10.1007/s11160-014-9371-9
Bell J. D., Ratner B. D., Stobutzki I., Oliver J. (2006). Addressing the coral reef crisis in developing countries. Ocean Coast. Manage. 49 (12), 976–985. doi: 10.1016/j.ocecoaman.2005.12.001
Cabanban A. S. (2018). Cephalopholis urodeta. IUCN Red List Threatened Species 2018, e.T132783A100458618. doi: 10.2305/IUCN.UK.2018-2.RLTS.T132783A100458618.en
Carpenter K. E., Lawrence A., Myers R. (2016). Gnathodentex aureolineatus. IUCN Red List Threatened Species 2016, e.T16719296A16722275. doi: 10.2305/IUCN.UK.2016-3.RLTS.T16719296A16722275.en
Cheung W. W. L., Pitcher T. J., Pauly D. (2005). A fuzzy logic expert system to estimate intrinsic extinction vulnerabilities of marine fishes to fishing. Biol. Conserv. 124 (1), 97–111. doi: 10.1016/j.biocon.2005.01.017
Claudet J., Osenberg C. W., Domenici P., Badalamenti F., Milazzo M., Falcón J. M., et al. (2010). Marine reserves: Fish life history and ecological traits matter. Ecol. Appl. 20 (3), 830–839. doi: 10.1890/08-2131.1
DeCarlo T. M., Cohen A. L., Wong G. T., Davis K. A., Lohmann P., Soong K. (2017). Mass coral mortality under local amplification of 2°C ocean warming. Sci. Rep. 7 (1), 1–9. doi: 10.1038/srep44586
Fei H., Zhang S. (1990). Science of fishery resources (Beijing, China: China Science and Technology Press).
Froese R. (2006). Cube law, condition factor and weight-length relationships: History, meta-analysis and recommendations. J. Appl. Ichthyology 22 (4), 241–253. doi: 10.1111/j.1439-0426.2006.00805.x
Froese R., Demirel N., Coro G., Kleisner K. M., Winker H. (2017). Estimating fisheries reference points from catch and resilience. Fish Fisheries 18 (3), 506–526. doi: 10.1111/faf.12190
Froese R., Pauly D. (2022) Fishbase 2022. Available at: www.fishbase.org.
Fry G. C., Brewer D. T., Venables W. N. (2006). Vulnerability of deepwater demersal fishes to commercial fishing: Evidence from a study around a tropical volcanic seamount in Papua new Guinea. Fisheries Res. 81 (2-3), 126–141. doi: 10.1016/j.fishres.2006.08.002
Graham N. A. J., Dulvy N. K., Jennings S., Polunin N. V. C. (2005). Size-spectra as indicators of the effects of fishing on coral reef fish assemblages. Coral Reefs 24 (1), 118–124. doi: 10.1007/s00338-004-0466-y
Greenstreet S. P., Rogers S. I., Rice J. C., Piet G. J., Guirey E. J., Fraser H. M., et al. (2011). Development of the EcoQO for the north Sea fish community. ICES J. Mar. Sci. 68 (1), 1–11. doi: 10.1093/icesjms/fsq156
Hempson T. N., Graham N. A., MacNeil M. A., Bodin N., Wilson S. K. (2018). Regime shifts shorten food chains for mesopredators with potential sublethal effects. Funct. Ecol. 32 (3), 820–830. doi: 10.1111/1365-2435.13012
Hughes T. P., Huang H. U. I., Young M. A. (2013). The wicked problem of china's disappearing coral reefs. Conserv. Biol. 27 (2), 261–269. doi: 10.1111/j.1523-1739.2012.01957.x
Hughes T. P., Kerry J. T., Álvarez-Noriega M., Álvarez-Romero J. G., Anderson K. D., Baird A. H., et al. (2017). Global warming and recurrent mass bleaching of corals. Nature 543 (7645), 373–377. doi: 10.1038/nature21707
Kingsbury K. M., Gillanders B. M., Booth D. J., Coni E. O., Nagelkerken I. (2020). Range-extending coral reef fishes trade-off growth for maintenance of body condition in cooler waters. Sci. Total Environ. 703, 134598. doi: 10.1016/j.scitotenv.2019.134598
Li Y., Jia X., Chen G., Chen P., Shu L., Zeng X. (2007). The south China Sea coral reef fish resources (Beijing, China: Ocean Press).
Li Z., Shan X., Jin X., Dai F. (2011). Long-term variations in body length and age at maturity of the small yellow croaker (Larimichthys polyactis bleeker 1877) in the bohai Sea and the yellow Sea, China. Fisheries Res. 110 (1), 67–74. doi: 10.1016/j.fishres.2011.03.013
Li Y. C., Wu Z. J., Chen S. Q., Cai Z. F., Lan J. X., Tong Y. H., et al. (2017). Discussion of the diversity of the coral reef fish in the shallow reefs along the yongxing and qilianyu island. Mar. Environ. Sci. 36 (4), 509–516. doi: 10.13634/j.cnki.mes.2017.04.005
Mora C., Chittaro P. M., Sale P. F., Kritzer J. P., Ludsin S. A. (2003). Patterns and processes in reef fish diversity. Nature 421 (6926), 933–936. doi: 10.1038/nature01393
Mora C., Ospina A. (2001). Tolerance to high temperatures and potential impact of sea warming on reef fishes of gorgona island (tropical eastern pacific). Mar. Biol. 139 (4), 765–769. doi: 10.1007/s002270100626
Munday P. L., Jones G. P., Pratchett M. S., Williams A. J. (2008). Climate change and the future for coral reef fishes. Fish Fisheries 9 (3), 261–285. doi: 10.1111/j.1467-2979.2008.00281.x
Noonan S. H., Jones G. P., Pratchett M. S. (2012). Coral size, health and structural complexity: Effects on the ecology of a coral reef damselfish. Mar. Ecol. Prog. Ser. 456, 127–137. doi: 10.3354/meps09687
Pauly D., Zeller D., Palomares M. L. D. (2020) Sea Around us concepts, design and data. Available at: https://www.seaaroundus.org.
Pothin K., Tessier E., Chabanet P., Lecomte Finiger R. (2006). Larval life history traits and larval growth of gnathodentex aureolineatus (lethrinidae) before and after settlement in a sandy bay of reunion island (SW indian ocean). Cybium 30 (1), 27–33.
Richardson L. E., Graham N. A., Pratchett M. S., Hoey A. S. (2017). Structural complexity mediates functional structure of reef fish assemblages among coral habitats. Environ. Biol. Fishes 100 (3), 193–207. doi: 10.1007/s10641-016-0571-0
Robinson J. P., Williams I. D., Edwards A. M., McPherson J., Yeager L., Vigliola L., et al. (2017). Fishing degrades size structure of coral reef fish communities. Global Change Biol. 23 (3), 1009–1022. doi: 10.7287/peerj.preprints.2118v1
Rummer J. L., Munday P. L. (2017). Climate change and the evolution of reef fishes: Past and future. Fish Fisheries 18 (1), 22–39. doi: 10.1111/j.1467-2979.2008.00281.x
Russell B., Lawrence A., Myers R., Carpenter K. E., Smith-Vaniz W. F. (2016). Lutjanus kasmira. IUCN Red List Threatened Species 2016, e.T194337A2314753. doi: 10.2305/IUCN.UK.2016-3.RLTS.T194337A2314753.en
Vignon M., Morat F., Galzin R., Sasal P. (2008). Evidence for spatial limitation of the bluestripe snapper Lutjanus kasmira in French Polynesia from parasite and otolith shape analysis. J. Fish Biol. 73 (10), 2305–2320. doi: 10.1111/j.1095-8649.2008.02070.x
Wood C. M., Mcdonald D. G. (1997). Global warming: Implications for freshwater and marine fish (Cambridge: Cambridge University Press).
Zaneveld J. R., Burkepile D. E., Shantz A. A., Pritchard C. E., McMinds R., Payet J. P., et al. (2016). Overfishing and nutrient pollution interact with temperature to disrupt coral reefs down to microbial scales. Nat. Commun. 7 (1), 1–12. doi: 10.1038/ncomms11833
Zhang K., Cai Y., Liao B., Jiang Y. E., Sun M., Su L., et al. (2020). Population dynamics of threadfin porgy evynnis cardinalis, an endangered species on the IUCN red list in the beibu gulf, south China Sea. J. Fish Biol. 97 (2), 479–489. doi: 10.1111/jfb.14398
Zhang J., Chen Z., Chen G. (2015). A preliminary study on biology of glowfish (Gnathodentex aureolineatus) in yongshu reef of nansha area in the south China Sea. South China Fisheries Sci. 11 (5), 108–116. doi: 10.3969/j.issn.2095-0780.2015.05.013
Zhang K., Zhang J., Shi D., Chen Z. (2021). Assessment of coral reef fish stocks from the nansha islands, south China Sea, using length-based Bayesian biomass estimation. Front. Mar. Sci. 7. doi: 10.3389/fmars.2020.610707
Zhao H. T., Wang L. R., Yuan J. Y. (2016). Sustainable development of the coral reefs in the south China Sea islands. Trop. Geogr. 36 (1), 55–65. doi: 10.13284/j.cnki.rddl.002800
Zhao M. X., Yu K. F., Shi Q., Chen T. R., Zhang H. L., Chen T. G. (2013). Coral communities of the remote atoll reefs in the nansha islands, southern south China Sea. Environ. Monit. Assess. 185 (9), 7381–7392. doi: 10.1007/s10661-013-3107-5
Keywords: coral reef fish, population biology, relative fatness, large fish indicator, South China Sea
Citation: Zhang J, Cai Y, Li J, Zhang K, Gong Y, Chen S and Chen Z (2023) Changes in population biology of three coral reef fishes in the South China Sea between 1998–1999 and 2016–2019. Front. Conserv. Sci. 4:1129266. doi: 10.3389/fcosc.2023.1129266
Received: 21 December 2022; Accepted: 31 January 2023;
Published: 10 February 2023.
Edited by:
Lei Jiang, South China Sea Institute of Oceanology (CAS), ChinaReviewed by:
Simon Weigmann, Elasmobranch Research Laboratory, GermanyJianguo Du, State Oceanic Administration, China
Copyright © 2023 Zhang, Cai, Li, Zhang, Gong, Chen and Chen. This is an open-access article distributed under the terms of the Creative Commons Attribution License (CC BY). The use, distribution or reproduction in other forums is permitted, provided the original author(s) and the copyright owner(s) are credited and that the original publication in this journal is cited, in accordance with accepted academic practice. No use, distribution or reproduction is permitted which does not comply with these terms.
*Correspondence: Jun Zhang, zhangjun@scsfri.ac.cn; Zuozhi Chen, chenzuozhi@scsfri.ac.cn