Internal Climate Variability in the Present Climate and the Change in ENSO Amplitude in Future Climate Simulations
 Seung-Hwon Hyun
 Sang-Wook Yeh
 Ben P. Kirtman
 Soon-Il An1,4
- 1Irreversible Climate Change Research Center, Yonsei University, Seoul, South Korea
- 2Marine Sciences and Convergent Technology, Hanyang University, ERICA, Ansan, South Korea
- 3Rosenstiel School of Marine and Atmospheric Science, University of Miami, Miami, FL, United States
- 4Department of Atmospheric Sciences, Yonsei Univesity, Seoul, South Korea
In this study, we define a metric for the intensity of internal climate variability (ICV) based on global surface temperature in the present climate and suggest that it can be used to understand the diversity of projected changes in ENSO amplitude in the future. We analyze both the 35-member Community Earth System Model Large Ensemble and the 30-members from Geophysical Fluid Dynamical Laboratory Large Ensemble from the present climate to future climate. While ENSO amplitude tends to decrease from the present climate to the end of 21st century in some ensemble member with a strong ICV during the present climate, it increases or stays the same in other ensemble members with a weak ICV. The result indicates that the intensity of ICV in the present climate in climate models may cause the difference of ENSO amplitude changes in a warmer world. Therefore, the intensity of ICV in the present climate should be cautiously examined in climate models to correctly project the ENSO amplitude changes in a changing climate.
Introduction
Internal climate variability (ICV) refers to as the natural variability of the climate system that occurs in the absence of evolving external forcing and includes processes intrinsic to the atmosphere, ocean, land, and cryosphere and their interactions (Deser et al., 2012; Kay et al., 2015). To examine the role of ICV in climate system, surface temperature has been used in many previous studies (Smith et al., 2007; Thompson et al., 2015; Monerie et al., 2017; Dai and Bloecker, 2019; Hyun et al., 2020). For example, ICV could contribute to changes in surface temperature variability caused by climate change. Furthermore, in some cases, surface temperature variability associated with ICV exceeds externally forced surface temperature changes caused by solar irradiance, aerosols, volcanic activity, or greenhouse gases. In this sense, ICV has been argued as one of the major sources of uncertainty in estimating the changes in surface temperature and its variability in future climate (Hawkins and Sutton, 2009; Deser et al., 2012, 2014; Thompson et al., 2015; Hyun et al., 2017; Zheng et al., 2018). Therefore, understanding the ICV must be essential to understand changes in climate and its variability including El Niño and Southern Oscillation (ENSO), which is the most dominant sea surface temperature (SST) variability in the tropical Pacific on interannual timescales (McPhaden et al., 2006).
Indeed, there is significant interest regarding how ENSO properties including its amplitude, frequency and spatial pattern will change in a changing climate (Cai et al., 2021 and reference therein). While some studies suggested that the frequency of extreme ENSO events would increase in a warmer world (Cai et al., 2014, 2015a,b, 2018), others argued that ENSO amplitude would decrease (Kim et al., 2014; Callahan et al., 2021). ENSO amplitudes changes under global warming largely depend on the balance of the atmospheric and oceanic feedbacks in climate models, which cause a large inter-model diversity in future climate projections (Collins et al., 2010; DiNezio et al., 2012; Stevenson, 2012; Watanabe et al., 2012; Beobide-Arsuaga et al., 2021). There is still no consensus for why simulated changes in ENSO variability in a warming climate are so diverse in climate models (Guilyardi et al., 2009; Collins et al., 2010; Bellenger et al., 2014; Capotondi et al., 2015; Brown et al., 2020; Fredriksen et al., 2020).
We hypothesize that the current climate models differ in their simulation of the intensity of ICV in the present climate. Consequently, it may lead to different ENSO amplitude changes in response to anthropogenic forcing. Cai et al. (2020) found a negative relationship between past and future ENSO amplitude change. However, while ENSO itself is an important part of ICV, there are myriad of other contributing factors. Thus, it is not immediately clear whether such relationship holds for ICV and ENSO amplitude change in general. Recently, Yeh et al. (2021) quantified ICV of surface temperature in large ensemble simulations based on the spread of simulated global mean surface temperature from their ensemble mean. Following this methodology, we defined a metric for the intensity of ICV based on global surface temperature in the present climate using the 35-member Community Earth System Model Large Ensemble (CESM-LENS) and the 30-members Geophysical Fluid Dynamics Laboratory Large Ensemble (GFDL-LENS). Then we suggest that the intensity of ICV in the present climate can be used to understand the diversity of projected changes in ENSO amplitude in the future in coupled climate models.
Methods
CESM-LENS and GFDL-LENS Simulations
CESM consists of atmosphere (Community Atmosphere Model version 5, CAM5), ocean (Parallel Ocean Program version 2, POP, 60 vertical levels), land (Community Land Model version 4, CLM4), and sea ice (Los Alamos sea ice model version 4, CICE) model components with 1.25 (longitude) by 0.75 (latitude) grid.
In this study, we analyze the CESM-LENS simulations from the historical (1960–2005) and the Representative Concentration Pathway (RCP8.5) (2006–2100) periods, which were specifically designed to better understand and quantify ICV in the presence of increasing greenhouse gases (Kay et al., 2015). Note that while the simulation period of CESM-LENS is 1920–2100, the analyzed period is limited to 1960–2100 to directly compare with the GFDL-LENS simulations. The CESM-LENS has 35 ensemble members that have the same external forcing and model simulation, but small round-off level differences in their initial conditions, i.e., 1 day lagged differences of ocean temperature from member 1 in member 2, and 10−14 K atmospheric temperature differences from member 1 and member 3–35. The other initial conditions within member 3–35 are the same. Note that initial condition in ensemble member 1 is from a randomly selected date (January 1) in CESM pre-industrial run of 1,100 years of simulation. While there are 40-ensemble members in CESM-LENS simulations, we only use 1–35 ensemble members since we found some inconsistency of global surface temperature simulated in the ensemble members of 36–40 in the RCP8.5 (2006–2100) compared to that of ensemble member 1–35 members (not shown here).
We also analyze GFDL-LENS which consists of atmosphere (The Atmospheric Model version 2, AM2), ocean (Modular Ocean Model version 4p1, MOM4p1) including sea ice model components, and land (Land Model version 3.0, LM3.0) component (Dunne et al., 2012, 2013). Similar to the CESM-LENS simulations, we used the surface air temperature data obtained from the historical (1960–2005) and the RCP8.5 (2006–2100) in the 30-ensemble members GFDL-LENS simulations. While the GFDL-LENS simulations run from 1950, the first 10-year period of simulation result is excluded to obtain stabilized outputs. The initial conditions for the 30 ensemble members,1 January 1950, differed in the initial state of the atmospheric component. This was accomplished by using model state snapshot for the ends of days 1–29 in January 1950 as the initial model states for 1 January 1950 for each of the ensemble members 2–30 (Rodgers et al., 2015). All simulated fields from the GFLD-LENS and CESM-LENS were interpolated onto a 2.5 (longitude) by 2.0 (latitude) grid.
Internal Climate Variability
Since each CESM-LENS and GFDL-LENS ensemble member has a unique climate trajectory due to small differences in their initial conditions, the deviation of each member from their ensemble mean is only due to ICV. Unless otherwise stated, all results are based on the boreal winter (December–January–February) when ENSO amplitudes tend to maximize (Trenberth, 1997; Deser et al., 2010). Note that both CESM-LENS and GFDL-LENS simulate the maximum ENSO amplitude in boreal winter (figure not shown). Following Yeh et al. (2021), the ICV of global surface temperature in each member is defined as the square root of global (60°N−60°S, 0–360°E) surface temperature including both land and ocean following the equation:
where xi, j represents the surface temperature simulated for each member at grid point, i, j, during boreal winter, and is the respective ensemble mean surface temperature at grid point i, j for the 35- and 30-members during boreal winter in the CESM-LENS and GFDL-LENS, respectively. M, N denote the number of total grid point corresponding at 0–360°E and 60°S−60°N, respectively. The reason of why we focused on 60°S−60°N instead of 90°S−90°N is that the global ICV is largely determined in the surface temperature variability in low latitude regions (Yeh et al., 2021) and to exclude large model biases of unknown physics and parameters on polar regions (Hyun et al., 2017). Note that the main results are similar if the region expanded to 90°S−90°N. Hereafter, this metric will be identified by the acronym ICV, which stands for ICV of global surface temperature. A large value of ICV indicates strong ICV of global surface temperature and vice versa.
Result
ENSO Amplitude Changes
We analyzed total 65-ensemble members including CESM-LENS and GFDL-LENS simulations to examine the relationship between ICV in the present climate and ENSO diversity in the future climate (i.e., RCP8.5). It should be noted that the respective ensemble mean value from CESM-LENS and GFDL-LENS members are subtracted from each member to calculate the ICV intensity in Equation (1), therefore, the SST anomaly deviation in each member could be largely due to ICV.
To show the time-varying ENSO amplitude from the present to future climate, we display the 50-years running standard deviation of the NINO3.4 (170°W−120°W, 5°N−5°S) SST index simulated in each member for 1960–2100 (141 years), and the observational estimate (Figure 1). The observational SST data is obtained from the Hadley Centre Sea Ice and Sea Surface Temperature (HadISST) datasets (Rayner et al., 2003) and Extended Reconstructed Sea Surface Temperature version 5 (ERSST v5) datasets (Huang et al., 2017) for 1960–2021. Note that the NINO 3.4 SST index for each 50-year running period is unfiltered, however, the linear trend for each 50-year period is removed in both simulations and observation. While several studies have shown that 50-years running period is not enough to robustly distinguish ENSO amplitude changes (Wittenberg, 2009; Stevenson et al., 2010; Li et al., 2011), it is sufficient to capture the variations in ENSO amplitude on decadal timescales (Kim et al., 2014).
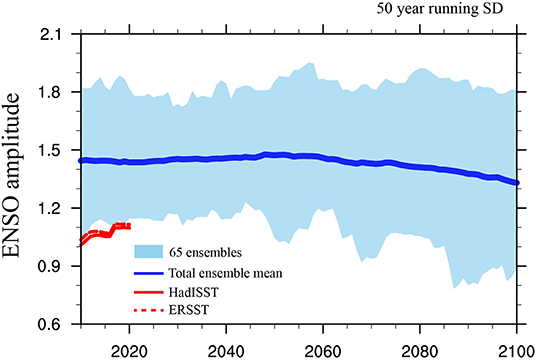
Figure 1. ENSO amplitude in the 65-ensemble members from CESM-LENS and GFDL-LENS and observation (red). The 50-year running standard deviation of the Nino 3.4 SST index from each ensemble without a linear trend is calculated in each 50-year running window for the 65 simulation period of 1960–2100. Solid (dashed) red line indicates the HadISST (ERSST) observation for 1960–2021 and thick blue denotes the ensemble mean ENSO amplitude. Note that the last year of each 50-years running period is plotted on the x-axis. For example, the ENSO amplitude at 2020 indicates the ENSO amplitude for 1971–2020. Unit is °C.
The ENSO amplitude in observational estimate shows a gradual increase during 1960–2021, in particular, since the mid-1970s, which is mostly due to the occurrence of extreme El Niño events after the late of 20th century (Santoso et al., 2013; Wang et al., 2019). The observed ENSO amplitude is not within the range of the 65-ensemble member, indicating that two LENS simulations tend to simulate larger ENSO amplitude than the observation. This is consistent with the former study which showed that current climate models tend to simulate larger ENSO amplitude than the observation (Kim et al., 2014).
In spite of a large ENSO amplitude in both LENS simulations compared with the observation, it is found that ENSO amplitude in each ensemble member increases or decreases or stays the same from the present climate (1960–2010) to the end of 21st century (2050–2100) in 65-ensemble members (Table 1). Note that ensemble member in which the changes in ENSO amplitude in the end of 21st century is within ±10% from the present climate is considered to stay the same. ENSO amplitude decreases (increases) in the end of 21st century in 45% (23%) out of 65-ensemble members and it stays the same in 32% out of 65-ensemble members. Consequently, the 65-ensemble mean ENSO amplitude shows neither significant decrease nor increase from the present climate to the end of 21st century (Figure 1). This is generally consistent with previous studies using Coupled Model Intercomparison Project (CMIP) class climate models (Guilyardi et al., 2009; Collins et al., 2010; Christensen et al., 2013; Bellenger et al., 2014; Zheng et al., 2016), which have shown large spread in simulated future changes in ENSO amplitude across climate models.
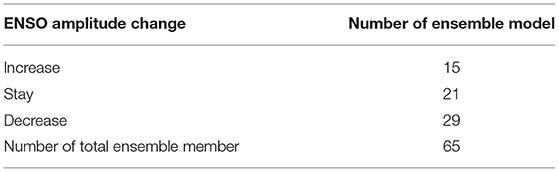
Table 1. The number of ensemble members in which ENSO amplitude increases, decrease or stays the same from the present (1960–2010) to the end of 21st century (2050–2100) in 65-ensemble members. Note that ensemble member in which the changes in ENSO amplitude in the end of 21st century are within ±10% from the present climate is considered to stay the same.
This result raises an important question as to what causes the diversity of simulated ENSO amplitude changes in a warmer world. We remind the reader that all 35 ensemble members of the CESM-LENS simulations and 30 ensembles of GFDL-LENS use the same evolving external forcing (i.e., RCP8.5), differing in small differences in atmospheric initial conditions in each ensemble simulation set. Therefore, the respective diversity in each ensemble simulation set of both LENS simulations (Figure 1) does not result from differences in external forcing. We infer that ICV itself, which differs across ensemble members in the present climate, might be associated with future changes in ENSO amplitude.
ENSO Amplitude Change and Internal Climate Variability in the Present Climate
Figure 2 displays the ICV simulated in each ensemble simulation from the strongest to the weakest, indicating that there exists a large diversity of ICV in the present climate in climate model. The maximum ICV is 0.69°C and the minimum ICV is 0.53°C. The mean ICV from 65-ensemble members is 0.62°C and one standard deviation is ±0.04°C. To examine the ICV associated with ENSO amplitude changes in a warmer world, we select two groups from 65-ensemble members of LENS simulations in which ICV is the strongest and the weakest, respectively, in the present climate (1960–2010) based on the results in Figure 2. One group contains the top 10 members with the strongest ICV magnitudes in the present climate, hereafter, Strong_ICV (ensemble member 1–10 in Figure 2). The other group contains the 10 weakest members based on ICV intensity in the present climate, hereafter, Weak_ICV (ensemble member 56–65 in Figure 2). The mean ICV in Strong_ICV and Weak_ICV is 0.67°C and 0.57°C, respectively.

Figure 2. The ICV simulated in 65-ensemble members including both CESM-LENS and GFDL-LENS simulations during the present climate (1960–2010). Each blue bar represents the ICV simulated by each ensemble member during the present climate, ranked by the intensity of ICV from the strongest to the weakest among 65-ensemble member (1–65). Unit is °C.
In Figure 3A, we display the time-varying ENSO amplitude simulated in the Strong_ICV and Weak_ICV groups, respectively. It is found that the ENSO amplitude simulated in the Strong_ICV is significantly larger than that in the Weak_ICV in the present climate (Figures 3A,B). Furthermore, we display the scatter plot showing the relationship between ENSO amplitude and ICV in the present climate in 65-ensemble members (Figure 3C). A correlation coefficient between ENSO amplitude and ICV in the present climate is 0.81, which is statistically significant at the 95% confidence level. The stronger the intensity of ICV is in the present climate, the larger the ENSO amplitude is in the same period. This might be due to the fact that ENSO variability largely contributes to the variability of global surface temperature in the present climate (Thompson et al., 2009). Yeh et al. (2021) also argued that surface temperature variability at low latitudes (30°S−30°N) could be considered as a key source for determining the intensity of ICV in climate models.
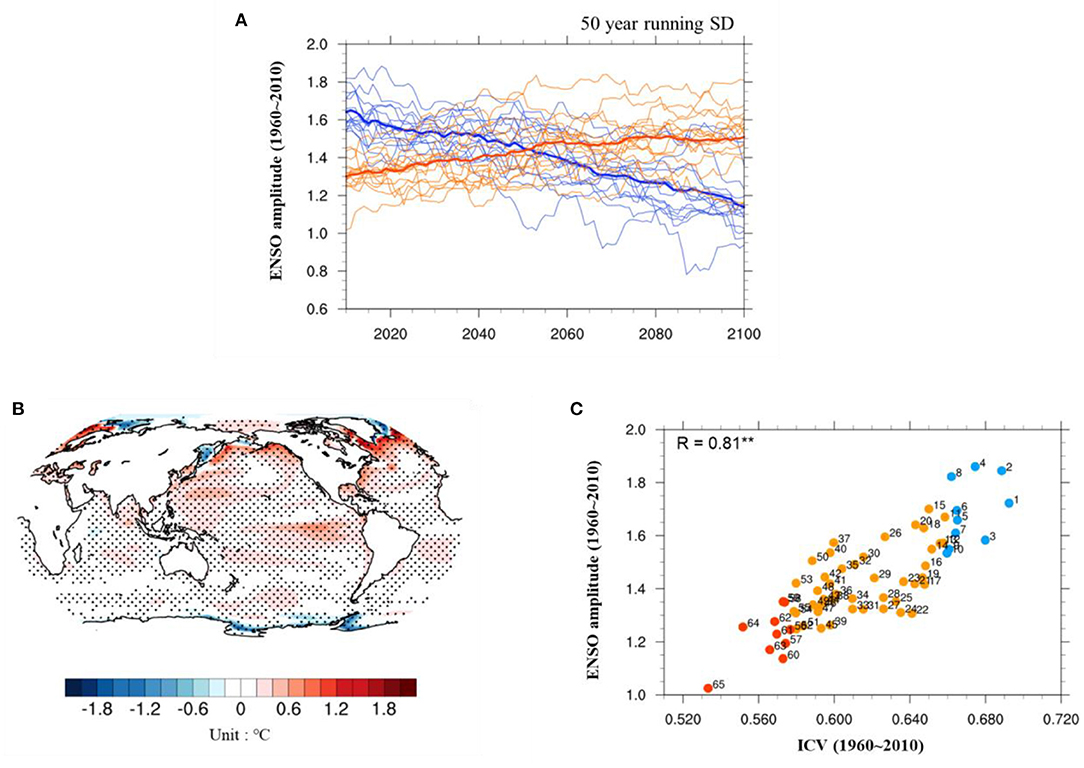
Figure 3. (A) Time-varying ENSO amplitude simulated in 10-ensemble members from the Strong_ICV (blue) and Weak_ ICV (red) as well as their ensemble means (thick lines). (B) The difference of surface temperature standard deviation between Strong_ICV and Weak_ICV during the present climate (Strong_ICV minus Weak_ICV). The dotted area indicates the region where the difference is statistically significant at the 95% confidence. (C) Scatter plot of ICV vs. ENSO amplitude in the present climate (1960–2010). Blue (red) dots in (C) denotes Strong_ICV (Weak_ICV) group. Unit is °C. Note that numbers in (C) denote the 65-ensemble members ranked by the intensity of ICV from the strongest to the weakest during the present climate (see Figure 2).
It is found that the ENSO amplitude simulated in the Strong_ICV group either decreases (90%) or stay (10%) the same in the future out of 10-ensemble members. In contrast, the ENSO amplitude simulated in the Weak_ICV group increases (70%) or stay (20%) and decrease (10%) during the end of the 21st century out of 10-ensemble members. These results are confirmed by spatial maps of the linear trends in SST standard deviation from 1960 to 2100 in the Strong_ICV and Weak_ICV groups, respectively (Figures 4A,B). The linear increase in SST standard deviation simulated in the Weak_ICV is significant in the central-to-eastern tropical Pacific (Figure 4B), whereas the linear decrease in SST standard deviation simulated in the Strong_ICV is evident throughout the tropical Pacific (Figure 4A).
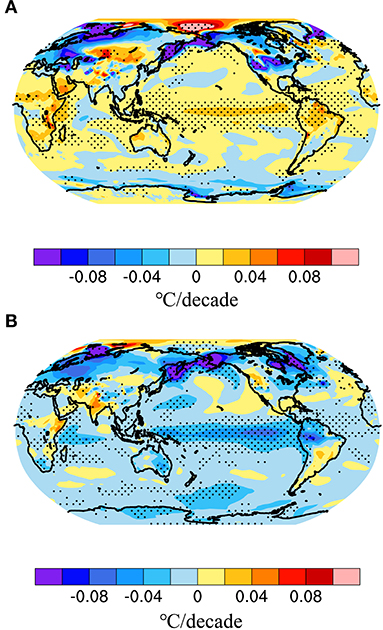
Figure 4. The linear trend (°C/decade) of the surface temperature standard deviation during 1960–2100 in (A) the Strong_ICV and (B) Weak_ICV group, respectively. Note that the dotted indicates the region where the trend is statistically significant at the 95% confidence level compared to the ensemble mean trend.
To further support this notion, we display a scatter plot showing the relationship between the intensity of ICV in the present climate and ENSO amplitude changes from the present climate (1960–2010) to future climate (2050–2100) (i.e., future climate minus the present climate) across 65-ensemble members (Figure 5A). The intensity of ICV simulated in the present climate is significantly negatively correlated with the changes in ENSO amplitude from the present to future climate (r = −0.84, where r is the correlation coefficient; significant at the 95% confidence level). It is noteworthy that the respective variables corresponding to the present climate (i.e., the intensity of ICV) and the future climate (i.e., ENSO amplitude) have a very high correlation with each other (Figure 5B) (r = −0.67 is statistically significant at the 95% confidence level). Therefore, the correlation coefficient shown in Figure 5A does not simply stem from a statistical artifact associated with correlating a variable with its own change.

Figure 5. ICV in the present climate vs. ENSO amplitude change from the present climate (1960–2010) to the future climate (2050–2100) (A). (B) is the same as in (A) except the ENSO amplitude in the future climate. Note that numbers in figure denote the 65-ensemble members ranked by the intensity of ICV from the strongest to the weakest during the present climate (see Figure 2) and black circles in (A) indicates the ensemble member in which the ENSO amplitude changes stays the same from the present climate to the future climate. Unit is °C.
In a weak ICV in the present climate, ENSO amplitude tends to increase or stay the same in future climate. In contrast, ENSO amplitude tends to decrease or stay the same in future climate when the ICV is strong in the present climate. It is also noteworthy that similar phenomena are found in two LENS simulations, respectively (Figure 6). The intensity of ICV simulated in the present climate is significantly negatively correlated with the changes in ENSO amplitude from the present to future climate in CESM-LENS (r = −0.57) and GFDL_LENS (r = −0.60) simulations, respectively. Both correlation coefficients are statistically significant at the 95% confidence level. These results suggest that the changes in ENSO amplitude due to external forcing (i.e., RCP8.5) in climate models may be dependent on whether the ICV in the present climate is strong or weak.

Figure 6. ICV in the present climate vs. ENSO amplitude change from the present climate (1960–2010) to the future climate (2050–2100) in CESM-LENS (A) and GFDL-LENS (B) simulations. Unit is °C.
Summary and Discussion
Using two sets of CESM-LENS and GFDL-LENS simulations, we tested a hypothesis that the current climate models differ in their simulation of the intensity of ICV in the present climate. We suggested that the ICV in the present climate can be used to understand the diversity of projected changes in ENSO amplitude in the future. This hypothesis might be true at least in two sets of the CESM-LENS and GFDL-LENS simulations. While ENSO amplitude tends to increase or stay the same in future climate with a weak ICV in the present climate, it tends to decrease or stay the same in future climate with a strong ICV in the present climate.
We understand that simulations that have weak ICV as well as weak ENSO amplitude in the present climate at least leave room for ENSO amplitude to increase in a warmer climate. Therefore, the ENSO amplitude may either increase or stay the same in a warmer climate. In contrast, climate models which have strong ICV as well as strong ENSO amplitude in the present climate have little room for ENSO amplitude to increase in a warmer climate. Therefore, the ENSO amplitude may either decrease or stay the same in a warmer climate. Furthermore, we do not exclude the notion that our result could depend on the length of selected time period. When the ENSO amplitude in Weak_ICV increase to a relative high state in the end of 21st century, there is no more room for continuing increase in these members., implying a decrease trend in further simulation as the situation in Strong_ICV.
Conclusively, we infer that the ICV condition in the present climate may affect the response of ENSO amplitude to RCP8.5 forcing, resulting in the diversity of ENSO amplitude changes from the present climate to future climate in climate models. Recently, Cai et al. (2020) also argued that the changes in ENSO amplitude under global warming differ across climate models, which is partially attributed to ICV. They showed that a greater cumulative oceanic heat loss from ENSO thermal damping with higher initial ENSO variability in the present climate (i.e., a strong ICV in the present climate) reduces stratification of the upper equatorial Pacific Ocean, leading to a smaller increase in ENSO variability than those with low initial ENSO variability in the present climate (i.e., a weak ICV in the present climate) under subsequent greenhouse warming. This notion is consistent to some extent with the results in the current study. Indeed, there is a negative correlation coefficient between the ENSO amplitude in the present climate and ENSO amplitude changes from the present climate to future climate in 65-ensemble members (r = −0.74 is statistically significant at the 95% confidence level) (Figure 7A). Similar relationship is also found in CESM-LENS and GFDL-LENS, respectively (Figures 7B,C). On the other hand, several studies have demonstrated that extratropical forcing including North Pacific Oscillation, Arctic Oscillation, Aleutian Low, and Arctic sea ice anomalies play a role in modulating the amplitude, spatial structure and period of ENSO (Vimont et al., 2001; Chen et al., 2014, 2020a,b; Chen and Yu, 2020). Indeed, there are significant differences in the surface temperature variability in the extratropics between Strong_ICV and Weak_ICV (Figure 3B), implying that the extratropical forcing in the present climate also influences the future change of ENSO amplitude. If the extratropical forcing is strong (weak) in the present climate, ENSO amplitude tends to decrease (increase) or stay in future climate.
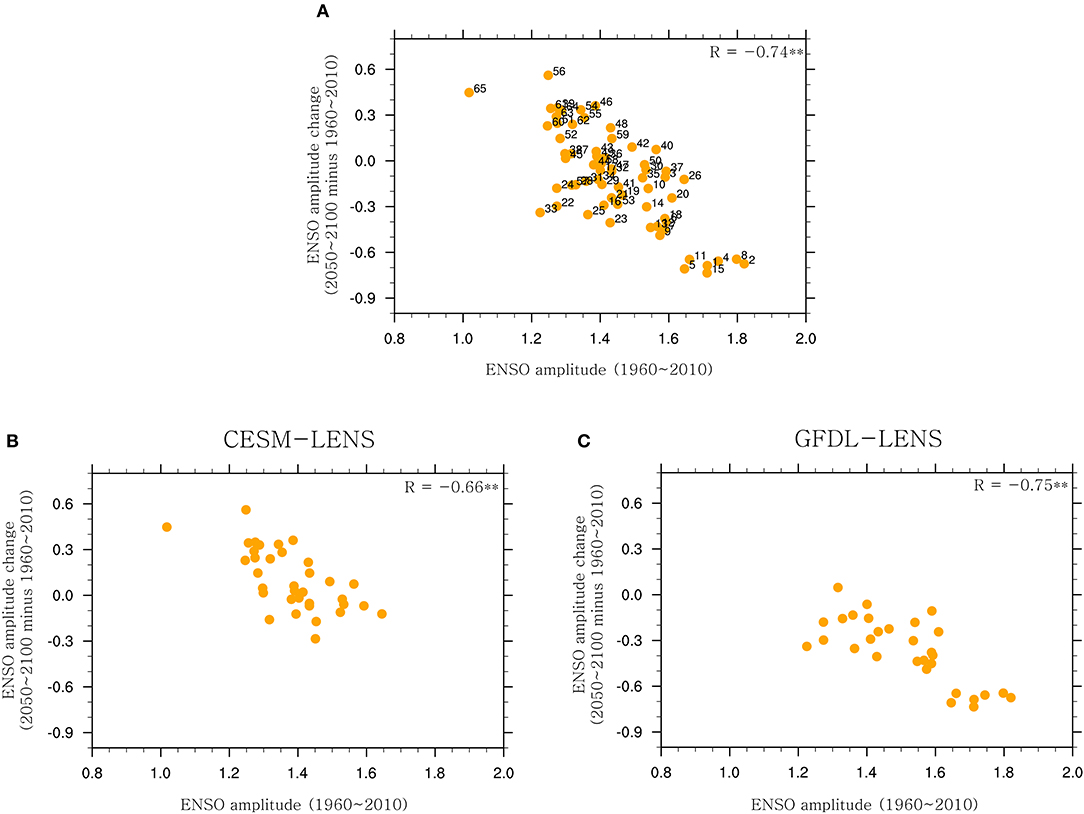
Figure 7. ENSO amplitude in the present climate vs. ENSO amplitude change from the present climate (1960–2010) to the future climate (2050–2100) in 65-ensemble members. Note that numbers in (A) denote the 65-ensemble members ranked by the intensity of ICV from the strongest to the weakest during the present climate (see Figure 2). Unit is °C. (B,C) are the same as in (A) except the CESM-LENS and GFDL-LENS, respectively. The values inside (A–C) denote the correlation coefficients between two corresponding variables.
In this study, we did not examine the details of physical processes of why the changes in ENSO amplitude due to external forcing depend on whether the ICV simulated in climate models is strong or weak in the present climate. In spite of that, our result implies that it is crucial to improve our current ability to correctly simulate the intensity of ICV in the present climate, which may significantly reduce the uncertainty in projections of ENSO amplitude in the future. Furthermore, it might be useful to conduct a large ensemble experiment using other climate models in addition to CESM and GFDL climate models to examine the relationship of ICV in the present climate and ENSO amplitude change in the future.
Data Availability Statement
The original contributions presented in the study are included in the article/supplementary material, further inquiries can be directed to the corresponding author/s.
Author Contributions
S-HH and S-WY: conceptualization. S-HH: methodology, data curation, and writing—original draft preparation. All authors including BPK and S-IA have discussed the results and contributed to writing the manuscript.
Funding
This work was supported by the National Research Foundation of Korea (NRF) grant (NRF-2018R1A5A1024958). S-WY was also supported by Korea Environment Industry and Technology Institute (KEITI) through-Climate Change R&D Project for New Climate Regime funded by Korea Ministry of Environment (MOE) (2022003560001).
Conflict of Interest
The authors declare that the research was conducted in the absence of any commercial or financial relationships that could be construed as a potential conflict of interest.
The handling editor AS declared a past co-authorship with the author S-WY.
Publisher's Note
All claims expressed in this article are solely those of the authors and do not necessarily represent those of their affiliated organizations, or those of the publisher, the editors and the reviewers. Any product that may be evaluated in this article, or claim that may be made by its manufacturer, is not guaranteed or endorsed by the publisher.
References
Bellenger, H., Guilyardi, É., Leloup, J., Lengaigne, M., and Vialard, J. (2014). ENSO representation in climate models: from CMIP3 to CMIP5. Clim. Dyn. 42, 1999–2018. doi: 10.1007/s00382-013-1783-z
Beobide-Arsuaga, G., Bayr, T., Reintges, A., and Latif, M. (2021). Uncertainty of ENSO-amplitude projections in CMIP5 and CMIP6 models. Clim. Dyn. 56, 3875–3888. doi: 10.1007/s00382-021-05673-4
Brown, J. R., Brierley, C. M., An, S. I., Guarino, M. V., Stevenson, S., Williams, C. J., et al. (2020). Comparison of past and future simulations of ENSO in CMIP5/PMIP3 and CMIP6/PMIP4 models. Clim. Past 16, 1777–1805. doi: 10.5194/cp-16-1777-2020
Cai, W., Borlace, S., Lengaigne, M., Van Rensch, P., Collins, M., Vecchi, G., et al. (2014). Increasing frequency of extreme El Niño events due to greenhouse warming. Nat. Clim. Change. 4, 111–116. doi: 10.1038/nclimate2100
Cai, W., Ng, B., Geng, T., Wu, L., Santoso, A., and McPhaden, M. J. (2020). Butterfly effect and a self-modulating El Niño response to global warming. Nature 585, 68–73. doi: 10.1038/s41586-020-2641-x
Cai, W., Santoso, A., Collins, M., Dewitte, B., Karamperidou, C., Kug, J. S., et al. (2021). Changing El Niño–Southern Oscillation in a warming climate. Nat. Rev. Earth Environ. 2, 628–644. doi: 10.1038/s43017-021-00199-z
Cai, W., Santoso, A., Wang, G., Yeh, S. W., An, S. I., Cobb, K. M., et al. (2015b). ENSO and greenhouse warming. Nat. Clim. Change 549. doi: 10.1038/NCLIMATE2743
Cai, W., Wang, G., Dewitte, B., Wu, L., Santoso, A., Takahashi, K., et al. (2018). Increased variability of eastern Pacific El Niño under greenhouse warming. Nature, 564, 201–206. doi: 10.1038/s41586-018-0776-9
Cai, W., Wang, G., Santoso, A., McPhaden, M. J., Wu, L., Jin, F. F., et al. (2015a). Increased frequency of extreme La Niña events under greenhouse warming. Nat. Clim. Change 5, 132–137. doi: 10.1038/nclimate2492
Callahan, C. W., Chen, C., Rugenstein, M., Bloch-Johnson, J., Yang, S., and Moyer, E. J. (2021). Robust decrease in El Niño/Southern Oscillation amplitude under long-term warming. Nat. Clim. Change 11, 752–757. doi: 10.1038/s41558-021-01099-2
Capotondi, A., Wittenberg, A. T., Newman, M., Di Lorenzo, E., Yu, J. Y., Braconnot, P., et al. (2015). Understanding ENSO Diversity. Bull. Amer. Meteoro. Soc. 921–938. doi: 10.1175/BAMS-D-13-00117.1
Chen, S., Chen, W., Wu, R., Yu, B., and Graf, H. F. (2020a). Potential impact of preceding Aleutian Low variation on El Niño–Southern Oscillation during the following winter. J. Clim. 33, 3061–3077. doi: 10.1175/JCLI-D-19-0717.1
Chen, S., Wu, R., Chen, W., and Yu, B. (2020b). Influence of winter Arctic sea ice concentration change on the El Niño–Southern Oscillation in the following winter. Clim. Dyn. 54, 741–757. doi: 10.1007/s00382-019-05027-1
Chen, S., and Yu, B. (2020). Projection of winter NPO-following winter ENSO connection in a warming climate: uncertainty due to internal climate variability. Clim. Change 162, 723–740. doi: 10.1007/s10584-020-02778-3
Chen, S., Yu, B., and Chen, W. (2014). An analysis on the physical process of the influence of AO on ENSO. Clim. Dyn. 42, 973–989. doi: 10.1007/s00382-012-1654-z
Christensen, J. H., Kanikicharla, K. K., Aldrian, E., An, S. I., Cavalcanti, I. F. A., de Castro, M., et al. (2013). “Climate phenomena and their relevance for future regional climate change,” in The Physical Science Basis. Contribution of Working Group I to the Fifth Assessment Report of the Intergovernmental Panel on Climate Change (Cambridge University Press), 1217–1308.
Collins, M., An, S. I., Cai, W., Ganachaud, A., Guilyardi, E., Jin, F. F., et al. (2010). The impact of global warming on the tropical Pacific Ocean and El Niño. Nat. Geoscience. 3, 391–397. doi: 10.1038/ngeo868
Dai, A., and Bloecker, C. E. (2019). Impacts of internal variability on temperature and precipitation trends in large ensemble simulations by two climate models. Clim. Dyn. 52, 289–306. doi: 10.1007/s00382-018-4132-4
Deser, C., Alexander, M. A., Xie, S. P., and Phillips, A. S. (2010). Sea surface temperature variability: patterns and mechanisms. Annu. Rev. Marine Sci. 2, 115–143. doi: 10.1146/annurev-marine-120408-151453
Deser, C., Phillips, A., Bourdette, V, and Teng, H. (2012). Uncertainty in climate change projections: the role of ICV. Clim. Dyn. 38, 527–546. doi: 10.1007/s00382-010-0977-x
Deser, C., Phillips, A. S., Alexander, M. A., and Smoliak, B. V. (2014). Projecting North American climate over the next 50 years: uncertainty due to ICV. J. Climate 27, 2271–2296. doi: 10.1175/JCLI-D-13-00451.1
DiNezio, P. N., Kirtman, B. P., Clement, A. C., Lee, S. K., Vecchi, G. A., and Wittenberg, A. (2012). Mean climate controls on the simulated response of ENSO to increasing greenhouse gases. J. Climate 21, 7399–7420. doi: 10.1175/JCLI-D-11-00494.1
Dunne, J. P., John, J. G., Adcroft, A. J., Griffies, S. M., Hallberg, R. W., Shevliakova, E., et al. (2012). GFDL's ESM2 global coupled climate–carbon earth system models. Part I: Physical formulation and baseline simulation characteristics. J. Clim. 25, 6646–6665. doi: 10.1175/JCLI-D-11-00560.1
Dunne, J. P., John, J. G., Shevliakova, E., Stouffer, R. J., Krasting, J. P., Malyshev, S. L., et al. (2013). GFDL's ESM2 global coupled climate–carbon earth system models. Part II: carbon system formulation and baseline simulation characteristics. J. Clim. 26, 2247–2267. doi: 10.1175/JCLI-D-12-00150.1
Fredriksen, H. B., Berner, J., Subramanian, A. C., and Capotondi, A. (2020). How does El Niño–Southern Oscillation change under global warming—a first look at CMIP6. Geophys. Res. Lett. 47, e2020GL090640. doi: 10.1029/2020GL090640
Guilyardi, E., Wittenberg, A., Fedorov, A., Collins, M., Wang, C., Capotondi, A., et al. (2009). Understanding El Niño in ocean–atmosphere general circulation models: Progress and challenges. Bull. Am. Meteorol. Soc. 90, 325–340. doi: 10.1175/2008BAMS2387.1
Hawkins, E., and Sutton, R. (2009). The potential to narrow uncertainty in regional climate predictions. Bull. Am. Meteorol. Soc. 90, 1095–1107. doi: 10.1175/2009BAMS2607.1
Huang, B., Thorne, P. W., Banzon, V. F., Boyer, T., Chepurin, G., Lawrimore, J. H., et al. (2017). Extended reconstructed sea surface temperature, version 5 (ERSSTv5): upgrades, validations, and intercomparisons. J. Clim. 30, 8179–8205. doi: 10.1175/JCLI-D-16-0836.1
Hyun, S. H., Yeh, S.-W., Song, S.-Y., Park, H.-S., and Kirtman, B. P. (2020). Understanding inter-model diversity when simulating the time of emergence in CMIP5 climate models. Geophys. Res. Lett. 47, e2020GL087923. doi: 10.1029/2020GL087923
Hyun, S. H., Yeh, S.-W., and Yoon, J. (2017). Reduction of internal climate variability in surface temperature due to sea-ice loss since the mid-21st century. Int. J. Climatol. 37, 5211–5216. doi: 10.1002/joc.5146
Kay, J. E., Deser, C., Phillips, A., Mai, A., Hannay, C., Strand, G., et al. (2015). The Community Earth System Model (CESM) large ensemble project: a community resource for studying climate change in the presence of internal climate variability. Bull. Am. Meteorol. Soc. 96, 1333–1349. doi: 10.1175/BAMS-D-13-00255.1
Kim, S. T., Cai, W., Jin, F. F., Santoso, A., Wu, L., Guilyardi, E., et al. (2014). Response of El Niño sea surface temperature variability to greenhouse warming. Nat. Clim. Change 4, 786–790. doi: 10.1038/nclimate2326
Li, J., Xie, S. P., Cook, E. R., Huang, G., D'arrigo, R., Liu, F., et al. (2011). Interdecadal modulation of El Niño amplitude during the past millennium. Nat. Clim. Change 1, 114. doi: 10.1038/nclimate1086
McPhaden, M. J., Zebiak, S. E., and Glantz, M. H. (2006). ENSO as an integrating concept in earth science. Science 314, 1740–1745. doi: 10.1126/science.1132588
Monerie, P. A., Moine, M. P., Terray, L., and Valcke, S. (2017). Quantifying the impact of early 21st century volcanic eruptions on global-mean surface temperature. Environ. Res. Lett. 12, 054010. doi: 10.1088/1748-9326/aa6cb5
Rayner, N. A., Parker, D. E., Horton, E. B., Folland, C. K., Alexander, L. V., Rowell, D. P., et al. (2003). Global analyses of sea surface temperature, sea ice, and night marine air temperature since the late nineteenth century. J. Geophy. Res.: Atmospheres. 108. doi: 10.1029/2002JD002670
Rodgers, K. B., Lin, J., and Frölicher, T. L. (2015). Emergence of multiple ocean ecosystem drivers in a large ensemble suite with an Earth system model. Biogeosciences 12, 3301. doi: 10.5194/bg-12-3301-2015
Santoso, A., McGregor, S., Jin, F. F., Cai, W., England, M. H., An, S. I., et al. (2013). Late-twentieth-century emergence of the El Niño propagation asymmetry and future projections. Nature 504, 126–130. doi: 10.1038/nature12683
Smith, D. M., Cusack, S., Colman, A. W., Folland, C. K., Harris, G. R., and Murphy, J. M. (2007). Improved surface temperature prediction for the coming decade from a global climate model. Science 317, 796–799. doi: 10.1126/science.1139540
Stevenson, S., Fox-Kemper, B., Jochum, M., Rajagopalan, B., and Yeager, S. G. (2010). ENSO model validation using wavelet probability analysis. J. Clim. 23, 5540–5547. doi: 10.1175/2010JCLI3609.1
Stevenson, S. L. (2012). Significant changes to ENSO strength and impacts in the twenty-first century: results from CMIP5. Geophys. Res. Lett. 17703, 39. doi: 10.1029/2012GL052759
Thompson, D. W., Barnes, E. A., Deser, C., Foust, W. E., and Phillips, A. S. (2015). Quantifying the role of internal climate variability in future climate trends. J. Clim. 28, 6443–6456. doi: 10.1175/JCLI-D-14-00830.1
Thompson, D. W., Wallace, J. M., Jones, P. D., and Kennedy, J. J. (2009). Identifying signatures of natural climate variability in time series of global-mean surface temperature: methodology and insights. J. Clim. 22, 6120–6141. doi: 10.1175/2009JCLI3089.1
Trenberth, K. E. (1997). The definition of El nino. Bull. Am. Meteorol. Soc. 78, 2771–2777. doi: 10.1175/1520-0477(1997)078andlt;2771:TDOENOandgt;2.0.CO;2
Vimont, D. J., Battisti, D. S., and Hirst, A. C. (2001). Footprinting: A seasonal connection between the tropics and mid-latitudes. Geophys. Res. Lett. 28, 3923–3926. doi: 10.1029/2001GL013435
Wang, B., Luo, X., Yang, Y. M., Sun, W., Cane, M. A., Cai, W., et al. (2019). Historical change of El Niño properties sheds light on future changes of extreme El Niño. Proc. Natl. Acad. Sci. 116, 22512–22517. doi: 10.1073/pnas.1911130116
Watanabe, M., Kug, J. S., Jin, F. F., Collins, M., Ohba, M., and Wittenberg, A. T. (2012). Uncertainty in the ENSO amplitude change from the past to the future. Geophys. Res. Lett. 39. doi: 10.1029/2012GL053305
Wittenberg, A. T. (2009). Are historical records sufficient to constrain ENSO simulations?. Geophys. Res. Lett. 36. doi: 10.1029/2009GL038710
Yeh, S.-W., Hyun, S. H., Park, I. H., and Zheng, X. T. (2021). Surface temperature variability in climate models with large and small internal climate variability. Q. J. R. Meteorol. Soc. 147, 3004–3016. doi: 10.1002/qj.4112
Zheng, X. T., Hui, C., and Yeh, S.-W. (2018). Response of ENSO amplitude to global warming in CESM large ensemble: uncertainty due to internal variability. Clim. Dyn. 50, 4019–4035. doi: 10.1007/s00382-017-3859-7
Keywords: internal climate variability, diversity, ENSO (El Niño/Southern Oscillation), large ensemble, future climate
Citation: Hyun S-H, Yeh S-W, Kirtman BP and An S-I (2022) Internal Climate Variability in the Present Climate and the Change in ENSO Amplitude in Future Climate Simulations. Front. Clim. 4:932978. doi: 10.3389/fclim.2022.932978
Received: 30 April 2022; Accepted: 06 June 2022;
Published: 12 July 2022.
Edited by:
Agus Santoso, University of New South Wales, AustraliaReviewed by:
Shangfeng Chen, Institute of Atmospheric Physics (CAS), ChinaPing Huang, Institute of Atmospheric Physics (CAS), China
Fan Jia, Institute of Oceanology (CAS), China
Copyright © 2022 Hyun, Yeh, Kirtman and An. This is an open-access article distributed under the terms of the Creative Commons Attribution License (CC BY). The use, distribution or reproduction in other forums is permitted, provided the original author(s) and the copyright owner(s) are credited and that the original publication in this journal is cited, in accordance with accepted academic practice. No use, distribution or reproduction is permitted which does not comply with these terms.
*Correspondence: Sang-Wook Yeh, swyeh@hanyang.ac.kr