Optical properties of graphene oxide
 Talia Tene1
  Marco Guevara2
  Freddy Benalcázar Palacios3 Tania Paulina Morocho Barrionuevo4
  Cristian Vacacela Gomez5*
  Stefano Bellucci5*
- 1Department of Chemistry, Universidad Técnica Particular de Loja, Loja, Ecuador
- 2Facultad de Ingeniería Mecánica, Escuela Superior Politécnica de Chimborazo (ESPOCH), Riobamba, Ecuador
- 3Facultad de Ingeniería en Sistemas Electrónica e Industrial, Universidad Técnica de Ambato, Ambato, Ecuador
- 4Facultad de Ciencias, Carrera de Estadística, Escuela Superior Politécnica de Chimborazo (ESPOCH), Riobamba, Ecuador
- 5INFN-Laboratori Nazionali di Frascati, Frascati, Italy
The study of the optical properties of graphene oxide (GO) is crucial in designing functionalized GO materials with specific optical properties for various applications such as (bio) sensors, optoelectronics, and energy storage. The present work aims to investigate the electronic transitions, optical bandgap, and absorption coefficient of GO under different conditions. Specifically, the study examines the effects of drying times ranging from 0 to 120 h while maintaining a fixed temperature of 80°C and low temperatures ranging from 40
1 Introduction
Over the past decade, oxidized graphenes have gained significant attention due to their unique physical and chemical properties (Chaudhuri and Yun, 2023). For instance, graphene oxide (GO) is produced by oxidizing graphene, a two-dimensional honeycomb material, with strong acids and oxidizing agents (Haydari et al., 2023). This process introduces oxygen-containing functional groups, such as hydroxyl, epoxy, and carboxyl groups (Ferrari et al., 2023), onto the graphene lattice and modifies its electronic structure, creating an intrinsic bandgap. GO offers several advantages over pure graphene, including improved processability, versatility, and cost-effectiveness (Grewal et al., 2018). Specifically, GO possesses interesting properties such as high hydrophilicity, solubility in water, large surface area, excellent dispersibility, and biocompatibility, making it an attractive material for various applications in fields such as energy storage (Safari and Mazloom, 2023), biosensors (Kadhim et al., 2023), water purification (Tene et al., 2022a), electronic devices (Wu et al., 2023), and drug delivery (Sontakke et al., 2023).
However, the presence of oxygen-containing functional groups in GO diminishes its electrical conductivity and mechanical strength (Liu et al., 2022). To address these limitations, GO is often reduced to obtain reduced GO (rGO), which restores the sp2 carbon network and partially recovers the electronic properties of graphene (Yu et al., 2023). This reduction process can be achieved chemically, electrochemically, or thermally. Among these, the thermal reduction at high temperatures (
The electronic and optical properties of GO and rGO are critical for next-generation devices, making it essential to comprehend their behavior in various environments. Explicitly, understanding the electronic transitions and bandgap of these materials is important for optimizing their performance in electronic and photonic devices, designing functional materials, and identifying potential applications. The bandgap of GO and rGO can be estimated using various techniques, including X-ray photoelectron spectroscopy (XPS) and UV-visible spectroscopy (Baragau et al., 2023; Nagaiah et al., 2023). In particular, the Tauc method, which is widely used for estimating the bandgap of semiconducting materials from the absorption spectrum, has also been applied to GO and rGO in several studies (Aragaw, 2020). This method assumes that the absorption coefficient follows a power law as a function of photon energy, and the bandgap can then be estimated as the intercept of the linear portion with the x-axis. Therefore, the Tauc approach can be a useful approximation for estimating the bandgap of oxidized graphenes.
To put the reason for this research field in a broader context, Kumar et al. (2014) introduced a scalable thermal annealing process to enhance the properties of graphene oxide (GO). The annealing induces a phase transformation, resulting in improved optical and electronic properties of GO without compromising its oxygen content. The findings offer a pathway for the bulk processing of GO with enhanced properties for various applications. Very recently, Valentini et al., (2023) investigated the use of low-temperature thermal annealing to tune the electrical properties of GO and rGO. The authors optimized the annealing conditions and show that it is possible to achieve low resistivities and enhanced electrochemical performance in rGO films. This approach is scalable, environmentally friendly, and holds promise for applications in flexible and wearable electronics. These papers propose intriguing methods for producing GO in large quantities with specified features, however, they do not provide further information about the optical bandgap, electrical transitions, or absorption coefficients. To fully understand the possibilities of this strategy in changing the properties of GO, more research is therefore required.
Additionally, in our previous study (Arias Arias et al., 2020), we investigated the effects of drying time on GO with a specific focus on a maximum drying time of 24 h at a temperature of 80°C. Through the use of Raman spectroscopy, UV-visible spectroscopy, and TEM, we discussed changes in defects, absorption spectra, as well as the stacking of GO sheets. The findings contribute to enhancing the production of GO powder, within the limitations of the drying time and temperature parameters explored. With this in mind, in the present work, we extended our study to widely understand the change in electronic transitions, optical bandgap, and spectral weight of several GO samples under the effects of drying time (up to 120 h) and low temperatures (80°C and 50°C). Our analysis includes UV-visible spectroscopy to estimate the bandgap using the Tauc method, as well as energy-dispersive X-ray spectroscopy (EDS) and scanning electron microscopy (SEM) to gain additional insights into the elemental composition and morphology of the obtained materials. Additionally, we discuss in detail the values of the optical absorption coefficient under different environments as well as the related electrical characteristics. These findings provide never-discussed valuable insights into the electronic transitions and optical properties of GO.
2 Materials and methods
It is important to note that details of the oxidation-reduction process and the successful transformation of GO into chemically treated rGO can be found in our previous works (Arias Arias et al., 2020; Tene et al., 2021), along with its applications in pollutant removal, such as methylene blue (Arias Arias et al., 2020) and Hg(II) (Tene et al., 2022b). Here, we provide a brief overview of the synthesis process (Figure 1) and concentrate on discussing the chemical and physical properties of thermally treated GO.
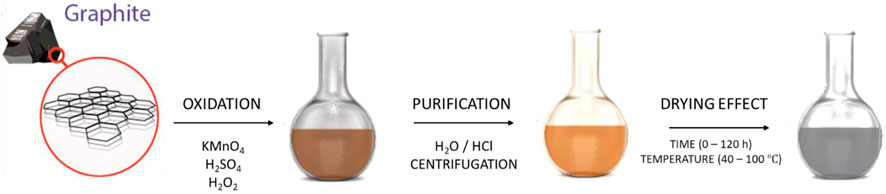
FIGURE 1. Schematic representation of the synthesis process.
2.1 Materials
Graphite powder (150 m, 99.99%), sulfuric acid (H2SO4, ACS reagent, 95.0%–98.0%), potassium permanganate (KMnO4, ACS reagent, 99.0%), and hydrochloric acid (HCl, ACS reagent, 37%) were purchased from Sigma Aldrich. Hydrogen peroxide (H2O2, 30%) was obtained from Merk. All chemicals were used as received without further purification.
2.2 Synthesis of GO
A homogeneous mixture was obtained by adding 3.0 g of graphite powder to 70 mL of H2SO4 and stirring. The mixture was then placed in an ice bath, and 9 g of KMnO4 was added, keeping the temperature under 20°C. After 30 min, the mixture was transferred to a water bath and heated to 50°C for 30 min while constantly stirring. Subsequently, 150 ml of distilled water was gradually added to the solution over 20 min, ensuring that the temperature did not exceed 90°C. Then, 500 ml of distilled water was added, and 15 ml of H2O2 was introduced. After 1 h, the precipitated material was divided into centrifuge tubes and washed with a 1:10 solution of HCl and distilled water via several centrifugations at 10000 rpm for 10 min. The precipitate was then placed in a Teflon container and dried in an oven at a temperature of 45°C for 48 h to obtain graphite oxide powder.
For low-temperature treatment, 100 mg of graphite oxide powder was sonicated for 30 min in 500 ml of distilled water and centrifuged at 500 rpm for 10 min to obtain a homogeneous GO suspension. This suspension was divided into two equal parts. The first part was dried at 80°C considering different drying times ranging from 0 h to 120 h. The second part was dried considering different temperatures from 40°C to 100°C and fixing the drying time at 24 h. The temperature treatment was carried out in a POL-EKO drying stove.
After treatment (drying time or temperature), the samples were sonicated for several minutes to re-disperse them before measuring their optical properties. However, it should be noted that the samples kept at 120°C for 24 h and 80°C for 120 h required an extra sonication time compared to the other samples.
2.3 Characterization
The absorption spectra of GO and rGO were recorded using a Thermo Scientific Evolution 220 spectrophotometer with a resolution of 0.1 nm in a wavelength window from 190 to 1000 nm. The optical absorption coefficient was obtained by setting
3 Results and discussions
To provide context for the significance of our work, it is important to understand the various methods available for treating GO. These methods include chemical, electrochemical, and thermal reduction approaches.
• Chemical reduction involves using agents such as hydrazine, sodium borohydride, hydroiodic acid, or citric acid to remove oxygen functional groups, restoring the sp2 carbon network. While simple, this method may introduce defects and impurities (Tene et al., 2022b).
• Electrochemical reduction applies a voltage or current to a GO electrode immersed in a reducing electrolyte solution (Tian et al., 2023). It offers better control and higher-quality results but requires specialized equipment and time.
• Thermal reduction involves heating GO at high temperatures in the presence of a reducing agent, resulting in the breakdown of functional groups and the restoration of the graphene lattice. Different heating methods and reducing agents can be used (Sengupta et al., 2018). This approach is simple and cost-effective but requires high temperatures and long processing times.
Some works have explored low-temperature reduction or thermolysis, where GO is heated below 100°C in a vacuum or inert atmosphere (Wang et al., 2012). Despite numerous studies on GO reduction, there is a lack of reports on a simple, low-temperature treatment without a reducing agent or controlled atmosphere.
3.1 Absorption spectra vs. drying time
The temperature of 80°C was selected as a representative value within the studied temperature range. By keeping the temperature constant at 80°C, we aimed to isolate the influence of drying time alone. Additionally, starting with this fixed temperature allows for a direct comparison with some results reported by Kumar et al., (2014).
Figure 2 depicts the absorption spectra of GO at 80°C with varying sample drying times, ranging from 0 to 120 h. The red and green lines represent the Lorentzian fit using one or two peaks. Two distinct electronic transitions are observed: the
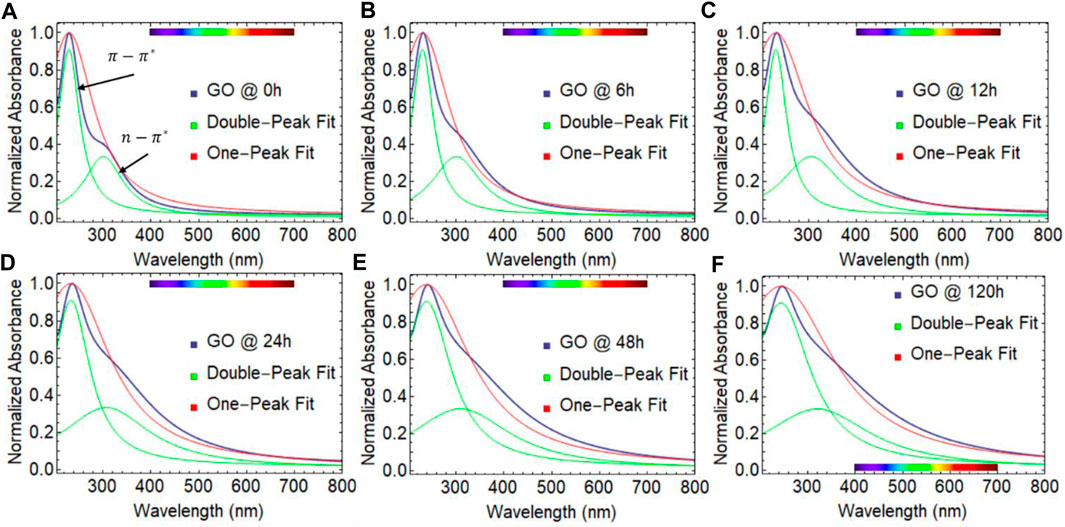
FIGURE 2. UV-visible spectra of graphene oxide (GO) dried at 80
To contextualize, the
On the other hand, the
Then, one interesting observation is the shift in the position of the
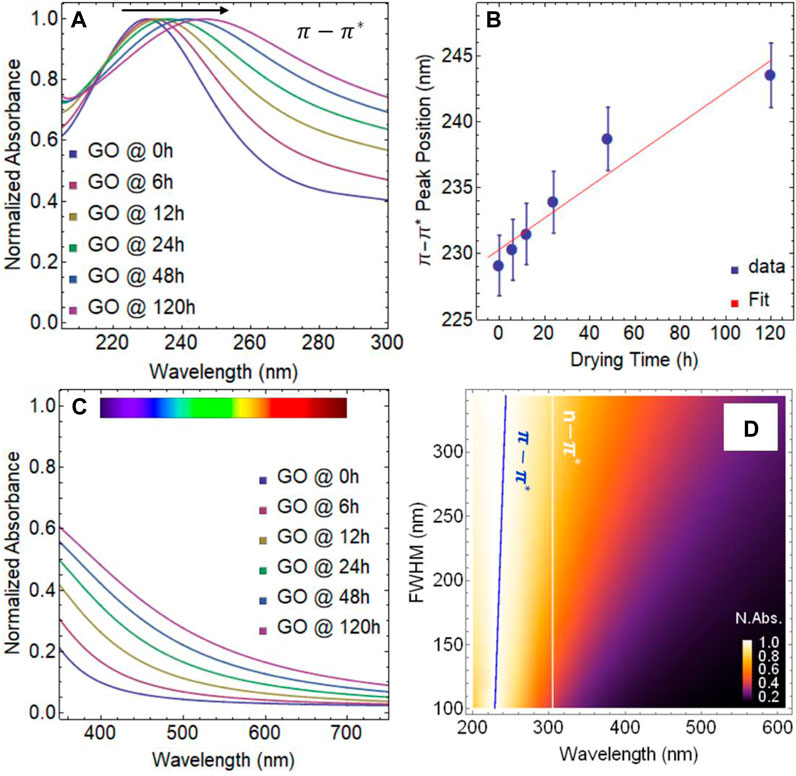
FIGURE 3. (A) UV-visible spectra of graphene oxide (GO) from 200 to 300 nm. (B) Position of the
When performing a linear regression analysis on the data points of the
A marginal effect is observed in the position of the
As our study progresses, a previously unreported finding has come to light, a linear correlation between the full width at half maximum (FWHM) and absorbance spectra of dried GO samples. As the drying time increases, so does the width of the absorbance curve, which is constructed by both the
3.2 Optical bandgap vs. drying time
In the Tauc approach, the absorption coefficient (
where
To determine the optical bandgap of GO using the Tauc approach, we first analyzed the absorbance spectrum of each sample. Next, we plotted the absorption coefficient (
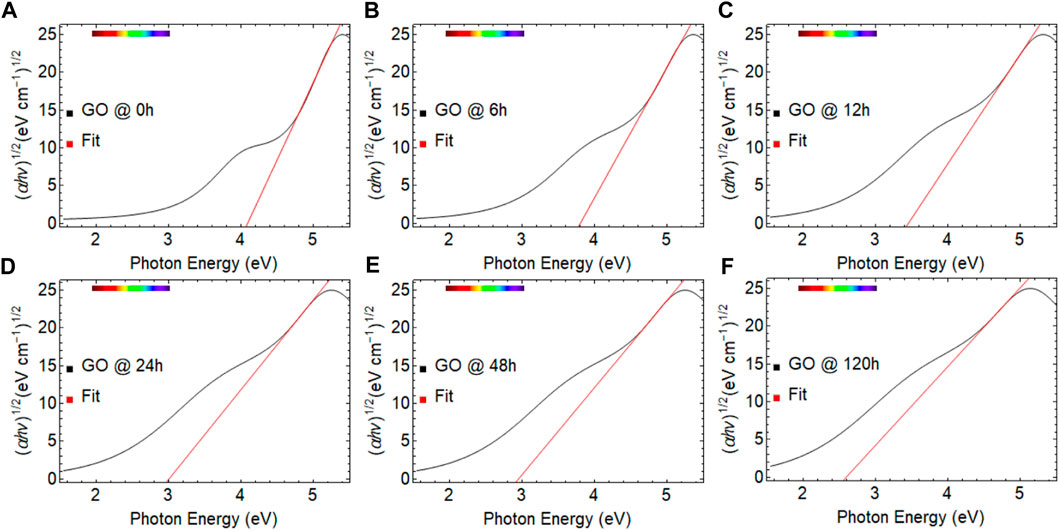
FIGURE 4. Tauc plots of graphene oxide (GO) dried at 80
Figure 4 depicts the Tauc plot of GO at 80°C, where the drying time was varied from 0 to 120 h. The red line corresponds to the fitted region showing a steep linear increase of light absorption with increasing energy, which is a characteristic of semiconductor materials (Makuła et al., 2018). Table 1 provides the optical bandgap values estimated for each GO sample.
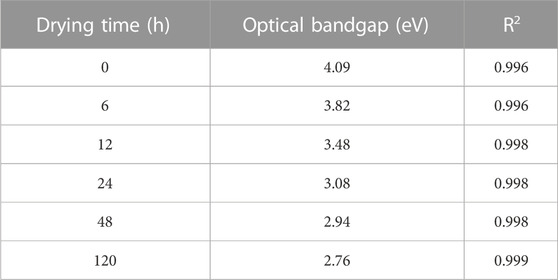
TABLE 1. Estimated optical bandgap values of graphene oxide (GO) as a function of drying time from 0 to 120 h. R2 is the coefficient of determination (R-squared).
In Figure 4, all spectra exhibit a marked change in absorbance in the energy region of 4.1–5.5 eV, which is also characteristic of wide bandgap semiconductors. This pronounced change corresponds to the
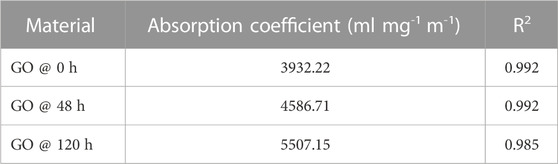
TABLE 2. Optical absorption coefficient estimated by a linear fit of the optical absorbance over cell length as a function of concentration under different drying times. R2 is the coefficient of determination (R-squared).
In Figure 5A, we present the relationship between the optical bandgap and the drying time, which exhibits a clear exponential decreasing trend. By performing a fit analysis, we obtained the expression:
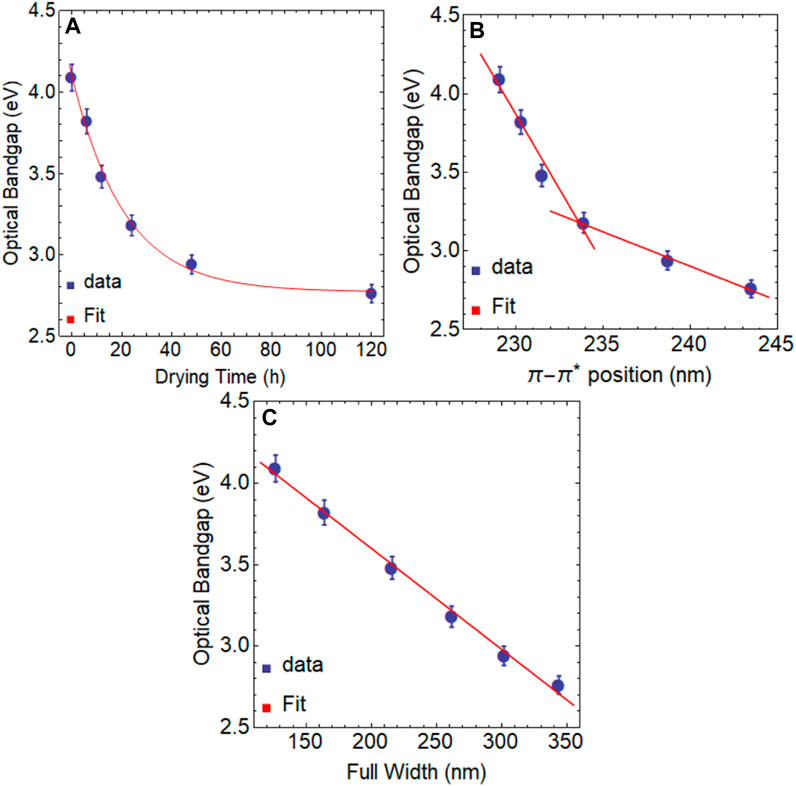
FIGURE 5. Optical bandgap of graphene oxide (GO) as a function of (A) drying time, (B) position of the
It is important to mention that materials possessing a bandgap of
Moreover, we have uncovered an inverse correlation between the position of the
3.3 Absorption coefficient vs. drying time
The adsorption coefficient (
where
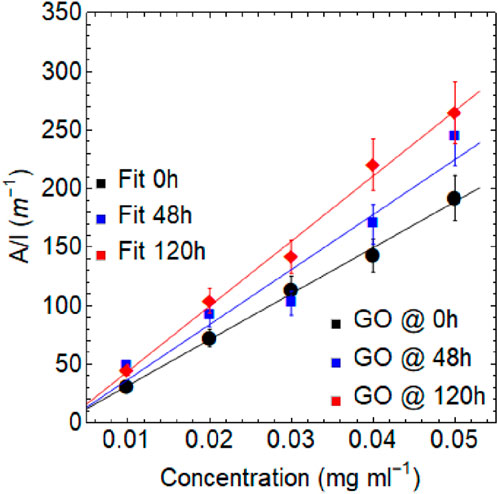
FIGURE 6. Optical absorbance at 660 nm divided by cell length as a function of concentration for graphene oxide (GO) subject to different drying times (0, 48, and 120 h).
The values of α were determined by calculating the slope of the linear fit. The results show that
The absorption coefficient of GO is higher than that of exfoliated graphene, likely due to the presence of oxygen-containing functional groups on its surface. These functional groups introduce defects in the hexagonal carbon lattice of graphene, creating localized states that can interact with photons at a wider range of energies than the delocalized
3.4 Effect of temperature
The impact of temperature on the optical properties of GO is examined in this section. Four different temperatures, namely 40°C, 60°C, 80°C, and 100°C, have been selected for the experiment. The duration of the experiment has been set at 24 h to ensure homogeneity, as the water in the GO dispersion evaporates rapidly at 100°C. Therefore, a fixed duration of 24 h has been chosen to keep the experimental conditions as consistent as possible.
The absorbance spectra of GO subjected to different temperatures are shown in Figure 7A and the corresponding position of the
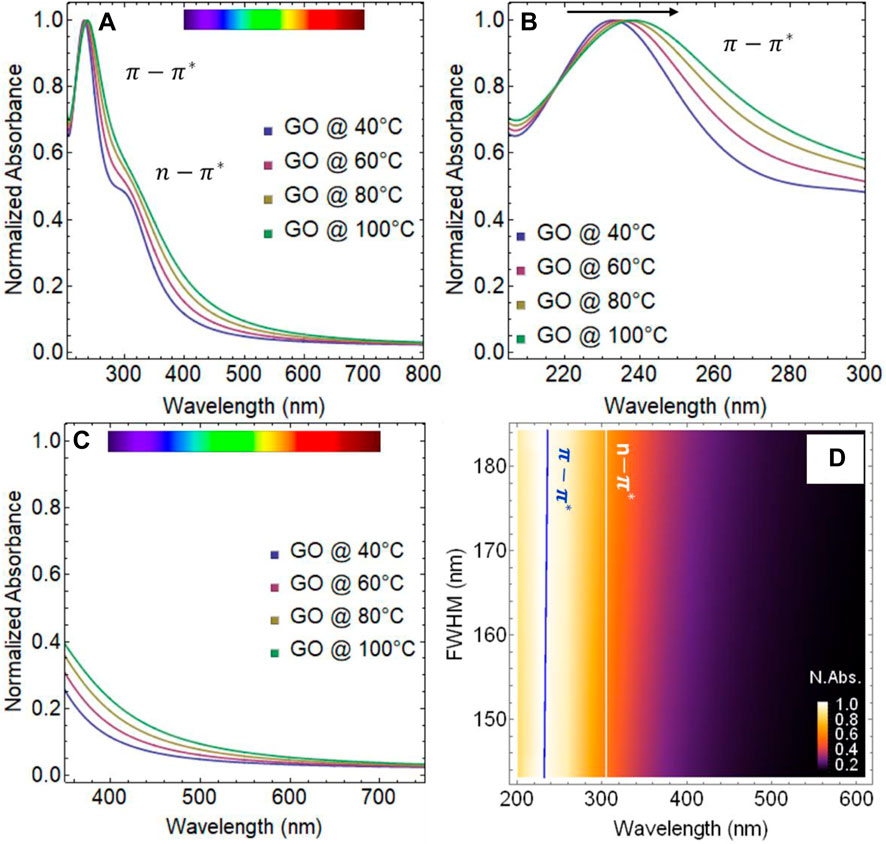
FIGURE 7. UV-visible spectra of graphene oxide (GO) (A) from 200 to 800 nm, (B) from 200 to 300 nm, (C) from 350 to 750 nm. (D) Normalized absorbance as a function of full-width half maximum (FWHM) vs. wavelength.
Figure 7D displays the normalized absorbance as a function of FWHM vs. wavelength. The blue line indicates that the shift of the
Figure 8A displays a linear correlation between the optical bandgap and temperature. The optical bandgap decreases from 3.97 eV at 40°C to 3.06 eV at 100°C (Table 3, Supplementary Figure S4), with a variation of less than 1.0 eV. A linear fit of these data yields the following expression:
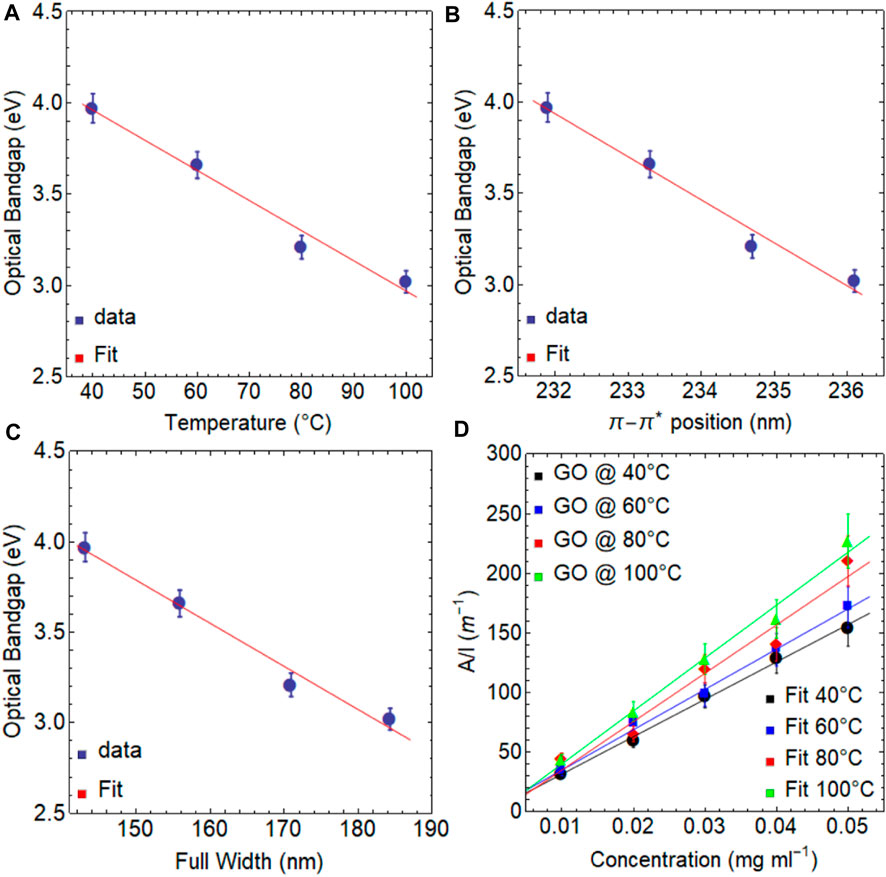
FIGURE 8. Optical bandgap of graphene oxide (GO) as a function of (A) drying time, (B) position of the
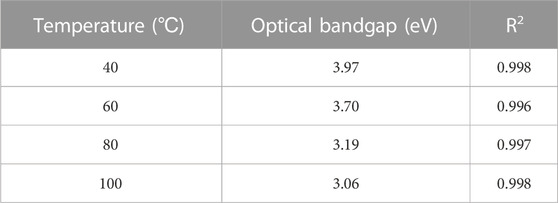
TABLE 3. Estimated optical bandgap values of graphene oxide (GO) as a function of temperature from 40 to 100
As well, a linear correlation is also observed between the optical bandgap and the position of the
Figure 8C; Table 4 demonstrate a trend similar to what was discussed previously. As the temperature increases, the absorption coefficient increases from 3140 ml mg−1m−1 at 40°C to 4061 ml mg−1 m−1 at 100°C. However, these values are slightly lower than those obtained due to the effect of drying time (see Table 2). All these results demonstrate the remarkable versatility of graphene oxide in modulating its electronic transitions, optical bandgap, and absorption coefficient through simple control of temperature and drying time.
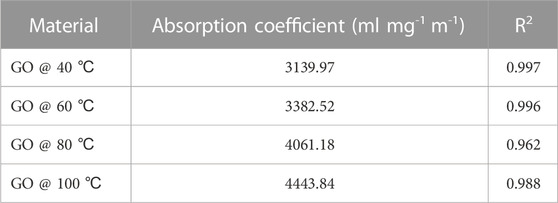
TABLE 4. Optical absorption coefficient estimated by a linear fit of the optical absorbance over cell length as a function of concentration under different temperatures. R2 is the coefficient of determination (R-squared).
3.5 Elemental composition and surface morphology
EDS analysis is a powerful technique that can be used to investigate the elemental composition of GO. Specifically, it can identify the presence of elements such as carbon, oxygen, and impurities. In this study, a sufficiently large area of GO samples was investigated using EDS to ensure the reliability of the results. However, it is important to note that to obtain a complete characterization of the material, other analytical techniques may also need to be employed in conjunction with EDS.
The results obtained are presented in Figure 9; Supplementary Figure S6, and Supplementary Table S3. To provide a basis for comparison, we first analyzed graphite (Supplementary Figure S5), which is composed primarily of carbon. As expected, the analysis showed a high carbon content of approximately 99%, which is consistent with the elemental composition of natural graphite. While this result is not surprising, it serves as a useful reference point for comparing the results obtained from other samples that may have more complex elemental compositions such as GO under the effect of drying time and temperature.
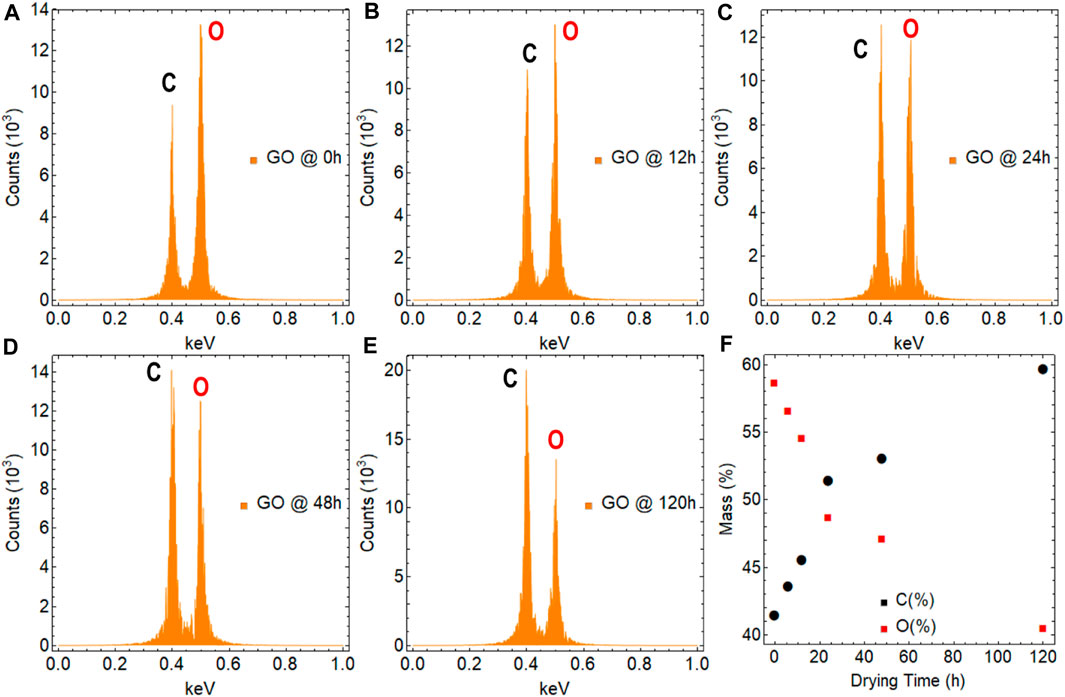
FIGURE 9. EDS measurements on graphene oxide (GO) subjects at different temperatures: (A–E) 0–120 h while maintaining a fixed temperature of 80°C, respectively. (F) Percentual mass as a function of drying time.
The impact of drying time on the oxygen content of GO can be understood by analyzing samples at two extreme points, at 0 h (Figure 9A) and 120 h (Figure 9E). The results indicate that as drying time increases, the oxygen content decreases from approximately 59%–40% (Figure 9F), indicating the removal of oxygen in various functional groups. This reduction in oxygen content, mainly, is attributed to the evaporation of water and other oxygen-containing functional groups (Saxena et al., 2011). These findings have implications for understanding the stability and properties of GO and can inform strategies for optimizing its synthesis and postprocessing conditions.
As well, the influence of temperature on GO can be examined by investigating extreme values, specifically at 40°C and 100°C. Intriguingly, exposing GO to 40°C for 24 h led to a rise of around 64% in oxygen content. This effect can be attributed to the fact that the resulting GO sample remained in the form of an aqueous dispersion after 24 h, and the evaporated water molecules could become intercalated within the internal structure of GO. Conversely, after 24 h at 100°C, the oxygen content decreased to 43%. This can be attributed to the fact that even though the sample was dry, the water molecules that were trapped and intercalated within GO required more time to escape from the internal structure.
The morphology of the samples is illustrated in Figure 10. The starting graphite powder used in this study exhibited medium to large, corrugated flakes on the surface (Supplementary Figure S7). Conversely, the GO sample with 0 h of drying time exhibited a relatively smaller size, surface wrinkles, and several folds on the edges, confirming the chemical exfoliation of the materials by oxidation (Figure 10A). Furthermore, GO subjected to 120 h of drying time displayed a similar behavior with folded edges, but its surface morphology is more uniform, implying the partial recovery of sp2 hybridization, at least at the base of the GO plane (Figure 10B).
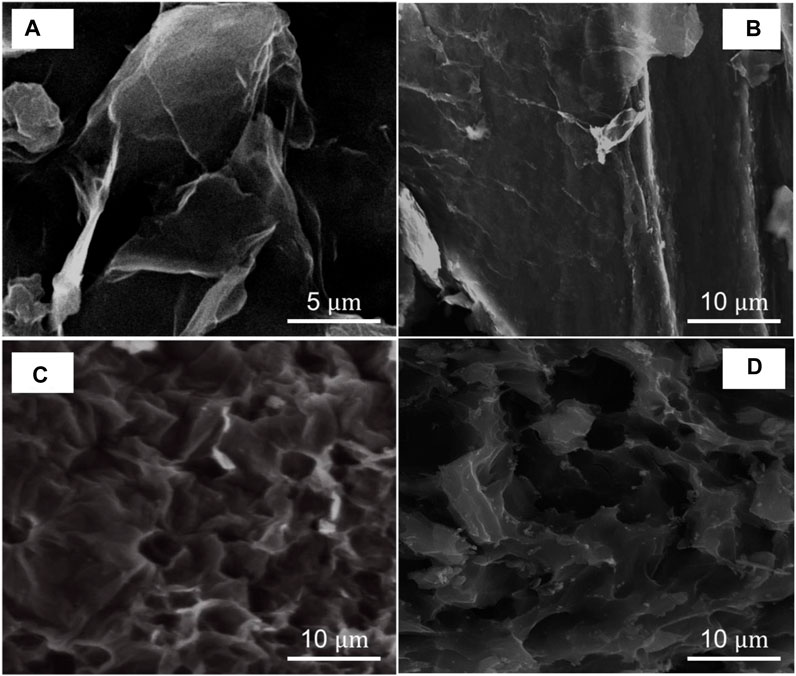
FIGURE 10. SEM images of graphene oxide (GO) under different drying times while maintaining a fixed temperature of 80°C: (A) 0 h and (B) 120 h as well as under different temperatures for 24 h of drying: (C) 40
Conversely, when GO was exposed to temperatures of 40°C (Figure 10C) and 100°C (Figure 10D) for 24 h, no discernible changes were observed, and the surface remained corrugated with several folded edges. This outcome suggests that GO continued to exhibit a predominant sp3 hybridization, which is attributed to the presence of oxygen functional groups that still existed in the GO structure.
The Raman analysis of GO under different conditions (i.e., drying time and temperature) (Supplementary Figure S8; Supplementary Table S4) reveals four prominent peaks: D, D**, G, and D′. Each peak represents specific molecular vibrations and provides insights into its structure (Arias Arias et al., 2020). The D peak (
The EDS, Raman, and SEM results provided further confirmation that when operating at low temperatures (
To further characterize the treated samples, Figure 11; Supplementary Table S5 show the current vs. voltage plots (I-V curves) for GO treated at 0 h (black line), 120 h (red line), 40°C (green line), and 100°C (blue line). GO at 0 h (
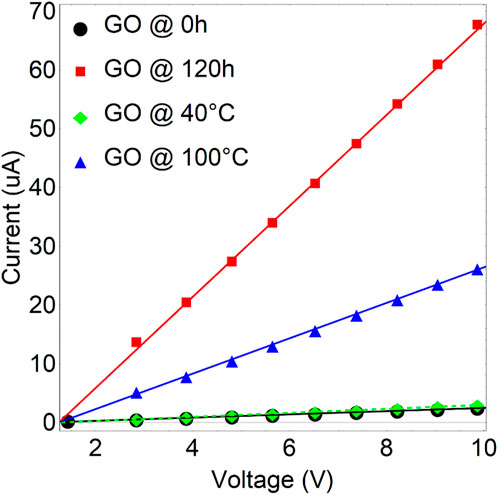
FIGURE 11. I-V characteristics of graphene oxide (GO) under varying drying times and temperatures are presented. The green and blue curves depict GO dried for 24 h at 40°C and 100°C, respectively. Meanwhile, the black and red curves represent GO dried at 80°C for 0 and 120 h, respectively.
4 Conclusion
In summary, we explored the physical and chemical properties of GO treated at low temperatures. Our focus is on investigating the electronic and optical characteristics of GO and the changes in these features upon drying time (from 0 h to 120 h while maintaining a fixed temperature of 80°C) and low temperatures (from 40
We found that the
Our findings can be used to tailor the use of GO in various contexts by determining the optimal temperature and duration for a specific application. Additionally, this study provides valuable insights into the electronic transitions and optical properties of GO and fills a gap in the literature on low-temperature treatment processes for GO without strong reductant agents or controlled environments.
Finally, we would like to underscore the significance of our findings concerning the optical properties of GO, however, it is crucial to point out that a more comprehensive understanding of the results presented in this study could be attained through the inclusion of complementary XPS measurements. By integrating XPS analysis, one can be able to delve deeper into the intricate aspects of our findings and acquire a more thorough understanding of the observed phenomena.
Data availability statement
The authors declare that the data supporting the findings of this study are available within the paper (and its Supplementary Information files). Further raw data are also available from the corresponding author upon reasonable request.
Author contributions
CVG and SB supervised the work. TT prepared GO samples. FB, TP, and MG performed EDS analysis and SEM observation. TP and TT performed the statistical analysis. TT conducted UV-visible measurements. All authors contributed to the scientific discussion and manuscript preparation. TT and CVG wrote the manuscript. All authors contributed to the article and approved the submitted version.
Funding
This work was funded by the Universidad Técnica Particular de Loja (UTPL-Ecuador) under the project: “Análisis de las propiedades térmicas del grafeno y zeolita” Grand No: PROY_INV_QU_2022_362. This work was partially supported by LNF-INFN: Progetto HPSWFOOD Regione Lazio—CUP I35F20000400005.
Acknowledgments
CVG, MG, and TT wish to thank Escuela Superior Politécnica de Chimborazo for their hospitality during the completion of this work.
Conflict of interest
The authors declare that the research was conducted in the absence of any commercial or financial relationships that could be construed as a potential conflict of interest.
Publisher’s note
All claims expressed in this article are solely those of the authors and do not necessarily represent those of their affiliated organizations, or those of the publisher, the editors and the reviewers. Any product that may be evaluated in this article, or claim that may be made by its manufacturer, is not guaranteed or endorsed by the publisher.
Supplementary material
The Supplementary Material for this article can be found online at: https://www.frontiersin.org/articles/10.3389/fchem.2023.1214072/full#supplementary-material
References
Aragaw, B. A. (2020). Reduced graphene oxide-intercalated graphene oxide nano-hybrid for enhanced photoelectrochemical water reduction. J. Nanostructure Chem. 10, 9–18. doi:10.1007/s40097-019-00324-x
Arias Arias, F., Guevara, M., Tene, T., Angamarca, P., Molina, R., Valarezo, A., et al. (2020). The adsorption of methylene blue on eco-friendly reduced graphene oxide. Nanomaterials 10, 681. doi:10.3390/nano10040681
Baragau, I-A., Buckeridge, J., Nguyen, K. G., Heil, T., Sajjad, M. T., Thomson, S. A. J., et al. (2023). Outstanding visible light photocatalysis using nano-TiO2 hybrids with nitrogen-doped carbon quantum dots and/or reduced graphene oxide. J. Mater. Chem. A 11, 9791–9806. doi:10.1039/D2TA09586F
Chaudhuri, H., and Yun, Y-S. (2023). A critical review on the properties and energy storage applications of graphene oxide/layered double hydroxides and graphene oxide/MXenes. J. Power Sources 564, 232870. doi:10.1016/j.jpowsour.2023.232870
Ferrari, I., Motta, A., Zanoni, R., Scaramuzzo, F. A., Amato, F., Dalchiele, E. A., et al. (2023). Understanding the nature of graphene oxide functional groups by modulation of the electrochemical reduction: A combined experimental and theoretical approach. Carbon 203, 29–38. doi:10.1016/j.carbon.2022.11.052
Grewal, S., Macedo Andrade, A., Nelson, A. J., Thai, K., Karimaghaloo, A., Lee, E., et al. (2018). Critical impact of graphene functionalization for transition metal oxide/graphene hybrids on oxygen reduction reaction. J. Phys. Chem. C 122, 10017–10026. doi:10.1021/acs.jpcc.8b01893
Haydari, I., Aziz, K., Kaya, S., Daştan, T., Ouazzani, N., Mandi, L., et al. (2023). Green synthesis of reduced graphene oxide and their use on column adsorption of phenol from olive mill wastewater. Process Saf. Environ. Prot. 170, 1079–1091. doi:10.1016/j.psep.2022.12.086
Hernandez, Y., Nicolosi, V., Lotya, M., Blighe, F. M., Sun, Z., De, S., et al. (2008). High-yield production of graphene by liquid-phase exfoliation of graphite. Nat. Nanotechnol. 3, 563–568. doi:10.1038/nnano.2008.215
Kadhim, M. M., Rheima, A. M., Abbas, Z. S., Jlood, H. H., Hachim, S. K., Kadhum, W. R., et al. (2023). Evaluation of a biosensor-based graphene oxide-DNA nanohybrid for lung cancer. RSC Adv. 13, 2487–2500. doi:10.1039/d2ra05808a
Kumar, P. V., Bardhan, N. M., Tongay, S., Wu, J., Belcher, A. M., and Grossman, J. C. (2014). Scalable enhancement of graphene oxide properties by thermally driven phase transformation. Nat. Chem. 6, 151–158. doi:10.1038/nchem.1820
Liu, C., Hunag, X., Wu, Y. Y., Deng, X., Zheng, Z., and Yang, B. (2022). Studies on mechanical properties and durability of steel fiber reinforced concrete incorporating graphene oxide. Cem. Concr. Compos. 130, 104508. doi:10.1016/j.cemconcomp.2022.104508
Makuła, P., Pacia, M., and Macyk, W. (2018). How to correctly determine the band gap energy of modified semiconductor photocatalysts based on UV–Vis spectra. J. Phys. Chem. Lett. 9, 6814–6817. doi:10.1021/acs.jpclett.8b02892
Nagaiah, K., A.b., K., R., S. R., and Akkera, H. S. (2023). Effects of the phase, morphology, band gap and hydrogen evolution of vanadium oxide with reduced graphene oxide. Mater. Today Commun. 34, 105478. doi:10.1016/j.mtcomm.2023.105478
Romero, U. A. M., Soto, M. Á. V., Jiménez, L. L., Quintana, J. Á., and García, S. A. P. (2017). Graphene derivatives: Controlled properties, nanocomposites, and energy harvesting applications. London, UK: IntechOpen, 77–96.
Safari, M., and Mazloom, J. (2023). Outstanding energy storage performance in CoFe bimetallic metal-organic framework spindles via decorating with reduced graphene oxide nanosheets. J. Energy Storage 58, 106390. doi:10.1016/j.est.2022.106390
Saxena, S., Tyson, T. A., Shukla, S., Negusse, E., Chen, H., and Bai, J. (2011). Investigation of structural and electronic properties of graphene oxide. Appl. Phys. Lett. 99, 013104. doi:10.1063/1.3607305
Sengupta, I., Chakraborty, S., Talukdar, M., Pal, S-K., and Chakraborty, S. (2018). Thermal reduction of graphene oxide: How temperature influences purity. J. Mater. Res. 33, 4113–4122. doi:10.1557/jmr.2018.338
Sontakke, A. D., Tiwari, S., and Purkait, M. K. (2023). A comprehensive review on graphene oxide-based nanocarriers: Synthesis, functionalization and biomedical applications. FlatChem 38, 100484. doi:10.1016/j.flatc.2023.100484
Tene, T., Arias Arias, F., Guevara, M., Nuñez, A., Villamagua, L., Tapia, C., et al. (2022b). Removal of mercury (II) from aqueous solution by partially reduced graphene oxide. Sci. Rep. 12, 6326. doi:10.1038/s41598-022-10259-z
Tene, T., Bellucci, S., Guevara, M., Arias Arias, F., Sáez Paguay, M. Á., Quispillo Moyota, J. M., et al. (2022a). Adsorption of mercury on oxidized graphenes. Nanomaterials 17, 3025. doi:10.3390/nano12173025
Tene, T., Guevara, M., Valarezo, A., Salguero, O., Arias Arias, F., Arias, M., et al. (2021). Drying-time study in graphene oxide. Nanomaterials 11, 1035. doi:10.3390/nano11041035
Tian, Y., Han, S., Chen, P., Cao, L., Hu, A., Li, M., et al. (2023). Electrochemically reduced graphene oxide (ERGO)-Cu bilayer structure fabricated at room temperature for future interconnects. RSC Adv. 13 (4), 2372–2378. doi:10.1039/D2RA07223H
Vacacela Gómez, C., Guevara, M., Tene, T., Villamagua, L., Usca, G. T., Maldonado, F., et al. (2021). The liquid exfoliation of graphene in polar solvents. Appl. Surf. Sci. 546, 149046. doi:10.1016/j.apsusc.2021.149046
Valentini, C., Montes-García, V., Livio, P. A., Chudziak, T., Raya, J., Ciesielski, A., et al. (2023). Tuning the electrical properties of graphene oxide through low-temperature thermal annealing. Nanoscale 15, 5743–5755. doi:10.1039/d2nr06091d
Wang, Z., Xu, D., Huang, Y., Wu, Z., Wang, L. m., and Zhang, X. b. (2012). Facile mild and fast thermal-decomposition reduction of graphene oxide in air and its application in high-performance lithium batteries. Chem. Commun. 48 (7), 976–978. doi:10.1039/c2cc16239c
Wu, J., Lin, H., Moss, D. J., Loh, K. P., and Jia, B. (2023). Graphene oxide for photonics, electronics and optoelectronics. Nat. Rev. Chem. 7, 162–183. doi:10.1038/s41570-022-00458-7
Keywords: graphene oxide, optical bandgap, electronic transitions, absorption coefficient, Tauc analysis
Citation: Tene T, Guevara M, Benalcázar Palacios F, Morocho Barrionuevo TP, Vacacela Gomez C and Bellucci S (2023) Optical properties of graphene oxide. Front. Chem. 11:1214072. doi: 10.3389/fchem.2023.1214072
Received: 28 April 2023; Accepted: 29 June 2023;
Published: 20 July 2023.
Edited by:
Naoufal Bahlawane, Luxembourg Institute of Science and Technology (LIST), LuxembourgReviewed by:
Angela Longo, National Research Council (CNR), ItalyAndjelika Bjelajac, Luxembourg Institute of Science and Technology (LIST), Luxembourg
Copyright © 2023 Tene, Guevara, Benalcázar Palacios, Morocho Barrionuevo, Vacacela Gomez and Bellucci. This is an open-access article distributed under the terms of the Creative Commons Attribution License (CC BY). The use, distribution or reproduction in other forums is permitted, provided the original author(s) and the copyright owner(s) are credited and that the original publication in this journal is cited, in accordance with accepted academic practice. No use, distribution or reproduction is permitted which does not comply with these terms.
*Correspondence: Cristian Vacacela Gomez, vacacela@lnf.infn.it; Stefano Bellucci, bellucci@lnf.infn.it