Synthesis, band gap structure and third order non-linear optical properties of zinc tungsten oxide nanocomposite using a single CW laser beam
 Zahra Jalili1
  Behrooz Maleki
- 1Department of Chemistry, Faculty of Sciences, Hakim Sabzevari University, Sabzevar, Iran
- 2Department of Physics, Faculty of Sciences, Hakim Sabzevari University, Sabzevar, Iran
- 3Department of Organic Chemistry, Faculty of Chemistry, University of Mazandaran, Babolsar, Iran
In this study, a composite of zinc tungsten oxide nanoparticles (W-ZnO NPs) has been synthesized via mixing Na2WO4 and zinc acetate in water, followed by dropwise addition of NaOH. The synthesized W-ZnO NPs were characterized using measurement methods such as XRD, dynamic light scattering (DLS), Scanning electron microscopy (SEM) and UV-Vis. Also, the results were compared with the pure synthesized ZnO and WO3 NPs. Non-linear optical properties of the synthesized composite were measured using the Z-scan technique with a continuous wave Nd-Yag laser. The negative non-linear absorption coefficient of the components was obtained which indicates that the saturation absorption occurred in this composite. In comparison with pure ZnO NPs, non-linear absorption decreases which can be attributed to the negligible optical response of WO3 structures. Also, the negative value of the close aperture Z-scan curve shows that the thermal lensing effect is the main reason for the third-order non-linear refraction.
1 Introduction
Recently, the use of inorganic materials in electronic and optical devices as active elements, such as light-emitting diodes, photovoltaic devices, and field-effect transistors has received much attention from the outlook of potential technological applications as well as fundamental science (Cao et al., 2011; Akherat Doost et al., 2021; Ashfaq et al., 2022). Meanwhile, metal oxide NPs (MONPs) are more important in technology because of their unique semiconducting properties (Silva et al., 2019) and play a considerable role in a multitude of fields of chemistry, physics and material sciences. MONPs are commonly known as catalysts, gas sensors, absorbents, superconductors, semiconductors and ceramics (Naseem and Durrani, 2021). Due to the effect of morphology and size on the properties of metal oxide NPs, their synthesis techniques mainly focus on these two parameters (Maduraiveeran et al., 2019). Among MONPs, the transition metal oxides have drawn much notice due to their outer electron configuration (Velmurugan and Incharoensakdi, 2018)
Among various classes of metal oxide NPs, II-VI class inorganic semiconductor nanomaterials like Zinc Oxide (ZnO), Cadmium Sulfide (CdS) and Zinc Sulfide (ZnS) have emerged as important materials for the applications in photovoltaic and optoelectronics devices (Abbasi et al., 2017). High chemical stability, inexpensive and easy synthesis methods and fast optical response speed lead to the use of them in non-linear optical devices such as optical switchers (Koushki et al., 2014a).
Zinc oxide (ZnO) and tungsten oxide (WO3) are among the most widely used transition metal oxides. ZnO is a semiconductor with a wide band gap, good electrical conductivity and high transmittance (Nakahara et al., 2001). ZnO is one of the most highly used materials in catalysts and photocatalysts, optical materials, solar cells, UV absorbers in cosmetics, biosensors and nanogenerators (Gao et al., 2005; Srivastava et al., 2013). In addition to the above features, ZnO NPs have the potential for applications as non-linear optical devices, optical switchers, and have been studied extensively (Baedi et al., 2021). Being a member of group II-VI compounds, ZnO NPs have been extensively used in photovoltaic and optoelectronic devices. On the other hand, WO3 NPs also have far-reaching usages in various fields such as batteries, gas sensors, catalysts and photocatalysts, illumination and electronics (Widenkvist et al., 2008; Hariharan et al., 2019). The synthesis of ZnO NPs doped WO3 has also been investigated in a few articles, from the viewpoint of structure and photocatalytic properties (Arshad et al., 2020).
In the present work, WO3, ZnO and zinc tungsten oxide NPs (W-ZnO NPs) have been synthesized through hydrothermal and chemical methods, and characterized using some measurement methods such as XRD, DLS, SEM and UV-Vis. After the evaluation of the band gap structure, the third-order non-linear optical properties of the synthesized composite were measured using the Z-scan method (Sheik-Bahae et al., 1990), and interesting results about the origin of non-linear absorption and refraction were offered at low laser irradiations regimes. Z scan technique was first discovered by Sheik-Bahae and his colleagues, and it is still used because of simplicity and highly sensitivity in measuring non-linear optical properties of materials (Sharma et al., 2012). To obtain the non-linear optical information of the material, it is enough to move the sample along the laser beam and detect the transmitting power through the sample. This experiment found that WO 3 doping can reduce the non-linear absorption coefficient and consequently the saturation of absorption of W-ZnO NPs [18] while increasing the absorption of the composite. It was directly related to the band gap structure of the synthesized composite, and discussed from the viewpoint of the physical properties of the charge carriers. The main novelty of this study is the investigation of tungsten dopant effects on the optical properties, bandgap and subsequently non-linear optical properties of ZnO nanoparticles.
2 Experiments
2.1 Experimental methods
The synthesized nanostructures were characterized by X-ray diffraction (XRD, DMAX2500, Rigaku X-ray diffractometer) in the 2θ domain at 30 mA and 40 keV and a scanning rate of 3° min-1 from 10° to 80° with Cu Kα radiation. The morphology and size of NPs were studied using a scanning electron microscope (SEM, MIRA3, TESCAN, Czech Republic) and a DynaPro NanoStar dynamic light scattering (DLS) detector (WYATT Technology). UV-visible spectra were recorded with a EU_2200 spectrophotometer.
Z scan setup contains a continuing wave (CW) Nd-Yag laser, a convergence lens, and a detector. The laser beam, which has a Gaussian distribution, propagates along the Z direction. The lens is placed perpendicular to the Z direction. After the lens, the laser beam is focused, and the sample containing the nano-colloid scans the z-axis before and after the focus. The beam falls completely into the detector to measure the transmitted power. In a close aperture setup which is due to the non-linear refraction, a finite aperture is placed before the detector, as shown in Figure 1.
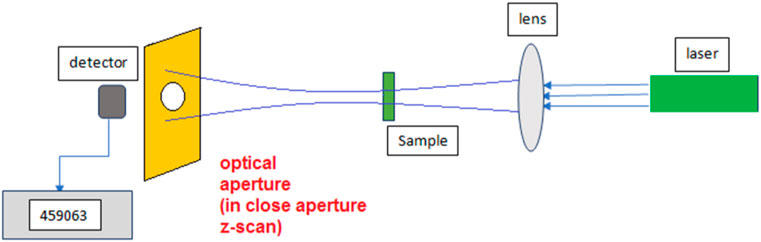
FIGURE 1. Schematic of Z-scan technique.
The wavelength of the used green laser in close and open aperture Z-scan curves was 532.8 nm (CNIlaser/MSL-S-532-S). The output power of the laser was about 5mW, and the beam was focused using a convergence lens with a focal length of 8 cm. The beam waist at the focal point was measured at about
3 Theory of Z-scan method
In the presence of the laser beam, the absorption coefficient (β) and also the refractive index (
where
In this relation, D is the distance between the aperture and the sample, and
and also
where
So, at any point of z, the normalized transmittance follows:
Eq. 6 gives close aperture Z-scan curve which is sensitive to the non-linear refractive index and, it can be evaluated by the suitable curve fitting with experimental data
where
4 Synthesis of NPs
Here, the experimental routes for the synthesis of NPs were offered.
4.1 Synthesis of WO3
We used a reliable technique based on the recommendations of Hassani et al., 2011 to synthesize WO3. A mixture of Na2WO4.2H2O (0.4 g) and NaCl (0.15 g) was dissolved in deionized water (2 mL) under magnetic stirring. HCl (3 M) was added dropwise to the stirring solution until the solution became acidic. The solution was heated into in an autoclave at 180°C for 2 h. Being under room temperature for a time span of 1 day, the precipitate was centrifuged (2 min, 30,000 rpm) with ethanol and distilled water, and then dried at 60°C for 8 h.
4.2 Synthesis of ZnO
ZnO was prepared as described by Liu et al., 2014. For this purpose, a mixture of zinc acetate (Zn(AC)2, 0.75 g) and sodium peroxide (Na2O2, 0.4 g) was dissolved into 40 mL of deionized water under stirring. 20 min later, the mixture was centrifuged, and the separated final white product was washed with distilled water several times, and then dried at 50°C for 8 h.
4.3 Preparation of W-ZnO NPs
As reported in the previous work (Chen et al., 2021), W-ZnO was synthesized via mixing 2.5 mL sodium tungstate (Na2WO4.2H2O, 0.5 M) and 22 mL zinc acetate dihydrate (Zn(CH₃CO₂)₂·2H₂O, 1 M) in water, followed by dropwise addition of 35 mL NaOH (4 M) and stirring at room temperature (for 3 hours) to form the precursor. The suspension was then transferred into a glass conical flask (250 mL) with a ground glass stopper, and then water was added up to the marked line, and the temperature was maintained at 95 C for 10 h. The produced precipitate was collected, washed with deionized water, and dried at ambient temperature in the air.
5 Results and discussion
5.1 Characterization and structural identification of NPs
As carefully described in the experimental section, WO3, ZnO and W-ZnO NPs were synthesized through reliable techniques. The resulting nanomaterial was characterized by means of various techniques including XRD, DLS, ESM and UV-Vis as follows.
To demonstrate the successful synthesis of NPs and to investigate their crystal phase, XRD measurements have been performed. Figure 2B reveals the monoclinic structure of synthesized WO3 by matching it with the standard patterns (JCPDS card no. 83-0950, Figure 2A). Main strong diffraction peaks at 2θ = 23.1°, 23.5°, 24.3°, 26.6°, 28.3°,32.8°, 33.2°, 34.0°, 41.4°, 49.8°, 50,4° are assigned as (002), (020), (200), (120), (112), (022), (202), (220), (222), (232) and (114). The XRD pattern for the synthesized ZnO NPs is shown in Figure 2D. The XRD peaks at 2θ = 31.5°, 34.2°, 36.4°, 47.8°, 56.7°, 62.9°, 66.3°, 67.8° and 69.2° are associated with the (100), (002), (101), (102), (110), (103), (200), (112) and (201) crystalline planes of hexagonal crystal geometry of ZnO, which is associated with JCPSD card no. 01-007-2551 (Figure 2C). In the XRD pattern of W-ZnO (Figure 2E), the diffraction peaks at the 2θ of 23.0°, 23.45°, 24.2°, 26.5°, 28.3°,32.5°, 41.2° and 49.8° corresponded to the (002), (020), (200), (120), (112), (022), (222) and (232) crystal planes of WO3. In addition, the diffraction peaks at the 2θ of 31.5°, 34.2°, 36.1°, 47.7°, 56.8°, 63.1°, 66.2°, 68° and 69.1° corresponded to (100), (002), (101), (102), (110), (103), (200), (112) and (201) planes of ZnO, respectively. These results confirmed that W-ZnO was properly synthesized.
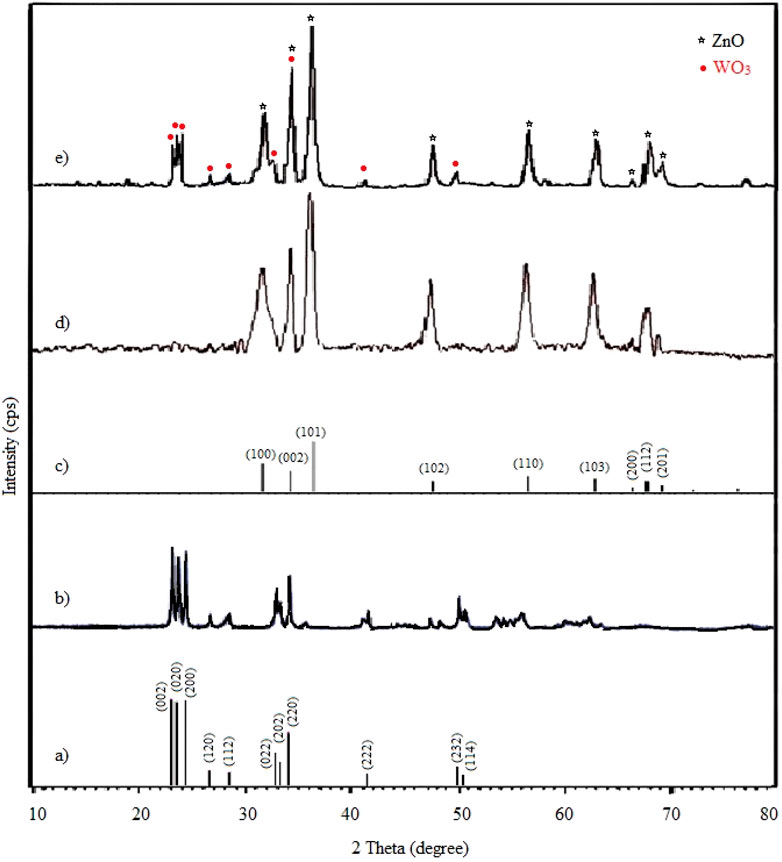
FIGURE 2. Wide-angle XRD pattern of (A) simulated standard WO3, (B) synthesized WO3, (C) simulated standard ZnO, (D) synthesized ZnO and (E) synthesized W-ZnO.
Size is an important factor to describe NPs, hereupon the DLS as a widely used technique for the determination of particle size in colloidal solution was used in this study. Figure 3 shows the particle size distribution graph for the ZnO, WO3 and W-ZnO NPs. According to the data obtained from the DLS analysis, the average size of synthesized NPs is 75, 91 and 183 for ZnO, WO3 and W-ZnO particles, respectively.
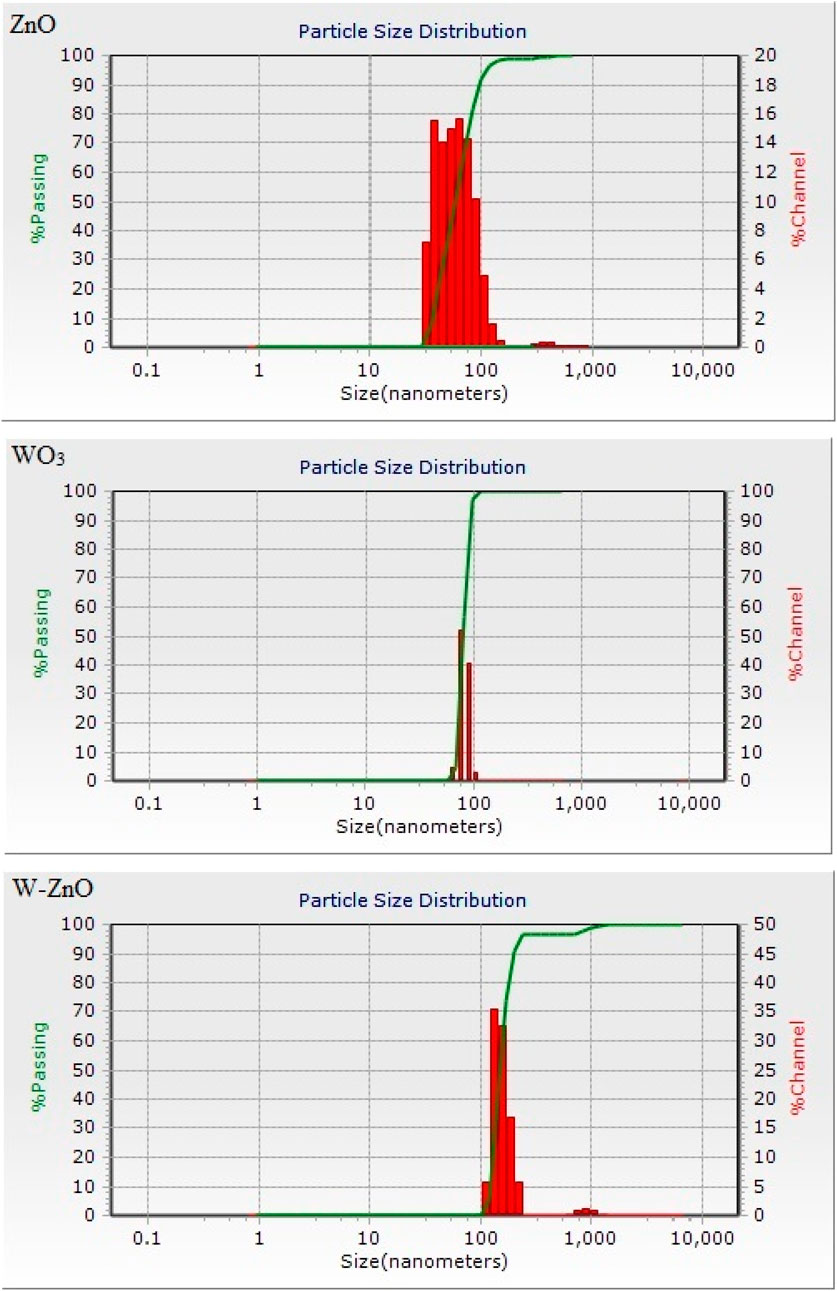
FIGURE 3. The size distribution charts of ZnO, WO3 and W-ZnO particles.
To evaluate the precise and dispersion of measurement values for DLS analysis result, we calculate the standard deviation (σ) of the particles. Standard deviation can be calculated using:
where
Unlike range and interquartile range, variance is a measure of dispersion that takes into account the spread of all data points in a data set. It’s the measure of dispersion the most often used, along with the standard deviation, which is simply the square root of the variance. The variance is mean squared difference between each data point and the centre of the distribution measured by the mean.
Scanning electron microscopy (SEM) was used as a powerful technique to describe the morphological characteristics of the synthesized structures (Figure 4). According to the SEM images, it can be concluded that the synthesized W-ZnO has almost a nanosheet framework. By consideration of this figure, it is clear that WO3 and ZnO particles have dimensions below 100 nm. It is well recognizable that adding WO3 to ZnO did not cause a noticeable change in the particle size and most of the W-ZnO particles have dimensions below 100 nm. In addition, there is approximately no agglomeration in synthesized structures.
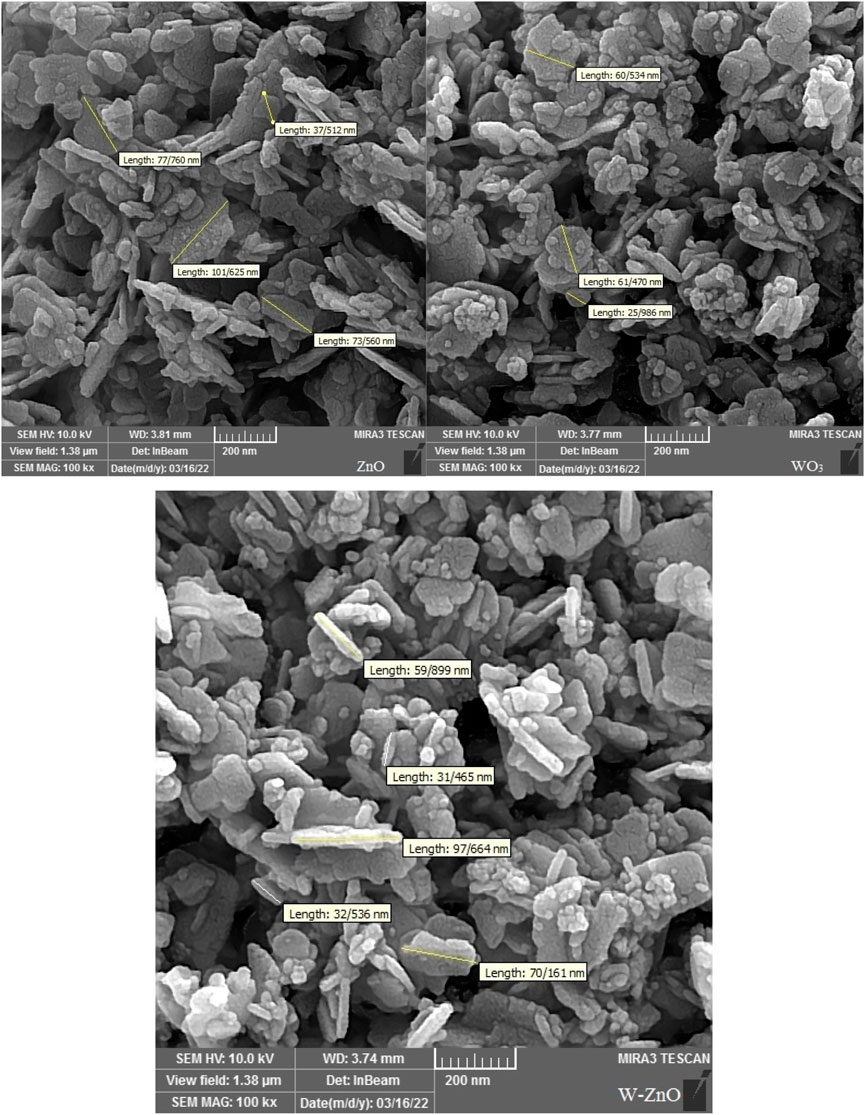
FIGURE 4. SEM images of ZnO, WO3 and W-ZnO.
For a more analytical investigation of the synthesized samples, the amount of absorption with the wavelength of 300–600 nm was observed by UV-Vis spectroscopy. As can be seen in Figure 5, the SPR band cantered 370 nm confirms the formation of ZnO NPs (Ghorbani et al., 2015). The excitonic feature of W-ZnO has also appeared at 370 nm. There is a lack of unanimous value for the excitonic point of WO3 in the literature (Baishya et al., 2018), However, Figure 5 shows adsorption at 335 nm for WO3 which can be consigned to the intrinsic band-gap absorption of WO3 (Ramar and Balasubramanian, 2018).
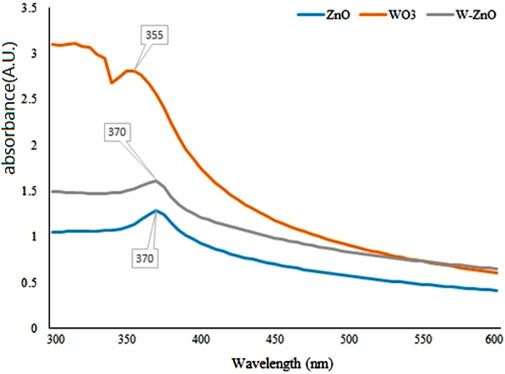
FIGURE 5. UV–Vis absorption spectra of ZnO, WO3 and W-ZnO.
In Figure 6, the colloidal absorption spectrum of ZnO, WO3 and W-ZnO NPs in water is plotted in the ultraviolet-visible region. With the help of the Tauc method, the optical energy band gap of NPs can be obtained. In this method, the following relation is used (Eq.3) (Arun et al., 2015).

FIGURE 6. Tauc plots of ZnO, WO3 and W-ZnO.
In Figure 6, the Tauc plot of colloidal ZnO, WO3 and W-ZnO NPs in water is plotted. With the help of the Tauc method, the optical energy band gap of NPs can be obtained. In this method, the following relation is used (Arun et al., 2015; Koushki et al., 2019).
where A is a constant value, h is Planck constant, ν is the photon frequency and α is the absorption value. The value on the left side of this equation is plotted against hν. By drawing a tangent line to the curve, a bang gap value would be achieved. As can be seen in the table 1 the band gap energy of 3.04 eV was obtained for ZnO NPs and, therefore, it can be considered as semiconductors with relatively high band gap energy, but other NPs have a smaller bandgap (Koushki, 2021), and their higher conductivity can be attributed to the presence of tungsten structures.
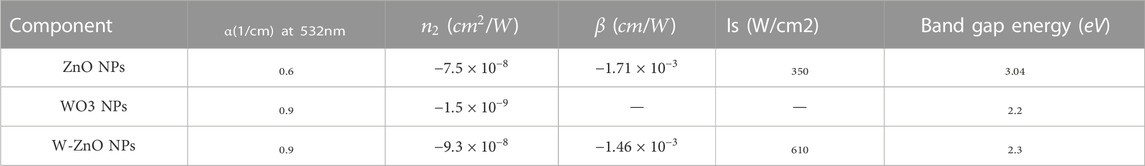
TABLE 1. Optical coefficients of synthesized NPs, measured using a CW Nd-Yag (green) laser.
5.2 The study of non-linear optical properties of synthesized NPs
The curves of the closed aperture Z-scan measurement of the NPs have been obtained and fitted with Eq. 6. No trustworthy non-linear signal was obtained in the WO3 nano colloid according to the measurements made with the Z-scan. For ZnO and W-ZnO NPs, we have the peak-valley distortion according to Figure 7, which indicates the non-linear refractive index

FIGURE 7. Curves of NPs in close aperture experiment.
Figure 8 shows open aperture curves for the synthesized NPs that are plotted with numerical curves (Eq. 7), and non-linear absorption coefficients (β) were reported in Table 1 which are negative, and indicate saturation in absorption (SA) is the origin of non-linear absorption. In SA, photons absorbed by NPs enhance the relative population of NPs in exited states and therefore, absorption of new photons experience a decrease, and transmitted power from the particles increases (Purohit, 2020). SA has many applications in the light modulation and laser mode locking. Saturation intensity can be approximately obtained by
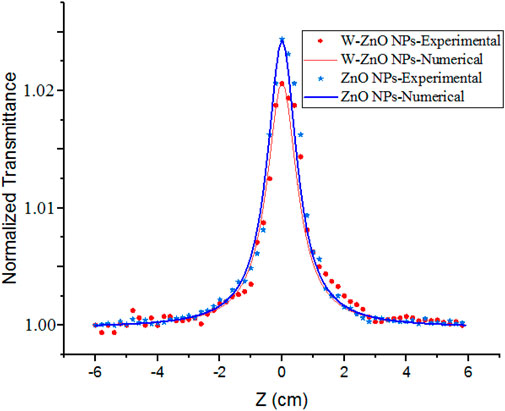
FIGURE 8. Open aperture curves of ZnO and ZnO-WO3NPs.
It should be considered that optical non-linearity of metal base nanocolloids and nanocomposites are highly sensitive on the environmental factors around the NPs, and one should not expect completely stable non-linear behavior with the change of these factors. Changes in beam intensity, wavelength, surface agents and dopants can all change the non-linear optical behavior of metal base nanocomposites. The effects of dopants on the change in size of NPs, lattice structure and energy gap and consequently the non-linear optical properties have been proven (Babeela et al., 2019). Also, the effects of surface agents on defect states and morphology can change the amount and even the mechanism type of non-linear response (Sabari Girisun et al., 2018; Monisha et al., 2020). Non-linear optical responses can be tunable and varies with change of beam wavelengths. For example, two photons absorption can be replaced with SA in different wavelengths (Sabari Girisun et al., 2018; Hegde et al., 2019). This response for metal NPs is not only a defect but they can be effective in tunable optical designs such as broadband ultrafast optical limiters.
6 Conclusion
In summary, the nanocomposite of zinc tungsten oxide (W-ZnO NPs) was synthesized and characterized using measurement methods such as XRD, DLS, SEM and UV-Vis. Also, the results were compared with pure synthesized ZnO and WO3 NPs. Non-linear optical properties of the synthesized composite were measured using the Z-scan technique with a continuous wave 5 mW Nd-Yag laser beam. A negative non-linear absorption coefficient of the components was obtained, and it shows that saturation absorption occurred in this composite. In comparison with pure ZnO NPs, non-linear absorption decreases that can be attributed to the negligible optical response of WO3 structures. Also, the negative value of the close aperture Z-scan curve shows that the thermal lensing effect is the main reason for the third-order non-linear refraction.
Data availability statement
The raw data supporting the conclusion of this article will be made available by the authors, without undue reservation.
Author contributions
All authors listed have made a substantial, direct, and intellectual contribution to the work and approved it for publication.
Funding
This research was supported by the Research Council of the University of Mazandaran and the hakim Sabzevari University, Iran.
Acknowledgments
The authors would like to thank the peer reviewers of this paper who improved it with their comments.
Conflict of interest
The authors declare that the research was conducted in the absence of any commercial or financial relationships that could be construed as a potential conflict of interest.
Publisher’s note
All claims expressed in this article are solely those of the authors and do not necessarily represent those of their affiliated organizations, or those of the publisher, the editors and the reviewers. Any product that may be evaluated in this article, or claim that may be made by its manufacturer, is not guaranteed or endorsed by the publisher.
References
Abbasi, F., Koushki, E., Majles Ara, M. H., and Sahraei, R. (2017). Optical dispersion, permittivity spectrum and thermal-lensing effect in nickel-doped zinc sulfide nanoparticles. J. Electron. Mater. 46, 6473–6479. doi:10.1007/s11664-017-5678-3
Akherat Doost, H., Majles Ara, M. H., Ghasedi, A., and Koushki, E. (2021). Effects of gold and silver nanoparticles on optical bistabilityof titanium dioxide nanocolloid. Phys. Solid State. 63, 318–323. doi:10.1134/S1063783421020062
Arshad, M., Ehtisham-ul-Haque, S., Bilal, M., Ahmad, N., Ahmad, A., Abbas, M., et al. (2020). A ghaffar and M iqbal, synthesis and characterization of Zn doped WO3 nanoparticles: Photocatalytic, antifungal and antibacterial activities evaluation. Mater. Res. Express. 7, 015407. doi:10.1088/2053-1591/ab6380
Arun, K. J., Batra, A. K., Krishna, A., Bhat, K., Aggarwal, M. D., and Joseph Francis, P. J. (2015). Surfactant free hydrothermal synthesis of copper oxide nanoparticles. Am. J. Mater. Sci. 5 (3A), 36–38. doi:10.5923/s.materials.201502.06
Ashfaq, M. H., Shahid, S., Javed, M., Iqbal, S., Hakami, O., Aljazzar, S. O., et al. (2022). Controlled growth of TiO2/Zeolite nanocomposites for simultaneous removal of ammonium and phosphate ions to prevent eutrophication. Front. Mater. 9, 1007485. doi:10.3389/fmats.2022.1007485
Babeela, C., Narendran, N. K. S., Pannipara, M., Al-Sehemi, A. G., and Sabari Girison, T. C. (2019). Excited state absorption assisted optical limiting action of Fe decorated γ-BBO nanorods. Mater. Chem. Phys. 237, 121827. doi:10.1016/j.matchemphys.2019.121827
Baedi, J., Ghasedi, A., Koushki, E., and Akrami, B. (2021). Nonlinear response of sodium and potassium doped ZnO along with improvement in bandgap structure: A combined physicochemical study. Phys. B Condens. Matter 620, 413279. doi:10.1016/j.physb.2021.413279
Baishya, K., Ray, J. S., Dutta, P., and Das, S. K. (2018). Graphene-mediated band gap engineering of WO3 nanoparticle and a relook at Tauc equation for band gap evaluation. Appl. Phys. A 124 (10), 704–706. doi:10.1007/s00339-018-2097-0
Cao, J., Wang, Y., Ma, T., Liu, Y., and Yuan, Z. (2011). Synthesis of porous hematite nanorods loaded with CuO nanocrystals as catalysts for CO oxidation. J. Nat. Gas. Chem. 20 (6), 669–676. doi:10.1016/S1003-9953(10)60238-1
Chen, R., Jalili, Z., and Tayebee, R. (2021). UV-visible light-induced photochemical synthesis of benzimidazoles by coomassie brilliant blue coated on W–ZnO@NH2 nanoparticles. RSC Adv. 11 (27), 16359–16375. doi:10.1039/D0RA10843J
Gao, P. X., Ding, Y., Mai, W., Hughes, W. L., Lao, C. S., and Wang, Z. L. (2005). Conversion of zinc oxide nanobelts into superlattice-structured nanohelices. Science 309, 1700–1704. doi:10.1126/science.1116495
Ghorbani, H. R., Parsa Mehr, F., Pazoki, H., and Mosavar Rahmani, B. (2015). Synthesis of ZnO nanoparticles by precipitation method. Orient. J. Chem. 31 (2), 1219–1221. doi:10.13005/ojc/310281
Hariharan, V., Gnanavel, B., Sathiyapriya, R., and Aroulmoji, V. (2019). A review on tungsten oxide (WO3) and their derivatives for sensor applications. Int. J. Adv. Sci. Eng. 5 (4), 1163–1168. doi:10.29294/IJASE.5.4.2019.1163-1168
Hassani, H., Marzbanrad, E., Zamani, C., and Raissi, B. (2011). Effect of hydrothermal duration on synthesis of WO3 nanorods. J. Mater. Sci. Mater. Electron. 22 (9), 1264–1268. doi:10.1007/s10854-011-0297-x
Hegde, T. A., Dutta, A., Sabari Girisun, T. C., Abith, M., and Vinitha, G. (2019). Intensity tunable optical limiting behavior of an organometallic cesium hydrogen tartrate single crystal. J. Mater. Sci. Mater. Electron. 30, 18885–18896. doi:10.1007/s10854-019-02245-5
Koushki, E., Baedi, J., and Tasbandi, A. (2019). Sodium doping effect on optical permittivity, band gap structure, nonlinearity and piezoelectric properties of PZT nano-colloids and nanostructures. J. Electron Mater 48 (2), 1066–1073. doi:10.1007/s11664-018-6834-0
Koushki, E. (2021). Effect of conjugation with organic molecules on the surface plasmon resonance of gold nanoparticles and application in optical biosensing. RSC Adv. 11 (38), 23390–23399. doi:10.1039/D1RA01842F
Koushki, E., Farzaneh, A., and Majles Ara, M. H. (2014a). Modeling absorption spectrum and saturation intensity of ZnO nano-colloid. Optik 125, 220–223. doi:10.1016/j.ijleo.2013.06.007
Koushki, E., Majles Ara, M. H., and Akherat Doost, H. (2014b). Z-scan technique for saturable absorption using diffraction method in γ-alumina nanoparticles. Appl. Phys. B 115 (2), 279–284. doi:10.1007/s00340-013-5602-3
Koushki, E., and Majles Ara, M. H. (2011). Comparison of the Gaussian-decomposition and the Fresnel–Kirchhoff diffraction methods in circular and elliptic Gaussian beams. Opt. Commun. 284, 5488–5494. doi:10.1016/j.optcom.2011.08.028
Koushki, E., and Majles Ara, M. H. (2014). Modeling electrical and optical spectral responses of homogeneous nanocomposites. Phys. E Amst. Neth.) 61, 111–117. doi:10.1016/j.physe.2014.03.021
Liu, H., Li, M., Wei, Y., Liu, Z., Hu, Y., and Ma, H. (2014). A facile surfactant-free synthesis of flower-like ZnO hierarchical structure at room temperature. Mater. Lett. 137, 300–303. doi:10.1016/j.matlet.2014.09.023
Maduraiveeran, G., Sasidharan, M., and Jin, W. (2019). Earth-abundant transition metal and metal oxide nanomaterials: Synthesis and electrochemical applications. Prog. Mater. Sci. 106, 100574. doi:10.1016/j.pmatsci.2019.100574
Monisha, M., Priyadarshani, N., Durairaj, M., and Sabari Girisun, T. C. (2020). 2PA induced optical limiting behaviour of metal (Ni, Cu, Zn) niobate decorated reduced graphene oxide. Opt. Mater. 101, 109775. doi:10.1016/j.optmat.2020.109775
Nakahara, K., Takasu, H., Fons, P., Yamada, A., Matsubara, K., Hunger, R., et al. (2001). Interactions between gallium and nitrogen dopants in ZnO films grown by radical-source molecular-beam epitaxy. Appl. Phys. Lett. 79, 4139–4141. doi:10.1063/1.1424066
Naseem, T., and Durrani, T. (2021). The role of some important metal oxide nanoparticles for wastewater and antibacterial applications: A review. Environ. Chem. Ecotoxicol. 3, 59–75. doi:10.1016/j.enceco.2020.12.001
Ramar, V., and Balasubramanian, K. (2018). Charge transfer induced tunable bandgap and enhanced saturable absorption behavior in rGO/WO3 composites. Appl. Phys. A 124 (11), 779–811. doi:10.1007/s00339-018-2191-3
Sabari Girisun, T. C., Saravanan, M., and Venugopal Rao, S. (2018). Enhanced broadband optical limiting and switching of nonlinear absorption in functionalized solar exfoliated reduced graphene oxide–Ag-Fe2O3 nanocomposites. J. Appl. Phys. 124, 193101. doi:10.1063/1.5050478
Sharma, D., Gaur, P., Pal Malik, B., Singh, N., and Gaur, A. (2012). Intensity dependent nonlinear absorption in direct and indirect band gap crystals under nano and picosecond Z-scan. Opt. Photonics J. 2 (2), 98–104. doi:10.4236/opj.2012.22013
Sheik-Bahae, M., Said, A. A., Wei, T. H., Hagan, D. J., and Van Stryland, E. W. (1990). Sensitive measurement of optical nonlinearities using a single beam. IEEE J. Quantum Electron. 26 (4), 760–769. doi:10.1109/3.53394
Silva, N., Ramírez, S., Díaz, I., Garcia, A., and Hassan, N. (2019). Easy, quick, and reproducible sonochemical synthesis of CuO nanoparticles. Materials 12 (5), 804. doi:10.3390/ma12050804
Srivastava, V., Gusain, D., Sharma, Y. C., Hao, Y., Liu, X., Li, M., et al. (2013). Simple preparation of WO3–ZnO composites with UV–Vis photocatalytic activity and energy storage ability. Ceram. Int. 40, 12519–12524. doi:10.1016/j.ceramint.2014.04.106
Suzaki, Y., and Tachibana, A. (1975). Measurement of the μm sized radius of Gaussian laser beam using the scanning knife-edge. Appl. Opt. 14, 2809–2810. doi:10.1364/AO.14.002809
Tsigaridas, G., Fakis, M., Polyzos, I., Persephonis, P., and Giannetas, V. (2003). Z-scan analysis for high order nonlinearities through Gaussian decomposition. Opt. Commun. 225, 253–268. doi:10.1016/j.optcom.2003.08.025
Velmurugan, R., and Incharoensakdi, A. (2018). Nanoparticles and organic matter. Nanoparticles Org. Matter 1, 407–428. doi:10.1016/B978-0-12-811487-2.00018-9
Keywords: zinc tungsten oxide, Z-scan measurement, saturation absorption, thermal lensing, third order non-linear optical
Citation: Jalili Z, Koushki E, Ehsanian AH, Tayebee R and Maleki B (2023) Synthesis, band gap structure and third order non-linear optical properties of zinc tungsten oxide nanocomposite using a single CW laser beam. Front. Chem. 11:1152501. doi: 10.3389/fchem.2023.1152501
Received: 27 January 2023; Accepted: 03 April 2023;
Published: 14 April 2023.
Edited by:
Ziying Wang, Hebei University of Technology, ChinaReviewed by:
Shailajha Sathiyaseelan, Manonmaniam Sundaranar University, IndiaSabari Girisun T. C., Bharathidasan University, India
Copyright © 2023 Jalili, Koushki, Ehsanian, Tayebee and Maleki. This is an open-access article distributed under the terms of the Creative Commons Attribution License (CC BY). The use, distribution or reproduction in other forums is permitted, provided the original author(s) and the copyright owner(s) are credited and that the original publication in this journal is cited, in accordance with accepted academic practice. No use, distribution or reproduction is permitted which does not comply with these terms.
*Correspondence: Ehsan Koushki, ehsan.koushki@yahoo.com, ehsan.koushki@hsu.ac.ir; Behrooz Maleki, malekibehrooz@gmail.com, b.maleki@umz.ac.ir