Cyclohexanone and Phenolic Acid Derivatives from Endophytic Fungus Diaporthe foeniculina
 Xiuxiang Lu1,2
  Haibo Tan
- 1Key Laboratory of Plant Resources Conservation and Sustainable Utilization, Guangdong Provincial Key Laboratory of Applied Botany, South China Botanical Garden, Chinese Academy of Sciences, Guangzhou, China
- 2University of Chinese Academy of Sciences, Beijing, China
- 3National Engineering Research Center of Navel Orange, Gannan Normal University, Ganzhou, China
- 4Key Laboratory of Chemistry and Engineering of Forest Products, Guangxi University for Nationalities, Nanning, China
Chemical investigation of an endophytic fungus Diaporthe foeniculina SCBG-15, led to the isolation of eight new cyclohexanone derivatives, foeniculins A–H (1–8) and three new phenolic acid derivatives, foeniculins I–K (9–11). Their structures were extensively established on the basis of 1H and 13C NMR spectra together with COSY, HSQC, HMBC, and NOESY experiments. The absolute configurations were confirmed by quantum chemical ECD calculations and single-crystal X-ray diffractions. Moreover, the in vitro cytotoxic and antibacterial activities of isolated compounds 1–11 were also evaluated.
Introduction
Leptospermum brachyandrum belongs to the genus Leptospermum, it is an important member in the plant family Myrtaceae (Beardsell et al., 1993; Brophy et al., 1999). It mainly occurred in Australia and had been introduced into China a few decades ago. Nowadays, this plant is widely planted in the southern of China due to its ornamental and medicinal properties. Our previous phytochemical works proved that the chemical constitutes of L. brachyandrum were ploymethylated meroterpenoid and phloroglucinol derivatives (Zou et al., 2018). In recent years, our group focused on bioactive meaningful natural products from the plants and endophytic fungi towards the pharmaceutical drug discovery (Liu et al., 2016a; Liu et al., 2016b; Liu et al., 2016c; Xiang et al., 2017; Liu et al., 2018). As a part of our ongoing research effort to discover biologically active and structurally unique natural products (Liu et al., 2016d; Liu et al., 2016e; Li et al., 2017), the Diaporthe foeniculinaan SCBG-15, an endophytic strain derived from L. brachyandrum, which displayed a variety of secondary metabolisms with potentially structural diversity during the HPLC and TLC analyses, was selected as the target for the further chemical investigation.
In the latest years, plenty of new privileged natural compounds with highly structural diversities were isolated from the genus Diaporthe, and which exhibited significant biological activities (Zhu et al., 2010; Zang et al., 2012; Li et al., 2015; Mandavid et al., 2015; Cui et al., 2017; Cui et al., 2018; Luo et al., 2018; Gao et al., 2020). In this study, an extensively chemical constituent research on EtOAc extract of the fungus SCBG-15 using sequential column chromatography over silica gel, RP-C18 silica, and Sephadex LH-20 along with preparative and semipreparative HPLC resulted in the discovery of eight new cyclohexanone derivatives, foeniculins A–H (1–8), and three phenolic acid derivatives, foeniculins I–K (9–11). All of the novel compounds 1–11 possessed polymethylated skeleton (Figure 1). Herein, the details of isolation, structural elucidation by NMR spectral interpretation, single-crystal X-ray diffraction, and biological evaluation of these isolates are described.
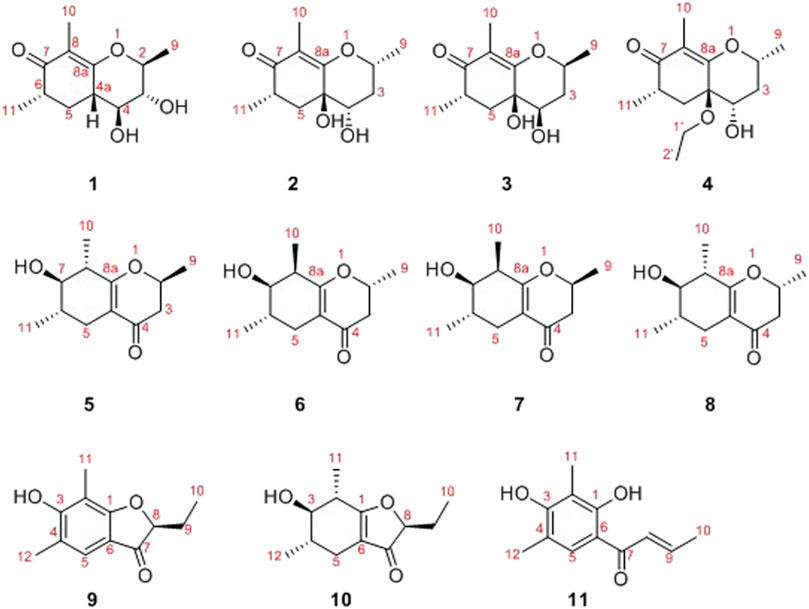
FIGURE1. Structures of compounds 1–11.
Materials and Methods
General Experimental Procedures
Optical rotations were recorded using an Anton Paar MCP-500 spectropolarimeter (Anton Paar, Graz, Austria). UV spectra were obtained by a Shimadzu UV-2600 spectrophotometer (Shimadzu, Kyoto, Japan). ECD spectra were measured with an Applied Photophysis Chirascan. IR data were measured on a Shimadzu IR Affinity-1 spectrometer (Shimadzu, Kyoto, Japan). 1D and 2D NMR spectra were collected on a Bruker Avance-500 spectrometer with TMS as an internal standard (Bruker, Fällanden, Switzerland). HRESIMS spectra were acquired with a Thermo MAT95XP high resolution mass spectrometer (Thermo Fisher Scientific, Bremen, Germany). Silica gel (200–300 mesh, Qingdao Marine Chemical Inc. Qingdao, China) was used for column chromatography. TLC analysis was carried out on silica gel plate (Merck KGaA, Darmstadt, Germany). A Hitachi Primaide [Hitachi Instruments (Dalian) Co., Ltd.] equipped with a diode array detector (DAD) using a semi-preparative YMC ODS C18 column (20 × 250 mm, 5 μm) was used for semi-preparative HPLC separation. All solvents were analytical grade (Guangzhou Chemical Regents Company, Ltd. Guangzhou, China).
Fungal Material
The endophytic fungal strain D. foeniculina SCBG-15 was isolated from the plant of L. brachyandrum, which was collected at South China Botanical Garden (SCBG), Chinese Academy of Sciences, China, in September 2016. The strain was identified by sequence analysis of rDNA ITS (internal transcribed spacer) region. The sequence of the ITS region of the D. foeniculina has been submitted to GenBank (Accession No. MN788609). The strain is preserved at the Laboratory of Natural Product Medicinal Chemistry, SCBG.
Extraction and Isolation
The fungus D. foeniculina was fermented on an autoclaved rice solid medium (15 × 3 L Erlenmeyer flasks, each containing 300 g of grains and 360 ml of distilled water) for 30 days at 28°C. After cultivation, the mycelia and rice solid medium were extracted with EtOAc for three times, and the crude extract (50 g) was obtained. The crude extract was subjected to silica gel using gradient elution with petroleum ether-EtOAc as eluent (v/v, 100:1→50:50) and CH2Cl2-MeOH (v/v, 5:1→2:1). Then, they were combined by TLC analysis to afford six main fractions (Fr.1-Fr.6).
Fr.5 (7.22 g) was applied to column chromatography over RP-C18 silica gel, eluting with MeOH-H2O (v/v, 2:5→1:0) to give six subfractions (Fr.5-1 to Fr.5-6). Fr.5-2 (1.94 g) was separated by Sephadex LH-20 column chromatography and eluted with CHCl3-MeOH (v/v, 1:1) to afford six subfractions (Fr.5-2-1 to Fr.5-2-6). Fr.5-2-2 (1.23 g) was isolated by column chromatography on silica gel and eluted with n-hexane-EtOAc gradient (v/v, 4:1→1:5) to obtain six subfractions (Fr.5-2-2-1 to Fr.5-2-2-6). Fr.5-2-2-5 (127.4 mg) was further purified by the semi-preparative HPLC system with CH3CN-H2O (10:90) as eluent to afford compounds 1 (3.0 mg, tR = 35.0 min), 2 (4.4 mg, tR = 15.7 min), and 3 (2.0 mg, tR = 21.6 min). Fr.5-2-1 (311.4 mg) was isolated by column chromatography on silica gel and eluted with n-hexane-EtOAc gradient (v/v, 5:1→1:5) to get three subfractions (Fr.5-2-1-1 to Fr.5-2-1-3). Fr.5-2-1-1 (208.8 mg) was subjected to semi-preparative HPLC with CH3CN-H2O (v/v, 50:50) to give seven subfractions (Fr.5-2-1-1-1 to Fr.5-2-1-1-7). Fr.5-2-1-1-6 (28.3 mg) was purified by semi-preparative HPLC and washed with CH3CN-H2O (v/v, 35:65) to afford compound 4 (3.0 mg, tR = 20.5 min). Fr.5-2-1-1-1 (23.1 mg) was purified by semi-preparative HPLC equipped with a chiral column and washed with isopropanol-hexane (30:70) to afford compounds 5 (1.0 mg, tR = 19.8 min), 6 (1.0 mg, tR = 18.5 min), 7 (0.8 mg, tR = 22.8 min), and 8 (1.3 mg, tR = 28.0 min). Fr.5-2-1-1-2 (40.2 mg) was purified by semi-preparative HPLC and washed with MeOH-H2O (v/v, 75:25) to afford compound 10 (3.0 mg, tR = 20.5 min).
Fr.4 (2.26 g) was isolated by column chromatography on silica gel and eluted with n-hexane-EtOAc gradient (v/v, 30:1→1:1) to get four subfractions (Fr.4-1 to Fr.4-4). Fr.4-2 (197.1 mg) was separated by Sephadex LH-20 column chromatography and eluted with CHCl3-MeOH (v/v, 1:1) to afford four subfractions (Fr.4-2-1 to Fr.4-2-4). Fr.4-2-4 (13.8 mg) was further purified by the semi-preparative HPLC system and eluted with MeOH-H2O (70:30) to give compound 9 (3.2 mg, tR = 19.4 min).
Fr.6 (19.0 g) was separated into four subfractions (Fr.6-1 to Fr.6-4) on ODS column chromatography with MeOH-H2O (v/v, 3:10→4:1). Fr.6-1 (2.79 g) was loaded onto Sephadex LH-20 column chromatography and eluted with CHCl3-MeOH (v/v, 1:1) to give four subfractions (Fr.6-1-1 to Fr.6-1-4). Fr.6-1-2 (643.0 mg) was isolated by column chromatography on silica gel and eluted with CH2Cl2-MeOH (v/v, 50:1→1:5) to get seven subfractions (Fr.6-1-2-1 to Fr.6-1-2-7). Fr.6-1-2-4 (311.0 mg) was separated by semi-preparative HPLC with CH3CN-H2O (v/v, 10:90) and then repeatedly purified by semi-preparative HPLC with CH3CN-H2O (v/v, 2: 98) to afford compound 11 (5.4 mg, tR = 8.7 min).
Foeniculin A (1): colorless needle crystals (α)20D–12.4 (c 0.1, MeOH); UV (MeOH): λmax (log ε): 259 (2.77), 202 (2.41) nm; IR (KBr): 3,381, 2,996, 2,905, 2,837, 1,616, 1,559, 1,456, 1,385, 1,308, 1,229, 1,206, 1,098, 1,024, 695, 758, 733, 667, 596, 556 cm−1; HRESIMS: m/z 227.1274 (M + H)+ (calcd for C12H19O4, 227.1278). 1H (500 MHz) and 13C (125 MHz) NMR data, see Tables 1 and 2.
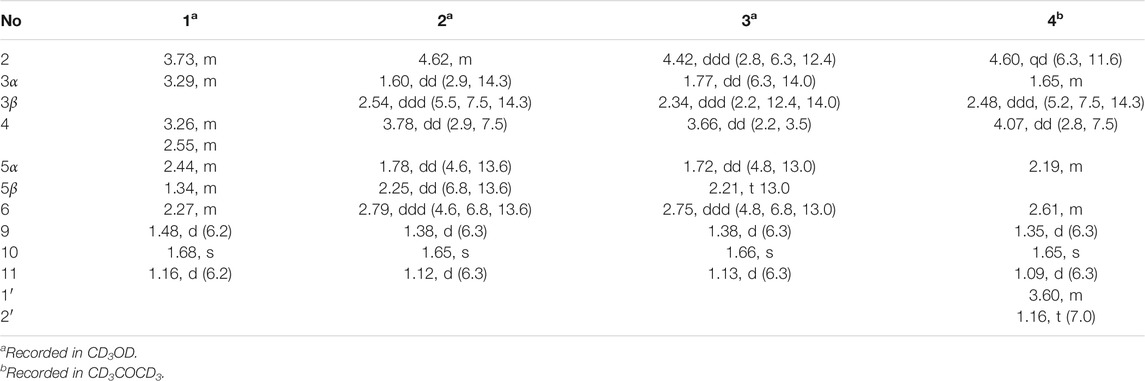
TABLE 1. 1H (500 MHz) NMR data for compounds 1–4 (δ in ppm, J in Hz).
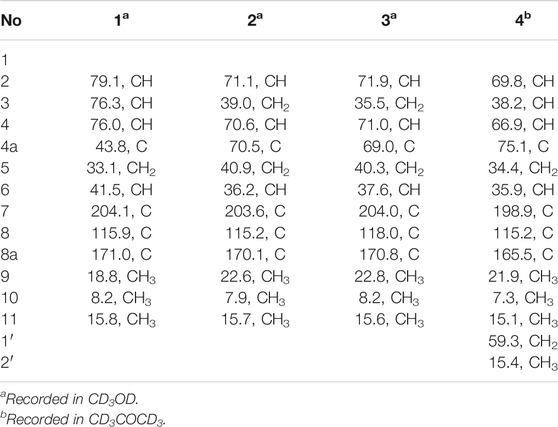
TABLE 2. 13C (125 MHz) NMR data for compounds 1–4 (δC in ppm).
Foeniculin B (2): colorless needle crystals; m. p. 120–121°C (α)20D + 8.2 (c 0.1, MeOH); UV (MeOH): λmax (log ε): 267 (3.28) nm; IR (KBr): 3,370, 2,976, 2,932, 2,884, 1,717, 1,614, 1,381, 1,337, 1,242, 1,217, 1,146, 1,105, 1,026, 978, 874, 773, 739, 689, 667, 596 cm−1; HRESIMS: m/z 227.1275 (M + H)+ (calcd for C12H19O4, 227.1278). 1H (500 MHz) and 13C (125 MHz) NMR data, see Tables 1 and 2.
Foeniculin C (3): white solid (α)20D–33.4 (c 0.1, MeOH); UV (MeOH): λmax (log ε): 263 (3.10) nm; IR (KBr): 3,377, 2,974, 2,926, 1,616, 1,456, 1,386, 1,333, 1,289, 1,252, 1,209, 1,141, 1,103, 1,068, 1,011, 976, 914, 883, 760, 692 cm−1; HRESIMS: m/z 227.1276 (M + H)+ (calcd for C12H19O4, 227.1278). 1H (500 MHz) and 13C (125 MHz) NMR data, see Tables 1 and 2.
Foeniculin D (4): white solid (α)20D + 11.6 (c 0.05, MeOH); UV (MeOH): λmax (log ε): 269 (2.54) nm; IR (KBr): 3,329, 2,947, 2,835, 1,651, 1,456, 1,410, 1,115, 1,017, 667, 608, 546 cm−1; HRESIMS: m/z 255.1598 (M + H)+ (calcd for C14H23O4, 255.1591). 1H (500 MHz) and 13C (125 MHz) NMR data, see Tables 1 and 2.
Foeniculin E (5): colorless needle crystals (α)20D–11.6 (c 0.03, MeOH); UV (MeOH): λmax (log ε): 275 (2.98) nm; IR (KBr): 3,356, 1,653, 1,616, 667, 600, 552 cm−1; HRESIMS: m/z 211.1329 (M + H)+ (calcd for C12H19O3, 211.1329). 1H (500 MHz) and 13C (125 MHz) NMR data, see Tables 3 and 4.
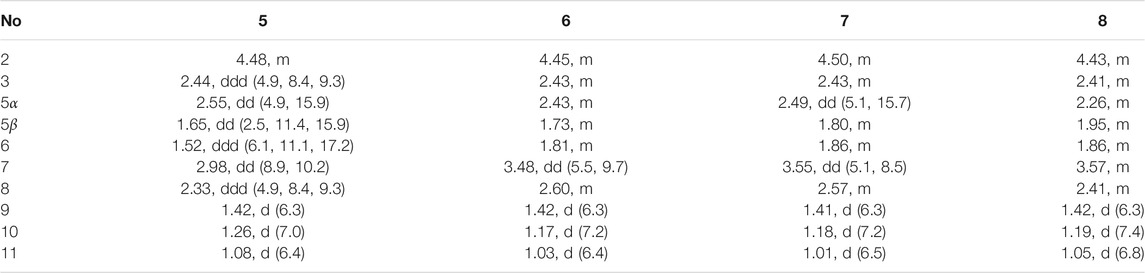
TABLE 3. 1H NMR (500 MHz) data for compounds 5–8 in CD3OD (δ in ppm, J in Hz).a
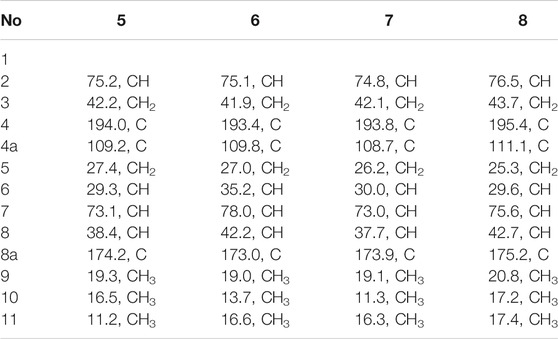
TABLE 4. 13C (125 MHz) NMR data for compounds 5–8 in CD3OD (δ in ppm).
Foeniculin F (6): white solid (α)20D + 12.0 (c 0.05, MeOH); UV (MeOH); λmax (log ε): 268 (3.34), 202 (2.23) nm; HRESIMS: m/z 233.1146 (M + Na)+ (calcd for C12H18NaO3, 233.1148). 1H (500 MHz) and 13C (125 MHz) NMR data, see Tables 3 and 4.
Foeniculin G (7): white solid (α)20D–13.7 (c 0.05, MeOH); UV (MeOH): λmax (log ε): 275 (3.08) nm; IR (KBr): 3,337, 1,636, 669, 600, 554 cm−1; HRESIMS: m/z 211.1339 (M + H)+ (calcd for C12H19O3, 211.1329). 1H (500 MHz) and 13C (125 MHz) NMR data, see Tables 3 and 4.
Foeniculin H (8): white solid (α)20D + 10.8 (c 0.1, MeOH); UV (MeOH): λmax (log ε): 274 (3.23) nm; IR (KBr): 3,360, 1,636, 667, 600, 557 cm−1; HRESIMS: m/z 211.1339 (M + H)+ (calcd for C12H19O3, 211.1329). 1H (500 MHz) and 13C (125 MHz) NMR data, see Tables 3 and 4.
Foeniculin I (9): colorless needle crystals; m. p. 108–109°C; UV (MeOH): λmax (log ε): 328 (3.02), 279 (3.33), 217 (3.47) nm; IR (KBr): 3,379, 2,976, 2,922, 2,851, 1,676, 1,608, 1,458, 1,329, 1,292, 1,220, 1,151, 1,092, 1,024, 947, 768 cm−1; HRESIMS: m/z 207.1013 (M + H)+ (calcd for C12H15O3, 207.1016). 1H (500 MHz) and 13C (125 MHz) NMR data, see Table 5.

TABLE 5. 1H (500 MHz) and13C (125 MHz) NMR data (δ in ppm, J in Hz) of 9–11.
Foeniculin J (10): colorless oil (α)20D–11.4 (c 0.05, MeOH); UV (MeOH): λmax (log ε): 270 (2.80) nm; IR (KBr): 3,312, 2,976, 2,930, 2,899, 1,717, 1,668, 1,607, 1,456, 1,400, 1,344, 1,271, 1,246, 1,180, 1,130, 1,032, 945, 856, 764, 669 cm−1; HRESIMS: m/z 211.1333 (M + H)+ (calcd for C12H19O3, 211.1329). 1H (500 MHz) and 13C (125 MHz) NMR data, see Table 5.
Foeniculin K (11): green needle crystals; UV (MeOH): λmax (log ε): 305 (3.00) nm; IR (KBr): 3,358, 2,974, 2,920, 1,649, 1,626, 1,560, 1,479, 1,445, 1,362, 1,305, 1,290, 1,169, 1,113, 1,028, 953, 829 cm−1; HRESIMS: m/z 207.1025 (M + H)+ (calcd for C12H15O3, 207.1016). 1H (500 MHz) and 13C (125 MHz) NMR data, see Table 5.
X-Ray Crystallographic Analysis
The single-crystal X-ray diffraction data were collected at 100 K for 1, 2, 5, and 9 on Agilent Xcalibur Nova single-crystal diffractometer using CuKα radiation. Crystallographic data for 1, 2, 5, and 9 reported in this paper have been deposited in the Cambridge Crystallographic Data Centre. (Deposition number: CCDC 2008519 for 1, 2008520 for 2, 2047671 for 5, and 2047672 for 9). Copies of these data can be obtained free of charge via www.ccdc.cam.au.ck/conts/retrieving.html.)
Cytotoxicity Assay
The in vitro cytotoxic activities of compounds 1–11 were assayed against three human tumor cell lines SF-268, MCF-7, HePG-2, and normal cell line LX-2 with adriamycin as positive control. Assays were performed by the SRB method (Mosmann, 1983).
Antimicrobial Assay
Compounds 1–11 were evaluated the antimicrobial activity against Staphylococcus aureus (CMCC 26003) and Escherichia coli (ATCC 8739). Assays were performed by the published microdilution method for the estimation of minimum inhibitory concentration (MIC) values (Li et al., 2017). Vancomycin was used as positive control.
Results and Discussion
Compound 1 was isolated as needle crystals. Its molecular formula of C12H18O4 was established on the basis of (+)-HRESIMS m/z 227.1274 (M + H)+ (calcd for C12H19O4, 227.1278), implying four degrees of hydrogen deficiency. The IR spectrum of 1 logically revealed the presence of carbonyl and free hydroxyl functional groups through the characteristic resonance absorptions at 1,616 and 3,381 cm−1, respectively. The 1H NMR data (Table 1) of 1 exhibited a series of typical proton signals, which were responsive for three oxygenated methines [δH 3.73 (1H, m, H-2), 3.29 (1H, m, H-3), 3.26 (1H, m, H-4)] and three methyl moieties [δH 1.48 (3H, d, J = 6.2 Hz, H-9), 1.68 (3H, s, H-11), 1.16 (3H, d, J = 6.3 Hz, H-10)]. The 13C NMR data (Table 2) combined with HSQC spectrum of 1 resolved 12 carbon resonances attributable to three methyls, one methylene, four methines, and four quaternary carbons including one carbonyl functionality (δC 204.1).
In the 1H-1H COSY spectrum (Figure 2), the cross peaks of H3-11/H-6/H2-5 suggested the presence of fragment a (C-11/C-6/C-5). The HMBC correlations from H3-10 to C-5 (δC 33.1), C-6 (δC 41.5), and C-7 (δC 204.1), H-11 to C-7, C-8 (δC 115.9), and C-8a (δC 171.0), H2-5 to C-7 and C-8a coupled with the fragment a were significantly suggested the existence of a cyclohexanone ring (ring A) with a carbonyl group located at C-7 position as well as two methyls attached at C-6 and C-8 positions, respectively. In addition, the obvious HMBC correlations from H-2 to C-4 (δC 76.0) and C-8a, H-9 to C-2 (δC 79.1) and C-3 (δC 76.3) together with the 1H-1H COSY spin system b (C-4a/C-4/C-3/C-2/C-9) confirmed the presence of the pyran ring B. Therefore, the planar structure of 1 was established as shown in Figure 1.
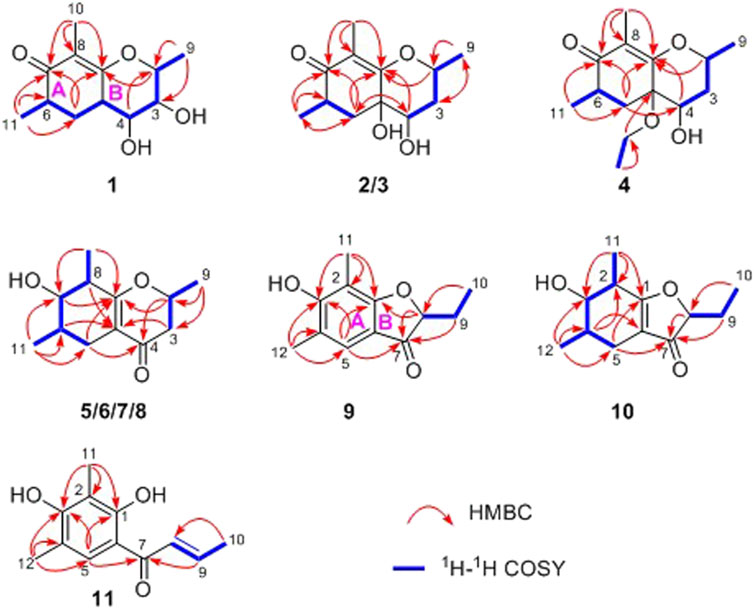
FIGURE 2. Key 1H-1H COSY and HMBC correlations of compounds 1–11.
As shown in Figure 3, key NOE correlations of H-2/H-4, H-4/H-4a, H-4a/H3-11 confirmed these protons were co-facial, and assigned as α-oriented. Then, the NOE correlation between H-5 and H3-9 indicated that the methyl group at C-9 was β-oriented (Figure 3). Therefore, the relative configuration of 1 was established. The absolute configuration of 1 was finally determined by the single-crystal X-ray diffraction experiment (Figure 4), and it provided the perfect evidence for the absolute configuration of 1 with a Flack parameter of 0.02 (5). Moreover, this conclusion was also verified by the ECD calculations (Figure 5). Therefore, the structure elucidation of compound 1 was completely finished, and its absolute structure was deduced to be 2S,3R,4S,4aS,6S and trivially named as foeniculin A.
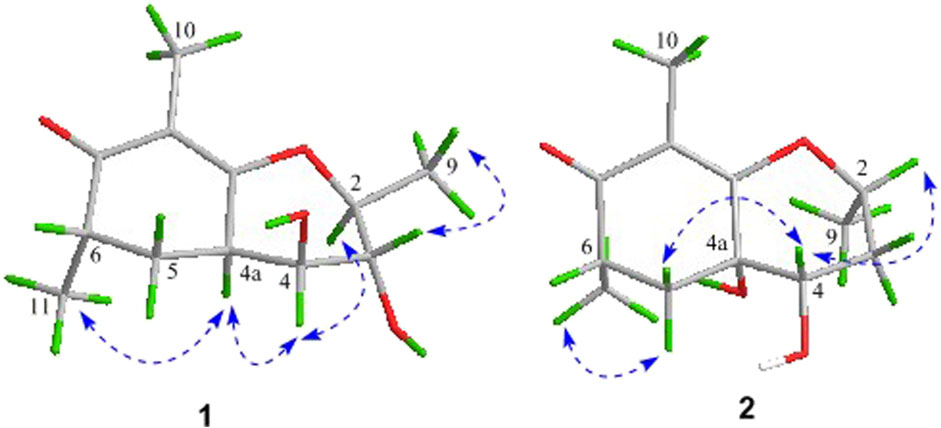
FIGURE 3. Key NOESY correlations of compounds 1 and 2.
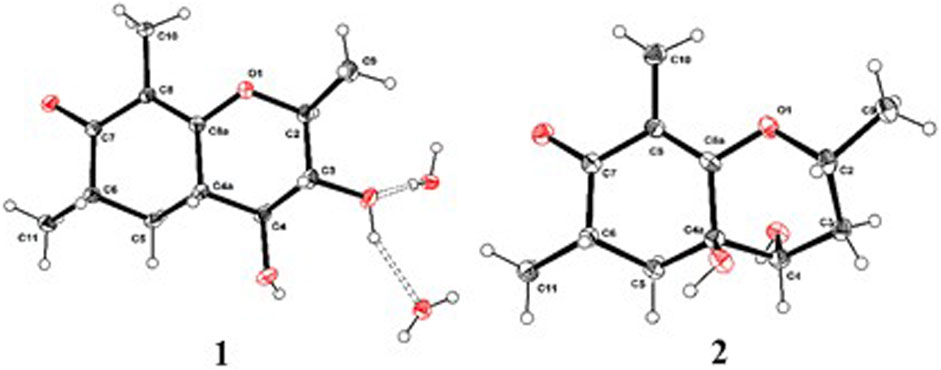
FIGURE 4. ORTEP drawings of the X-ray structures for compounds 1 and 2.
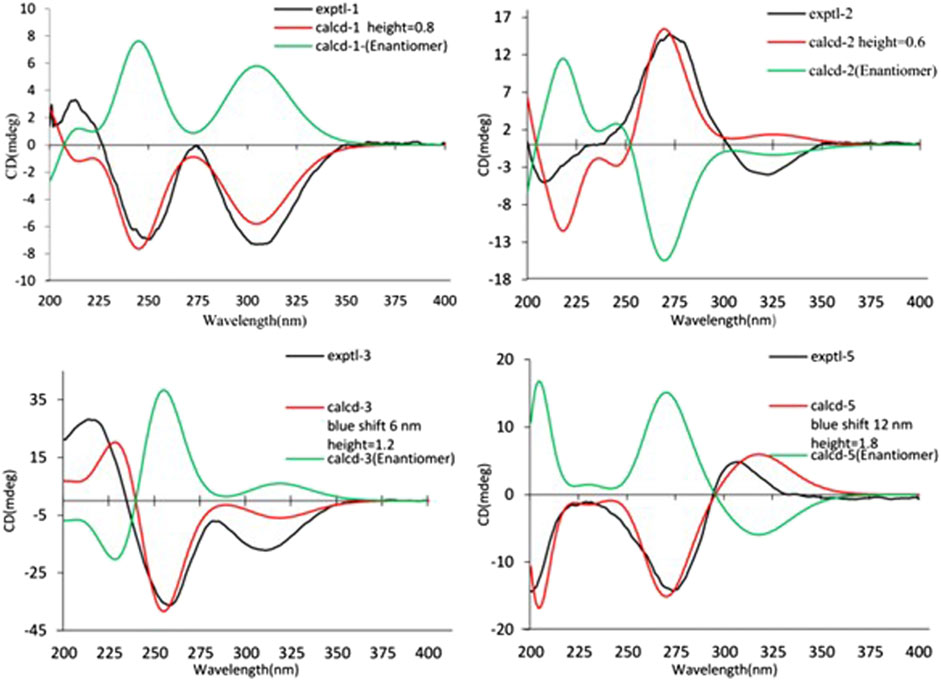
FIGURE 5. Experimental and calculated ECD spectra of 1–3, 5.
Compound 2 was obtained as needle crystals. Its molecular formula was established as C12H18O4 on the basis of the protonated molecule peak at m/z 227.1275 (M + H)+ in its HRESIMS spectrum, requiring four degrees of unsaturation. The 1D NMR data (Tables 1 and 2) of 2 were almost in accordance with those of 1, except for the lack of a hydroxyl group at C-3 position in 2, which could be further strengthened by the 1H-1H COSY cross peaks of H-2/H-3/H-4 as well as the predominant HMBC correlations from H3-9 to C-2 and C-3 as well as carbon shit of C-3 (δC 39.0).
The relative configuration of 2 was established by the NOESY experiment. The obvious NOESY cross-peak of H3-11 with H-5α indicated that these protons should be co-facial, and they were tentatively assigned as α-oriented. Moreover, H-5β exhibited a conclusive NOESY correlation with H-4, which further correlated with H-2, thus strongly suggesting that they should be located as β-oriented (Figure 3). Notably, the relative configuration of the hydroxyl group at C-4 was not determined because of the lack of critical hydroxyl proton signal. Fortunately, the absolute configuration of 2 was successfully determined to be 2R,4S,4aR,6S by the analysis of X-ray diffraction data using CuKα radiation (Figure 4) and ECD calculation (Figure 5). Therefore, the configuration of 2 was conclusively assigned as shown in Figure 1 and given the trivial name foeniculin B.
Compound 3 was also obtained as a white amorphous powder with the same molecular formula C12H18O4 as that of 2. The 1H NMR data of 3 (Table 1) were closely related to those of 2, only slight differences could be distinguished between the chemical shifts of H-2 (δH 4.62 for 2; δH 4.42 for 3), H-3 (δH 2.54 and 1.60 for 2; δH 2.34 and 1.77 for 3), and H-4 (δH 3.78 for 2; δH 3.66 for 3). Comparing the 13C NMR spectra of 2 and 3, the signals attributed to the methylene C-3 (δC 39.0 for 2, δC 35.5 for 3) and quaternary carbon C-8 (δC 115.2 for 2, δC 118.0 for 3) indicated that they should be a pair of diastereoisomers, which showed a little structural difference on the ring B. Interestingly, the partial relative configuration of 3 was determined by NOESY experiment (Figure 6). The NOESY correlations from H-3β to H-2 and H-4 assigned these protons as cofacial, thus, the related methyl and hydroxyl functionalities were suggestively established to be α-oriented on the ring B. However, the relative configuration of 4a-OH was failed to be determined for the lack of any valuable correlation in the NOESY spectrum. Then, the ECD calculations were employed to establish the absolute configurations of the two diastereoisomers. By fitting the experimental and calculated ECD curves, the 2S,4R,4aR,6S-configuration was elucidated for 3 (Figure 5).
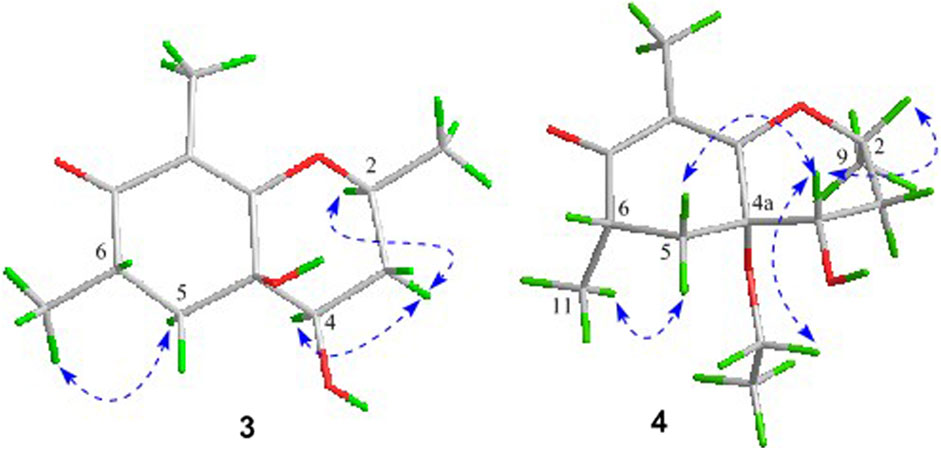
FIGURE 6. Key NOESY correlations of compounds 3 and 4.
Compound 4 was isolated as white solid. Its molecular formula of C14H22O4 was established on the basis of HRESIMS m/z 255.1598 (M + H)+ (calcd for C14H23O4, 255.1591), implying four degrees of hydrogen deficiency. After a careful inspection of the NMR spectra of 4 with those of 2, it could be readily disclosed that they showed very close similarity in most NMR profiles. The major difference between them was the hydroxyl group at C-4a in 2 replaced by a hydroxyethyl one in 4, which could be substantiated by its chemical shifts [δH 3.60 (2H, m), δC (59.3); δH 1.16 (3H, t, J = 7.0 Hz), δC (15.4)] in conjunct with the HMBC correlation from H2-1′ to C-4a and the 1H-1H COSY fragment H2-1'/H3-2'. Interestingly, compound 4 showed an ECD spectrum almost consistent with that of 2 (see Supplementary Material), which strongly illustrated that 4 should also share the similar absolute configuration by the consideration of the same biogenesis. Therefore, the structure of 4 was elucidated as shown in Figure 1 and named as foeniculin D.
Compound 5 was obtained as colorless needle-like crystals. The HRESIMS of compound 5 showed a positive molecular ion peak at m/z 211.1329, corresponding to a molecular formula of C12H18O3. The 1H NMR (Table 3) data of 5 exhibited a series of characteristic proton signals, which were responsive for two oxygenated methines [δH 4.48 (1H, m, H-2), 2.98 (1H, m, H-7)] and three methyl groups [δH 1.42 (3H, d, J = 6.3 Hz, H-9), 1.26 (3H, d, J = 7.0 Hz, H-10), 1.08 (3H, d, J = 6.4 Hz, H-11)]. The 13C NMR spectrum combined with HSQC data of 5 resolved 12 carbon resonances, and they were attributable to three methyls, two methylenes, four methines, and three quaternary carbons including a carbonyl group (δC 193.4).
In the 1H-1H COSY spectrum (Figure 2), the cross peaks of H3-10/H-8/H-7/H-6/H3-11 and H2-3/H-2/H3-9 suggested the presence of two independent fragments, a (C-11/C-6/C-7/C-8/C-10) and b (C-2/C-3/C-9). Based on the fragment a, the HMBC correlations from H-8 to C-6, C-7, and C-4a, H3-11 to C-5, C-6, and C-7, H3-10 to C-7, C-8, and C-8a suggested the existence of a cyclohexene ring A, which possessed a hydroxyl group located at C-7 and two methyls attached at C-6 and C-8, respectively. Furthermore, the obvious HMBC correlations from H-2 to C-4, H-9 to C-2 and C-3, H-3 to C-4a as well as the 1H-1H COSY fragment b confirmed the presence of the pyran ring B. The NOESY correlations from H-7 to H-5α, H3-10, and H3-11 assigned these protons as β-orientation (Figure 7). A single crystal of 5 was obtained in MeOH for X-ray diffraction analysis with Flack parameter of 0.04 (9), which suggested the absolute configuration of 5 to be 2S,6S,7R,8S shown in Figure 8. Thus, compound 5 was defined as (2S,6S,7R,8S)-7-hydroxy-2,6,8-trimethyl-2,3,5,6,7,8-hexahydro-4H-chromen-4-one and given the trivial name foeniculin E.
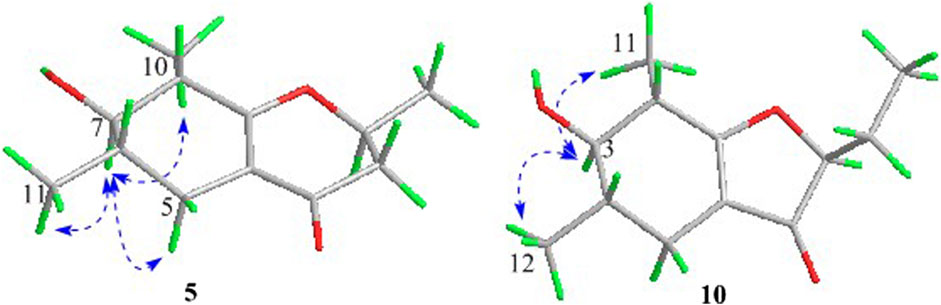
FIGURE 7. Key NOESY correlations of compounds 5 and 10.
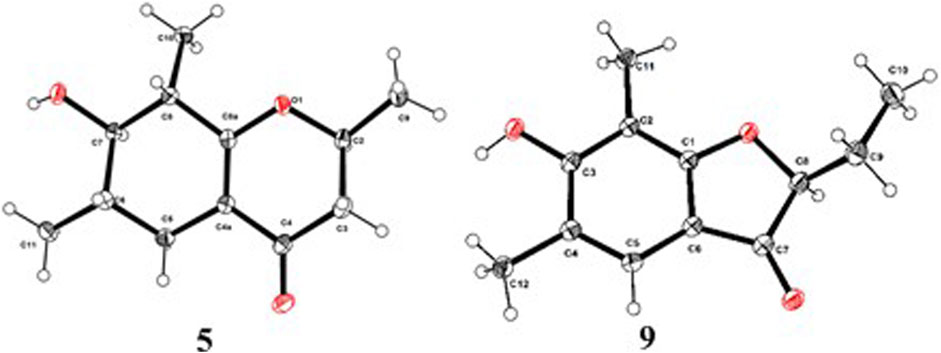
FIGURE 8. ORTEP drawings of the X-ray structures for compounds 5 and 9.
The HRESIMS data m/z 233.1146 [(M + Na)+, calcd C12H18NaO3 233.1148] of 6, 211.1339 (M + H)+ (calcd for C12H19O3, 211.1334) of 7, and m/z 211.1339 (M + H)+ (calcd for C12H19O3, 211.1334) of 8 indicated that compounds 7 and 8 should share the same molecular formula with C12H18O3 as that of 6. Careful comparison of the 1H and 13C NMR spectra of 6–8 (Tables 3 and 4) with those of foeniculin E (5) revealed that they shared the same planar structure. Moreover, the 2D NMR correlations of them (Figure 2) further strengthened this conclusion. Therefore, the aforementioned information suggested that the novel compounds 6–8 should be a series of closely related diastereoisomers of 5.
The relative configuration of 6 was determined by NOESY experiments. In the NOESY spectrum, the obvious NOESY correlations of H-2/H3-10, H-6/H3-10, and H-7/H3-11 indicated the α-orientation of H3-11 as well as β-orientation of H-2, H-6, H3-10 and 7-OH. Furthermore, the ECD calculation results showed that the absolute configuration of 6 was 2R,6S,7R,8R (Figure 9). Therefore, the structure of 6 was established as shown in Figure 1 and given the trivial name foeniculin F.
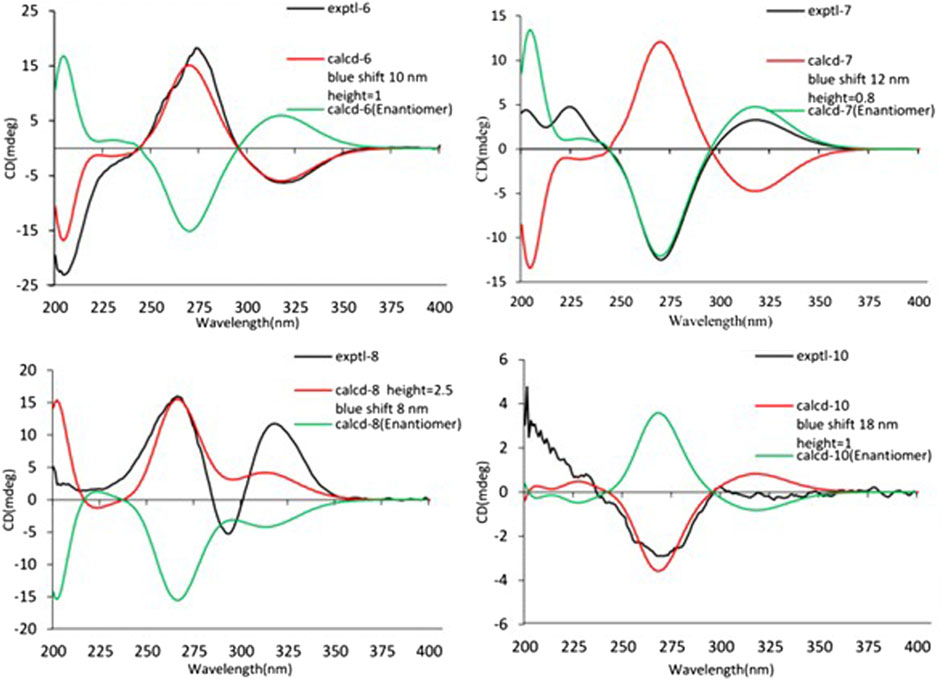
FIGURE 9. Experimental and calculated ECD spectra of 6–8 and 10.
Compound 7 shared the same planar structure as those of 5 and 6. In its NOESY spectrum, the key NOESY correlations between H-6/H3-10 and H-7/H3-11 were readily discovered, which thus successfully established the relative configuration of B ring. However, the lack of the critical NOESY correlations from the protons of A ring to those of B ring made the determination of the absolute configuration of 7 bleak. In order to solve this intractable problem, the ECD calculation method was then performed. Finally, the close comparison of the experimental and calculated ECD curves (Figure 9) revealed the absolute configuration of 7 as 2S,6S,7R,8R. Collectively, compound 7 was finally permitted to assign as (2S,6S,7R,8R)-7-hydroxy-2,6,8-trimethyl-2,3,5,6,7,8-hexahydro-4H-chromen-4-one and given the trivial name foeniculin G.
Compound 8 also shared very close similarity in the NMR data to those of 6. These subtle differences indicated that the methyl group at C-6 adopted an α-orientation and the hydroxyl group at C-7 should be β-orientation. This deduction was consistent with the analysis of the ECD calculations (Figure 9). Thus, the absolute structure of compound 8 was determined to be (2R,6S,7R,8S)-7-hydroxy-2,6,8-trimethyl-2,3,5,6,7,8-hexahydro-4H-chromen-4-one and given the trivial name foeniculin H.
Compound 9 was isolated as colorless needle crystals, and the molecular formula of C12H14O3 was deduced from the HRESIMS peak at m/z 207.1013 (M + H)+ (calcd for C12H15O3, 207.1021), which clearly suggested the presence of six indices of unsaturation. 1H NMR data of 9 (Table 5) revealed three methyl groups including two benzyl protons (δH 2.19 and 2.23, each s), an oxymethine (δH 4.50, dd, J = 4.5, 7.1 Hz), a methylene (δH 1.80, m), and an olefinic methine (δH 7.29, s). The 13C NMR data (Table 5) and the HSQC spectra revealed the presence of 12 carbons, which included six olefinic carbons (δC 106.8, 113.7, 118.7, 122.4, 160.5, and 172.0), a ketocarbonyl (δC 200.6), three methyls (δC 7.3, 8.9, 15.8), and one oxymethine (δC 87.0). The 1H-1H COSY revealed one spin-spin system (C-8/C-9/C-10). The HMBC correlations of H-5 to C-1, C-3, C-7, and C-12, H3-12 to C-3, C-4, and C-5, as well as H3-11 to C-1, C-2, and C-3 established a 3-hydroxy-2,4-dimethylph-2-en-1-one core scaffold for ring A (Figure 1). The HMBC correlations of H-8 to C-1 and C-7 together with H-5 to C-7 established the 5-membered ring B, which fused with ring A at C-1 and C-6 with an ethyl group at C-8. Thus, the planar structure of 9 was successfully established. The 8S absolute configuration of 9 was assigned by the X-ray diffraction (Figure 8). Finally, the absolute structure of compound 9 was determined to be (S)-8-ethyl-3-hydroxy-2,4-dimethylbenzofuran-3(2H)-one and given the trivial name foeniculin I.
Compound 10 was isolated as a white oil. The molecular formula was established as C12H18O3 from the (M + H)+ ion at m/z 211.1333 in HRESIMS data (calcd for C12H19O3, 211.1329). The molecular unsaturation together with the 1H and 13C NMR data (Table 5) suggested that 10 was a hydrogenated derivative of 9 with the aid of the HSQC spectrum. The planar structure of 10 was determined unambiguously by 2D NMR analyses (1H-1H COSY, HSQC, and HMBC). The partially relative configuration of 10 was established by analyses of NOESY correlations. The key NOESY correlations between H-3/H3-11 and H-3/H3-12 strongly suggested that these two methys should be in the same orientation (Figure 7). With its potential biogenesis from the biosynthetic precursor 9, the absolute configuration of C-8 in 10 was rationally deduced to be S configuration, which thus resulted the structure of 10 to be 2R,3S,4S,8S or 2S,3R,4R,8S. Therefore, the calculated ECD methodology was conducted to reveal the possible structure of 10. Fortunately, the calculated ECD spectrum of (2S,3R,4S,8S)-10 showed a negative Cotton effect at 270 nm, which well matched with that of the experimental result (Figure 9), allowing the absolute configuration of 10 as 2S,3R,4S,8S. Thus, the structure of compound 10 was finally determined and given the trivial name foeniculin J.
According to HRESIMS data, foeniculin K (11) was found to have a molecular formula of C12H14O3, which was the same as that of 9. Analyses of the 1D and 2D NMR of 9 and 11 revealed that compound 11 also possessed a penta-substituted benzene ring A, which was similar to that in compound 9. The main difference between them located in the ring B. In which, compound 11 shared an α,β-unsaturated crotonoyl moiety substituted at the C-6 position. This conclusion could be further verified by the 1H-1H COSY fragment C-8/C-9/C-10 and HMBC correlations from H-5 to C-7. At last, the structure of 11 was determined as shown in Figure 1.
The isolated compounds 1–11 were tested in vitro cytotoxic activity against the tumor cell lines SF-268, MCF-7, HePG-2, and normal cell line LX-2. As a result, compound 11 exhibited mild cytotoxicity against the tumor cell line with IC50 values of 27.73, 42.54, and 25.12 µM. Compounds 1–10 were inactive to the tested tumor cell lines even at a concentration of 100 µM. The antimicrobial activity of compounds 1–11 was also evaluated against the bacteria Escherichia coli and S. aureus. However, all of them were found to be devoid of significant activity.
Conclusion
A phytochemical investigation on the Diaporthe foeniculina SCBG-15 resulted in the isolation and structural elucidation of eleven new compounds foeniculins. The structures including absolute configurations were determined by extensive physicochemical and spectroscopic analysis, as well as ECD calculation and X-ray diffraction crystallography. All the novel compounds 1–11 possessed polymethylated skeleton. Compound 11 exhibited cytotoxic activity against the tumor cell lines SF-268, MCF-7, HePG-2 with IC50 values of 27.73, 42.54, 25.12 µM, which might serve as a promising antitumor lead compound for the drug discovery.
Data Availability Statement
All datasets generated for this study are included in the article/Supplementary Material.
Author Contributions
XL, YZ, WZ, HW, SW, and HT performed the experiments. XL was responsible for the isolation of compounds. YZ performed ECD calculation. XL and HT identified the structures. WZ tested cytotoxic activity of the compounds. XL and HT interpreted the data and wrote the paper. YZ, WZ, HW, SW, and HT revised the manuscript. HT and SW conceived and designed the experiments. All authors read and approved the final manuscript.
Funding
We thank the National Natural Science Foundation of China (No. 81773602), Natural Science Foundation of Guangdong Province (2019A1515011694), Guangdong Special Support Program (2017TQ04R599), Guangxi Natural Science Foundation (2018GXNSFBA050015), and Youth Innovation Promotion Association of CAS (2020342).
Conflict of Interest
The authors declare that the research was conducted in the absence of any commercial or financial relationships that could be construed as a potential conflict of interest.
Publisher’s Note
All claims expressed in this article are solely those of the authors and do not necessarily represent those of their affiliated organizations, or those of the publisher, the editors and the reviewers. Any product that may be evaluated in this article, or claim that may be made by its manufacturer, is not guaranteed or endorsed by the publisher.
Supplementary Material
The Supplementary Material for this article can be found online at: https://www.frontiersin.org/articles/10.3389/fchem.2021.738307/full#supplementary-material
References
Beardsell, D., Obrien, S., Williams, E., Knox, R., and Calder, D. (1993). Reproductive Biology of Australian Myrtaceae. Aust. J. Bot. 41 (5), 511–526. doi:10.1071/BT9930511
Brophy, J. J., Goldsack, R. J., Bean, A. R., Forster, P. I., and Lepschi, B. J. (1999). Leaf Essential Oils of the genus Leptospermum (Myrtaceae) in Eastern Australia, Part 4.Leptospermum Deanei and Allies. Flavour Fragr. J. 14, 92–97. doi:10.1002/(sici)1099-1026(199903/04)14:2<92::aid-ffj787>3.0.co;2-d
Cui, H., Lin, Y., Luo, M., Lu, Y., Huang, X., and She, Z. (2017). Diaporisoindoles A-C: Three Isoprenylisoindole Alkaloid Derivatives from the Mangrove Endophytic Fungus Diaporthe sp. SYSU-HQ3. Org. Lett. 19, 5621–5624. doi:10.1021/acs.orglett.7b02748
Cui, H., Liu, Y., Li, J., Huang, X., Yan, T., Cao, W., et al. (2018). Diaporindenes A-D: Four Unusual 2,3-Dihydro-1H-Indene Analogues with Anti-inflammatory Activities from the Mangrove Endophytic Fungus Diaporthe sp. SYSU-HQ3. J. Org. Chem. 83, 11804–11813. doi:10.1021/acs.joc.8b01738
Gao, Y.-Q., Du, S.-T., Xiao, J., Wang, D.-C., Han, W.-B., Zhang, Q., et al. (2020). Isolation and Characterization of Antifungal Metabolites from the Melia Azedarach-associated Fungus Diaporthe eucalyptorum. J. Agric. Food Chem. 68, 2418–2425. doi:10.1021/acs.jafc.9b07825
Li, C., Liu, H., Zhao, L., Zhang, W., Qiu, S., Yang, X., et al. (2017). Antibacterial Neolignans from the Leaves of Melaleuca bracteata. Fitoterapia 120, 171–176. doi:10.1016/j.fitote.2017.06.015
Li, G., Kusari, S., Kusari, P., Kayser, O., and Spiteller, M. (2015). Endophytic Diaporthe sp. LG23 Produces a Potent Antibacterial Tetracyclic Triterpenoid. J. Nat. Prod. 78, 2128–2132. doi:10.1021/acs.jnatprod.5b00170
Liu, H.-X., Chen, K., Liu, Y., Li, C., Wu, J.-W., Xu, Z.-F., et al. (2016d). Callviminols A-E, New Terpenoid-Conjugated Phloroglucinols from the Leaves of Callistemon viminalis. Fitoterapia 115, 142–147. doi:10.1016/j.fitote.2016.10.007
Liu, H.-X., Chen, K., Tang, G.-H., Yuan, Y.-F., Tan, H.-B., and Qiu, S.-X. (2016c). Isolation and Biomimetic Total Synthesis of Tomentodiones A-B, Terpenoid-Conjugated Phloroglucinols from the Leaves of Rhodomyrtus tomentosa. RSC Adv. 6, 48231–48236. doi:10.1039/C6RA08776K
Liu, H.-X., Chen, K., Yuan, Y., Xu, Z.-F., Tan, H.-B., and Qiu, S.-X. (2016a). Rhodomentones A and B, Novel Meroterpenoids with Unique NMR Characteristics from Rhodomyrtus tomentosa. Org. Biomol. Chem. 14, 7354–7360. doi:10.1039/c6ob01215a
Liu, H.-X., Chen, Y.-C., Liu, Y., Zhang, W.-M., Wu, J.-W., Tan, H.-B., et al. (2016e). Acylphloroglucinols from the Leaves of Callistemon viminalis. Fitoterapia 114, 40–44. doi:10.1016/j.fitote.2016.08.010
Liu, H.-X., Tan, H.-B., Li, S.-N., Chen, Y.-C., Li, H.-H., Qiu, S.-X., et al. (2018). Two New 12-membered Macrolides from the Endophytic Fungal Strain Cladosprium colocasiae A801 of Callistemon viminalis. J. Asian Nat. Prod. Res. 21, 696–701. doi:10.1080/10286020.2018.1471067
Liu, H.-X., Zhang, W.-M., Xu, Z.-F., Chen, Y.-C., Tan, H.-B., and Qiu, S.-X. (2016b). Isolation, Synthesis, and Biological Activity of Tomentosenol A from the Leaves of Rhodomyrtus tomentosa. RSC Adv. 6, 25882–25886. doi:10.1039/c6ra01594h
Luo, X., Lin, X., Tao, H., Wang, J., Li, J., Yang, B., et al. (2018). Isochromophilones A-F, Cytotoxic Chloroazaphilones from the Marine Mangrove Endophytic Fungus Diaporthe sp. SCSIO 41011. J. Nat. Prod. 81, 934–941. doi:10.1021/acs.jnatprod.7b01053
Mandavid, H., Rodrigues, A. M. S., Espindola, L. S., Eparvier, V., and Stien, D. (2015). Secondary Metabolites Isolated from the Amazonian Endophytic Fungus Diaporthe sp. SNB-GSS10. J. Nat. Prod. 78, 1735–1739. doi:10.1021/np501029s
Mosmann, T. (1983). Rapid Colorimetric Assay for Cellular Growth and Survival: Application to Proliferation and Cytotoxicity Assays. J. Immunol. Methods 65, 55–63. doi:10.1016/0022-1759(83)90303-4
Xiang, Y.-Q., Liu, H.-X., Zhao, L.-Y., Xu, Z.-F., Tan, H.-B., and Qiu, S.-X. (2017). Callistemenonone A, a Novel Dearomatic Dibenzofuran-type Acylphloroglucinol with Antimicrobial Activity from Callistemon viminalis. Sci. Rep. 7, 2363. doi:10.1038/s41598-017-02441-5
Zang, L. Y., Wei, W., Guo, Y., Wang, T., Jiao, R. H., Ng, S. W., et al. (2012). Sesquiterpenoids from the Mangrove-Derived Endophytic Fungus Diaporthe sp. J. Nat. Prod. 75, 1744–1749. doi:10.1021/np3004112
Zhu, Y., Zhang, L.-X., Zhao, Y., and Huang, G.-D. (2010). Unusual Sesquiterpene Lactones with a New Carbon Skeleton and New Acetylenes from Ajania przewalskii. Food Chem. 118, 228–238. doi:10.1016/j.foodchem.2009.04.112
Keywords: Diaporthe foeniculina, Leptospermum brachyandrum, foeniculins A-K, cytotoxic activity, antibacterial activity
Citation: Lu X, Zhang Y, Zhang W, Wang H, Zhang J, Wang S and Tan H (2021) Cyclohexanone and Phenolic Acid Derivatives from Endophytic Fungus Diaporthe foeniculina. Front. Chem. 9:738307. doi: 10.3389/fchem.2021.738307
Received: 09 July 2021; Accepted: 03 August 2021;
Published: 01 September 2021.
Edited by:
Xuekui Xia, Shandong Academy of Sciences, ChinaReviewed by:
Hongbo Huang, South China Sea Institute of Oceanology (CAS), ChinaSang Hee Shim, Seoul National University, South Korea
Copyright © 2021 Lu, Zhang, Zhang, Wang, Zhang, Wang and Tan. This is an open-access article distributed under the terms of the Creative Commons Attribution License (CC BY). The use, distribution or reproduction in other forums is permitted, provided the original author(s) and the copyright owner(s) are credited and that the original publication in this journal is cited, in accordance with accepted academic practice. No use, distribution or reproduction is permitted which does not comply with these terms.
*Correspondence: Sasa Wang, wgsasa@163.com; Haibo Tan, tanhaibo@scbg.ac.cn