Comparative Morphological, Metabolic and Transcriptome Analyses in elmo1−/−, elmo2−/−, and elmo3−/− Zebrafish Mutants Identified a Functional Non-Redundancy of the Elmo Proteins
 Mike Boger1
  Katrin Bennewitz1 David Philipp Wohlfart1
  Ingrid Hausser2
  Carsten Sticht3
  Gernot Poschet4
  Jens Kroll1*
- 1Department of Vascular Biology and Tumor Angiogenesis, European Center for Angioscience (ECAS), Medical Faculty Mannheim, Heidelberg University, Mannheim, Germany
- 2Institute of Pathology IPH, EM Lab, Heidelberg University Hospital, Heidelberg, Germany
- 3NGS Core Facility, Medical Faculty Mannheim, Heidelberg University, Mannheim, Germany
- 4Metabolomics Core Technology Platform, Centre for Organismal Studies, Heidelberg University, Heidelberg, Germany
The ELMO protein family consists of the homologues ELMO1, ELMO2 and ELMO3. Several studies have shown that the individual ELMO proteins are involved in a variety of cellular and developmental processes. However, it has poorly been understood whether the Elmo proteins show similar functions and act redundantly. To address this question, elmo1−/−, elmo2−/− and elmo3−/− zebrafish were generated and a comprehensive comparison of the phenotypic changes in organ morphology, transcriptome and metabolome was performed in these mutants. The results showed decreased fasting and increased postprandial blood glucose levels in adult elmo1−/−, as well as a decreased vascular formation in the adult retina in elmo1−/−, but an increased vascular formation in the adult elmo3−/− retina. The phenotypical comparison provided few similarities, as increased Bowman space areas in adult elmo1−/− and elmo2−/− kidneys, an increased hyaloid vessel diameter in elmo1−/− and elmo3−/− and a transcriptional downregulation of the vascular development in elmo1−/−, elmo2−/−, and elmo3−/− zebrafish larvae. Besides this, elmo1−/−, elmo2−/−, and elmo3−/− zebrafish exhibited several distinct changes in the vascular and glomerular structure and in the metabolome and the transcriptome. Especially, elmo3−/− zebrafish showed extensive differences in the larval transcriptome and an impaired survivability. Together, the data demonstrated that the three zebrafish Elmo proteins regulate not only similar but also divergent biological processes and mechanisms and show a low functional redundancy.
Introduction
The engulfment and cell motility (ELMO) protein family consists of the three proteins ELMO1, ELMO2 and ELMO3. ELMO proteins are evolutionary conserved and represented in several organisms, including C. elegans, D. melanogaster and in higher vertebrates such as zebrafish, mouse and human. They are established binding partners of dedicator of cytokinesis (DOCK) family members to regulate the activity of Rac family small GTPase 1 (RAC1) through their function as guanine nucleotide exchange factors (GEF) (Gumienny et al., 2001; Zhou et al., 2001; Brugnera et al., 2002; Katoh and Negishi, 2003; Lu et al., 2004; Cetinkaya et al., 2016; Tran et al., 2021). ELMO/DOCK directed RAC1 activation regulates important basic cellular functions such as cell migration, cytoskeleton organization, phagocytosis, the engulfment of apoptotic cells and myoblast fusion (Gumienny et al., 2001; Wu et al., 2001; Brugnera et al., 2002; Grimsley et al., 2004; Park et al., 2007; Geisbrecht et al., 2008; Elliott et al., 2010; Hamoud et al., 2014; Sun et al., 2015; Peotter et al., 2016; Tran et al., 2021).
As RAC1 regulators, ELMO proteins are involved in a variety of cellular and developmental processes in which they execute specific functions, as in nervous system development and disorders (Katoh and Negishi, 2003; Biersmith et al., 2011; Franke et al., 2012; Namekata et al., 2012; Lanoue et al., 2013; Mehawej et al., 2018; Tran et al., 2021). ELMO1 and ELMO2 promote axon guidance (Makihara et al., 2018) and elmo1−/− zebrafish showed reduced apoptotic neuronal death and regulation of axon myelination and neuronal numbers (Mikdache et al., 2019). ELMO3 mutations were recently suggested as the cause of developmental delay and autism in humans (Tran et al., 2021). ELMO proteins were linked to multiple other diseases, such as cancer, diabetes mellitus, inflammatory bowel disease and arthritis (Shimazaki et al., 2005; Hathaway et al., 2016; Sayed et al., 2020; Arandjelovic et al., 2021). Respective studies provided insights into the variety of the ELMO proteins’ functions as promotive factors for cell growth, proliferation and metastasis in multiple human carcinomas (Peng et al., 2016; Hu et al., 2018; Pan et al., 2019). ELMO3 is commonly suggested as a negative prognostic marker when overexpressed in different cancer types (Fan et al., 2015; Haymerle et al., 2017; Kadletz et al., 2017). Additionally, ELMO3 was recently described as a regulator of RAC1 activity promoting cell migration (Tran et al., 2021) and thereby shown to act similar to ELMO1 and ELMO2. Further functions of ELMO3, regarding developmental processes are still poorly understood.
In mouse models, ELMO1 was identified as a microbial sensor in epithelial and phagocytic cells that activates inflammatory signals and as a required factor for bacterial internalization and monocyte recruitment in inflammatory bowel disease (Sayed et al., 2020). Elmo1−/− mouse models of osteoporosis and arthritis showed reduced bone erosion and identified ELMO1 as positive regulator of osteoclast function and bone loss (Arandjelovic et al., 2021). In addition Elmo1 was described as a promotor of angiogenesis and early vascular development in zebrafish (Epting et al., 2010; Schäker et al., 2015). Remarkably, worldwide genetic studies in humans reported a susceptibility of diabetic patients with gene variants of ELMO1, ELMO2 or ELMO3 to develop kidney damage (Shimazaki et al., 2005; Bento et al., 2008; Leak et al., 2009; Hanson et al., 2010; Wu et al., 2013; Alberto Ramirez-Garcia et al., 2015; Liu et al., 2015; Turki et al., 2018). This suggested a contribution of the ELMO gene family in the development of diabetic nephropathy. Studies analyzing the role of ELMO1 in kidney function described an aggravation of nephropathy in mice with type 1 diabetes (Shimazaki et al., 2005; Hathaway et al., 2016) and a promotion of glomerular injury through dysregulation of the extracellular matrix (ECM) (Shimazaki et al., 2006) in presence of ELMO1. ELMO2 was shown to regulate the insulin dependent expression and membrane translocation of GLUT4 in human skeletal muscle cells and adipocytes, indicating a potential involvement in glucose homeostasis (Sun et al., 2016).
Together, these studies have identified various functions of the individual ELMO proteins; however, most existing studies used variable experimental parameters such as different animal organisms, different cell systems, different experimental approaches and non-related research topics. Furthermore, they predominantly provided data about one ELMO protein and no comparative data about all three. Thus, it remained unclear if the three ELMO proteins share common functions and if they regulate similar or diverse biological processes.
Therefore, this study aimed to analyze the functions of all three members of the Elmo protein family in the vasculature, kidney morphology and glucose homeostasis in one animal model. We generated knockout mutant zebrafish of elmo1, elmo2 and elmo3 and identified, despite few similarities, several functional differences between elmo1−/−, elmo2−/− and elmo3−/− animals. We observed an impaired survivability of elmo3−/− zebrafish, decreased fasting and increased postprandial blood glucose levels in adult elmo1−/−, as well as a decreased vascular formation in the adult retina in elmo1−/− but an increased vascular formation in the adult retina in elmo3−/−. Besides a common transcriptional downregulation of the vascular development in elmo1−/−, elmo2−/−, and elmo3−/− zebrafish larvae, the three mutants, especially elmo3−/−, revealed several differences in the regulation of the larval transcriptome. These new findings clearly demonstrate a functional diversity and non-redundancy between the three Elmo proteins in zebrafish.
Results
Amino Acid Sequence Comparison of Elmo1, Elmo2 and Elmo3 and Generation of elmo1−/−, elmo2−/− and elmo3−/− Zebrafish Lines
A comprehensive, comparative investigation, especially in vivo, addressing the questions if ELMO proteins share identical functions, has not been done yet. Previous studies showed overlapping and varying expression patterns of elmo1, elmo2 and elmo3 in retinal, vascular, neuronal and glomerular structures in zebrafish larvae and that Elmo1 regulates the vascular structure in the developing zebrafish and the glomerular structure in diabetic mice (Shimazaki et al., 2005; Epting et al., 2010; Cetinkaya et al., 2016; Hathaway et al., 2016). Therefore, this study aimed to analyze all three Elmo proteins in zebrafish to find potential differences and similarities.
An alignment of the amino acid sequences of zebrafish Elmo1, Elmo2 and Elmo3 showed a shared identity of 43% within all three proteins (Supplementary Figure S1). Human ELMO1, ELMO2 and ELMO3 exhibit an identity of 45% in amino acid sequence (Supplementary Figure S2), therefore similar to zebrafish. Elmo1 and Elmo2 in zebrafish displayed an identity of 63%, Elmo1 and Elmo3 58% and Elmo2 and Elmo3 50% in the amino acid sequence. The armadillo-like helical domain of unknown function present in all Elmo proteins is 41% identical, the functional not well described ELMO domain is 40% identical and the pleckstrin homology domain regulating the interaction with Dock180 to promote Rac1 activity shares 58% identity between Elmo1, Elmo2 and Elmo3 (Zhou et al., 2001; Lu et al., 2004; Bowzard et al., 2007; Komander et al., 2008; East et al., 2012). Although these amino acid comparisons showed some similarities between Elmo1, Elmo2 and Elmo3, they also exhibited remarkable differences. Therefore, zebrafish Elmo1, Elmo2 and Elmo3 are not highly conserved and variable functions between the different Elmo proteins can be expected.
To investigate the functions of Elmo1, Elmo2 and Elmo3 through the consequences of the loss of each protein, elmo1, elmo2 and elmo3 knockout zebrafish lines were generated with the CRISPR/Cas9 system in the reporter line Tg(fli1:EGFP). For each gene a frameshift mutation was generated which resulted in an early stop codon in the mRNA sequence and therefore in a premature termination of the translation (Figures 1A,C,E). For the elmo1−/− line, a 10 base pair (bp) insertion in exon 2 was induced (Figure 1A), for the elmo2−/− line, a 17 bp deletion in exon 9 (Figure 1C) and for the elmo3−/− line, a 10 bp deletion in exon 2 were induced (Figure 1E). The mutation in elmo1 is predicted to lead to a 16 amino acids short version of the Elmo1 protein lacking all three known domains. The mutation in elmo2 is predicted to lead to a 324 amino acids short version of the Elmo2 protein lacking the majority of the ELMO domain and the entire PH domain. The mutation in elmo3 is predicted to lead to a 30 amino acids short version of the Elmo3 protein lacking all three domains. Therefore, the created premature-translation-termination codons in elmo1−/−, elmo2−/− and elmo3−/− zebrafish lead to remaining peptides which cannot be functional and result in the loss of the respective protein. The mutations were analyzed and verified by sequencing genomic DNA. Furthermore, mutations were validated on RNA level by reverse transcription polymerase chain reaction (RT-PCR), for each gene, respectively (Figures 1B,D,F).
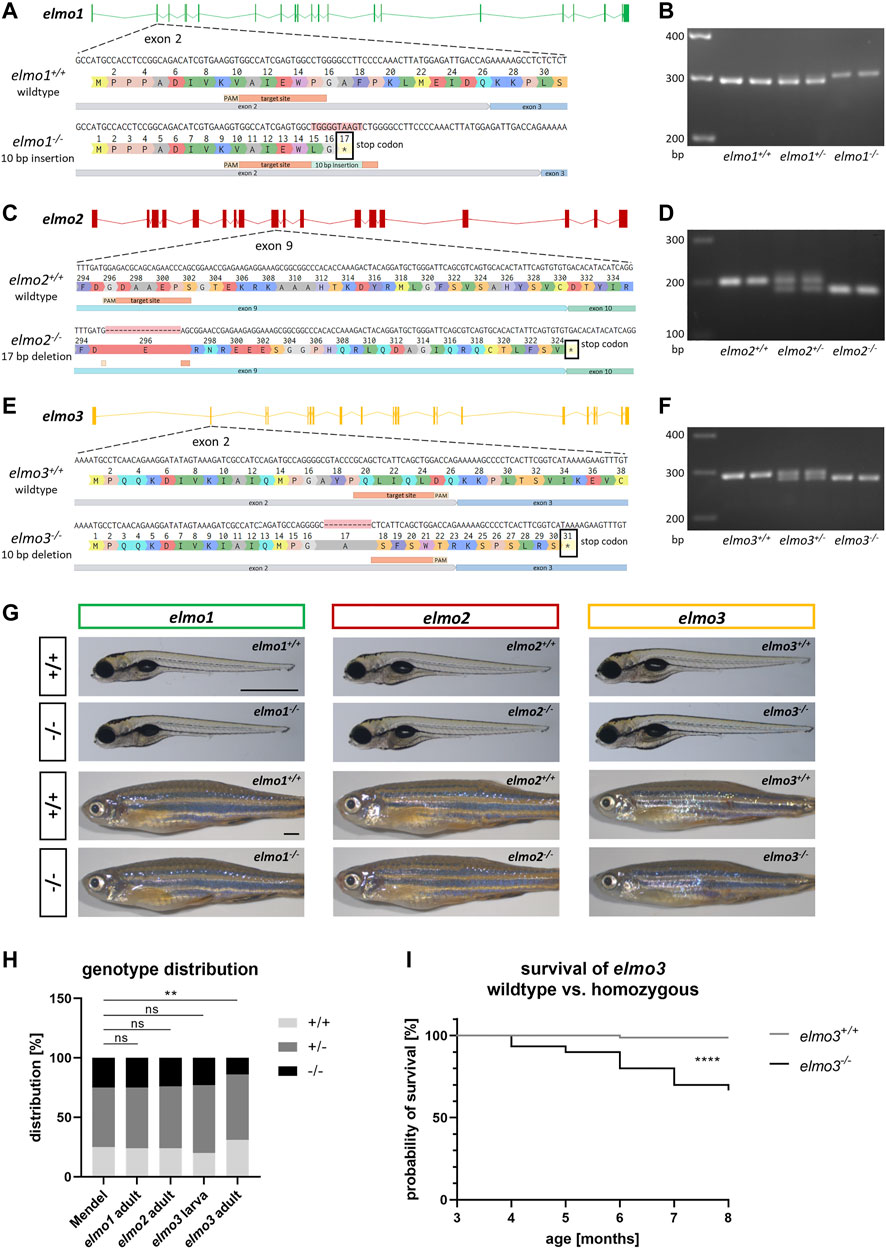
FIGURE 1. Generation of elmo1, elmo2 and elmo3 knockout zebrafish lines. (A) Exon map of the zebrafish elmo1 gene and the position of the CRISPR target site designed for zebrafish elmo1 targeting exon 2. Sequencing results of cDNA sequence and the resulting amino acid sequence from elmo1+/+ and the generated elmo1−/− line with a 10 bp insertion. The resulting stop codon is indicated with a star. (B) The 10 base pair insertion in elmo1 was confirmed on RNA level by gel electrophoretic segregation of PCR products of cDNA which was synthesized from mRNA from elmo1+/+, elmo1+/− and elmo1−/− larvae at 120 hpf. PCR product size: wild type 298 bp, homozygous 308 bp. (C) Exon map of the zebrafish elmo2 gene and the position of the CRISPR target site designed for zebrafish elmo2 targeting exon 9. Sequencing results of cDNA sequence and the resulting amino acid sequence from elmo2+/+ and the generated elmo2−/− line with a 17 bp deletion. The resulting stop codon is indicated with a star. (D) The 17 base pair deletion in elmo2 was confirmed on RNA level by gel electrophoretic segregation of PCR products of cDNA which was synthesized from mRNA from elmo2+/+, elmo2+/- and elmo2−/− larvae at 120 hpf. PCR product size: wild type 198 bp, homozygous 181 bp. (E) Exon map of the zebrafish elmo3 gene and the position of the CRISPR target site designed for zebrafish elmo3 targeting exon 2. Sequencing results of cDNA sequence and the resulting amino acid sequence from elmo3+/+ and the generated elmo3−/− line with a 10 bp deletion. The resulting stop codon is indicated with a star. (F) The 10 base pair deletion in elmo3 was confirmed on RNA level by gel electrophoretic segregation of PCR products of cDNA which was synthesized from mRNA from elmo3+/+, elmo3+/−, and elmo3−/− larvae at 120 hpf. PCR product size: wild type 290 bp, homozygous 280 bp. (G) Representative light microscopy pictures of larvae at 120 hpf and adults (8–13 mpf) of elmo1+/+, elmo1−/−, elmo2+/+, elmo2−/−, elmo3+/+, and elmo3−/− zebrafish. Scale bar is 1 mm. (H) Genotype distribution of Mendelian inheritance and the filial generation of elmo1 (n = 358), elmo2 (n = 354) and elmo3 (nlarva = 100, nadult = 224) after heterozygous inter se crossings. Age of adults was 3 mpf and age of larvae was 120 hpf. The genotype distribution in elmo3 adults was altered to the Mendelian inheritance. (I) Reduced survival rate of adult elmo3−/− (n = 30) compared to elmo3+/+ (n = 74) zebrafish over the age of 3–8 months. Statistical analysis was done with chi-square test and logrank test. **p < 0.01, ****p < 0.0001. ns, not significant; bp, base pair; hpf, hours post fertilization; mpf, months post fertilization.
Due to the homology within the Elmo protein family in zebrafish (Supplementary Figure S1), expression analyses in zebrafish larvae were applied via reverse transcription quantitative polymerase chain reaction (RT-qPCR) to assess the expression of the elmo genes in the early development in wild types (Supplementary Figure S3A) and to examine if they compensate for each other in elmo1−/−, elmo2−/− and elmo3−/− at 120 hpf, respectively (Supplementary Figure S4). In wild type zebrafish larvae the expression of elmo1 was over ten times higher than the expression of elmo2 and over five times higher than the expression of elmo3 over the first 5 days of development (Supplementary Figure S3A). In elmo1−/− mutant larvae elmo1 RNA was decreased (Supplementary Figure S4A) and in elmo2−/− mutant larvae elmo2 RNA was decreased at 120 hpf (Supplementary Figure S4B), whereas elmo3 RNA was not changed in elmo3−/− mutant larvae (Supplementary Figure S4C). Mutations which lead to a premature-translation-termination codon can cause transcript degradation by nonsense-mediated decay or reduced transcription through epigenetic silencing (El-Brolosy and Stainier, 2017; El-Brolosy et al., 2019; Sztal and Stainier, 2020). Therefore, the decreased RNA of elmo1 in elmo1−/− larvae and the decreased RNA of elmo2 in elmo2−/− larvae can be seen as an additional confirmation of the respective frameshift mutations. Likewise the mutated RNA can be insensitive, escape or not trigger this event (Denecke et al., 2004; Inácio et al., 2004; Dabrowska et al., 2018). Remarkably, elmo1 expression was increased in elmo2−/− larvae (Supplementary Figure S4B) which could indicate a compensatory mechanism of Elmo1 during a loss of Elmo2, hinting at a functional similarity.
Reduced Viability of elmo3−/− Zebrafish
In embryonic and larval development gross morphology and viability of elmo1−/−, elmo2−/− and elmo3−/− zebrafish appeared unaltered compared to their wild type littermates until 120 hours post fertilization (hpf) (Figure 1G). Analysis of genotypes after heterozygous incrosses revealed the expected distribution equal to the Mendelian inheritance of elmo3 larvae (120 hpf) and of adult [3 months post fertilization (mpf)] elmo1 and elmo2 animals (Figure 1H); however, elmo3 adults (3 mpf) showed an altered genotype distribution with 32% elmo3+/+, 55% elmo3+/− and 13% elmo3−/− animals. A subsequent analysis found a significant and progressive decrease in the survival rate of elmo3−/− zebrafish starting from 3 months after birth (Figure 1I) due to yet unknown reasons. Together, these results showed a normal development and viability of elmo1−/− and elmo2−/− zebrafish, but a reduced viability of elmo3−/− mutants.
elmo1−/− Zebrafish Exhibited a Reduced and elmo3−/− an Increased Vascular Formation in the Adult Retina
Recent reports have shown that an Elmo1 mediated Rac1 activation during angiogenesis induces and maintains the formation of the zebrafish vasculature (Epting et al., 2010; Schäker et al., 2015). Furthermore, RAC1 positively regulates angiogenesis and a loss of RAC1 led to strong vascular alterations in embryonic mice (Tan et al., 2008). To address which impact the loss of Elmo1, Elmo2 or Elmo3 may have on the vasculature in zebrafish, the larval vascular morphology of the trunk (32 and 96 hpf) (Supplementary Figures S5, S6), the larval hyaloid vasculature (120 hpf) (Figures 2A–F) and the adult retinal vasculature (9–15 mpf) (Figures 3A–J) was analyzed in elmo1−/−, elmo2−/−, and elmo3−/− zebrafish. The larval trunk vasculature in elmo1−/−, elmo2−/− and elmo3−/− (Supplementary Figure S5) appeared mostly unaltered. Solely the number of additional sprouts between the intersegmental vessels decreased in elmo1−/− mutants compared to elmo1+/+ (Supplementary Figure S5B). However, at 32 hpf elmo1−/− zebrafish larvae displayed a developmental delay of the trunk vasculature compared to elmo1+/+, which was expressed in ISV formation defects and additional sprouts (Supplementary Figure S6) but not present anymore at 96 hpf. The vasculature of the hyaloids, the precursor of the retinal vasculature (Saint-Geniez and D'Amore, 2004), of elmo1−/−, elmo2−/−, and elmo3−/− larvae exhibited no changes in vascular branching and sprouting compared to elmo1+/+, elmo2+/+, and elmo3+/+ (Figure 2). Interestingly, both elmo1−/− and elmo3−/− zebrafish revealed an increase in the vessel diameter (Figures 2A,C,D,F). In contrast, in the adult retinal vasculature (Figure 3A), branches and sprouts decreased in elmo1−/− zebrafish compared to elmo1+/+ (Figures 3B,E). In elmo2−/− zebrafish, branches were unchanged, but sprouts also decreased compared to elmo2+/+ (Figures 3C,F). Contrary to the reduced vascular formation in elmo1−/− retinae branches in elmo3−/− zebrafish increased and sprouts showed no change compared to elmo3+/+ (Figures 3D,G). RT-qPCR based expression experiments on adult eyes (13 mpf) revealed a different expression of elmo1, elmo2, and elmo3 (Supplementary Figure S3B), providing a potential explanation for the different phenotypes. Together, the data in the elmo1−/−, elmo2−/−, and elmo3−/− zebrafish mutants revealed different phenotypic alterations in the trunk, hyaloid and retinal vasculature, which suggests the Elmo proteins as important regulators of the vasculature modulating similar and diverse processes in vascular development and morphogenesis.
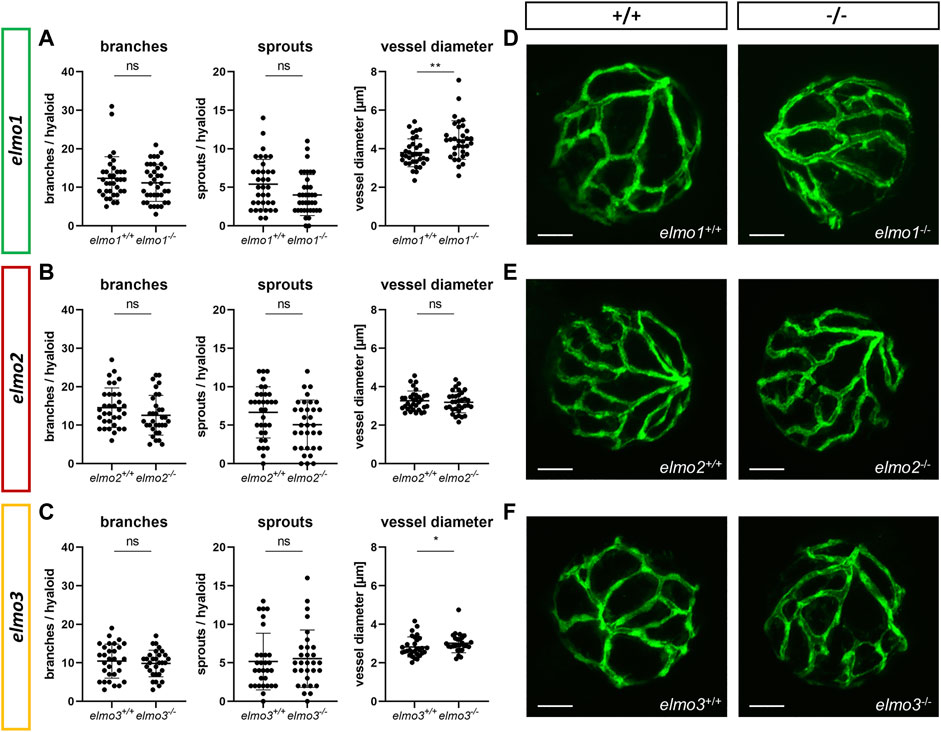
FIGURE 2. The loss of Elmo1 and Elmo3, respectively, led to an increased diameter of hyaloid blood vessels in zebrafish larvae. (A) Quantification of larval hyaloid vasculature at 120 hpf showed no changes in branches and sprouts but an increase in the vessel diameter in elmo1−/− compared to elmo1+/+. n = 33–37 hyaloids per group. (B) Quantification of larval hyaloid vasculature at 120 hpf showed no changes in branches, sprouts and vessel diameter in elmo2−/− compared to elmo2+/+. n = 33 hyaloids per group. (C) Quantification of larval hyaloid vasculature at 120 hpf showed no changes in branches and sprouts but an increase in the vessel diameter in elmo3−/− compared to elmo3+/+. n = 27–31 hyaloids per group. (D–F) Representative confocal microscopy images of the hyaloid vasculature of elmo1+/+ and elmo1−/− (D), elmo2+/+ and elmo2−/− (E) and elmo3+/+ and elmo3−/− (F) zebrafish larvae at 120 hpf. Scale bar is 50 µm. Statistical analysis was done with t-test and Mann-Whitney test. *p < 0.05, **p < 0.01. ns, not significant; hpf, hours post fertilization.
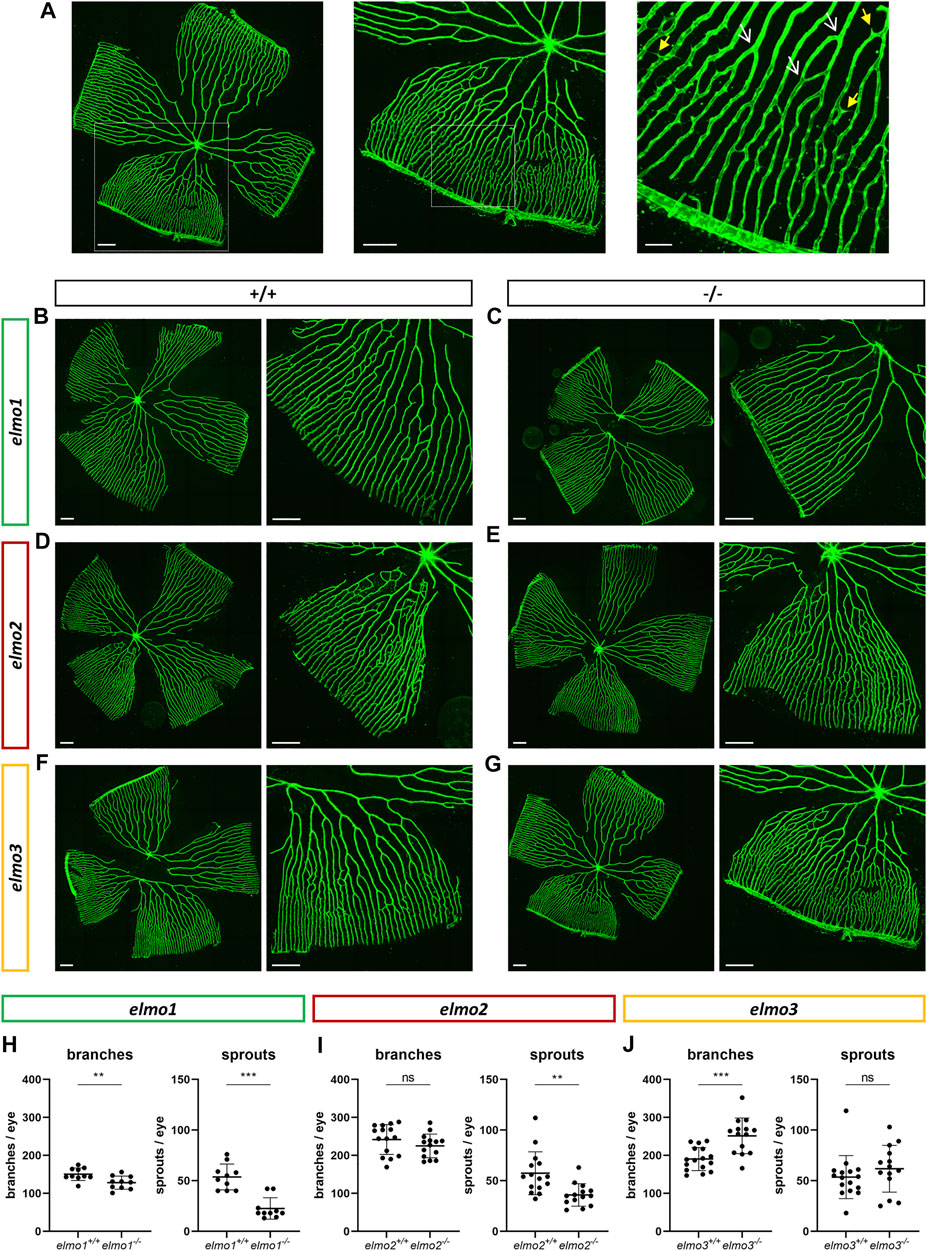
FIGURE 3. Different regulation of the retinal vasculature through Elmo1, Elmo2 and Elmo3 in adult zebrafish. (A) Exemplary pictures of a confocal scan of an adult zebrafish retinal vasculature. White squares each indicate the section of the image on the right. Scale bars are 200 µm (left, middle) and 50 µm (right). Representative vascular branches are indicated with a yellow arrow with a full arrowhead and sprouts are indicated with a white arrow with an open arrowhead. (B–G) Representative confocal microscopy images of the retina vasculature of elmo1+/+ (B) and elmo1−/− (C), elmo2+/+ (D) and elmo2−/− (E) and elmo3+/+ (F) and elmo3−/− (G) adult zebrafish. (H) Quantification of the adult retina vasculature showed a decrease in branches and sprouts in elmo1−/− compared to elmo1+/+. n = 10 retinae per group. (I) Quantification of the adult retina vasculature showed no changes in branches and a decrease in sprouts in elmo2−/− compared to elmo2+/+. n = 14–15 retinae per group. (J) Quantification of the adult retina vasculature showed an increase in branches and no changes in sprouts in elmo3−/− compared to elmo3+/+. n = 14–16 retinae per group. Analyzed retinae were obtained from animals of 9–15 mpf. Scale bar is 200 µm. Statistical analysis was done with t-test and Mann-Whitney test. **p < 0.01, ***p < 0.001. ns, not significant; mpf, months post fertilization.
The Loss of Elmo Proteins Led to Structural Changes in Adult Zebrafish Glomeruli
ELMO gene variants have been associated with diabetic kidney disease (Shimazaki et al., 2005; Bento et al., 2008; Leak et al., 2009; Hanson et al., 2010; Wu et al., 2013; Alberto Ramirez-Garcia et al., 2015; Liu et al., 2015; Turki et al., 2018), especially for ELMO1, which promotes the development of nephropathy in diabetic mice (Hathaway et al., 2016), and was suggested to promote the development of glomerular injury through dysregulation of the extracellular matrix (ECM) (Shimazaki et al., 2006). To investigate if the three Elmo proteins have an essential function in kidney formation, we analyzed whether adult elmo1−/−, elmo2−/−, and elmo3−/− zebrafish kidneys (9–15 mpf) showed an altered morphology with a special focus on the glomeruli. The elmo gene expression (Supplementary Figure S3B) and overall structure of the kidney and the glomerular structures were analyzed via PAS staining and quantified for the cell number, the size of the glomeruli and their corresponding bowman space and capillary area. The gross morphology of the kidneys showed no abnormal alterations in elmo1−/−, elmo2−/−, and elmo3−/− zebrafish (Figure 4). Furthermore, in elmo1−/−, elmo2−/−, and elmo3−/− the number of glomerular nuclei was unchanged compared to their wild type littermates (Figures 4A–D). elmo1−/− glomeruli exhibited an unchanged glomerulus size and capillary area, but an increased bowman space (Figure 4B). elmo2−/− glomeruli also displayed an increased bowman space besides an increased glomerulus size, but no change in the capillary area (Figure 4C). elmo3−/− glomeruli showed no changes in the size of the glomeruli, the bowman space or the capillary area (Figure 4D). To analyze if parts of the filtration unit of the glomerulus, specifically the glomerular basement membrane (GBM) was altered, electron microscopy (EM) images of the glomeruli were taken, analyzed and the thickness of the GBM was measured. The GBM thickness of elmo1−/− and elmo2−/−, respectively showed no significant change to the GBM thickness of elmo1+/+ (Figures 5A,D) and elmo2+/+ (Figures 5B,E) glomeruli. In contrast, the GBM thickness of elmo3−/− was increased compared to elmo3+/+ (Figures 5C,F). In summary, the loss of Elmo1, Elmo2 or Elmo3, respectively, led to different changes in the glomerulus morphology, indicating a divergent impact of the three Elmo proteins on the development of the zebrafish kidney.
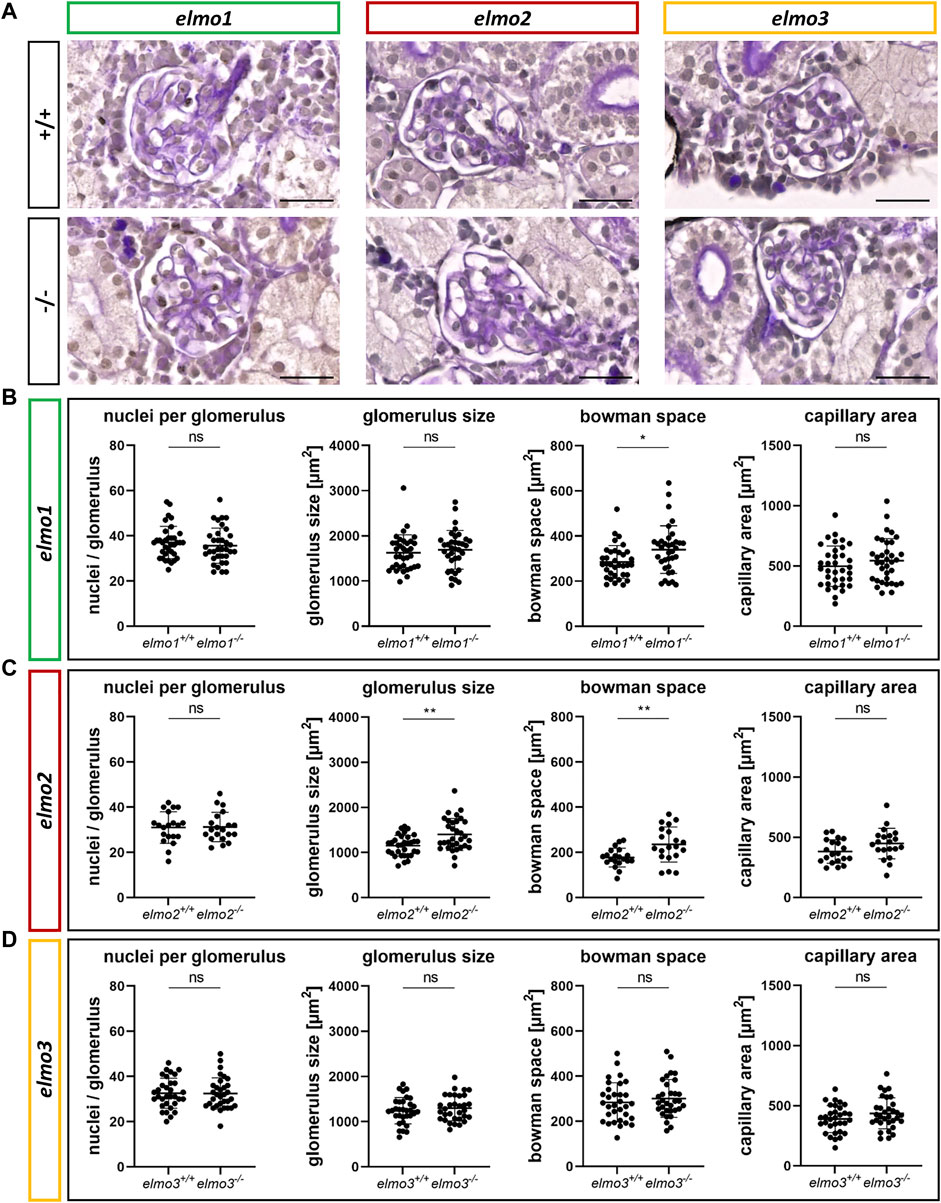
FIGURE 4. Different regulation of the glomerular structure through Elmo1, Elmo2 and Elmo3 in the kidney of adult zebrafish. (A) Representative light microscopy images of PAS stained sections of glomeruli in the kidney of elmo1+/+ and elmo1−/−, elmo2+/+ and elmo2−/− and elmo3+/+ and elmo3−/− adult zebrafish (9–13 mpf). Scale bar is 20 µm. (B) Analysis of the glomerulus structure in adult zebrafish kidneys showed no changes in the number of nuclei, glomerulus size and capillary area but an increase in the bowman space in elmo1−/− compared to elmo1+/+. n = 35 glomeruli per group, always seven glomeruli per kidney. (C) Analysis of the glomerulus structure in adult zebrafish kidneys showed no changes in the number of nuclei and the capillary area but an increase in glomerulus size and bowman space in elmo2−/− compared to elmo2+/+. n = 20 glomeruli per group, always five per kidney. (D) Analysis of the glomerulus structure in adult zebrafish kidneys showed no alterations in elmo3−/− compared to elmo3+/+. n = 32 glomeruli per group, always eight per kidney. Statistical analysis was done with t-test and Mann-Whitney test. *p < 0.05, **p < 0.01. ns, not significant; mpf, months post fertilization.
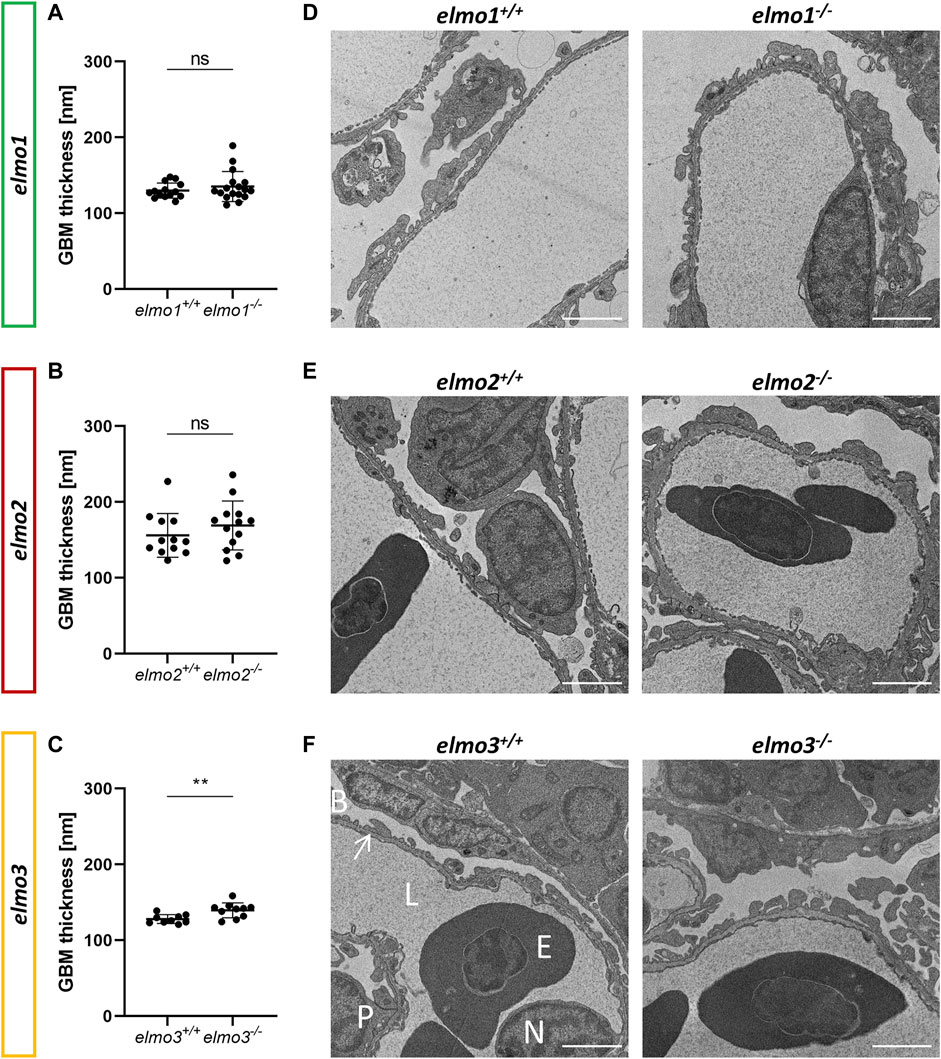
FIGURE 5. The loss of Elmo3 led to a thickening of the glomerular basement membrane in adult zebrafish kidneys. (A) Quantification of the thickness of the GBM in the adult kidney (9–15 mpf) showed no alterations in elmo1−/− compared to littermate elmo1+/+. n = 14–17 per group. Each is the mean thickness per one glomerulus. (B) Quantification of the thickness of the GBM in the adult kidney showed no alterations in elmo2−/− compared to littermate elmo2+/+. n = 12–13 per group. Each is the mean thickness per one glomerulus. (C) Quantification of the thickness of the GBM in the adult kidney showed an increase of the GBM thickness in elmo3−/− compared to littermate elmo3+/+. n = 9–10 per group. Each is the mean thickness per one glomerulus (D–F) Representative electron microscopy images of glomerulus sections of adult zebrafish kidneys of elmo1+/+ and elmo1−/− (D), elmo2+/+ and elmo2−/− (E) and elmo3+/+ and elmo3−/− (F). Exemplarily glomerulus compartments as GBM (arrow), Bowman space (B), endothelial cell nucleus (N), capillary lumen (L), podocyte (P) and erythrocyte (E) are indicated in white. Scale bar is 2 µm. Statistical analysis was done with t-test and Mann-Whitney test. **p < 0.01. ns, not significant; GBM, glomerular basement membrane; mpf, months post fertilization.
Elmo1 Regulates Adult Blood Glucose Homeostasis in Zebrafish
Previous studies have described the ELMO proteins as promotors for RAC1 activity (Gumienny et al., 2001; Brugnera et al., 2002; Katoh and Negishi, 2003; Cetinkaya et al., 2016; Tran et al., 2021) and RAC1 was shown to be an important regulator of the glucose homeostasis by ensuring the vesicular insulin transport by organizing the pancreatic cytoskeleton during glucose induced insulin secretion (Kowluru, 2011; Møller et al., 2019). Furthermore, a lack of RAC1 is associated with insulin resistance in humans and rodents (Sylow et al., 2013; Sylow et al., 2014; Raun et al., 2018) and ELMO2 and RAC1, both regulate the insulin dependent membrane translocation of the glucose transporter 4 (GLUT4) in muscle cells (Sun et al., 2016). To address the question if Elmo1, Elmo2 or Elmo3 maintain glucose homeostasis in zebrafish, whole body glucose content of larval (120 hpf) and blood glucose levels of adult (7–15 mpf) elmo1−/−, elmo2−/−, and elmo3−/− zebrafish were measured (Figure 6). Interestingly, adult blood glucose levels of fasted elmo1−/− zebrafish were decreased compared to elmo1+/+ zebrafish (Figure 6B), whereas postprandial blood glucose levels were increased (Figure 6C). In elmo2−/− and elmo3−/− adult blood glucose levels, both fasting and postprandial, were unaltered compared to elmo2+/+ (Figures 6E,F) and elmo3+/+ (Figures 6H,I) and also the whole body glucose between elmo1−/−, elmo2−/− and elmo3−/−, and elmo1+/+, elmo2+/+ and elmo3+/+ larvae at 120 hpf showed no differences (Figures 6A,D,G). In conclusion, these data have identified an important impact and thereby a novel function of Elmo1 in maintaining the regulation of blood glucose levels in adult zebrafish, thereby functionally differentiating itself from Elmo2 and Elmo3.

FIGURE 6. The loss of Elmo1 led to altered blood glucose levels in adult zebrafish. (A) Whole body glucose levels were not changed in elmo1−/− compared to elmo1+/+ at 120 hpf. n = 8 samples per group, each containing 20 zebrafish larvae. (B) Fasting blood glucose levels were decreased in adult elmo1−/−. (C) Postprandial blood glucose levels were increased in adult elmo1−/−. (D) Whole body glucose levels were not changed in elmo2−/− compared to elmo2+/+ at 120 hpf. n = 6 samples per group, each containing 20 zebrafish larvae. (E,F) Fasting and postprandial blood glucose levels were unaltered in adult elmo2−/−. (G) Whole body glucose levels were not changed in elmo3−/− compared to elmo3+/+ at 120 hpf. n = 9 samples per group, each containing 20 zebrafish larvae. (H,I) Fasting and postprandial blood glucose levels were unaltered in adult elmo3−/−. Blood glucose was obtained from animals of 7–15 mpf. Statistical analysis was done with t-test and Mann-Whitney test. *p < 0.05, **p < 0.01. ns, not significant; hpf, hours post fertilization; mpf, months post fertilization.
Elmo Proteins Transcriptionally Modulate the Vascular and Neuronal Development of Zebrafish Larvae
To identify underlying pathways of the observed alterations in the vasculature, kidney and in glucose homeostasis in elmo1−/−, elmo2−/−, and elmo3−/− zebrafish and to reveal novel cellular mechanisms regulated by the Elmo proteins, we analyzed the regulation of the transcriptome with RNA sequencing data from zebrafish larvae at 120 hpf based on the Kyoto Encyclopedia of Genes and Genomes (KEGG) database for signaling pathways and based on the Gene Ontology Biological Process (GOBP) database for cell processes and mechanisms.
The KEGG based analysis revealed that out of 150 analyzed pathways, 11 were significantly regulated in elmo1−/−, 9 in elmo2−/−, and 62 in elmo3−/− mutants (Supplementary Table S1). These results suggested a strong impact of Elmo3 on the transcriptional regulation compared to the weaker regulation through the loss of Elmo1 or Elmo2. The altered transcriptional regulation of over one third of the analyzed pathways in elmo3−/− zebrafish might be a possible cause for its reduced viability. Interestingly, only three pathways in all three elmo mutants were found to be regulated in the same direction (Ribosome—upregulated; ECM-receptor interaction—downregulated; Focal adhesion—downregulated). Comparisons between two elmo mutants only, also exhibited solely four pathways regulated in the same direction between elmo1 and elmo2, five between elmo1 and elmo3 and three between elmo2 and elmo3, indicating only minor functional similarities in the regulation of the larval transcriptome Elmo1, Elmo2 and Elmo3. The downregulation of ECM-receptor interaction might affect organs depending on a correctly regulated ECM and could be a cause for structural changes as observed in the glomeruli of elmo1−/−, elmo2−/−, and elmo3−/− zebrafish.
GOBP based analyses (Figures 7A–E) showed a downregulation of the vascular development, blood vessel development, blood vessel morphogenesis and angiogenesis mechanisms (Figure 7A) in the transcriptomes of elmo1−/−, elmo2−/−, and elmo3−/− zebrafish larvae, indicating that in early development the transcriptional regulation of the vasculature overlaps. These results correlated with the data of Elmo1 as a promoting factor of the trunk vasculature (Epting et al., 2010; Schäker et al., 2015) and the retinal vasculature (Figure 3) and suggested novel and so far unknown vascular functions of Elmo2 and Elmo3. However, mechanisms related to early kidney formation and function were not significantly regulated in any direction in elmo1−/−, elmo2−/− and elmo3−/− zebrafish larvae (Figure 7B), albeit the data revealed an impact of the three Elmo proteins on the organization of the ECM, which is of major structural importance for the glomeruli and its GBM (Hobeika et al., 2017). These results supported the described function of ELMO1 regulating the expression of ECM components and their modulators (Shimazaki et al., 2005; Shimazaki et al., 2006) and the identified contribution of Elmo3 to the GBM (Figures 5C,F). The mechanisms related to glucose homeostasis were not significantly changed in larval elmo1−/− and elmo2−/− zebrafish (Figure 7C). Surprisingly, the elmo3−/− larval data exhibited a downregulated cellular response to insulin and pancreas development. Lastly, the transcriptome data revealed a transcriptional regulation of the three Elmo proteins on the nervous system process and neuronal development, which were upregulated in elmo1−/− and elmo3−/− (Figure 7E). This again correlated with known data of the ELMO proteins to regulate (Katoh and Negishi, 2003; Biersmith et al., 2011; Namekata et al., 2012; Lanoue et al., 2013; Makihara et al., 2018; Mikdache et al., 2019; Tran et al., 2021) and inhibit (Franke et al., 2012) neuronal development and revealed again a divergent function of Elmo1 and Elmo3 to Elmo2 in these processes.
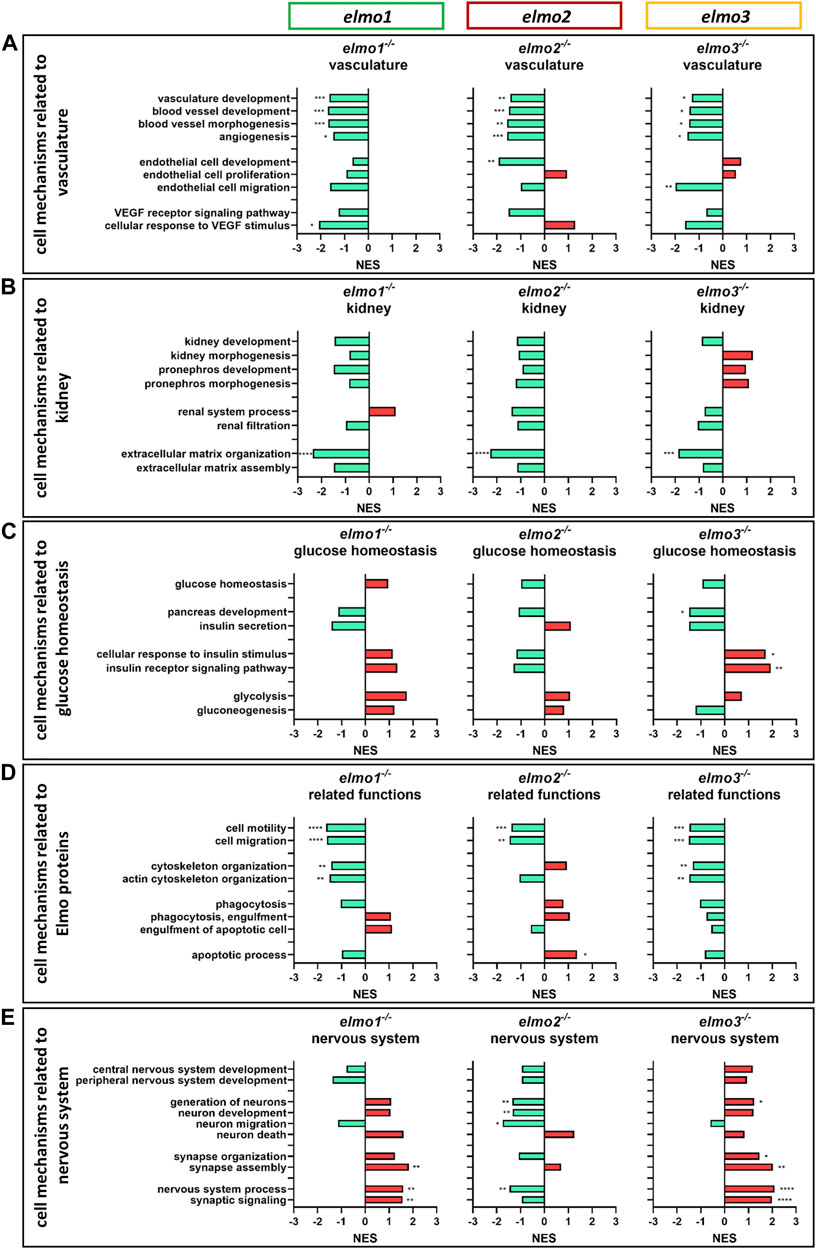
FIGURE 7. The loss of Elmo1, Elmo2 and Elmo3 led to similar and different changes in the regulation of the transcriptome in larval zebrafish. Comparison of the regulation of cell mechanisms in elmo1−/−, elmo2−/− and elmo3−/− zebrafish larvae, respectively, compared to elmo1+/+, elmo2+/+ and elmo3+/+. Gene Ontology Biological Process (GOBP) based analysis of cell mechanisms of the transcriptome using RNA-sequencing data from zebrafish larvae at 120 hpf. n = 6 samples per genotype, each containing 30 zebrafish larvae. Regulation of the gene sets is given as normalized enrichment score (NES). (A) Cell mechanisms related to vascular development were generally downregulated in elmo1−/−, elmo2−/− and elmo3−/−. (B) Cell mechanisms related to kidney development and function showed a downregulation of extracellular matrix organization in elmo1−/−, elmo2−/− and elmo3−/−. (C) Cell mechanisms related to glucose homeostasis were differently regulated in elmo3−/−. (D) Cell mechanisms related to further functions of Elmo proteins showed a general downregulation in elmo1−/− and elmo3−/− and different changes in elmo2−/−. (E) Cell mechanisms related to the nervous system were generally upregulated in elmo1−/− and elmo3−/− and downregulated in elmo2−/−. hpf, hours post fertilization; NES, normalized enrichment score.
In conclusion, these transcriptome analyses identified Elmo3 as an important transcriptional regulator in zebrafish larvae and highlight the three Elmo proteins as promotive factors for vascular development and regulators of the nervous system.
The Loss of Elmo1 Led to an Increase of Amino Acids and the Loss of Elmo2 to an Increase of Fatty Acids in the Larval Metabolome
Because the transcriptome analysis exhibited several regulated pathways related to metabolic processes in elmo3−/− larvae (Supplementary Table S1), we subsequently assessed if the metabolome is affected through the loss of Elmo1, Elmo2 or Elmo3 by measuring different parts of the metabolome in elmo1−/−, elmo2−/−, and elmo3−/− larvae at 96 hpf (Supplementary Figures S7–S10). Surprisingly, the metabolome of elmo3−/− larvae just showed few changes (Supplementary Figures S7–S10) and did not well correlate with the transcriptional data. ADP and ATP were decreased in elmo3−/− compared to elmo3+/+ (Supplementary Figure S9C) which was also the case in elmo1−/− compared to elmo1+/+ larvae (Supplementary Figure S9A), suggesting a similar role in the regulation of the larval energy maintenance. However, elmo1−/− exhibited an increase of nine amino acids (Asp, Glu, Asn, Thr, Ala, Pro, Val, Ile, Leu) compared to elmo1+/+ (Supplementary Figure S7A), whereas elmo2−/− (Supplementary Figure S7B) and elmo3−/− revealed hardly any changes (Supplementary Figure S7C). Measuring fatty acids showed an increase of eight fatty acids in elmo2−/− compared to elmo2+/+ (Supplementary Figure S8B), while there were nearly no changes in elmo1−/− (Supplementary Figure S8A) and elmo3−/− (Supplementary Figure S8C). Both results indicate that Elmo1, Elmo2, and Elmo3 functionally diverge. Overall, the metabolome analyses of the elmo1−/−, elmo2−/−, and elmo3−/− larvae have not identified the Elmo proteins as major metabolic regulators.
Discussion
In this study, we established elmo1, elmo2 and elmo3 gene knockout zebrafish lines and performed comparative morphological, metabolic and transcriptome analyses. The data (Figure 8) showed that despite few similarities, elmo1−/−, elmo2−/−, and elmo3−/− zebrafish exhibited several different morphological changes in retina and kidney as well as alterations in the glucose homeostasis. These distinct findings suggest that the three Elmo proteins regulate similar and divergent biological processes and mechanisms and have a low functional redundancy.

FIGURE 8. Comparison of elmo1−/−, elmo2−/− and elmo3−/− phenotype in zebrafish indicates different functions of Elmo1, Elmo2 and Elmo3. Overview and comparison of the results of the phenotypical analysis of elmo1−/−, elmo2−/− and elmo3−/− zebrafish in larval and adult stages indicate that Elmo1, Elmo2 and Elmo3 have not the same role in the regulation of the organism. Listed are all fields which were analyzed in this study and their outcome in the specific zebrafish line. Results are visualized with arrows and bars. Arrow up (red) indicates an increase, arrow down (green) indicates a decrease, one arrow up and one arrow down at once indicate different changes, bar (grey) indicates no change. GBM, glomerular basement membrane.
In zebrafish, Elmo1 promotes early vascular development (Epting et al., 2010; Schäker et al., 2015). Our data strengthen this role of Elmo1 as a promotor of vascular formation by showing an impaired vascular sprouting additional to a decreased vascular formation in the retina of elmo1−/− zebrafish. An increased vessel thickness in larval hyaloids further suggests an impact of Elmo1 on vessel structure, expanding its regulatory capability in the vasculature. Interestingly, elmo1−/− zebrafish did not show vascular malformations in the larval trunk as described in a transient knockdown (Epting et al., 2010), which might be explained due to compensatory mechanisms occurring in permanent knockout models (El-Brolosy and Stainier, 2017; El-Brolosy et al., 2019). The promotive vascular function of Elmo1 was further supported through the larval transcriptome data showing the downregulation of vascular developmental processes. Interestingly, elmo2−/− and elmo3−/− zebrafish both exhibited a similar transcriptional regulation of the vasculature as seen in elmo1−/−. In addition, individual changes in the vasculature were observed in two of the three knockout animals, as decreased vascular sprouting in adult retinae and an increased vessel diameter in larval hyaloids. Surprisingly, the adult retinae in elmo3−/− revealed an increased vascular formation, thereby showing an opposing change to elmo1−/−. These findings indicate partially overlapping vascular functions of the three Elmo proteins; however, the varieties in the vascular phenotypes of elmo1−/−, elmo2−/− and elmo3−/− also demonstrate differences in the regulation of vascular morphogenesis.
The second important observation of the study was the identification of an impact of Elmo1, Elmo2 and Elmo3 on the morphogenesis of glomerular structures. We observed changes in the form of an increased bowman space in elmo1−/−, increased bowman space and glomerular hypertrophy in elmo2−/− and an increased GBM thickness in elmo3−/−. These changes all are associated with pathologic kidney development. Glomerular hypertrophy can indicate hypertension (Wolf and Ziyadeh, 1999; Habib, 2018) and an increased GBM thickness is commonly associated with a reduced glomerular filtration rate (Thomson et al., 2008). Although the transcriptomes of elmo1−/−, elmo2−/−, and elmo3−/− zebrafish larvae exhibited unaltered processes associated with kidney development and function, the process of ECM organization and the ECM-receptor interaction pathway were strongly downregulated. These findings are now added to the described function of Elmo1 to regulate the ECM (Shimazaki et al., 2005; Shimazaki et al., 2006) and revealed novel insights into the involvement of Elmo2 and Elmo3 in ECM organization. Previous studies have shown that ELMO1 is linked to dysregulation of ECM, the primary component of the glomeruli and their GBM (Miner, 2012; Byron et al., 2014), resulting in structural changes in glomeruli and the GBM in particular (Shimazaki et al., 2006; Hathaway et al., 2016). Thus, Elmo2 and Elmo3 share a similar function with Elmo1 in regulating ECM proteins and all three proteins individually affect the glomerular morphogenesis and thereby the kidney health.
In addition the study identified Elmo1 as a novel glucose homeostasis regulator. Specifically, elmo1−/− zebrafish exhibited a decreased fasting and an increased postprandial blood glucose.
Consistent with the morphological findings in vasculature and kidney, our results of the transcriptome analysis showed parallels between elmo1−/−, elmo2−/− and elmo3−/− zebrafish as well as several differences. Comparing the regulation of biological processes, multiple transcriptional patterns were shared between elmo1−/−, elmo2−/− and elmo3−/− zebrafish larvae. Accordingly, cell motility, vascular development and extracellular matrix organization were equally downregulated. Furthermore, individual processes were similarly regulated only between elmo1−/− and elmo3−/−, whereas elmo2−/− showed no or the opposite changes, as in cytoskeleton organization or nervous system process indicating functional similarities just between two of the three Elmo proteins. Additionally, this analysis revealed multiple distinct findings of the individual Elmo proteins, such as the increased apoptotic process in elmo2−/− or the increased response to insulin stimulus in elmo3−/−, suggesting independent functions. Considering the total transcriptional regulation of signaling pathways, similarities appear only as exceptions as most pathways show different regulation patterns. In elmo1−/−, elmo2−/−, and elmo3−/− zebrafish, just three pathways showed a similar regulation, and only four pathways were regulated in parallel between elmo1−/− and elmo2−/−, five between elmo1−/− and elmo3−/− and three between elmo2−/− and elmo3−/−. Especially the dysregulation of one third of the analyzed pathways in the larval transcriptome of elmo3−/− zebrafish compared to elmo3+/+ demonstrated a functional difference between the three Elmo proteins, as elmo1−/− and elmo2−/− showed a significantly smaller number of altered pathways. These overlapping findings of the morphologic and transcriptomic investigations are further supported by the metabolome analyses.
In conclusion, although all three Elmo proteins are guanine nucleotide exchange factors for Rac1, each individual Elmo protein possesses distinct functions, separating it from the other two. Therefore, they cannot be considered as functional homologues.
Materials and Methods
Study Approval
All experimental procedures on animals were approved by the local government authority, Regierungspräsidium Karlsruhe and by Medical Faculty Mannheim (license no: G-98/15 and I-19/02) and carried out in accordance with the approved guidelines.
Zebrafish Husbandry
The zebrafish line Tg(fli1:EGFP) (Lawson and Weinstein, 2002) was used and raised as described (Kimmel et al., 1995) in normal husbandry environment. Tg(fli1:EGFP) was chosen because of its EGFP expressing endothelial cells. Embryos and larvae until 120 hpf were kept in egg water at 28.5°C with or without PTU (0.003%) to suppress pigmentation. Larvae older than 120 hpf and adult zebrafish were held in a 13-h light/11-h dark cycle. Zebrafish older than 90 days are referred to as adults. Adults were fed twice a day, fresh Artemia Salina in the morning and fish flake food at midday.
Mutant Generation
To use the CRISPR/Cas9 system to generate mutations, guide RNA (gRNA) to target the zebrafish genes elmo1 (exon 2), elmo2 (exon 9) and elmo3 (exon 2) were designed with ZiFiT Targeter Version 4.2 (primer are listed in Supplementary Table S2). It was cloned into a T7-driven promotor expression vector (pT7-gRNA; Addgene) for each gene, respectively. To generate mRNA, in vitro transcription was done. For the produced gRNA vector the T7 mMessage mMachine Kit (Invitrogen) was used and to get Cas9 mRNA the T3 MEGAshortscript Kit (Invitrogen) was used on a pT3TS-nCas9n vector (Addgene) following the protocol of the manufacturer. To generate the single knockout mutants, 1 nl KCl (0.1 M) solution containing gRNA (250 pg/nl) and Cas9 mRNA (200 pg/nl) was injected into the single cell stadium of an embryo (Jao et al., 2013). The injected F0 fish were analyzed for germline transmission and the mutated fish were crossed with Tg(fli1:EGFP) to generate heterozygous mutants. Genotyping was performed through Sanger sequencing or gel electrophoretic separation of PCR products (primer are listed in Supplementary Table S2). Sequencing results were analyzed with benchling (benchling.com) and PolyPeakParser (Hill et al., 2014).
Preparation of Adult Zebrafish and Blood Glucose Measurement
For experiments with animals with a gene knockout, littermates were always used as control. Adult zebrafish were put into single boxes in the afternoon the day before preparation. Blood glucose measurement was either done after 21–23 h fasting or postprandial after feeding 1 h with 0.5 g flakes following 1 h in fresh water without food. Before blood glucose measurement and preparation fish were euthanized in an ice-cold water bath for 2 min. Blood was directly taken from the caudal vessel and measured with a glucometer (Freestyle Abbott) (Zang et al., 2015). Subsequently, fish were decapitated and transferred into ice-cold PBS for organ isolation. Organs were either snap frozen in liquid nitrogen for RNA isolation or put in 4% PFA/PBS for 24 h for visualization via confocal microscopy and periodic acid-Schiff (PAS) staining or in 3% glutaraldehyde in cacodylate (0.1 M, pH 7.4) for visualization via electron microscopy.
Microscopy and Analysis of Vascular Structures in Larvae and Adults
Vascular structures of larval and adult zebrafish were imaged with the confocal fluorescence microscope (Leica DM6000 B) with a scanner (Leica TCS SP5 DS) using a 20 × 0.7 objective. Images were analyzed with Leica Application Suite X and ImageJ.
For analysis of the larval trunk vasculature, larvae at 32 and 96 hpf were anaesthetized in 0.003% tricaine and observed with a Leica MSV269. The first six intersegmental vessels (ISVs) were skipped. The next 17 ISVs on both sides of the larva were observed for deformations and additional sprouts. Imaging was done as described above.
For analysis of the hyaloid vasculature, larvae at 120 hpf were anaesthetized in 0.003% tricaine and fixated in 4% PFA/PBS for 24 h. Afterwards fixated larvae were incubated in 0.25% Trypsin/EDTA solution buffered with TRIS HCl (1.5 M, pH 7.8) for 80 min at room temperature during gentle movement on a shaker. Subsequently, larvae were washed three times for 10 min with PBS and stored in PBS at 4°C until preparation. Hyaloids were isolated on an agarose plate and placed and on an object slide in a drop of water. Imaging was done as described above.
Imaging the adult retina vasculature was done as described (Wiggenhauser et al., 2017). For preparation, the fixated eye was transferred into cold PBS on an agarose plate for dissection. The retina was isolated and put on PBS on an object slide, cut and covered in mounting medium with a cover slip. Imaging was done as described above.
Analysis of Kidney Morphology
For analysis of the glomerular structure, kidneys were fixated in 4% PFA/PBS in preparation for PAS staining. Fixated kidneys were embedded in paraffin and cut in 4 µm thick sections with a Leica RM2235 microtome and placed on an object slide. After deparaffinization, sections were put in 1% periodic acid for 10 min, washed in distilled water and put Schiff’s reagent for 20 min, followed by three times for 2 min in SO2 water. Afterwards sections were rinsed in running tap water, stained in hematoxylin solution and rinsed again, each for 5 min. Stained sections were dehydrated with ethanol solutions and mounted with mounting medium. Brightfield imaging was done with a scanner (Zeiss Axio Scan.Z1). Analysis of glomerular structure was done as described previously (Wiggenhauser et al., 2022). In brief, just sections were used at the point or near the point where the arterioles go into or out of the glomerulus to thereby try to analyze the glomerulus at its most concentric point as possible to obtain maximal comparability. For analysis the software ImageJ was used. Area size measurements were done with the Measure and with the Threshold tool. Nuclei numbers were counted manually.
For analysis of the glomerular basement membrane, kidneys were fixated in 3% glutaraldehyde in cacodylate (0.1 M, pH 7.4), cut in 1 mm3 pieces and postfixed in 1% aqueous osmium tetroxide for 1 h at 4°C. Subsequently, they were rinsed with water, dehydrated using ethanol solutions, transferred into propylene oxide and embedded in Epoxy resin (glycidether 100). With an ultramicrotome (Reichert Ultracut E) semithin (1 µm) and ultrathin sections (60–80 nm) were cut. To identify the glomeruli, the semithin sections were stained with methylene blue and analyzed under a light microscope (Olympus) at ×200 magnification. Ultrathin sections were treated with uranyl acetate and lead citrate and examined with a transmission electron microscope (JEM 1400), equipped with a 2k TVIPS CCD camera (TemCam F216) at ×3,000–×10,000 magnification. Analysis was done with EMMeasure.
Collection of Zebrafish Larval Samples
If not described differently, zebrafish larvae were anaesthetized in 0.003% tricaine, collected and snap frozen in liquid nitrogen. Homogenization was achieved with a 1 ml syringe and a 25 G needle.
Whole Body Glucose Measurement in Larvae
Twenty larvae at 120 hpf were collected per sample. Samples were homogenized in assay buffer. A glucose assay (MAK263, Sigma-Aldrich) was used to determine the glucose levels following the protocol of the manufacturer. Fluorometric detection was achieved with a plate reader (Tecan Infinite M200).
Reverse-Transcription Polymerase Chain Reaction
Thirty larvae were collected per sample. Samples were homogenized in 1% 2-mercaptoethanol in RLT buffer. Total RNA was isolated with the RNeasy Mini Kit (Qiagen) following the protocol of the manufacturer. cDNA was synthesized from 1 µg RNA with the Maxima First Strand cDNA Synthesis Kit (Thermo Fisher Scientific) according to the protocol of the manufacturer. Standard PCRs were applied with the generated cDNA. Mutations (deletion or insertion) were made visible through gel electrophoretic separation of PCR products (primer are listed in Supplementary Table S2).
Reverse-Transcription Quantitative Polymerase Chain Reaction
Thirty larvae or one total organ was collected per sample. Samples were homogenized in 1% 2-mercaptoethanol in RLT buffer. Total RNA was isolated with the RNeasy Mini Kit (Qiagen) following the protocol of the manufacturer. cDNA was synthesized from 1 µg RNA with the Maxima First Strand cDNA Synthesis Kit (Thermo Fisher Scientific) according to the protocol of the manufacturer. For RT-qPCR Power SYBR™ Green PCR Master Mix Kit (Thermo Fisher Scientific) and 96 well reaction plates were used with a QuantStudio™ 3 Real-Time PCR System (Thermo Fisher Scientific) (primer are listed in Supplementary Table S2).
RNA-Sequencing and Transcriptome Analysis
Thirty larvae at 120 hpf were collected per sample. Samples were homogenized in 1% 2-mercaptoethanol in RLT buffer. Total RNA was isolated with the RNeasy Mini Kit (Qiagen) following the protocol of the manufacturer. Library construction and sequencing were performed by the Beijing Genomic Institution (BGI) with a BGISEQ-500. Sequencing analysis was performed by the Next-Generation Sequencing (NGS) Core Facility of the medical faculty Mannheim as described (Lou et al., 2020). Raw RNA sequencing data are available at GEO (Gene Expression Omnibus, NCBI) under the accession number: GSE197827.
Metabolome Analysis
For sample collection, zebrafish larvae at 96 hpf were anaesthetized in 0.003% tricaine, collected and snap frozen in liquid nitrogen. Forty larvae were collected per sample. Measurements of amino acids, fatty acids, adenosine compounds and glutathione were performed by the Metabolomics Core Technology Platform from the Centre of Organismal Studies Heidelberg as described before (Lodd et al., 2019).
Protein Sequence Alignment
Amino acid sequence alignment was achieved with the UniProt Align tool (https://www.uniprot.org/align/) with zebrafish Elmo1 (UniProt ID: Q6NV39), Elmo2 (UniProt ID: A0A0G2KRJ3) and Elmo3 (UniProt ID: F1QSV8) and human ELMO1 (UniProt ID: Q92556), ELMO2 (UniProt ID: Q96JJ3) and ELMO3 (UniProt ID: Q96BJ8).
Statistics
Data are given as mean with standard deviation. For the comparison of two groups of data, datasets were tested for Gaussian distribution. Then statistical significance between those groups was analyzed with the t-test (if data was normally distributed) or with the Mann-Whitney test (if data was not normally distributed). To determine statistical significance between the genotype distribution of zebrafish lines and the mendelian inheritance, the chi square test was applied. To determine statistical significance between the survival of zebrafish lines, a logrank test was applied. p-values were given as: *p < 0.05, **p < 0.01, ***p < 0.001, ****p < 0.0001. GraphPad Prism 9.3.1 was used for statistical analyses.
Data Availability Statement
The datasets presented in this study can be found in online repositories. The name of the repository and accession number can be found below: NCBI Gene Expression Omnibus; accession number GSE197827.
Ethics Statement
The animal study was reviewed and approved by Regierungspräsidium Karlsruhe (G-98/15) and Medical Faculty Mannheim—Heidelberg University (I-19/02).
Author Contributions
MB designed this study, performed experiments, analyzed data and wrote the manuscript. KB performed mutation validations on RNA level and trunk analysis. DPW performed RT-qPCR experiments and trunk analysis. IH performed histological analysis and electron microscopy of zebrafish kidneys. CS analyzed RNA sequencing data. GP performed metabolome experiments and analyzed data. JK conceived and designed this study and wrote the manuscript.
Funding
The study was supported by grants from the Deutsche Forschungsgemeinschaft: IRTG 1874/2 DIAMICOM project SP9, SFB1118 project B01 and grant ZUK 40/2010–3,009,262.
Conflict of Interest
The authors declare that the research was conducted in the absence of any commercial or financial relationships that could be construed as a potential conflict of interest.
Publisher’s Note
All claims expressed in this article are solely those of the authors and do not necessarily represent those of their affiliated organizations, or those of the publisher, the editors and the reviewers. Any product that may be evaluated in this article, or claim that may be made by its manufacturer, is not guaranteed or endorsed by the publisher.
Acknowledgments
The authors thank Markus Hecker and Hans-Peter Hammes for conceptual advice. The authors thank Bowen Lou, Christoph Tabler, Haozhe Qi, Silvana Hengler, and Paulus Wohlfart for conceptual and technological help and advice, Andrea Döbler and Ulrike Ganserer for performance and analysis of electron microscopy images and Carolina De La Torre for RNA quality control and advice. The authors thank Michael Büttner, Katja Machemer-Noonan, Elena Heidenreich and the Metabolomics Core Technology Platform of the Excellence cluster “CellNetworks” (University of Heidelberg) for support with UPLC-based metabolite quantification, Johannes Gschwind and Hannes Ott for experimental help and Björn Hühn for zebrafish maintenance. We also acknowledge the support of the LIMa Live Cell Imaging Mannheim at Microscopy Core Facility Platform Mannheim (CFPM) and the Zebrafish Core Facility Mannheim.
Supplementary Material
The Supplementary Material for this article can be found online at: https://www.frontiersin.org/articles/10.3389/fcell.2022.918529/full#supplementary-material
References
Alberto Ramirez-Garcia, S., Charles-Niño, C., Mazariegos-Rubí, M., Rosalba Topete-González, L., Topete-González, R., Javier Flores-Alvarado, L., et al. (2015). Asociación del gen ELMO1 (snp rs1345365) con el desarrollo de diabetes mellitus tipo 2 en población mestiza Mexicana. Invest. Clin. 56, 341–355.
Arandjelovic, S., Perry, J. S. A., Zhou, M., Ceroi, A., Smirnov, I., Walk, S. F., et al. (2021). ELMO1 Signaling Is a Promoter of Osteoclast Function and Bone Loss. Nat. Commun. 12, 4974. doi:10.1038/s41467-021-25239-6
Bento, J. L., Palmer, N. D., Zhong, M., Roh, B., Lewis, J. P., Wing, M. R., et al. (2008). Heterogeneity in Gene Loci Associated with Type 2 Diabetes on Human Chromosome 20q13.1. Genomics 92, 226–234. doi:10.1016/j.ygeno.2008.06.004
Biersmith, B., Liu, Z., Bauman, K., and Geisbrecht, E. R. (2011). The DOCK Protein Sponge Binds to ELMO and Functions in Drosophila Embryonic CNS Development. PLoS ONE 6, e16120. doi:10.1371/journal.pone.0016120
Bowzard, J. B., Cheng, D., Peng, J., and Kahn, R. A. (2007). ELMOD2 Is an Arl2 GTPase-Activating Protein that Also Acts on Arfs. J. Biol. Chem. 282, 17568–17580. doi:10.1074/jbc.M701347200
Brugnera, E., Haney, L., Grimsley, C., Lu, M., Walk, S. F., Tosello-Trampont, A.-C., et al. (2002). Unconventional Rac-GEF Activity Is Mediated through the Dock180-ELMO Complex. Nat. Cell Biol. 4, 574–582. doi:10.1038/ncb824
Byron, A., Randles, M. J., Humphries, J. D., Mironov, A., Hamidi, H., Harris, S., et al. (2014). Glomerular Cell Cross-Talk Influences Composition and Assembly of Extracellular Matrix. J. Am. Soc. Nephrol. 25, 953–966. doi:10.1681/ASN.2013070795
Cetinkaya, A., Xiong, J. R., Vargel, İ., Kösemehmetoğlu, K., Canter, H. İ., Gerdan, Ö. F., et al. (2016). Loss-of-Function Mutations in ELMO2 Cause Intraosseous Vascular Malformation by Impeding RAC1 Signaling. Am. J. Hum. Genet. 99, 299–317. doi:10.1016/j.ajhg.2016.06.008
Dabrowska, M., Juzwa, W., Krzyzosiak, W. J., and Olejniczak, M. (2018). Precise Excision of the CAG Tract from the Huntingtin Gene by Cas9 Nickases. Front. Neurosci. 12, 75. doi:10.3389/fnins.2018.00075
Denecke, J., Kranz, C., Kemming, D., Koch, H.-G., and Marquardt, T. (2004). An Activated 5' Cryptic Splice Site in the Human ALG3 Gene Generates a Premature Termination Codon Insensitive to Nonsense-Mediated mRNA Decay in a New Case of Congenital Disorder of Glycosylation Type Id (CDG-Id). Hum. Mutat. 23, 477–486. doi:10.1002/humu.20026
East, M. P., Bowzard, J. B., Dacks, J. B., and Kahn, R. A. (2012). ELMO Domains, Evolutionary and Functional Characterization of a Novel GTPase-Activating Protein (GAP) Domain for Arf Protein Family GTPases. J. Biol. Chem. 287, 39538–39553. doi:10.1074/jbc.M112.417477
El-Brolosy, M. A., Kontarakis, Z., Rossi, A., Kuenne, C., Günther, S., Fukuda, N., et al. (2019). Genetic Compensation Triggered by Mutant mRNA Degradation. Nature 568, 193–197. doi:10.1038/s41586-019-1064-z
El-Brolosy, M. A., and Stainier, D. Y. R. (2017). Genetic Compensation: A Phenomenon in Search of Mechanisms. PLoS Genet. 13, e1006780. doi:10.1371/journal.pgen.1006780
Elliott, M. R., Zheng, S., Park, D., Woodson, R. I., Reardon, M. A., Juncadella, I. J., et al. (2010). Unexpected Requirement for ELMO1 in Clearance of Apoptotic Germ Cells In Vivo. Nature 467, 333–337. doi:10.1038/nature09356
Epting, D., Wendik, B., Bennewitz, K., Dietz, C. T., Driever, W., and Kroll, J. (2010). The Rac1 Regulator ELMO1 Controls Vascular Morphogenesis in Zebrafish. Circulation Res. 107, 45–55. doi:10.1161/CIRCRESAHA.109.213983
Fan, W., Yang, H., Xue, H., Sun, Y., and Zhang, J. (2015). ELMO3 Is a Novel Biomarker for Diagnosis and Prognosis of Non-small Cell Lung Cancer. Int. J. Clin. Exp. Pathol. 8, 5503–5508.
Franke, K., Otto, W., Johannes, S., Baumgart, J., Nitsch, R., and Schumacher, S. (2012). miR-124-regulated RhoG Reduces Neuronal Process Complexity via ELMO/Dock180/Rac1 and Cdc42 Signalling. EMBO J. 31, 2908–2921. doi:10.1038/emboj.2012.130
Geisbrecht, E. R., Haralalka, S., Swanson, S. K., Florens, L., Washburn, M. P., and Abmayr, S. M. (2008). Drosophila ELMO/CED-12 Interacts with Myoblast City to Direct Myoblast Fusion and Ommatidial Organization. Dev. Biol. 314, 137–149. doi:10.1016/j.ydbio.2007.11.022
Grimsley, C. M., Kinchen, J. M., Tosello-Trampont, A.-C., Brugnera, E., Haney, L. B., Lu, M., et al. (2004). Dock180 and ELMO1 Proteins Cooperate to Promote Evolutionarily Conserved Rac-dependent Cell Migration. J. Biol. Chem. 279, 6087–6097. doi:10.1074/jbc.M307087200
Gumienny, T. L., Brugnera, E., Tosello-Trampont, A.-C., Kinchen, J. M., Haney, L. B., Nishiwaki, K., et al. (2001). CED-12/ELMO, a Novel Member of the CrkII/Dock180/Rac Pathway, Is Required for Phagocytosis and Cell Migration. Cell 107, 27–41. doi:10.1016/s0092-8674(01)00520-7
Habib, S. L. (2018). Kidney Atrophy vs Hypertrophy in Diabetes: Which Cells Are Involved? Cell Cycle 17, 1683–1687. doi:10.1080/15384101.2018.1496744
Hamoud, N., Tran, V., Croteau, L.-P., Kania, A., and Côté, J.-F. (2014). G-protein Coupled Receptor Bai3 Promotes Myoblast Fusion in Vertebrates. Proc. Natl. Acad. Sci. U.S.A. 111, 3745–3750. doi:10.1073/pnas.1313886111
Hanson, R. L., Millis, M. P., Young, N. J., Kobes, S., Nelson, R. G., Knowler, W. C., et al. (2010). ELMO1 Variants and Susceptibility to Diabetic Nephropathy in American Indians. Mol. Genet. Metabolism 101, 383–390. doi:10.1016/j.ymgme.2010.08.014
Hathaway, C. K., Chang, A. S., Grant, R., Kim, H.-S., Madden, V. J., Bagnell, C. R., et al. (2016). High Elmo1 Expression Aggravates and Low Elmo1 Expression Prevents Diabetic Nephropathy. Proc. Natl. Acad. Sci. U.S.A. 113, 2218–2222. doi:10.1073/pnas.1600511113
Haymerle, G., Kadletz, L., Wiebringhaus, R., Golabi, B., Mildner, M., Thurnher, D., et al. (2017). ELMO3 Predicts Poor Outcome in T1 Laryngeal Cancer. Clin. Otolaryngol. 42, 1181–1186. doi:10.1111/coa.12845
Hill, J. T., Demarest, B. L., Bisgrove, B. W., Su, Y. C., Smith, M., and Yost, H. J. (2014). Poly Peak Parser: Method and Software for Identification of Unknown Indels Using Sanger Sequencing of Polymerase Chain Reaction Products. Dev. Dyn. 243, 1632–1636. doi:10.1002/dvdy.24183
Hobeika, L., Barati, M. T., Caster, D. J., McLeish, K. R., and Merchant, M. L. (2017). Characterization of Glomerular Extracellular Matrix by Proteomic Analysis of Laser-Captured Microdissected Glomeruli. Kidney Int. 91, 501–511. doi:10.1016/j.kint.2016.09.044
Hu, Y., Yu, Q., Zhong, Y., Shen, W., Zhou, X., Liu, X., et al. (2018). Silencing ELMO3 Inhibits the Growth, Invasion, and Metastasis of Gastric Cancer. BioMed Res. Int. 2018, 3764032. doi:10.1155/2018/3764032
Inácio, Â., Silva, A. L., Pinto, J., Ji, X., Morgado, A., Almeida, F., et al. (2004). Nonsense Mutations in Close Proximity to the Initiation Codon Fail to Trigger Full Nonsense-Mediated mRNA Decay. J. Biol. Chem. 279, 32170–32180. doi:10.1074/jbc.M405024200
Jao, L.-E., Wente, S. R., and Chen, W. (2013). Efficient Multiplex Biallelic Zebrafish Genome Editing Using a CRISPR Nuclease System. Proc. Natl. Acad. Sci. U.S.A. 110, 13904–13909. doi:10.1073/pnas.1308335110
Kadletz, L., Heiduschka, G., Wiebringhaus, R., Gurnhofer, E., Kotowski, U., Haymerle, G., et al. (2017). ELMO3 Expression Indicates a Poor Prognosis in Head and Neck Squamous Cell Carcinoma - a Short Report. Cell Oncol. 40, 193–198. doi:10.1007/s13402-016-0310-8
Katoh, H., and Negishi, M. (2003). RhoG Activates Rac1 by Direct Interaction with the Dock180-Binding Protein Elmo. Nature 424, 461–464. doi:10.1038/nature01817
Kimmel, C. B., Ballard, W. W., Kimmel, S. R., Ullmann, B., and Schilling, T. F. (1995). Stages of Embryonic Development of the Zebrafish. Dev. Dyn. 203, 253–310. doi:10.1002/aja.1002030302
Komander, D., Patel, M., Laurin, M., Fradet, N., Pelletier, A., Barford, D., et al. (2008). An α-Helical Extension of the ELMO1 Pleckstrin Homology Domain Mediates Direct Interaction to DOCK180 and Is Critical in Rac Signaling. Mol. Biol. Cell 19, 4837–4851. doi:10.1091/mbc.e08-04-0345
Kowluru, A. (2011). Friendly, and Not So Friendly, Roles of Rac1 in Islet β-cell Function: Lessons Learnt from Pharmacological and Molecular Biological Approaches. Biochem. Pharmacol. 81, 965–975. doi:10.1016/j.bcp.2011.01.013
Lanoue, V., Usardi, A., Sigoillot, S. M., Talleur, M., Iyer, K., Mariani, J., et al. (2013). The Adhesion-GPCR Bai3, a Gene Linked to Psychiatric Disorders, Regulates Dendrite Morphogenesis in Neurons. Mol. Psychiatry 18, 943–950. doi:10.1038/mp.2013.46
Lawson, N. D., and Weinstein, B. M. (2002). In Vivo imaging of Embryonic Vascular Development Using Transgenic Zebrafish. Dev. Biol. 248, 307–318. doi:10.1006/dbio.2002.0711
Leak, T. S., Perlegas, P. S., Smith, S. G., Keene, K. L., Hicks, P. J., Langefeld, C. D., et al. (2009). Variants in Intron 13 of theELMO1Gene Are Associated with Diabetic Nephropathy in African Americans. Ann. Hum. Genet. 73, 152–159. doi:10.1111/j.1469-1809.2008.00498.x
Liu, R., Lee, K., and He, J. C. (2015). Genetics and Epigenetics of Diabetic Nephropathy. Kidney Dis. 1, 42–51. doi:10.1159/000381796
Lodd, E., Wiggenhauser, L. M., Morgenstern, J., Fleming, T. H., Poschet, G., Büttner, M., et al. (2019). The Combination of Loss of Glyoxalase1 and Obesity Results in Hyperglycemia. JCI Insight 4, e126154. doi:10.1172/jci.insight.126154
Lou, B., Boger, M., Bennewitz, K., Sticht, C., Kopf, S., Morgenstern, J., et al. (2020). Elevated 4-hydroxynonenal Induces Hyperglycaemia via Aldh3a1 Loss in Zebrafish and Associates with Diabetes Progression in Humans. Redox Biol. 37, 101723. doi:10.1016/j.redox.2020.101723
Lu, M., Kinchen, J. M., Rossman, K. L., Grimsley, C., deBakker, C., Brugnera, E., et al. (2004). PH Domain of ELMO Functions in Trans to Regulate Rac Activation via Dock180. Nat. Struct. Mol. Biol. 11, 756–762. doi:10.1038/nsmb800
Makihara, S., Morin, S., Ferent, J., Côté, J.-F., Yam, P. T., and Charron, F. (2018). Polarized Dock Activity Drives Shh-Mediated Axon Guidance. Dev. Cell 46, 410–425.e7. doi:10.1016/j.devcel.2018.07.007
Mehawej, C., Hoischen, A., Farah, R. A., Marey, I., David, M., Stora, S., et al. (2018). Homozygous Mutation in ELMO2 May Cause Ramon Syndrome. Clin. Genet. 93, 703–706. doi:10.1111/cge.13166
Mikdache, A., Fontenas, L., Albadri, S., Revenu, C., Loisel-Duwattez, J., Lesport, E., et al. (2019). Elmo1 Function, Linked to Rac1 Activity, Regulates Peripheral Neuronal Numbers and Myelination in Zebrafish. Cell. Mol. Life Sci. 77, 161–177. doi:10.1007/s00018-019-03167-5
Miner, J. H. (2012). The Glomerular Basement Membrane. Exp. Cell Res. 318, 973–978. doi:10.1016/j.yexcr.2012.02.031
Møller, L. L. V., Klip, A., and Sylow, L. (2019). Rho GTPases-Emerging Regulators of Glucose Homeostasis and Metabolic Health. Cells 8, 434. doi:10.3390/cells8050434
Namekata, K., Watanabe, H., Guo, X., Kittaka, D., Kawamura, K., Kimura, A., et al. (2012). Dock3 Regulates BDNF-TrkB Signaling for Neurite Outgrowth by Forming a Ternary Complex with Elmo and RhoG. Genes cells. 17, 688–697. doi:10.1111/j.1365-2443.2012.01616.x
Pan, C., Zhang, Y., Meng, Q., Dai, G., Jiang, Z., and Bao, H. (2019). Down Regulation of the Expression of ELMO3 by COX2 Inhibitor Suppresses Tumor Growth and Metastasis in Non-small-cell Lung Cancer. Front. Oncol. 9, 363. doi:10.3389/fonc.2019.00363
Park, D., Tosello-Trampont, A.-C., Elliott, M. R., Lu, M., Haney, L. B., Ma, Z., et al. (2007). Bai1 Is an Engulfment Receptor for Apoptotic Cells Upstream of the ELMO/Dock180/Rac Module. Nature 450, 430–434. doi:10.1038/nature06329
Peng, H.-Y., Yu, Q.-F., Shen, W., Guo, C.-M., Li, Z., Zhou, X.-Y., et al. (2016). Knockdown of ELMO3 Suppresses Growth, Invasion and Metastasis of Colorectal Cancer. Int. J. Mol. Sci. 17, 2119. doi:10.3390/ijms17122119
Peotter, J. L., Phillips, J., Tong, T., Dimeo, K., Gonzalez, J. M., and Peters, D. M. (2016). Involvement of Tiam1, RhoG and ELMO2/ILK in Rac1-Mediated Phagocytosis in Human Trabecular Meshwork Cells. Exp. Cell Res. 347, 301–311. doi:10.1016/j.yexcr.2016.08.009
Raun, S. H., Ali, M., Kjøbsted, R., Møller, L. L. V., Federspiel, M. A., Richter, E. A., et al. (2018). Rac1 Muscle Knockout Exacerbates the Detrimental Effect of High-Fat Diet on Insulin-Stimulated Muscle Glucose Uptake Independently of Akt. J. Physiol. 596, 2283–2299. doi:10.1113/JP275602
Saint-Geniez, M., and D'Amore, P. A. (2004). Development and Pathology of the Hyaloid, Choroidal and Retinal Vasculature. Int. J. Dev. Biol. 48, 1045–1058. doi:10.1387/ijdb.041895ms
Sayed, I. M., Suarez, K., Lim, E., Singh, S., Pereira, M., Ibeawuchi, S. R., et al. (2020). Host Engulfment Pathway Controls Inflammation in Inflammatory Bowel Disease. Febs J. 287, 3967–3988. doi:10.1111/febs.15236
Schäker, K., Bartsch, S., Patry, C., Stoll, S. J., Hillebrands, J.-L., Wieland, T., et al. (2015). The Bipartite Rac1 Guanine Nucleotide Exchange Factor Engulfment and Cell Motility 1/dedicator of Cytokinesis 180 (Elmo1/dock180) Protects Endothelial Cells from Apoptosis in Blood Vessel Development. J. Biol. Chem. 290, 6408–6418. doi:10.1074/jbc.M114.633701
Shimazaki, A., Kawamura, Y., Kanazawa, A., Sekine, A., Saito, S., Tsunoda, T., et al. (2005). Genetic Variations in the Gene Encoding ELMO1 Are Associated with Susceptibility to Diabetic Nephropathy. Diabetes 54, 1171–1178. doi:10.2337/diabetes.54.4.1171
Shimazaki, A., Tanaka, Y., Shinosaki, T., Ikeda, M., Watada, H., Hirose, T., et al. (2006). ELMO1 Increases Expression of Extracellular Matrix Proteins and Inhibits Cell Adhesion to ECMs. Kidney Int. 70, 1769–1776. doi:10.1038/sj.ki.5001939
Sun, Y., Côté, J.-F., and Du, K. (2016). Elmo2 Is a Regulator of Insulin-dependent Glut4 Membrane Translocation. J. Biol. Chem. 291, 16150–16161. doi:10.1074/jbc.M116.731521
Sun, Y., Ren, W., Côté, J.-F., Hinds, P. W., Hu, X., and Du, K. (2015). ClipR-59 Interacts with Elmo2 and Modulates Myoblast Fusion. J. Biol. Chem. 290, 6130–6140. doi:10.1074/jbc.M114.616680
Sylow, L., Jensen, T. E., Kleinert, M., Højlund, K., Kiens, B., Wojtaszewski, J., et al. (2013). Rac1 Signaling Is Required for Insulin-Stimulated Glucose Uptake and Is Dysregulated in Insulin-Resistant Murine and Human Skeletal Muscle. Diabetes 62, 1865–1875. doi:10.2337/db12-1148
Sylow, L., Kleinert, M., Pehmøller, C., Prats, C., Chiu, T. T., Klip, A., et al. (2014). Akt and Rac1 Signaling Are Jointly Required for Insulin-Stimulated Glucose Uptake in Skeletal Muscle and Downregulated in Insulin Resistance. Cell. Signal. 26, 323–331. doi:10.1016/j.cellsig.2013.11.007
Sztal, T. E., and Stainier, D. Y. R. (2020). Transcriptional Adaptation: a Mechanism Underlying Genetic Robustness. Development 147, dev186452. doi:10.1242/dev.186452
Tan, W., Palmby, T. R., Gavard, J., Amornphimoltham, P., Zheng, Y., and Gui, J. S. (2008). An Essential Role for Rac1 in Endothelial Cell Function and Vascular Development. FASEB J. 22, 1829–1838. doi:10.1096/fj.07-096438
Thomson, S. E., McLennan, S. V., Kirwan, P. D., Heffernan, S. J., Hennessy, A., Yue, D. K., et al. (2008). Renal Connective Tissue Growth Factor Correlates with Glomerular Basement Membrane Thickness and Prospective Albuminuria in a Non-human Primate Model of Diabetes: Possible Predictive Marker for Incipient Diabetic Nephropathy. J. Diabetes its Complicat. 22, 284–294. doi:10.1016/j.jdiacomp.2007.07.001
Tran, V., Goyette, M.-A., Martínez-García, M., Jiménez de Domingo, A., Fernández-Mayoralas, D. M., Fernández-Perrone, A. L., et al. (2021). Biallelic ELMO3 Mutations and Loss of Function for DOCK-Mediated RAC1 Activation Result in Intellectual Disability. Small GTPases, 1–8. doi:10.1080/21541248.2021.1888557
Turki, A., Mzoughi, S., Mtitaoui, N., Khairallah, M., Marmouch, H., Hammami, S., et al. (2018). Gender Differences in the Association of ELMO1 Genetic Variants with Type 2 Diabetes in Tunisian Arabs. J. Endocrinol. Invest. 41, 285–291. doi:10.1007/s40618-017-0734-7
Wiggenhauser, L. M., Kohl, K., Dietrich, N., Hammes, H.-P., and Kroll, J. (2017). Studying Diabetes through the Eyes of a Fish: Microdissection, Visualization, and Analysis of the Adult tg(fli:EGFP) Zebrafish Retinal Vasculature. J. Vis. Exp. doi:10.3791/56674
Wiggenhauser, L. M., Metzger, L., Bennewitz, K., Soleymani, S., Boger, M., Tabler, C. T., et al. (2022). pdx1 Knockout Leads to a Diabetic Nephropathy- like Phenotype in Zebrafish and Identifies Phosphatidylethanolamine as Metabolite Promoting Early Diabetic Kidney Damage. Diabetes 71, 1073–1080. doi:10.2337/db21-0645
Wolf, G., and Ziyadeh, F. N. (1999). Molecular Mechanisms of Diabetic Renal Hypertrophy. Kidney Int. 56, 393–405. doi:10.1046/j.1523-1755.1999.00590.x
Wu, H. Y., Wu, Y. H., Wang, Y., Chen, M., Zhang, X., Wang, D., et al. (2013). Association of ELMO1 Gene Polymorphisms with Diabetic Nephropathy in Chinese Population. J. Endocrinol. Invest. 36, 298–302. doi:10.3275/8525
Wu, Y.-C., Tsai, M.-C., Cheng, L.-C., Chou, C.-J., and Weng, N.-Y. (2001). C. elegans CED-12 Acts in the Conserved crkII/DOCK180/Rac Pathway to Control Cell Migration and Cell Corpse Engulfment. Dev. Cell 1, 491–502. doi:10.1016/s1534-5807(01)00056-9
Zang, L., Shimada, Y., Nishimura, Y., Tanaka, T., and Nishimura, N. (2015). Repeated Blood Collection for Blood Tests in Adult Zebrafish. J. Vis. Exp., e53272. doi:10.3791/53272
Keywords: ELMO1, ELMO2, ELMO3, Elmo protein family, vasculature, zebrafish
Citation: Boger M, Bennewitz K, Wohlfart DP, Hausser I, Sticht C, Poschet G and Kroll J (2022) Comparative Morphological, Metabolic and Transcriptome Analyses in elmo1−/−, elmo2−/−, and elmo3−/− Zebrafish Mutants Identified a Functional Non-Redundancy of the Elmo Proteins. Front. Cell Dev. Biol. 10:918529. doi: 10.3389/fcell.2022.918529
Received: 12 April 2022; Accepted: 13 June 2022;
Published: 08 July 2022.
Edited by:
Upendra Nongthomba, Indian Institute of Science (IISc), IndiaReviewed by:
Chinmoy Patra, Agharkar Research Institute, IndiaSudipto Roy, Institute of Molecular and Cell Biology (A∗STAR), Singapore
Copyright © 2022 Boger, Bennewitz, Wohlfart, Hausser, Sticht, Poschet and Kroll. This is an open-access article distributed under the terms of the Creative Commons Attribution License (CC BY). The use, distribution or reproduction in other forums is permitted, provided the original author(s) and the copyright owner(s) are credited and that the original publication in this journal is cited, in accordance with accepted academic practice. No use, distribution or reproduction is permitted which does not comply with these terms.
*Correspondence: Jens Kroll, jens.kroll@medma.uni-heidelberg.de