Overexpression of NREP Promotes Migration and Invasion in Gastric Cancer Through Facilitating Epithelial-Mesenchymal Transition
 Yuan-jie Liu
 Shu-hong Zeng
 Yi-dou Hu1
  Jie-pin Li
- 1Department of Oncology, Zhangjiagang TCM Hospital Affiliated to Nanjing University of Chinese Medicine, Zhangjiagang, Jiangsu, China
- 2Affiliated Hospital of Nanjing University of Chinese Medicine, Jiangsu Province Hospital of Chinese Medicine, Nanjing, Jiangsu, China
- 3No. 1 Clinical Medical College, Nanjing University of Chinese Medicine, Nanjing, Jiangsu, China
The identification of biomarkers and effective therapeutic targets for gastric cancer (GC), the most common cause of cancer-related deaths around the world, is currently a major focus area in research. Here, we examined the utility of Neuronal Regeneration Related Protein (NREP) as a prognostic biomarker and therapeutic target for GC. We assessed the clinical relevance, function, and molecular role of NREP in GC using bioinformatics analysis and experimental validation. Our results showed that in GC, NREP overexpression was significantly associated with a poor prognosis. Our findings also suggested that NREP may be involved in the activation of cancer-associated fibroblasts and the epithelial–mesenchymal transition (EMT), with transforming growth factor β1 mediating both processes. In addition, NREP expression showed a positive correlation with the abundance of M2 macrophages, which are potent immunosuppressors. Together, these results indicate that NREP is overexpressed in GC and affects GC prognosis. Thus, NREP could be a prognostic biomarker and therapeutic target for GC.
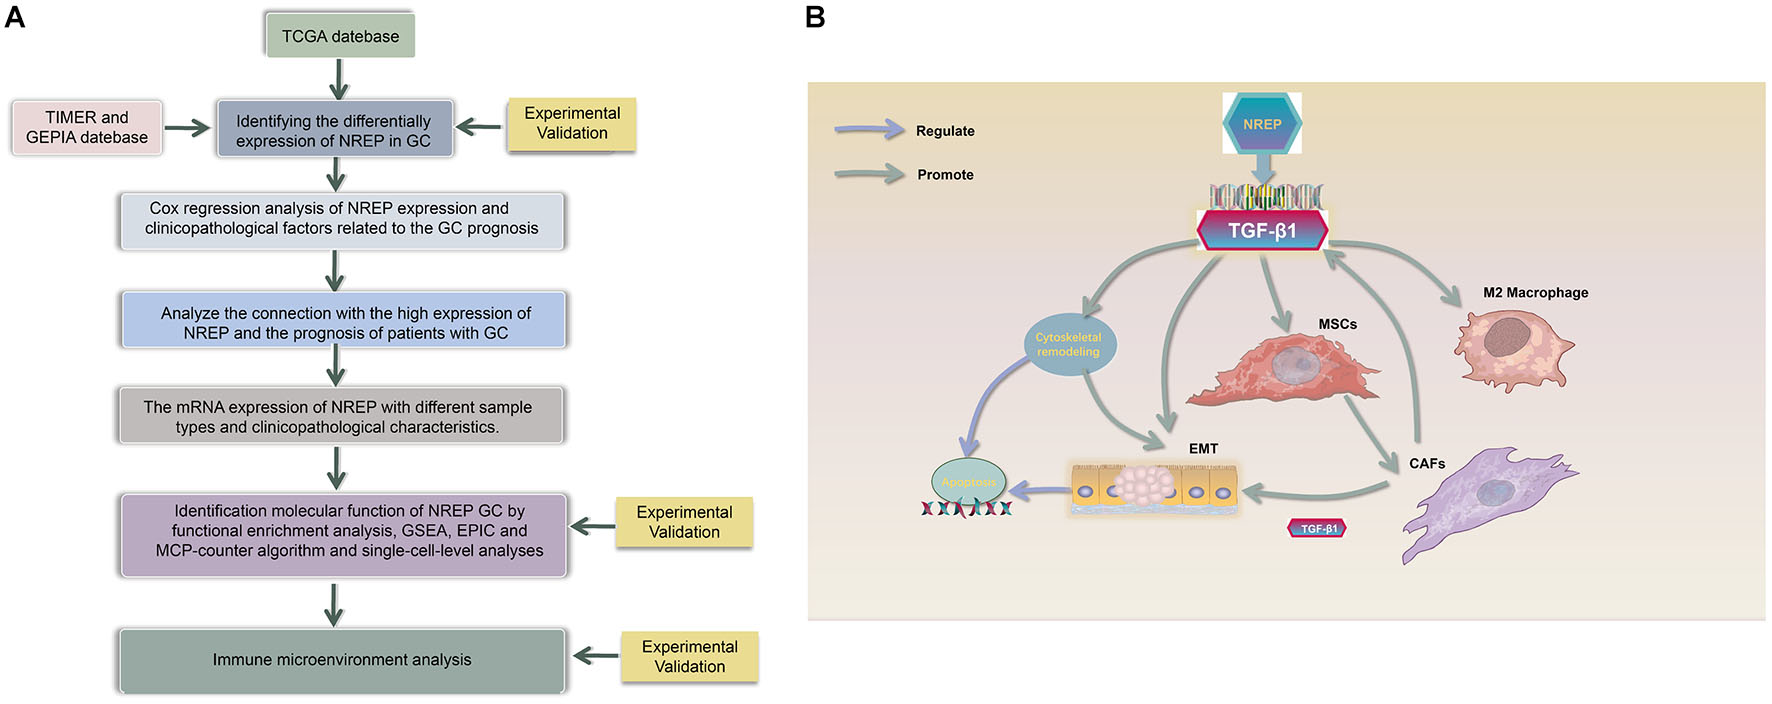
Graphical Abstract. (A) Study Flow chart, (B) Diagram depicting the regulation mechanism of NREP in the tumorigenesis of gastric cancer.
Introduction
Gastric cancer (GC) is the third most prevalent cancer globally (Son et al., 2021). Both perioperative chemotherapy and preoperative chemoradiotherapy are recommended for the treatment of resectable GC around the world. Of these strategies, perioperative chemotherapy is used most frequently (Al-Batran et al., 2020). The period between the decision to perform surgery and the completion of surgical treatment is called the perioperative period. This period includes the pre-operative, intra-operative, and post-operative stages. Radical surgery is currently the primary curative treatment for resectable GC. In contrast, adjuvant chemoradiotherapy is the standard treatment for unresectable and metastatic GC (De Steur et al., 2021). While chemotherapy improves patient survival, the response to treatment can be variable and unpredictable, with many patients experiencing recurrence and distant metastasis. In advanced GC, the 5-year overall survival (OS) continues to be low at 20–30% (Smyth et al., 2020).
In this era of individualized and precision medicine, molecular targeted therapies and immunotherapies are developing very rapidly, and they have shown great promise in the treatment of GC (Liu and Meltzer, 2017; Pauli et al., 2017). Although previous research has largely focused on targeting malignant cancer cells, an increasing number of studies are now focusing on the tumor microenvironment (TME; Wu and Dai, 2017), which includes all non-malignant host cells and non-cellular components, including immune, blood, and endothelial cells; extracellular matrix (ECM); fibroblasts; and mesenchymal stromal cells (MSCs; Rojas et al., 2020).
There has been recent progress in molecular targeted therapies for GC. Trastuzumab in combination with chemotherapy has been found to improve survival in human epidermal growth factor receptor 2-positive GC (Meric-Bernstam et al., 2019). However, few anti-vascular molecular targeted agents have been identified for advanced GC. Although ramucirumab and apatinib have been approved for second- and third-line treatment, a drug for first-line treatment is still unavailable (Wilke et al., 2014; Scott, 2018). This is likely because of the complex TME of GC and the lack of accurate predictive biomarkers. Therefore, identifying specific biomarkers, targeting the tumorigenic stroma, and reducing the number of immunosuppressive macrophages may be helpful in GC treatment and may also hold the key to improving survival in this cancer.
Neuronal Regeneration Related Protein, which binds to the transforming growth factor β1 (TGF-β1) latency-related protein, is an intracellular polypeptide (8 kDa, 68 amino acids long) that is highly conserved across species and is expressed in the brain, smooth muscles, regenerated tissue, and malignant glioblastomas (Stradiot et al., 2018). NREP regulates the expression of TGF-β1 not only at the translational but also at the transcriptional level (Li et al., 2016). NREP also regulates myofibroblast differentiation and fibrosis and promotes embryo development, wound healing, and nerve and lung regeneration (Studler et al., 1993; Duan et al., 2019). The molecular physiology of wound healing is thought to be very similar to that of cancer progression (Margadant and Sonnenberg, 2010). During wound healing, epithelial-mesenchymal transition (EMT) confers motility and invasiveness to epithelial cells, thereby allowing them to travel to the wound site and repair tissue damage. Similarly, once cancer cells enter the EMT phase, they become locally invasive, and this is the first step in tumor metastasis. Many important signaling pathways and molecules involved in wound healing also regulate tumor cell proliferation and metastasis (Derynck and Weinberg, 2019). Given these findings and the results of enrichment analysis for NREP-related genes, we hypothesized that NREP may have a powerful role in promoting EMT in tumors. Further, we speculated that TGF-β1 could be an important mediator in the effects of NREP. TGF-β1 is a well-known key factor in the TME and can promote the reprogramming of tumor-infiltrating cells, including tumor-associated macrophages (TAMs) and tumor-associated fibroblasts, enabling them to play a decisive role in tumor survival and progression. Signaling crosstalk between cancer cells and mesenchymal cells ultimately leads to an environment that supports tumor growth and metastasis. Recently, high NREP expression was observed around the rims of invasive human glioma tumors. Furthermore, NREP knockdown in human glioma cells (SF767) has been found to reduce their migration ability in vitro (Mariani et al., 2001; Yao et al., 2015, 2017). However, data on the role played by NREP in tumorigenesis, particularly in GC, are limited. Therefore, we examined the mechanistic role of NREP in GC and its development. We also assessed its prognostic value in GC along with its potential as a target for cancer therapy.
Materials and Methods
Antibodies and Reagents
A complete list of reagents and antibodies is provided in Supplementary Material 1. All the concentrations were chosen based on previous studies or manufacturer’s instructions. The detailed screening protocol is also presented in Supplementary Material 1.
Cell Culture
AGS (moderately differentiated GC cells), HGC27 (undifferentiated GC cells), GES-1 (healthy gastric epithelial cells), and THP-1 cells (human monocytic cells) were purchased from the cell bank of the Chinese Academy of Sciences (Shanghai, China). MKN74 and MKN45 cells (well and poorly differentiated GC cells, respectively) were purchased from the Japanese Collection of Research Bioresources Cell Bank. Human MSCs were purchased from Cyagen Biosciences (Guangzhou, China). GC and THP-1 cells were cultured in RPMI-1640 medium with 10% fetal bovine serum (FBS), and GES-1 cells and human MSCs were cultured in DMEM with 10% FBS. All cells were incubated at 37°C in 5% CO2.
RNA Extraction and Real-Time Quantitative PCR
Quantitative RT-PCR was performed using the protocol provided in previous studies (Bustin et al., 2005). Total RNA was extracted from cells using the TRIzol reagent. cDNA was synthesized via reverse transcription using the manufacturer’s protocol. β-actin was chosen as the internal control. The primers were as follows: β-actin (F): 5′-GCGTGACATTAAGGAGAAGC-3′; β-actin (R): 5′-ACGTCACACTTCATGATGG-3′; NREP (F):5′ TTGAGCGAATGCTACCAGAG-3′; and NREP (R):5′-AGGCG AGGCTACGGAAAG -3′.
Western Blot Assessment
The protocol for western blotting was based on previous studies (Hnasko and Hnasko, 2015). Target/β-actin bands were identified with a gel image processing system (ChemiDoc XRS+). Subsequently, relative protein levels were calculated.
Ethics Statement and Specimen Collection
The study’s protocol was approved by the ethics committee of the Jiangsu Province Hospital of Chinese Medicine, and informed consent was obtained from clinicians and patients (2019NL-166-02). GC tissue and the surrounding non-tumorous tissue (margin, 5 cm) were collected during surgery from 30 previously treatment-naïve patients with GC at the Jiangsu Provincial Hospital of Traditional Chinese Medicine. Tumors were staged and graded using the 8th edition of the American Joint Committee on Cancer tumor-node-metastasis staging system (Ji et al., 2018). After extraction, tissue specimens were washed with cold phosphate-buffered saline and immediately placed in liquid nitrogen. They were then transferred and stored at −80°C until further examination.
Immunohistochemistry
The protocol used for Immunohistochemistry (IHC) was based on earlier studies (Nizioł et al., 2021). Images were obtained using a NIKON Eclipse Ni-E microscope (NIKON, Japan; original magnification, ×400). The H-SCORE (range 0–300, higher scores indicating stronger positive staining) was calculated as described previously (Yang et al., 2019).
Lentiviral Vector Construction and Transfection
We used lentiviral vectors for overexpressing and knocking down NREP. Viruses were designed, synthesized, and produced by GeneChem Corporation. Transfection was performed according to the supplier’s protocol. HGC27 and MKN74 cells were transduced with the recombinant lentiviruses using 2 μg/mL polybrene for 24 h. Subsequently, we identified stably transfected GFP-expressing cells using 1.5 μg/mL puromycin. We assessed NREP overexpression and knockdown as well as transduction efficiency using western blots.
Enzyme-Linked Immunosorbent Assay
We examined cell supernatants for TGF-β1 levels using the TGF-β1 Enzyme-linked immunosorbent assay (ELISA) Kit based on the given instruction manual. A microplate reader (BioTek Synergy HT) was used to examine optical density at 450 nm.
Colony Formation Assays
We assessed the clonogenic ability of cells using a clone formation assay, as described previously (Li et al., 2012). The number of colonies was counted using a compound light microscope (Olympus BX53, Japan).
Xenograft Tumor Model
All animal experiments were approved by the ethics committee of the Jiangsu Province Hospital of Chinese Medicine (2021-5-062). Twenty-four 4-week-old male BALB/c nude mice were obtained from the Beijing Institute of Biomedicine (Beijing, China; Certificate No. SYXK2019-0010). MKN74 cells transfected with sh-NREP, oe-NREP, and NC and control cells (4 × 10⁶ cell/mouse) were injected subcutaneously into the right armpit region of the mice (n = 6 per group). 7 days later, tumor formation was observed beneath the skin. The maximum (a) and minimum tumor diameter (b) were measured twice weekly. On day 15, the mice were euthanized and all tumors were collected. Tumor volume was calculated (V = 1/2ab2), and the growth curves of the subcutaneous xenografts were drawn.
Wound Healing Assay
The protocol used for the wound healing assay was based on earlier studies (Pasquale et al., 2020). Cell migration toward the scratch zone was photographed using an inverted fluorescence microscope (Olympus CKX-41, Japan; ×200 magnification) every 12 h.
Transwell Migration Assay
Cell invasion was assessed using a transwell assay based on a previously published protocol (Misra et al., 2021). The membrane in the chamber was cut and imaged using light microscopy (Olympus BX53, Japan; ×200 magnification), and cell counts were obtained using Image J software.
TUNEL Staining
The TUNEL apoptosis detection kit was used to perform the TUNEL assay, as described previously (Telegina et al., 2019). TUNEL-negative (blue) and TUNEL-positive (red) cells were observed using a fluorescence microscope (Olympus CKX-41, Japan; ×200 magnification).
Immunofluorescence Staining
The protocol used for immunofluorescence staining was based on earlier studies (Donaldson, 2015). Immunofluorescence staining was observed using an epi-fluorescence microscope (Olympus, BX60-32FB2-A03) and different filters and imaged using an Olympus, DP50 camera (×400 magnification).
Establishment of a Co-culture Unit
A non-contact co-culture unit of MSCs and GC cells was established using a co-culture transwell system (upper chamber, GC cells; lower chamber, MSCs; Long et al., 2019). The culture medium was changed every 48 h. After 4 days of non-contact co-culture, the culture in the lower chamber was terminated and cells were harvested for other experiments.
THP-1 cells (1 × 10⁵ cells/mL) were treated with phorbol 12-myristate 13-acetate (PMA; 10 ng/mL) for 48 h to allow the induction of macrophage differentiation (Genin et al., 2015). PMA-containing medium was replaced with serum-free medium, and the cells were cultured for 24 h. 2 days before the co-culture experiment, cells (1 × 10⁵ cells/mL) from the control, knock-down (sh-NREP), overexpression (oe-NREP), and negative control (NC) groups were seeded onto 0.4-μM transwell inserts. For co-culture, the culture medium in the inserts with GC cells was removed and transferred to the top of the pates with differentiated THP-1 cells. After 48 h of further co-culturing, cells were obtained, and immunofluorescence staining was performed.
Statistical Analysis
Data were reported as the mean ± standard deviation. We used t-tests and one-way ANOVA to perform comparisons between two groups and among multiple groups, respectively. All data were analyzed using SPSS 26.0 (SPSS Inc., United States) and illustrated using GraphPad Prism 8.0 (GraphPad Software, Inc., United States). All experiments were carried out at least thrice. ∗∗P < 0.01 and ∗P < 0.05 were considered statistically significant.
Expression Analysis
The expression of NREP in GC was first investigated using the TIMER and1 and GEPIA databases2 (Pan et al., 2019; Yuan et al., 2019). The Cancer Genome Atlas (TCGA)-Stomach Adenocarcinoma (STAD) cohort and Fei et al. (2018), Li et al (2020), and Shan et al. (2021) datasets were then used to further confirm the differential expression of NREP (Rossari et al., 2018; Tian et al., 2018). The Human Protein Atlas database3, which contains data on >11,200 unique proteins, is the biggest, most comprehensive database on protein distribution in human tissues and cells (Thul and Lindskog, 2018).
Cox Model Establishment and Clinical Value Analysis of NREP in Gastric Cancer
Multivariate Cox regression analysis of TCGA-STAD data was used to identify whether NREP could be an independent prognosticator for GC. P values, hazard ratios (HRs), and 95% confidence intervals (CIs) were obtained using the “forest plot” R package.
The differences in NREP levels were analyzed based on various classification parameters, such as the T/N/M stage, pathologic stage, and histologic grade.
Differences in survival based on NREP expression were examined using Kaplan–Meier survival analysis and log-rank tests. P values, HRs, and 95% CIs were obtained using log-rank tests and univariate Cox proportional hazards regression. Time receiver operating characteristic (ROC) analysis was applied to calculate the accuracy of prognostication based on NREP levels.
Gene Enrichment Analysis
The GeneMANIA database was used to identify genes that showed NREP-lined expression and to explore their potential functions (Franz et al., 2018). Genes co-expressed with NREP were identified based on TCGA-STAD data (criteria: |logFC > 3| and P < |0.05|). Subsequently, we conducted functional enrichment analysis of NREP and the identified genes using the Enrichr database (Kuleshov et al., 2016).
To analyze the connections among proteins, genes co-expressed with NREP were assessed using the Search Tool for the Retrieval of Interacting Genes database (STRING)4 (Szklarczyk et al., 2021); we visualized the results obtained after setting the minimum interaction score to 0.4 in Cytoscape (Doncheva et al., 2019). In addition, based on the constructed protein–protein interaction network (PPI), important modules were screened out using the Molecular Complex Detection (MCODE) tool. Hub genes were obtained by setting the following cutoffs: degree cutoff value = 2, node density cutoff value = 0.1, node score cutoff value = 0.2, k-core = 2, and maximum depth = 100. Finally, the relationship between the levels of these hub genes and GC prognosis was examined using TCGA-STAD data.
Gene set enrichment analysis (GSEA) was performed using the Broad Institute GSEA software 3.0. The geneset “subset of GO (Gene Ontology)” (Molecular Signatures Databases; http://www.gsea-msigdb.org/gsea/msigdb/index.jsp) was used for GO enrichment analysis (Powers et al., 2018). Statistical significance was defined at a normal P value < 0.05. The GSCALite online tool was used to explore the relationship between the 10 hub genes and EMT, and we calculated the co-expression relationship between NREP and 6 classical factors of EMT using TCGA-STAD data (Liu et al., 2018). In addition, single-cell analysis was conducted based on GSE134520 to find more evidence on the potential functions of NREP.
Immune Cell and Stromal Cell Analysis
The correlation between NREP expression levels and fibroblast levels was first calculated based on the Explicitly Parallel Instruction Code (EPIC) and Mixed Complementarity Problem (MCP)-counter algorithm from the TIMER web tool (Sturm et al., 2019). GC patients were grouped into high- and low-expression cohorts based on the median NREP expression, and differential analysis was performed to identify the differentially abundant cells. Furthermore, CIBERSORT — a high-performance computational method used for quantifying cellular components from bulk-tissue gene expression profiles — was used to accurately estimate immune infiltration (Chen et al., 2018). Spearman’s rank correlation coefficients were calculated for pairwise correlation comparisons; P < 0.05 was defined as statistically significant. All findings were illustrated using “ggplot2” and “pheatmap.”
Results
NREP Expression in Gastric Tumors
The Cancer Genome Atlas-Stomach Adenocarcinoma data showed that NREP expression was higher in GC tissues than in normal tissues (Figure 1A; P < 0.05). Moreover, the analysis of TIMER and TCGA data also showed high NREP expression in GC (Figure 1B).
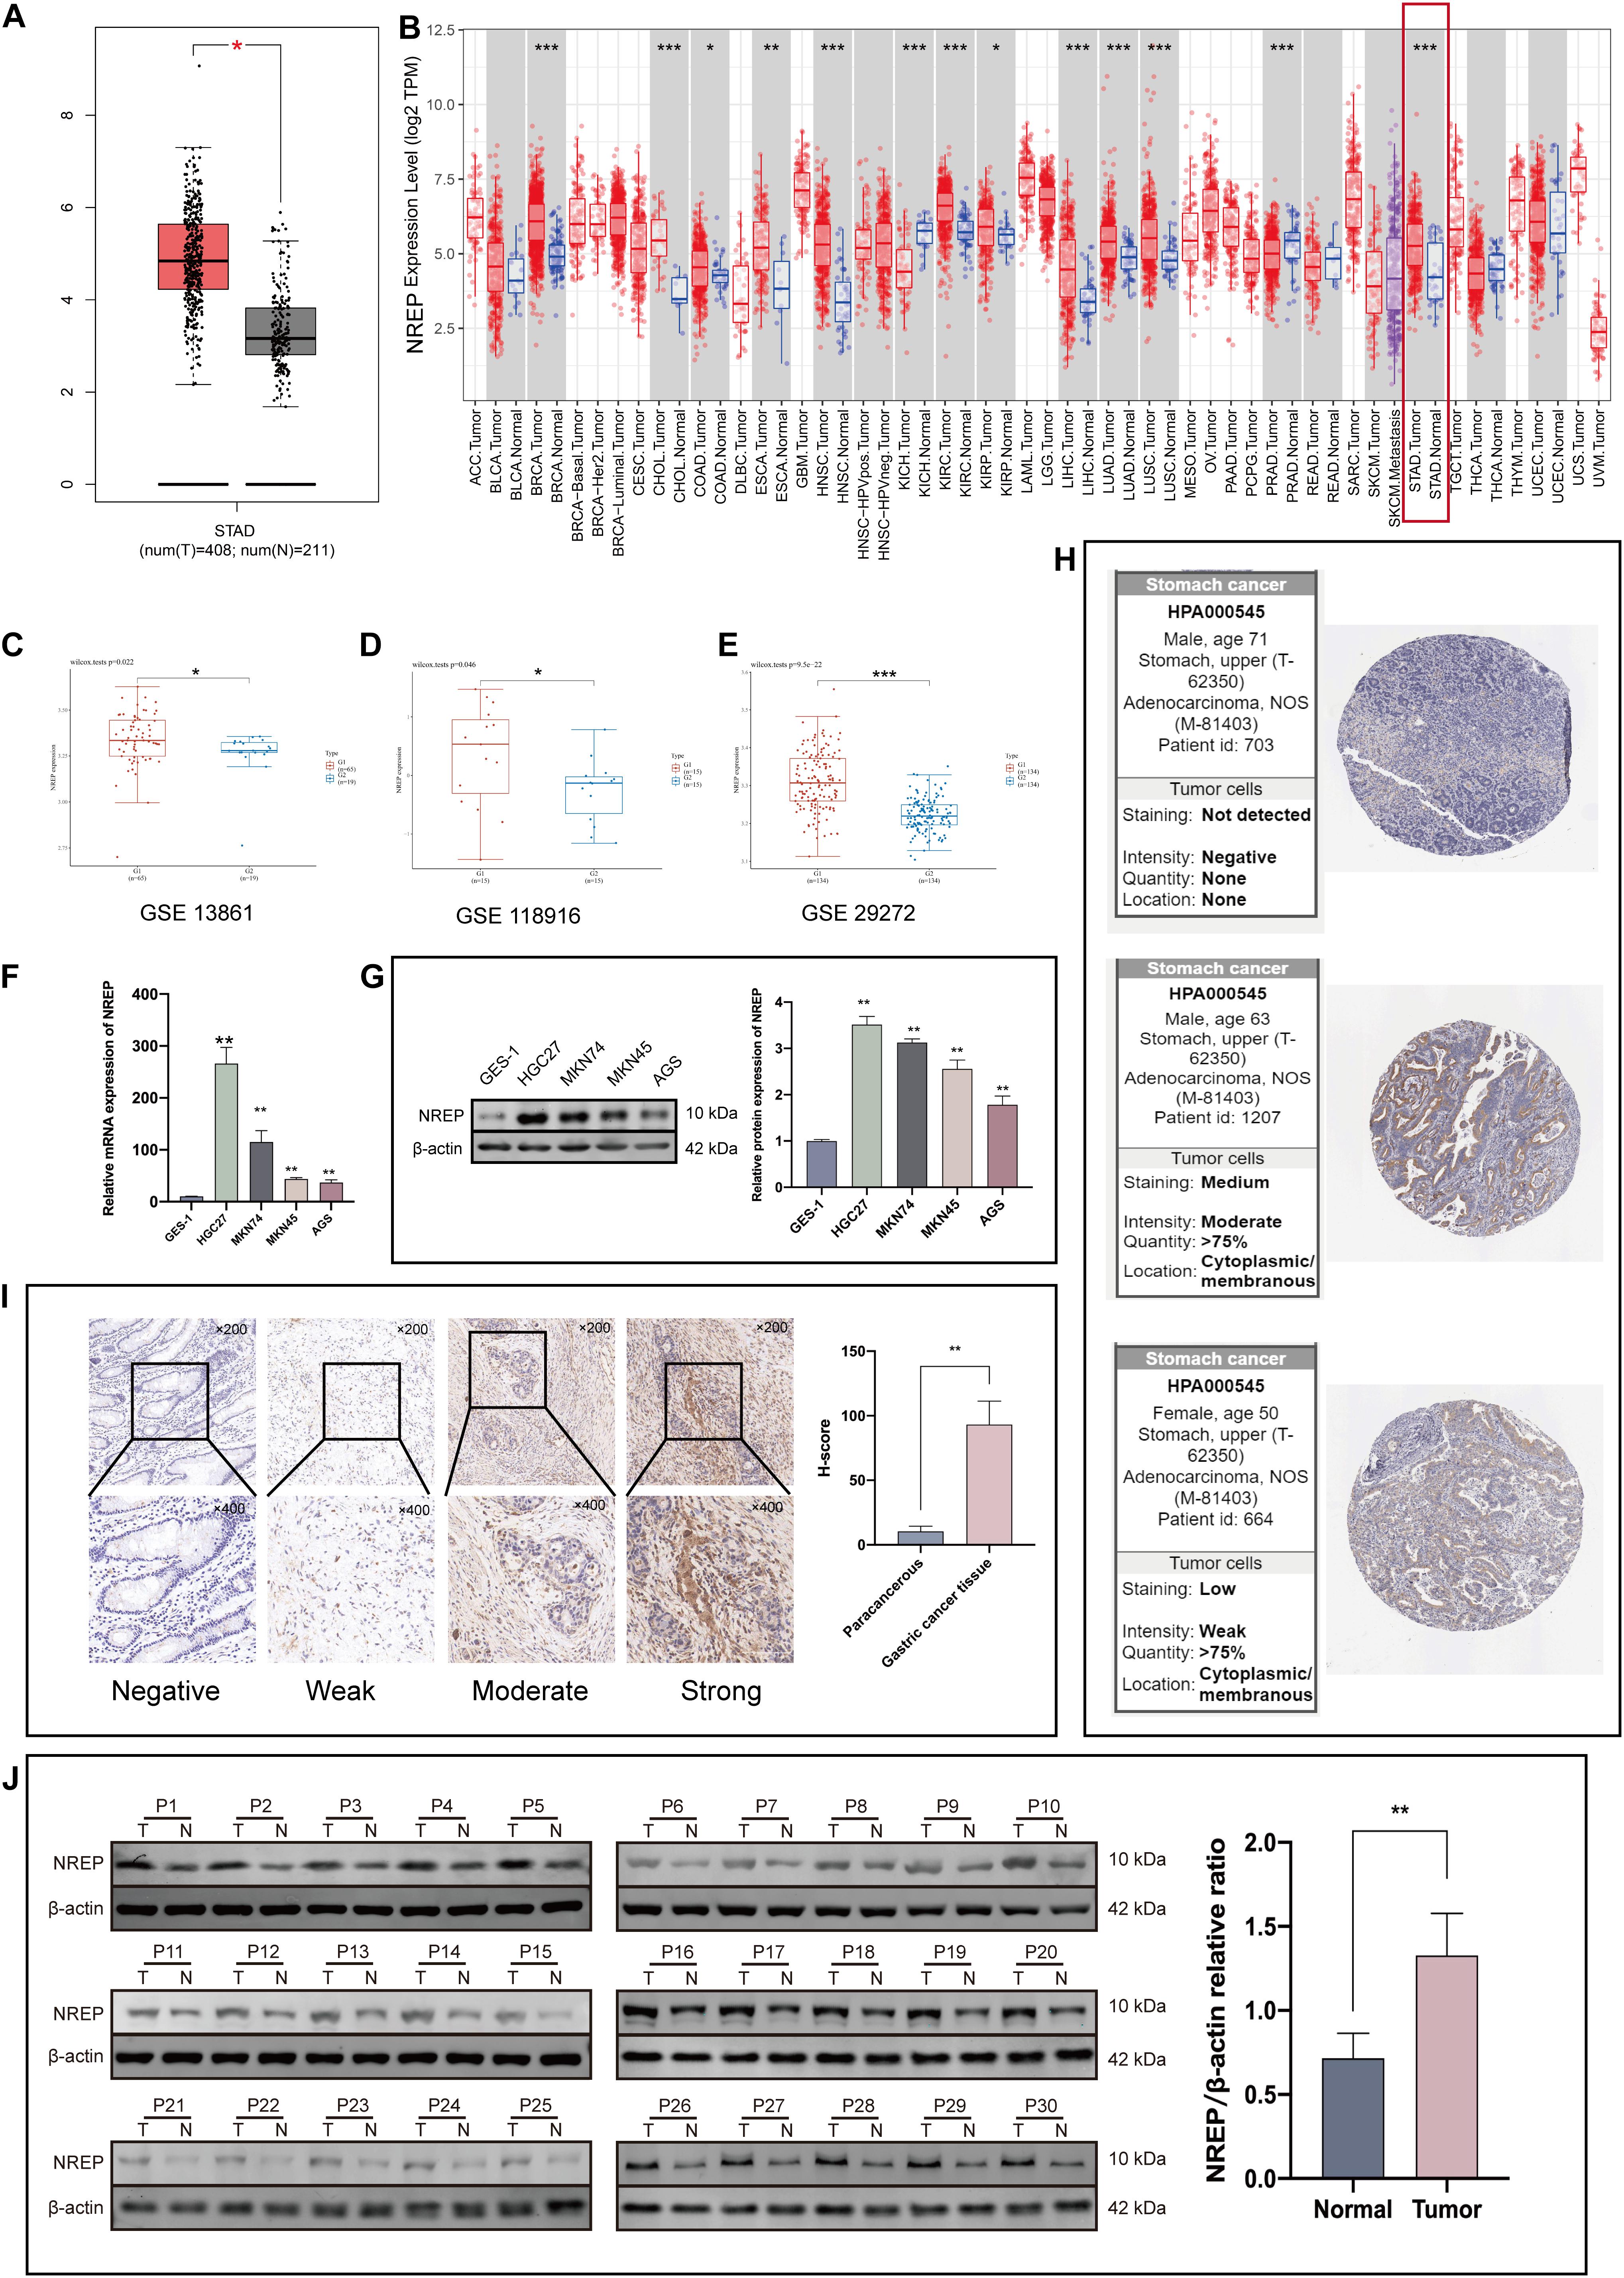
Figure 1. NREP levels in gastric cancer (GC) tissue. (A) Expression levels of NREP in GC based on The Cancer Genome Atlas (TCGA)-STAD data. (B) NREP mRNA levels in GC and normal tissue based on the TIMER database. (C–E) Public datasets from Gene Expression Omnibus (Fei et al., 2018; Li et al, 2020; Shan et al., 2021) used to verify NREP mRNA levels in GC. (F,G) NREP mRNA (F) and protein expression (G) in normal gastric epithelial cells and GC cells. (H) NREP immunohistochemistry in GC tissue based on data from the Human Protein Atlas. (I) Intensity of NREP immunohistochemistry staining and NREP expression levels in paracancerous and GC tissue (n = 30). (J) NREP expression in GC tissues (T) and paired non-tumorous tissue (N) evaluated using western blotting (n = 30). (NS: not significant, *P < 0.05, **P < 0.01, and ***P < 0.001).
We further explored the expression of NREP in GC tissues using data from the Gene Expression Omnibus (GEO) database. Data from the Fei et al. (2018), Li et al (2020), and Shan et al. (2021) datasets indicated a significant difference in NREP expression between GC tissues and adjacent tissues (Figures 1C–E). Western blot, RT-PCR, and IHC staining also revealed that NREP was over-expressed in GC cells and tissue. The mean H-SCOREs for NREP expression in GC and paracancerous tissue were 93.15 ± 18.21 and 10.49 ± 3.94, respectively (Figures 1F–J; P < 0.01, ANOVA). NREP protein expression in GC was further verified using IHC data from The Human Protein Atlas. NREP was found to be primarily expressed in the cell membrane and cytoplasm (Figure 1H).
Prognostic Value of NREP Expression in Gastric Cancer
Multivariate analysis of TCGA-STAD data revealed that NREP overexpression, age, and tumor stage were related with a poor prognosis in GC (P < 0.001; Figure 2A). In particular, NREP levels were identified as an independent predictor of survival in GC patients. The relationship of NREP levels with the clinicopathological characteristics of GC patients — including T/N/M stage, histologic grade, pathologic stage, gender, and race — is illustrated in Figure 2B. The mRNA levels of NREP only showed a correlation with T stage (P < 0.01, P < 0.001), and no such relationship was observed for other clinical features. Further analysis of the prognostic value of NREP using TCGA-STAD data showed that the low-risk group had a longer duration of survival than did the high-risk group (Figure 2C; P < 0.05). Additionally, according to TCGA-STAD data, the areas under the ROC curves of NREP expression for 1-, 3-, and 5-year OS were 0.589, 0.651, and 0.708, respectively, (Figure 2D). In summary, the results showed that NREP overexpression could be used as an indicator for OS in GC.
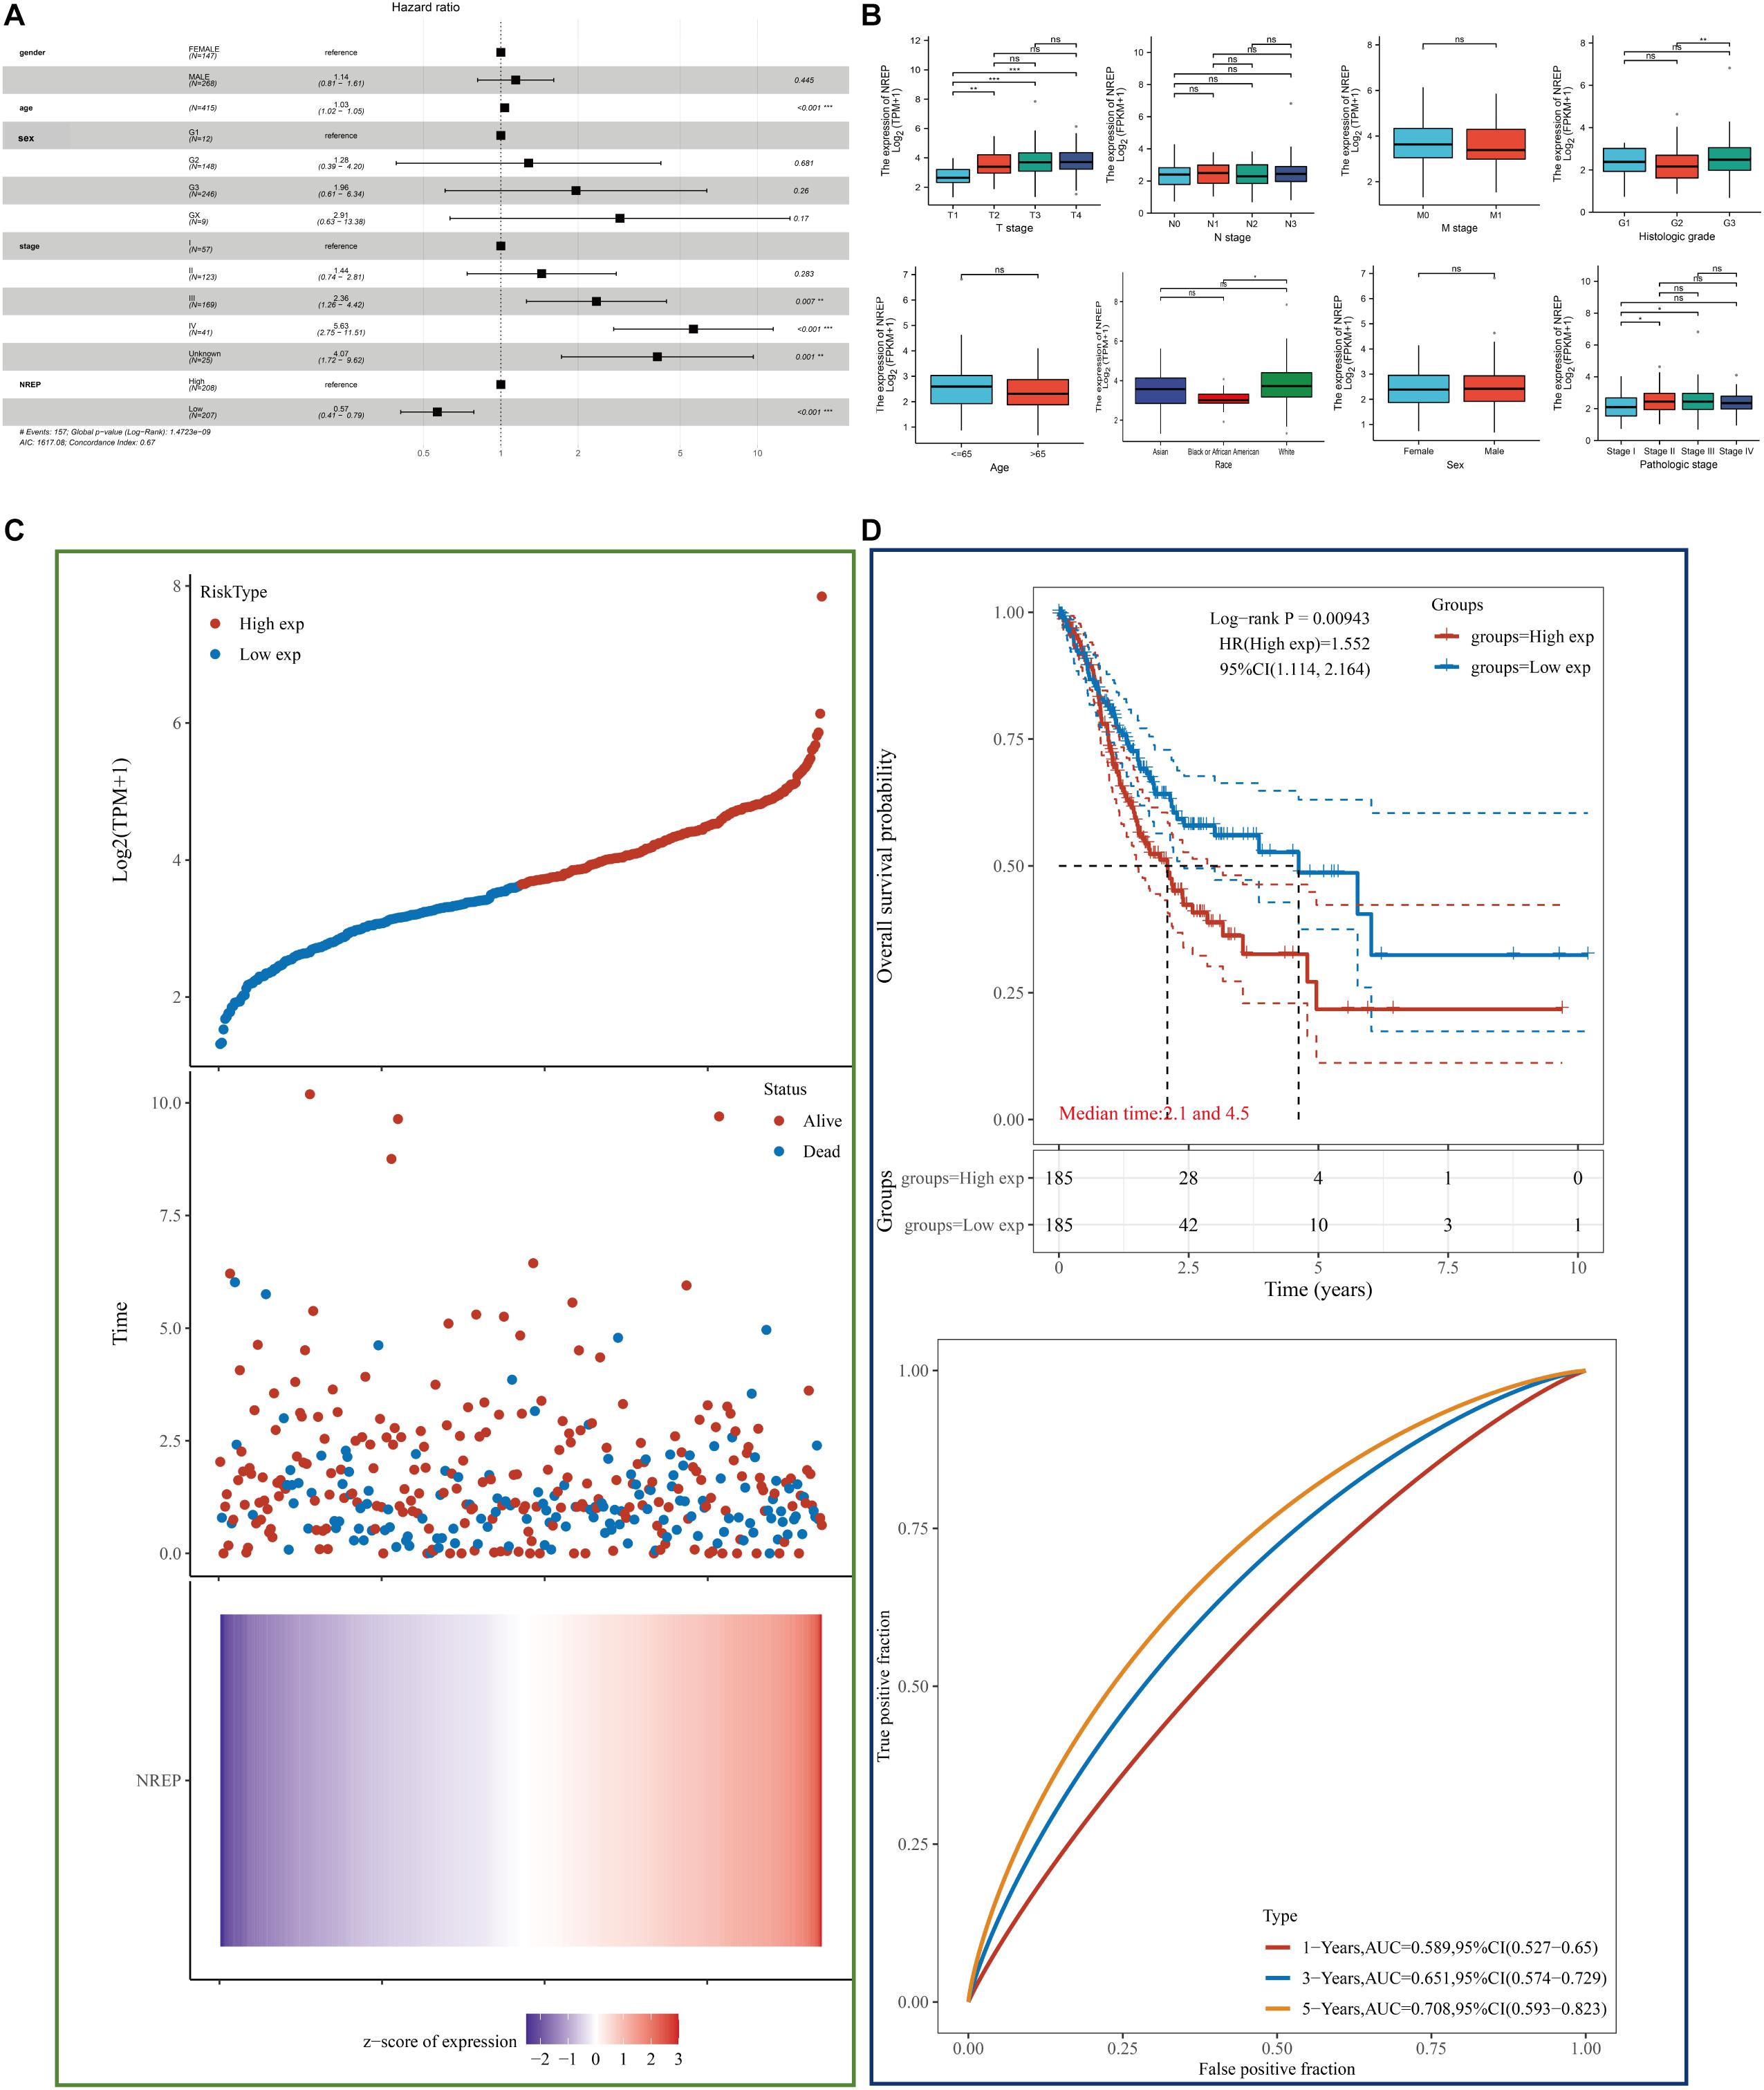
Figure 2. Diagnostic value of NREP expression in gastric cancer (GC) based on clinical characteristics. (A) Forest plot showing data on Sex, Age, tumor Grade/Stage, and NREP expression. (B) Association of NREP mRNA expression with T/N/M stage, histologic grade, pathologic stage, sex, race, and age in GC patients. (C) Patients were divided into low- and high-risk groups according to the median NREP expression. From top to bottom: The curve of risk score. Survival status of the patients and more dead patients corresponding to the higher risk score. Heatmap of NREP expression. The horizontal coordinates all represent samples, and the samples are ordered consistently. (D) Kaplan–Meier survival analysis and time-dependent receiver operating characteristic analysis based on NREP levels. (ns: no significance, *P < 0.05, **P < 0.01, ***P < 0.001).
Functional Enrichment Analysis of NREP
The functional network of NREP and its neighboring genes obtained using GeneMANIA is displayed in Figure 3A. We identified genes showing expression levels positively or negatively correlated with NREP expression using TCGA-STAD data and the “DESeq” R package (Figure 3B). The 73 differentially expressed genes (DEGs) were imported into the DEG PPI (Figure 3C). After applying Cytotype MCODE, we identified 10 hub genes among which 8 were up-regulated and 2 were down-regulated (Figure 3D and Supplementary Figures 1A–J). The GSCALite online tool was used to elucidate the relationship between the 10 hub genes and EMT (Figure 3E). Further enrichment analysis suggested that NREP may be associated with “extracellular structure organization,” “external encapsulating structure organization,” “extracellular matrix organization,” “collagen-containing extracellular matrix,” “platelet-derived growth factor binding,” “focal adhesion,” and “ECM-receptor interaction” (Figures 3F–I).
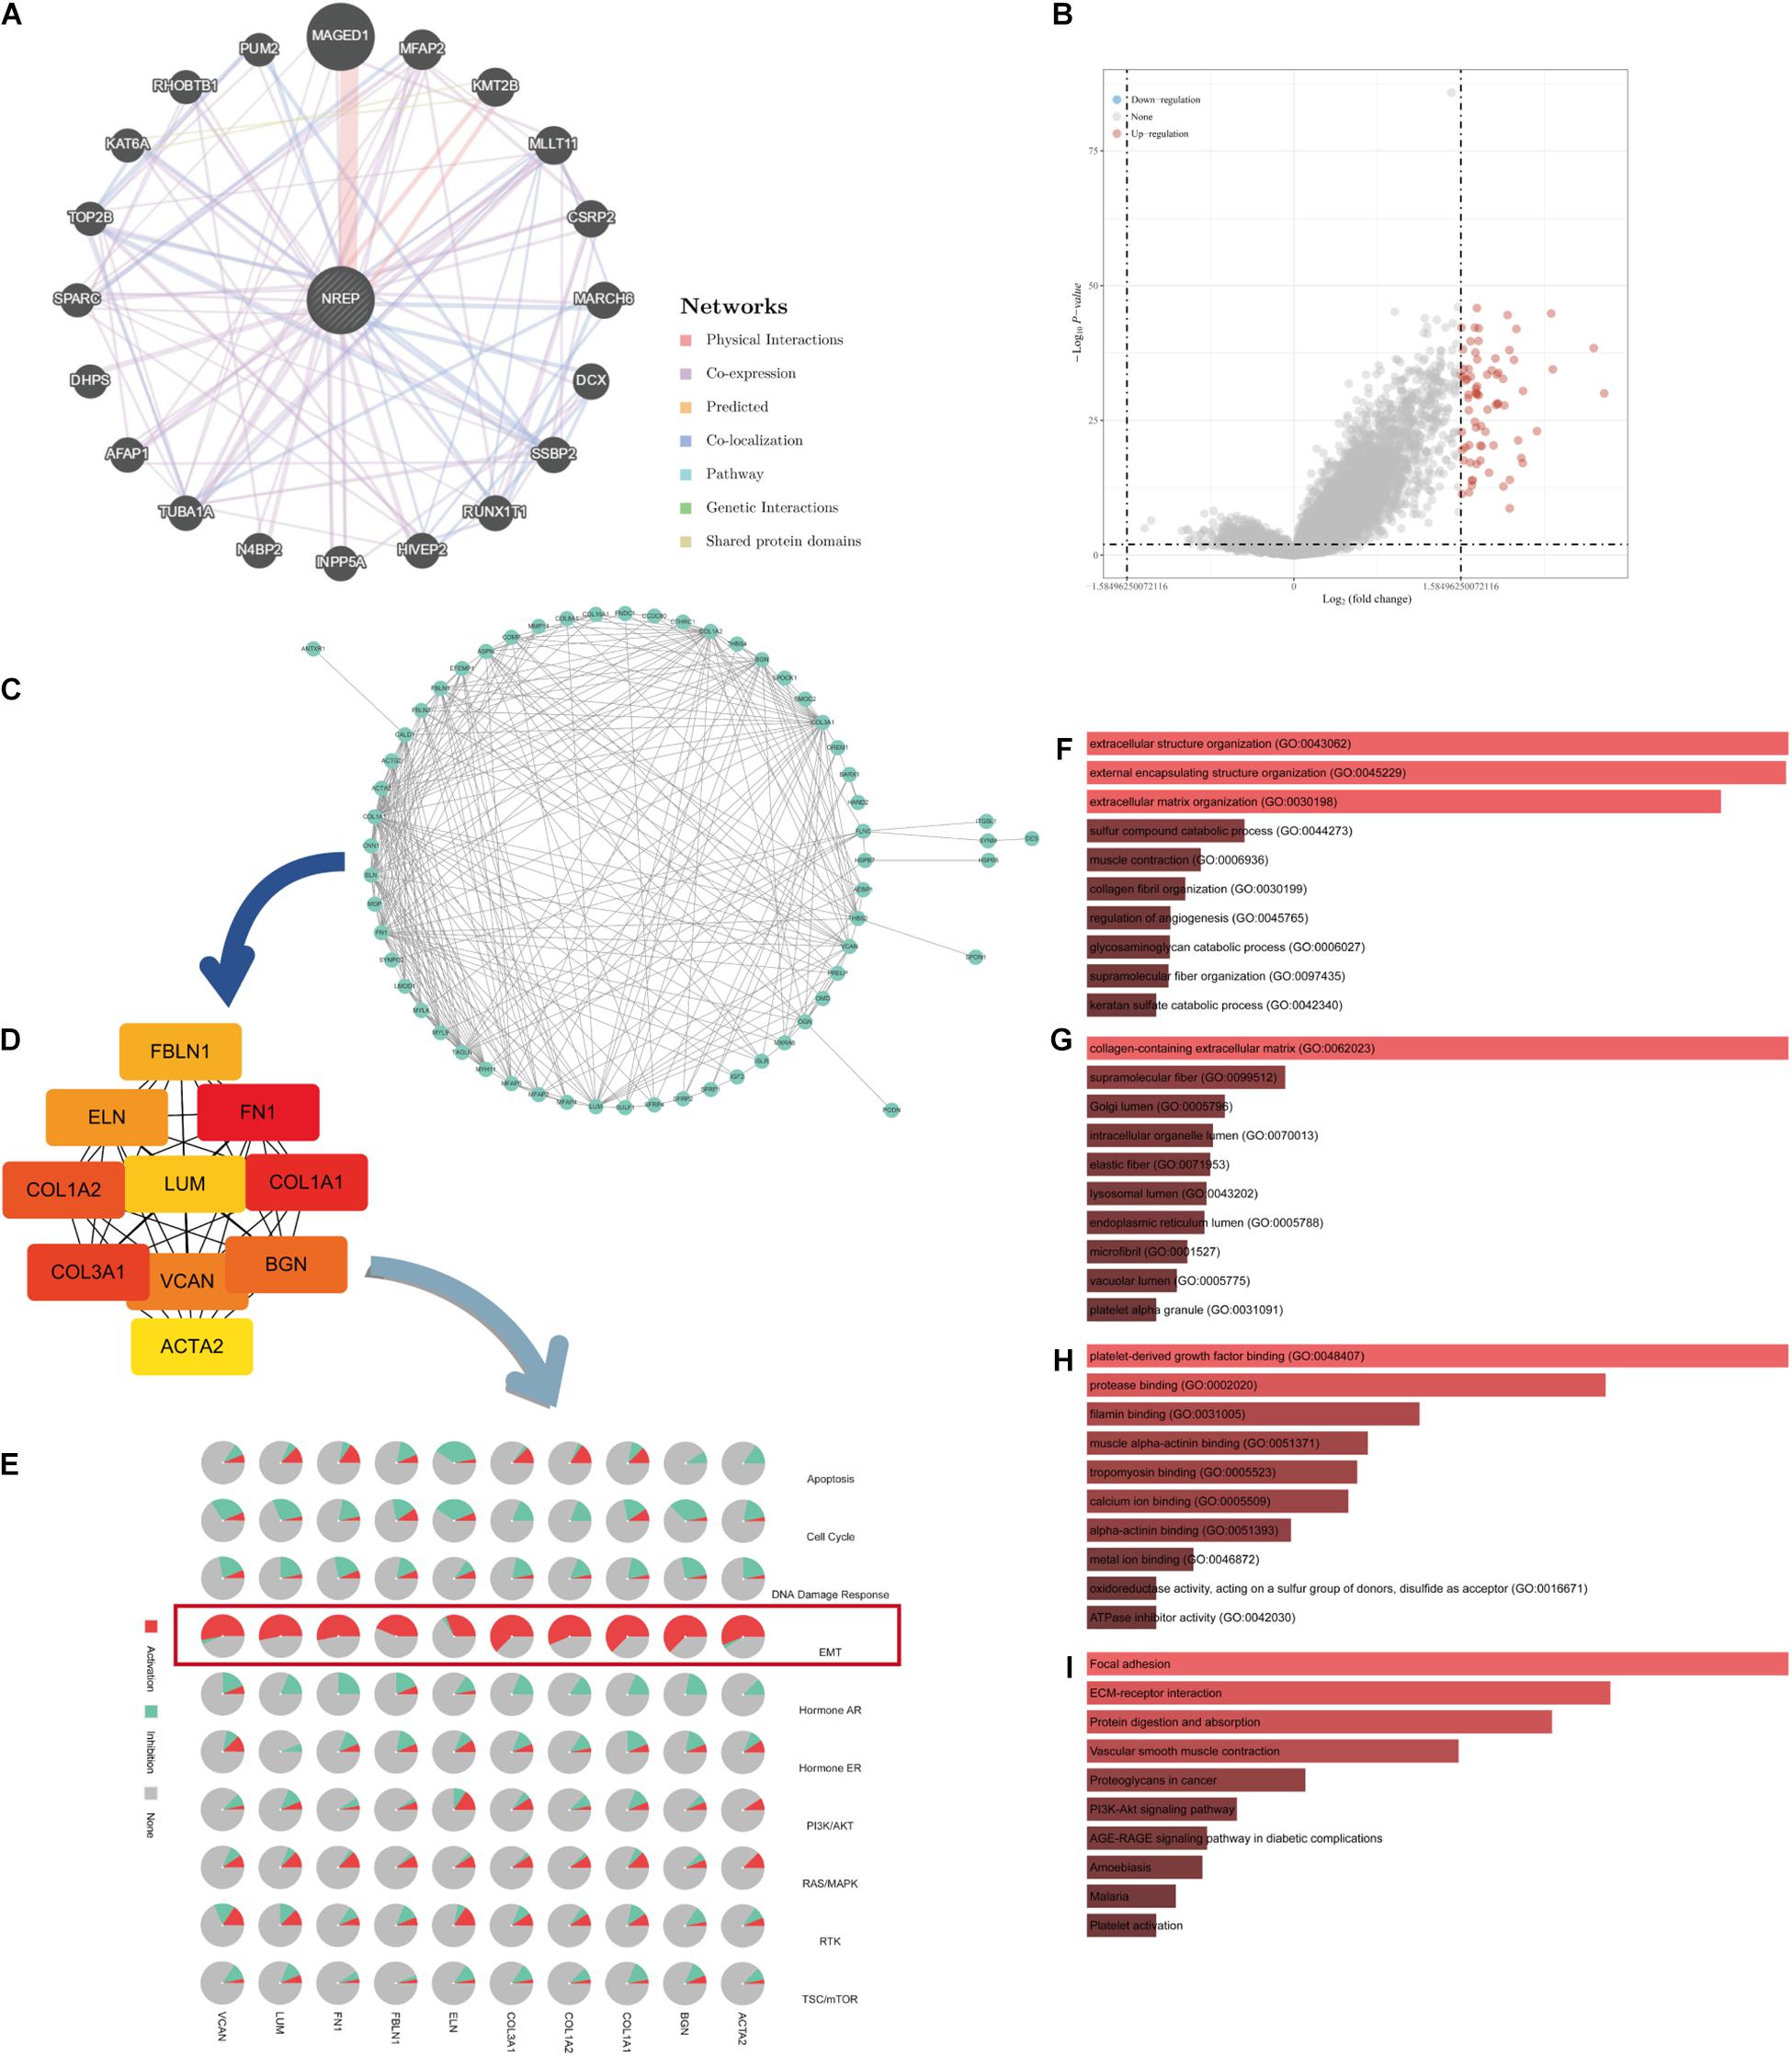
Figure 3. Protein–protein interaction (PPI) network and enrichment analysis. (A) GeneMANIA-based PPI; NREP is at the core of this network. (B) Volcano map of genes showing differential expression after a change in NREP levels. Red dots, up-regulated genes; blue dots, down-regulated genes; abscissa, differences in gene expression (log2 fold change); and ordinate, significance of these differences (−log10 padj). (C) Network of NREP and genes with NREP-linked expression (positive). (D) Hub gene network of NREP. (E) Relationship between hub genes and epithelial–mesenchymal transition. (F–I) Functional enrichment analysis of NREP-related genes. (F) Biological Processes (BP), (G) Cellular Components (CC), (H) Molecular Functions (MF), and (I) Kyoto Encyclopedia of Genes and Genomes (KEGG).
Additional survival analysis revealed that the levels of 5 up-regulated genes were associated with the prognosis of GC patients (Supplementary Figures 1K–T).
Relationship Between NREP and EMT and Its Underlying Mechanism
In vitro NREP silencing in HGC27 and MKN74 cells using shRNA constructs significantly down-regulated NREP expression (Supplementary Figure 2; P < 0.01). NREP silencing also decreased tumor cell clone formation (Figure 4A). In contrast, the opposite trend was observed in cells overexpressing NREP. Moreover, stable NREP overexpression in MKN74 cells promoted the formation of subcutaneous xenograft tumors in vivo (Figures 4B–D; P < 0.01). GSEA for NREP revealed the potential role of NREP in “epithelial–mesenchymal transition” and “TGF-beta signaling.” Analyses using TIMER data revealed a positive correlation between NREP and TGF-β1 expression (R = 0.520, P < 0.001; Figure 4E). Subsequent in vitro experiments using ELISA revealed a reduction in TGF-β1 levels in culture medium after NREP silencing (P < 0.05; Figure 4F), and the opposite trend was observed when NREP was overexpressed. NREP overexpression was also found to increase EMT-related phenotypes such as the migration and invasion of GC cells and the expression of EMT-associated proteins. However, this effect was attenuated after treatment with the TGF-β signaling kinase inhibitor LY364947 (Figures 4G–J). In addition, cell viability assays showed that the selected concentration of LY364947 did not affect cell proliferation (Supplementary Material 1). Further analyses based on TIMER data also revealed a positive correlation between the expression of NREP and that of CDH2 (R = 0.64, P < 0.001), MMP2 (R = 0.65, P < 0.001), MMP9 (R = 0.13 P = 0.01), and VIM (R = 0.69, P < 0.001). Further, NREP expression was found to show a negative correlation with CDH1 expression (R = −0.130, P = 0.01; Figure 4K). Therefore, NREP silencing and overexpression altered the levels of EMT-related proteins (Figures 4L,M).
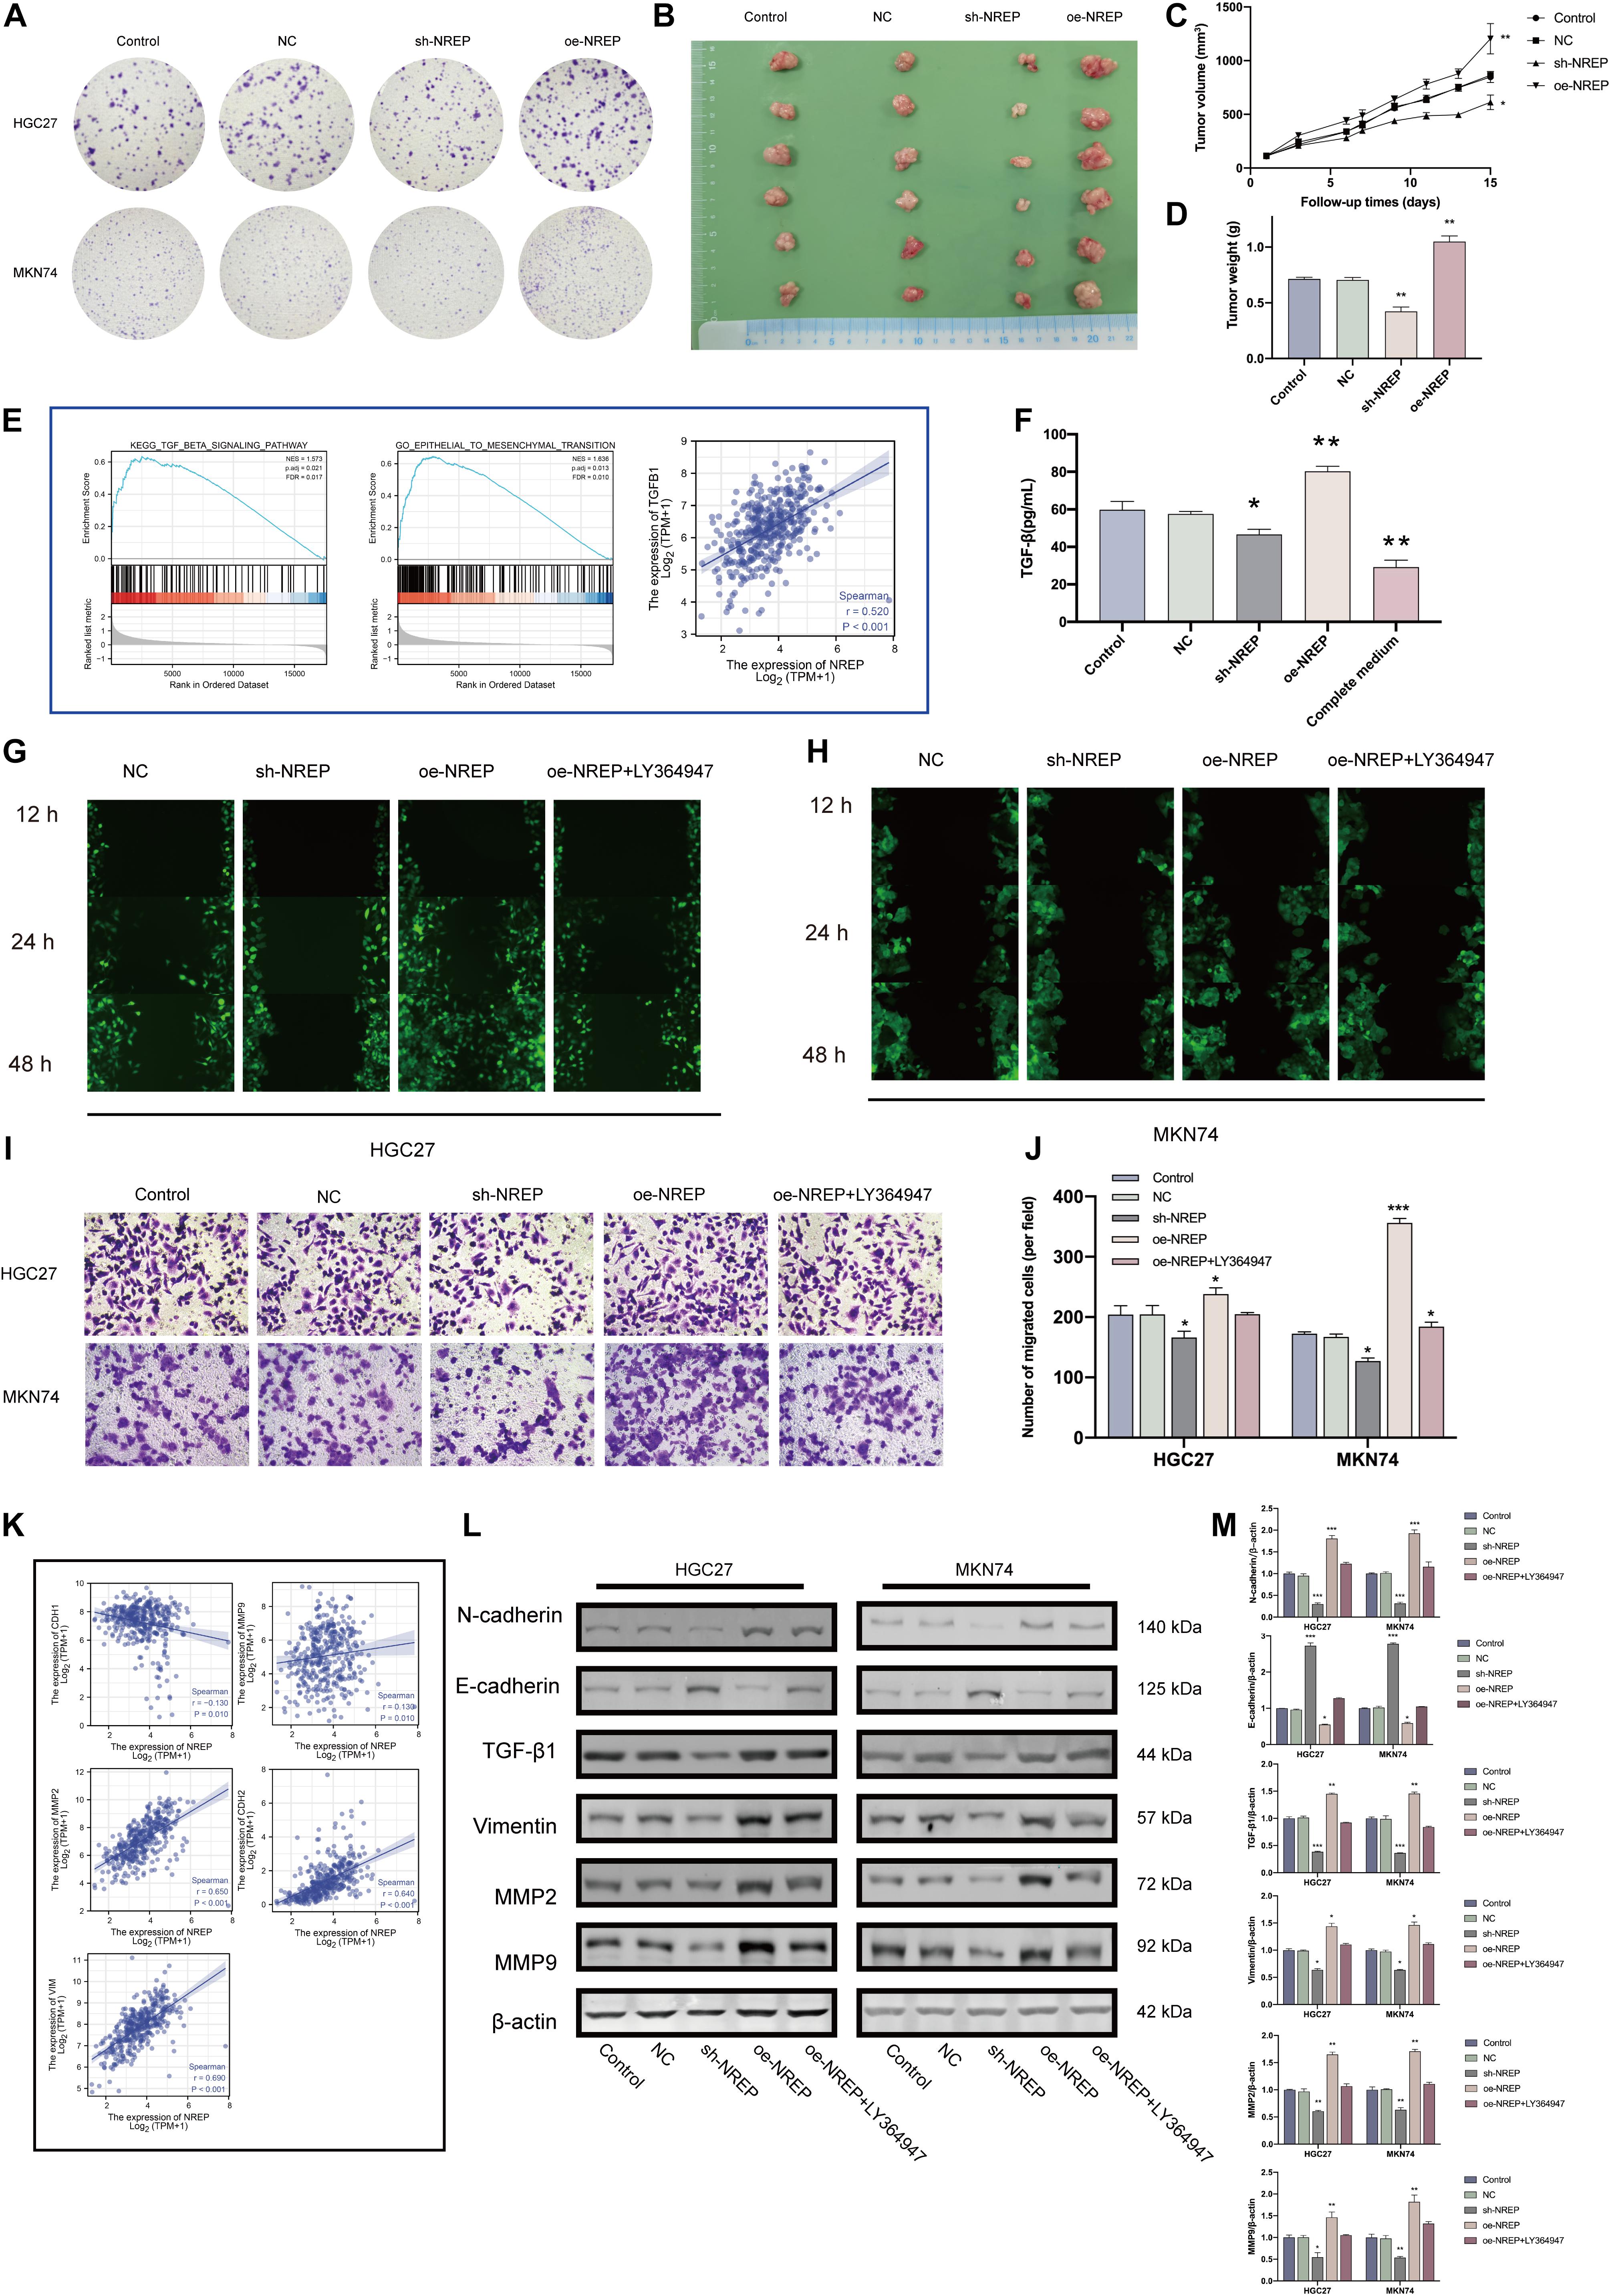
Figure 4. NREP overexpression promotes a malignant phenotype in gastric cancer (GC). (A) Clone formation capacity of GC cells transfected with the NC, sh- NREP, and oe-NREP constructs assessed using the clone formation assay. (B) Xenograft tumors from nude mice. (C,D) Tumor volume (C) and weights (D) of xenografts from nude mice (E) Gene Set Enrichment Analysis (GSEA) of NREP and correlation analysis between NREP and TGF-β1 expression using TIMER. (F) TGF-β1 levels in the supernatant of GC cells transfected with NC, sh-NREP, and oe-NREP examined using ELISA. (G,H) Migratory ability of different group of GC cells [(G): HGC27, (H): MKN74] examined using wound healing assays. (I,J) The invasion ability of GC cells after transfection (I; magnification, ×200); the relative invasive cell number is shown toward the right in (J). (K) Correlation coefficient circles for NREP and EMT-related genes (TIMER). (L) Expression of EMT-related proteins examined using western blots after the transfection of GC cells with NC, sh-NREP, and oe-NREP constructs and treatment with 5 μM LY364947, an inhibitor specific to TGF-β type I receptor. (M) Statistical analysis of western blot results. (*P < 0.05, **P < 0.01, and ***P < 0.001).
Relationship of NREP Expression With Cytoskeletal Remodeling and Gastric Cancer Cell Apoptosis
Gene set enrichment analysis also revealed functional enrichment for NREP under the “ACTIN FILAMENT ORGANIZATION” and “ACTIN_CYTOSKELETON” domains (Figure 5A). Subsequent in vitro experiments revealed that NREP overexpression caused the up-regulation of F-actin (Figures 5B,C; P < 0.01). Moreover, after TUNEL staining, no TUNEL-positive cells were detected in cells overexpressing NREP. In contrast, NREP knockdown and LY364947 treatment increased the number of TUNEL-positive cells (Figure 5D).
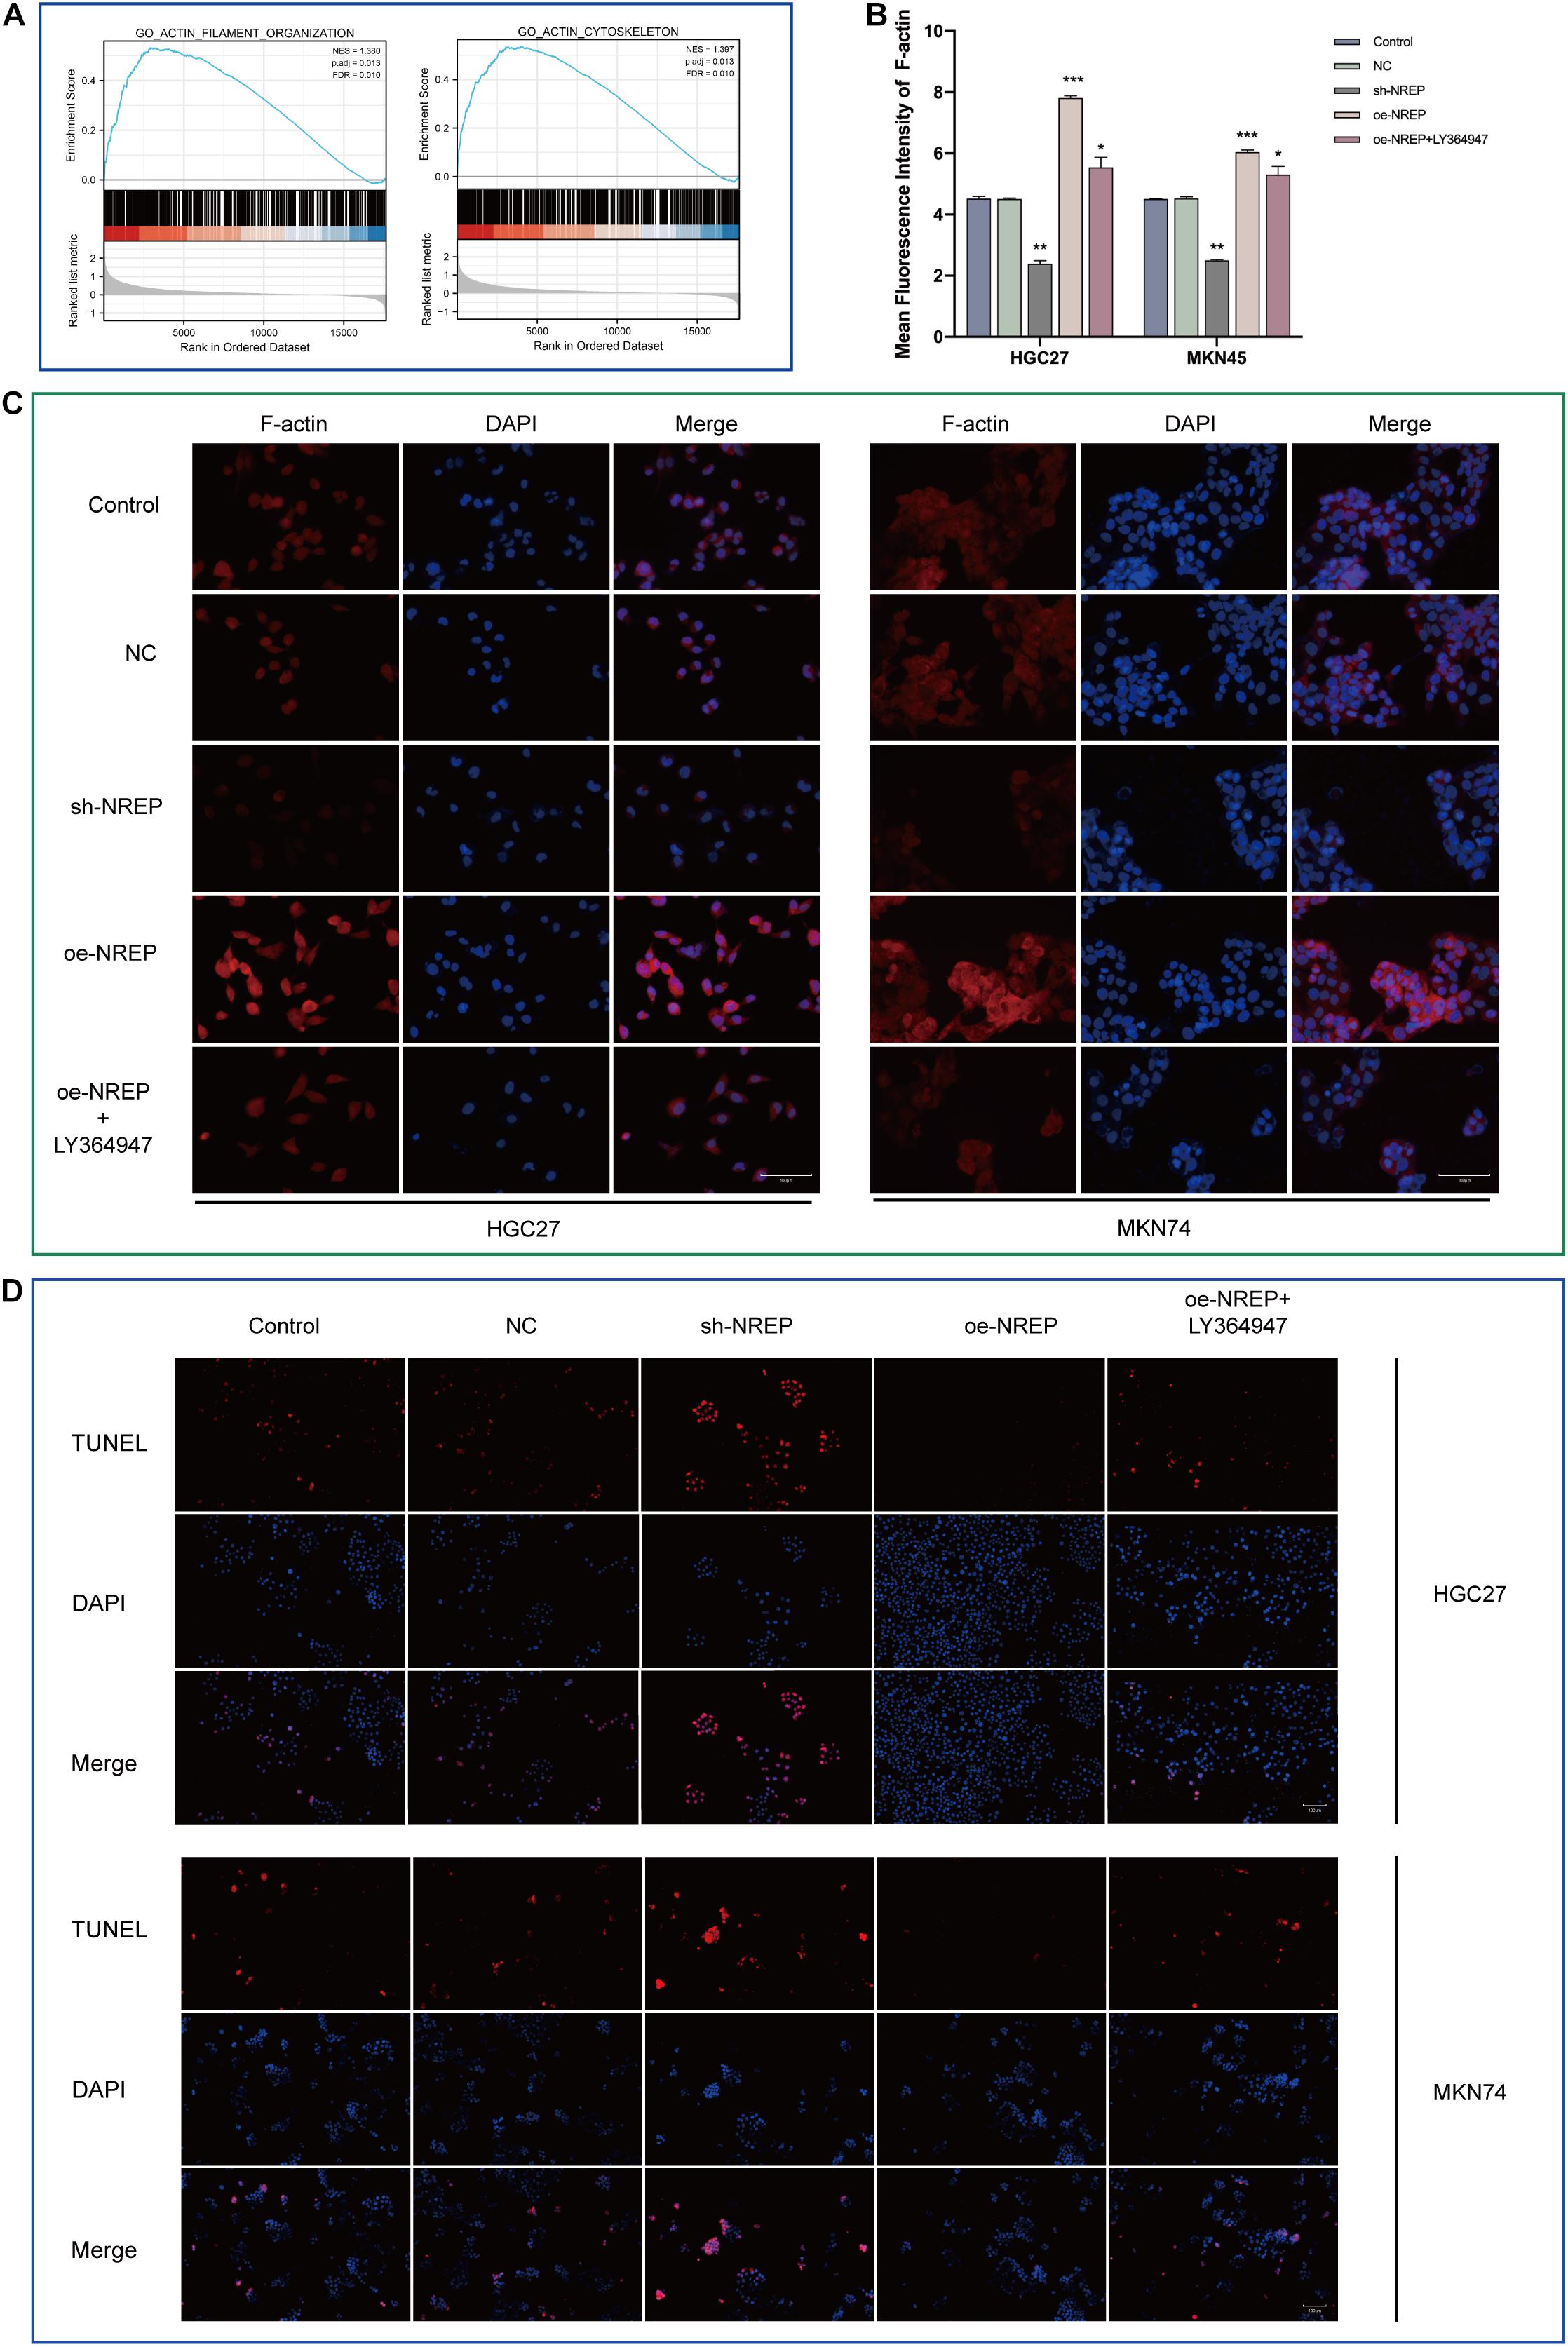
Figure 5. Relationship between NREP and F-actin cytoskeleton and cell apoptosis. (A) Gene Set Enrichment Analysis (GSEA) of NREP. (B) Immunofluorescence intensities. (C) F-actin levels in gastric cancer (GC) cells (control cells and GC cells transfected with the NC, sh-NREP, and oe-NREP constructs) treated with 5 μM LY364947 detected using immunofluorescence staining (magnification, ×400). (D) Apoptosis assessed using a TUNEL assay (TUNEL-positive cells indicated in red; magnification, ×200). (*P < 0.05, **P < 0.01, ***P < 0.001).
Relationship of NREP Expression With the Differentiation of Mesenchymal Stromal Cells Into Cancer-Associated Fibroblasts
The abundance of cancer-associated fibroblasts (CAFs) was found to be a potential prognostic factor in GC (Table 1). Using the EPIC and MCP-counter algorithms and TCGA-STAD data (Figures 6A,B), we found that NREP expression was positively correlated with CAF abundance (EPIC: R = 0.715, P = 1.13e-60 and MCP-counter: R = 0.761, P = 5.74e-73). Subsequent single-cell-level analyses revealed that NREP was mainly expressed in fibroblasts, which are important players in EMT (Figures 6C–F).
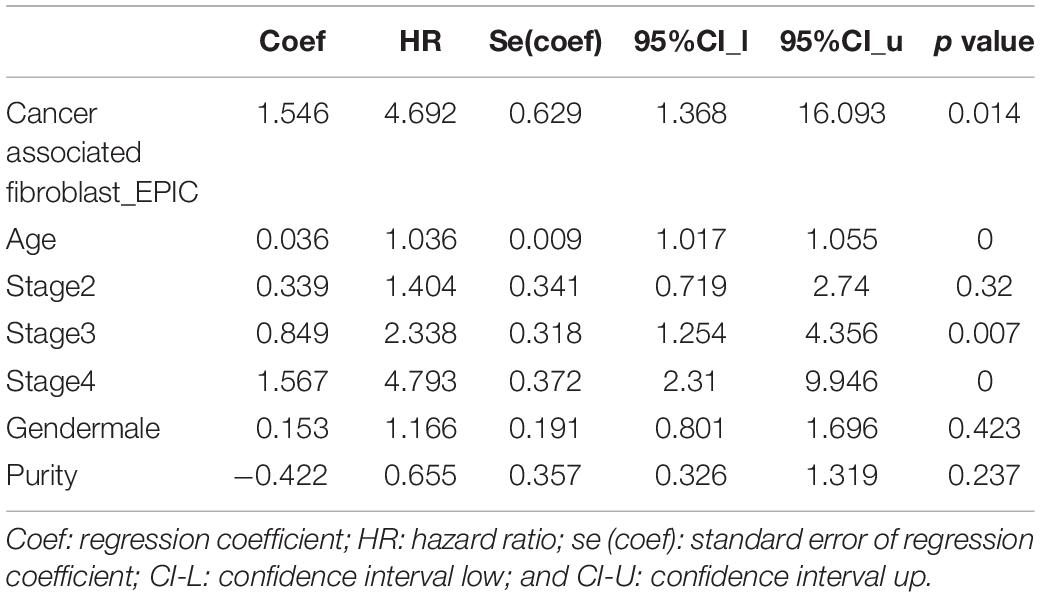
Table 1. The Cox analysis of the Cancer associated fibroblast (CAFs).
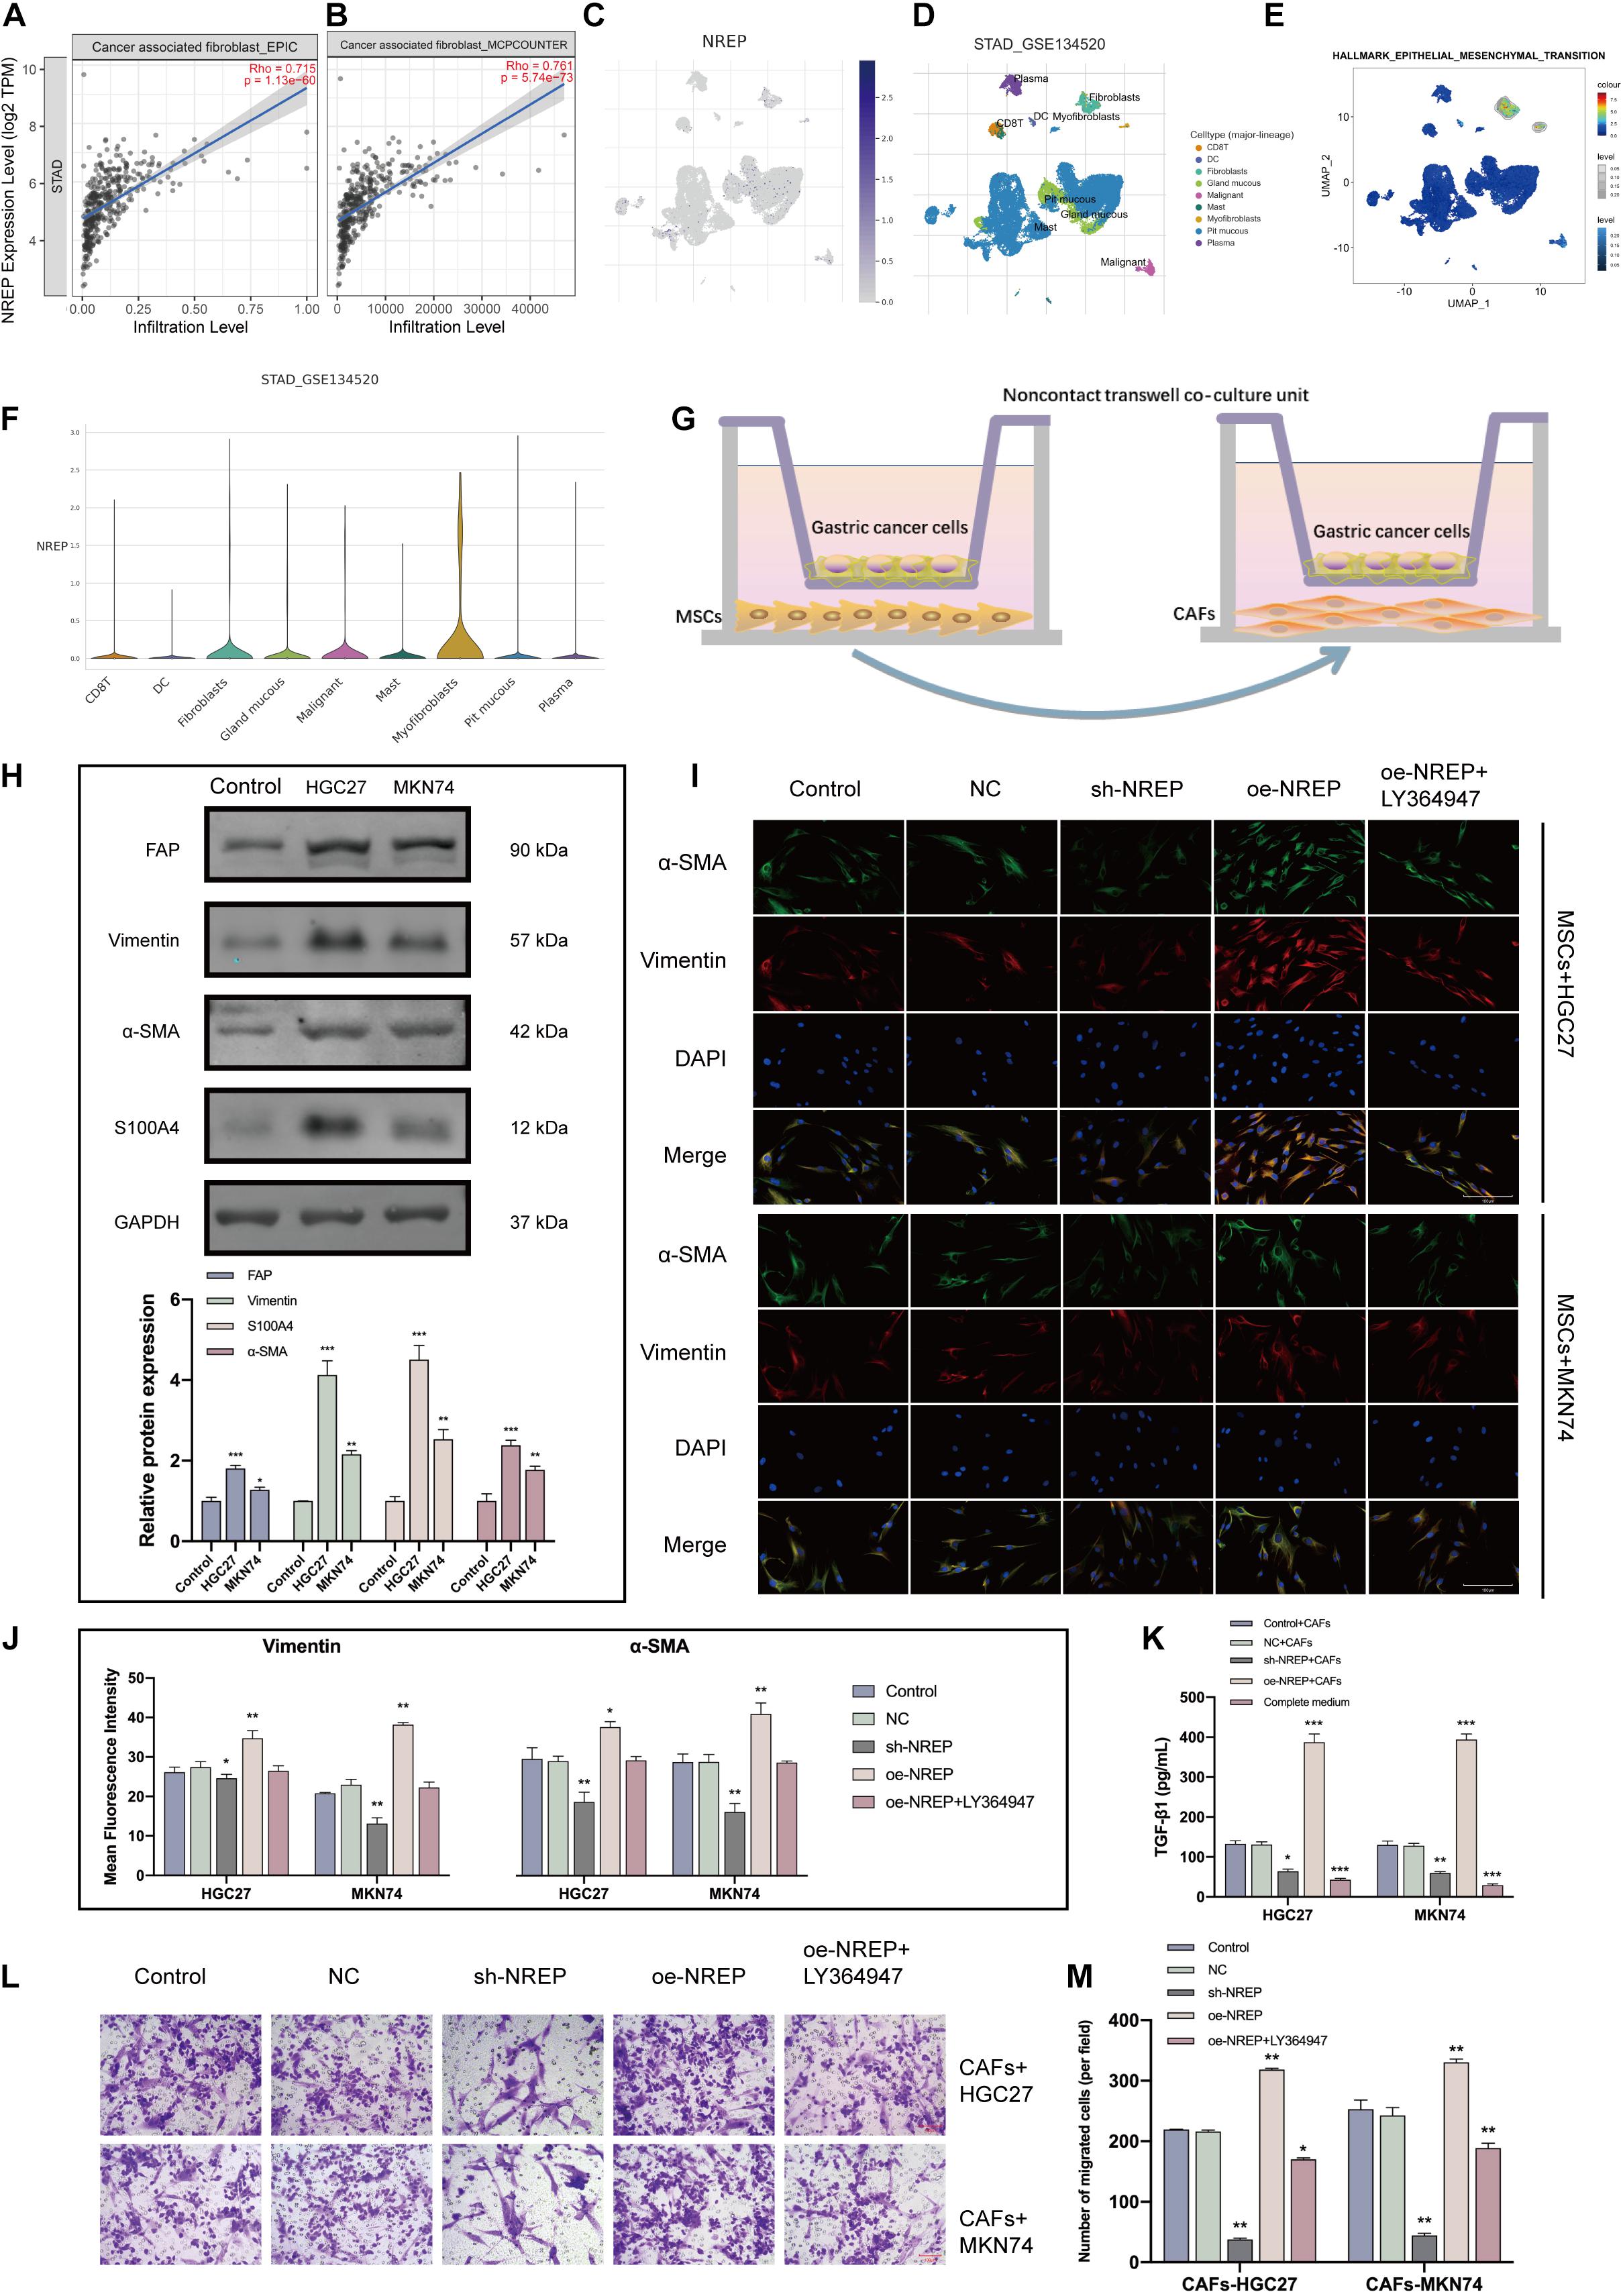
Figure 6. NREP upregulation in gastric cancer (GC) promotes the activation and recruitment of cancer-associated fibroblasts (CAFs). (A,B) Correlation of NREP expression with CAFs based on the Fei et al., 2018 (A) and Li et al, 2020 (B) datasets. (C) Uniform manifold approximation and projection (UMAP) plots illustrating the expression of NREP clusters. (D) UMAP plots illustrating the GC cell landscape. We found nine cell clusters across 56,440 cells after quality control, dimensionality reduction, and clustering. (E) Enrichment score for genes from the Hallmark hypoxia gene set in each cell, obtained using gene set variation analysis. (F) Violin plots for GC cell cluster marker genes and NREP in different cell types. Expression was measured as log 2 (TP10K + 1). (G) A non-contact co-culture unit of MSCs and GC cells established by incubating MSCs with GC cells at a 1:1 ratio. (H) After co-culture with GC cells for 4 days, CAF-related markers were examined using western blots. (I) Immunofluorescence staining of MSCs co-cultured with GC cells (control cells and GC cells transfected with the NC, sh-NREP, and oe-NREP constructs) treated with 5 μM LY364947 (magnification, ×400). (K) After co-culture with different groups of GC cells for 4 days, ELISA assays were used to demonstrate an increase in the TGF-β1 protein levels in the supernatant of the co-culture system. (L) The transwell system was used to investigate the ability of GC cells to recruit CAFs. (magnification, ×200). (M) The number of migrated cells was counted using Image (J). (*P < 0.05, **P < 0.01, and ***P < 0.001).
Local and recruited MSCs are known to transform into CAFs at close proximity to tumor cells. To test whether NREP overexpression in GC facilitates the conversion of MSCs into CAFs, we co-cultured MSCs with GC cells (Figure 6G). After the co-culture of MSCs with GC cells, CAF markers were remarkably up-regulated in MSCs (Figure 6H; P < 0.01, P < 0.001). Furthermore, we co-cultured MSCs with GC cells showing different levels of NREP expression for 4 days. Immunofluorescence staining revealed that α-SMA and Vimentin levels were up-regulated in the NREP overexpression group, whereas they were down-regulated in the sh-NREP group (Figures 6I,J; P < 0.05, P < 0.01). Interestingly, ELISA revealed a 4-fold increase in the levels of TGF-β1 in the cell supernatant after MSCs were co-cultured with NREP-overexpressing cells (Figure 6K; P < 0.05, P < 0.05, and P < 0.001). Consistent with our previous results, these findings also showed that a TGF-β inhibitor can decrease the ability of MSCs to differentiate into CAFs in a co-culture unit.
Recently, two modes of cancer cell invasion have been defined: collective cancer cell invasion and fibroblast-led collective invasion. Next, we examined the effect of NREP overexpression on CAF recruitment through a transwell experiment. We observed that with an increase in NREP expression, the ability of GC cells to recruit CAFs was significantly enhanced (Figures 6L,M).
Together, these results indicated that NREP may contribute to GC progression by recruiting and activating fibroblasts.
Relationship of NREP Expression With M2 Macrophage Infiltration
Using CIBERSORT, we found that the proportion of tumor-infiltrating cells was positively correlated with NREP levels and the presence of M2 macrophages in patients with GC (P < 0.001; Figure 7A). Subsequently, the relationship of NREP expression with macrophage polarization was assessed using the Li et al, 2020 and Fei et al., 2018 datasets. The correlation between NREP expression and immune cell subpopulations is shown in Figure 7B. Interestingly, NREP expression levels were found to be positively correlated with M2 macrophage abundance (Figure 7C).
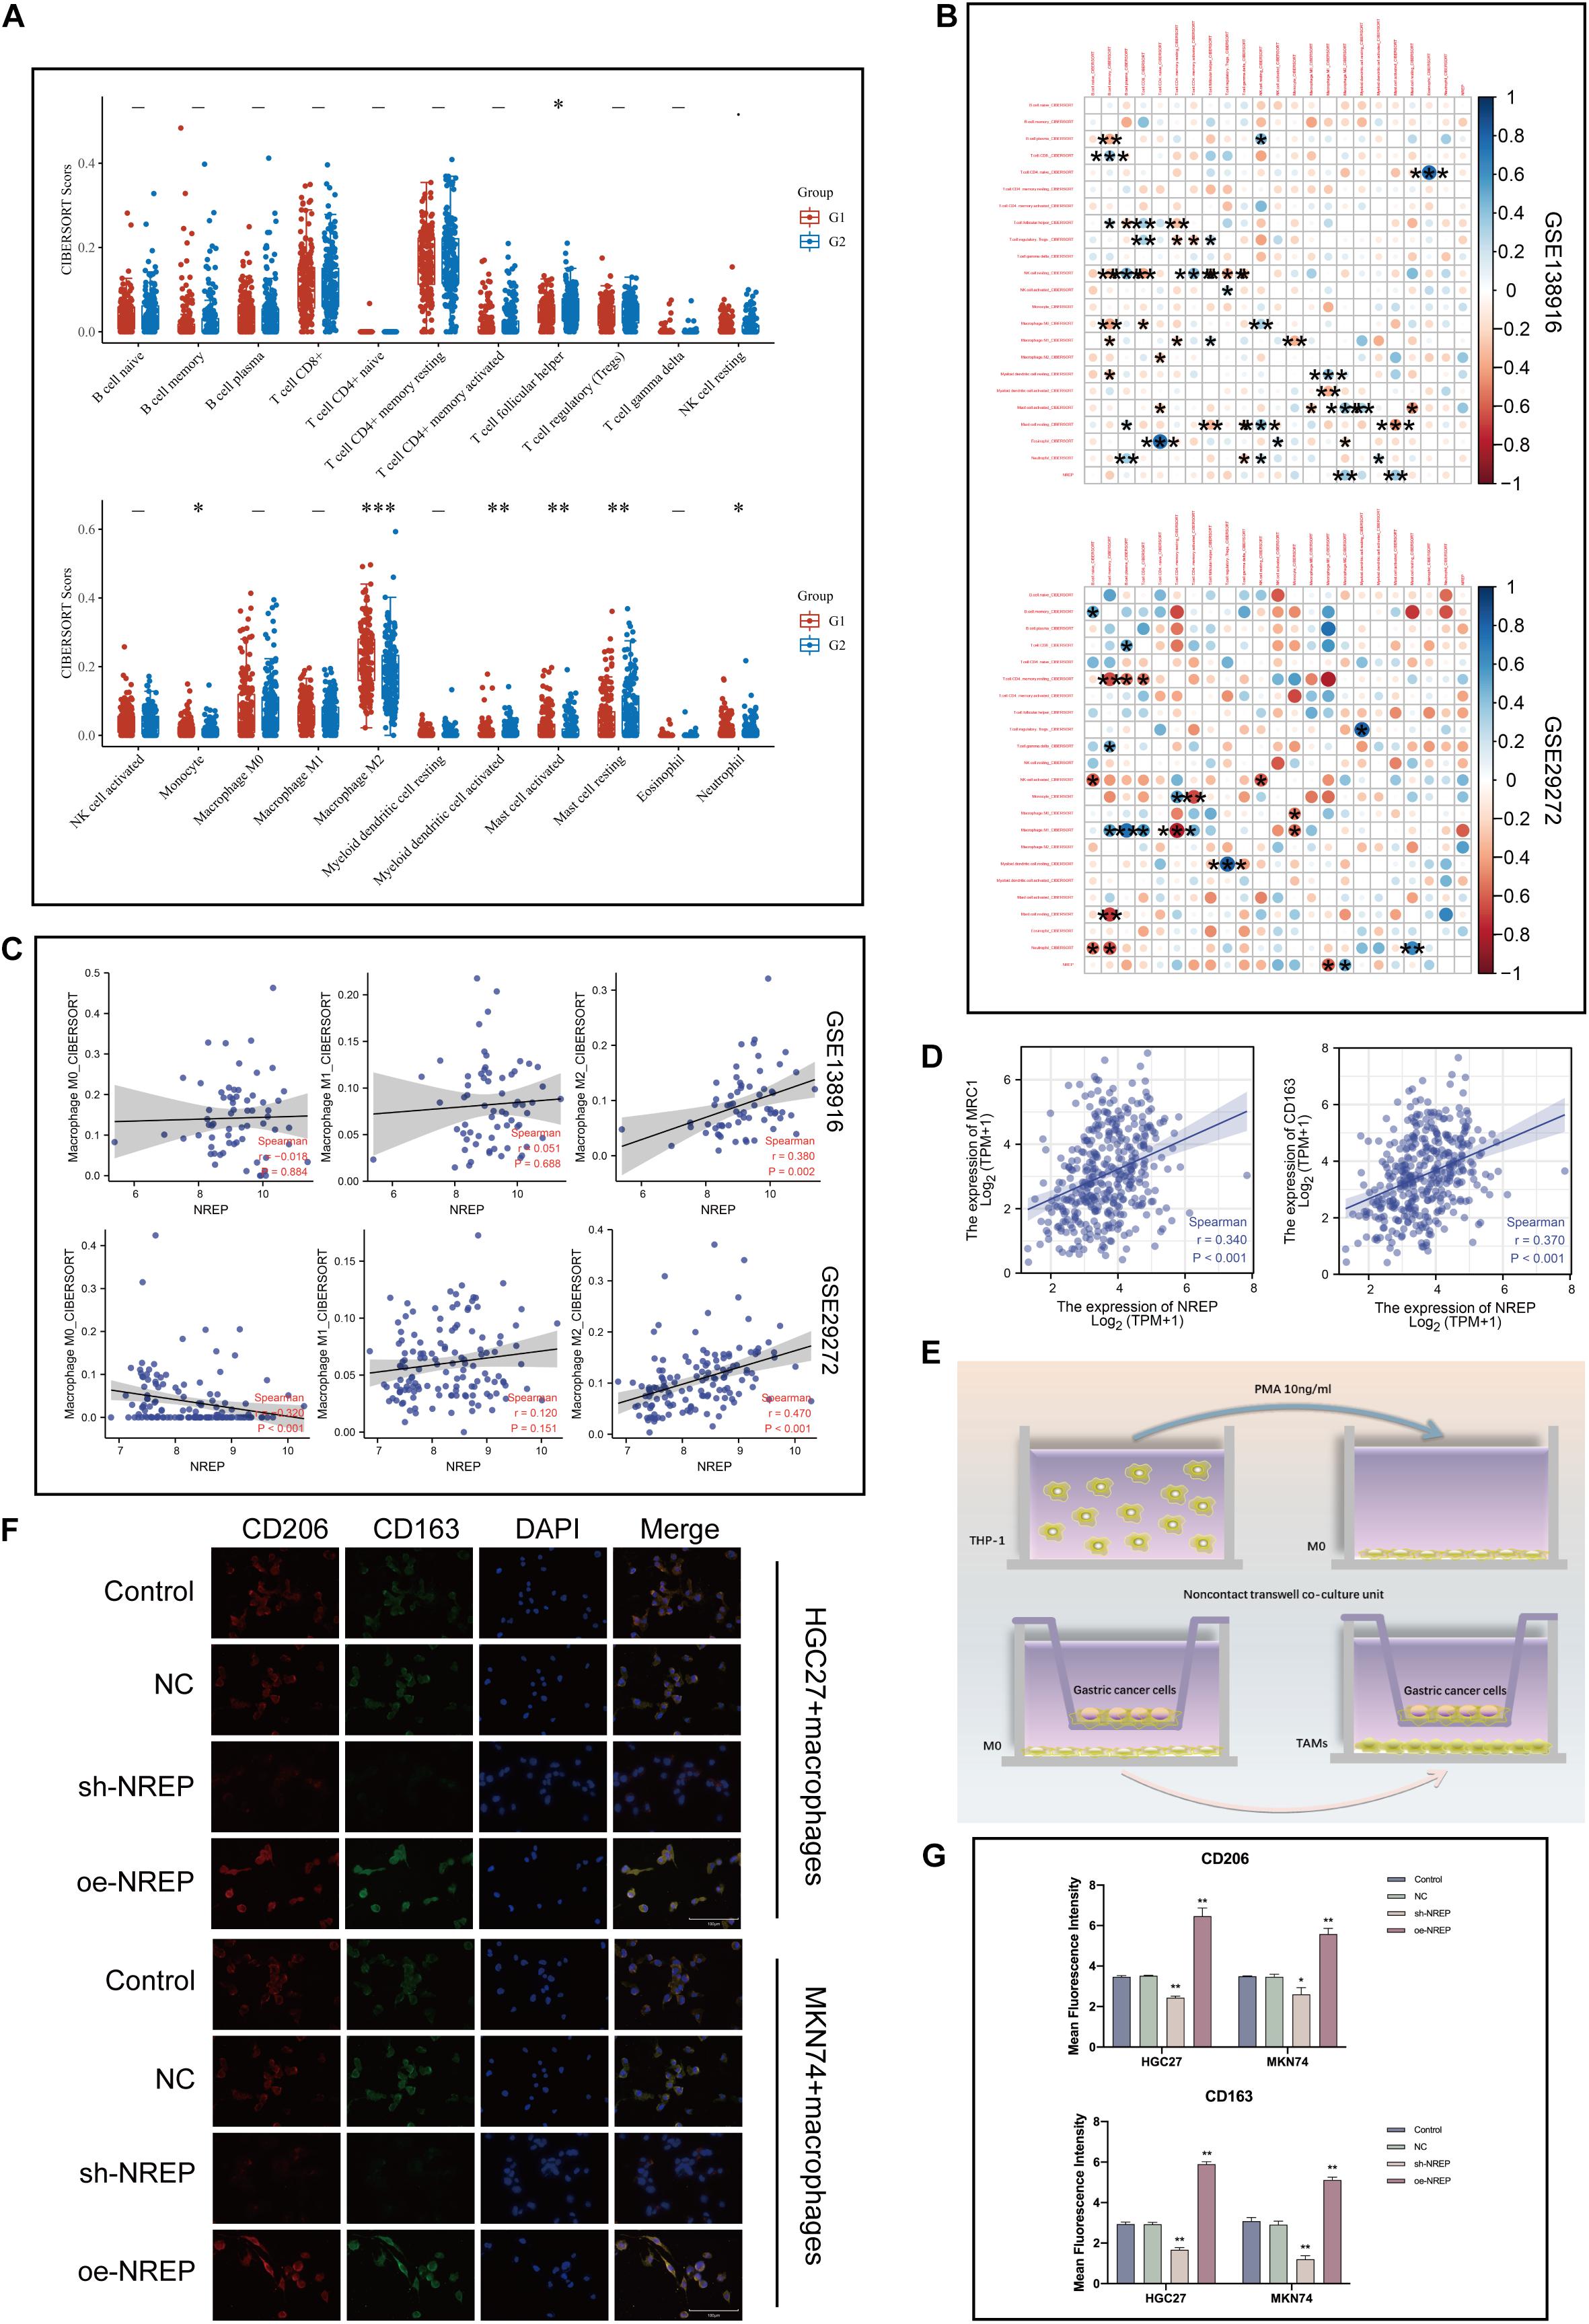
Figure 7. Association of NREP expression with the abundance of M2 tumor-associated macrophage infiltration. (A) Score distribution of immune cells in gastric cancer (GC) and normal tissues. Horizontal axis, different groups; vertical axis, distribution of gene expression; G1, high NREP expression group; and G2, low NREP expression group. (B) Correlation matrix showing the abundance of 22 types of immune cells. (C) Correlation of NREP expression levels with macrophage abundance based on Fei et al., 2018 and Li et al, 2020 datasets. (D) Correlation of NREP expression levels with M2 macrophage markers. (E) Schematic diagram for the tumor–macrophage cell co-culture. (F) Immunofluorescence staining for CD206 (green) and CD163 (red; magnification, ×400). (G) Immunofluorescence expression. (*P < 0.05, **P < 0.01, and ***P < 0.001).
Therefore, we calculated the correlation of NREP with M2 surface markers using the TIMER database and observed a positive correlation between NREP expression and MRC1 (CD206; R = 0.34, P < 0.001) and CD163 (R = 0.37, P < 0.001) expression (Figure 7D). This series of results suggested the presence of a positive association between NREP expression and M2 macrophage infiltration. To further investigate the influence of NREP overexpression on M2 macrophage abundance in GC, we established a tumor–macrophage cell co-culture model using a transwell non-contact co-culture unit (Figure 7E). We observed that NREP overexpression significantly up-regulated the surface markers of M2 TAMs (CD206 and CD163; Figures 7F,G).
Hence, our findings confirmed the positive correlation between NREP levels and the abundance of M2 macrophage infiltration.
Discussion
Gastric cancer is a very common form of cancer (Machlowska et al., 2020). Previous studies have shown that a large number of genetic and epigenomic alterations in oncogenes as well as genetic instability together govern gastric carcinogenesis, a multistep process that involves the interactive regulation of numerous molecular networks (Chia and Tan, 2016). Thus, the search for new oncogenes and biomarkers not only helps in developing new antitumor drugs, but also helps to broaden the known tumor-associated molecular network (Gyurkó et al., 2013). However, gastric tumors contain more than just cancer cells; they are a complex ecosystem composed of several different types of cells and cytokines, all of which greatly influence the proliferation, adhesion, movement, invasion, and metastasis of GC. During tumor formation, tumor cells must adhere closely to the ECM and communicate with other cells to form a stromal microenvironment suitable for proliferation and eventually metastasis (Mierke, 2019; Zeng et al., 2019).
As a potentially useful target gene for tumor therapy, NREP can not only directly affect the biological characteristics of tumor cells, but also reshape the TME and influence patient prognosis. The association between NREP and the TGF-β1 pathway has been clearly demonstrated (Yue et al., 2014). TGF-β1 is the most effective inductor of EMT and has been found to be up-regulated in a variety of tumors (Chen et al., 2017). NREP is thought to stimulate the expression of TGF-β1 by promoting the methylation of the NREP promoter and activating the TGF-β1 5′/3′ UTR (Li et al., 2016). Recent studies have revealed that NREP promotes renal fibrosis via the TGF-β1 signaling pathway and that the deletion of NREP results in delayed burn wound healing (Stradiot et al., 2018). The process of tumor development has been frequently compared to wound healing owing to several shared molecular and biological processes, including neovascularization, ECM remodeling, and fibrosis (Chang et al., 2004). Therefore, it is reasonable to speculate that NREP supports cancer metastasis and the formation of the tumor stromal microenvironment.
It is well known that EMT is a very dynamic process and causes several changes in the cellular phenotype, leading to dramatic cytoskeleton remodeling and the facilitation of cell motility (Pastushenko and Blanpain, 2019). After pooling the genes with NREP-linked expression levels, we detected a significant enrichment for EMT-related pathways, including growth factor binding and integrin binding. To further validate this result, we predicted the functions of 10 hub genes using the GSCALite online tool and found that they contribute positively toward the EMT phenotype. Further experiments confirmed that the overexpression of NREP significantly up-regulated TGF-β1 and activated the EMT phenotype.
Cancer-associated fibroblasts, important constituents of the tumor stromal microenvironment, play a vital role in tumor–stroma crosstalk, promoting tumor development and progression (Liao et al., 2019). They also secrete oncogenic growth factors, produce ECM, and promote EMT (Pape et al., 2020). TGF-β1-mediated signaling in CAFs has been identified as a pivotal mediator (Porcelli et al., 2019). The TIMER online tool showed that the abundance of CAF infiltration was positively correlated with the expression levels of NREP. We also performed single-cell-level analyses and found that NREP was predominantly expressed in myofibroblasts, which are a subset of activated fibroblasts characterized by the expression of α-SMA. It has been well-documented that myofibroblasts can be derived from pre-existing stromal fibroblasts and drive tumor progression by establishing TGF-β autocrine signaling in a cell-autonomous manner (Kojima et al., 2010). Considering that bone marrow-derived precursors and bone marrow MSCs are among the multiple origins of CAFs (Borriello et al., 2017), we first co-cultured NREP-overexpressing GC cells with MSCs and observed a significant increase in the abundance of CAFs. Further experiments showed that NREP-overexpressing GC cells had a stronger ability to recruit CAFs. It has been well-established that CAFs are powerful inducers of EMT activation, and therefore, our findings indicate that NREP has a vital function in this process.
An essential step in migration is the remodeling of the cytoskeleton — involving the reorganization and rebuilding of the actin cortical cytoskeleton — which promotes movement (Urra et al., 2018). CAF-derived chemokines influence tumor cell motility by modifying the formin-assembled F-actin cytoskeleton (Zhai et al., 2019). In the present study, GSEA suggested that NREP may be involved in cytoskeletal remodeling, and subsequent experiments also confirmed that NREP significantly up-regulated F-actin expression levels. Our data demonstrated that NREP promotes the activation and chemotaxis of CAFs. Therefore, CAFs may be one of the key factors mediating the promotion of cytoskeletal remodeling by NREP in GC cells. Notably, F-actin depolymerization and the changes in its cellular distribution, i.e., the transfer of actin filaments from the cytoplasm to the nucleus, are obvious in apoptotic cells (May and Machesky, 2001). The manipulation of F-actin remodeling is used as a therapeutic strategy for inducing apoptosis. Resistance to apoptosis is a well-recognized feature of cancer (Giampazolias and Tait, 2016). Subsequent TUNEL staining showed that the overexpression of NREP promoted tumor progression in GC, at least in part, by inhibiting apoptosis.
Normal fibroblasts can acquire a CAF phenotype through communication with cancer cells (Kalluri, 2016). CAFs can be derived from a variety of sources, such as endothelial cells, tumor cells that transdifferentiate into mesenchymal cells via EMT, and bone marrow-MSCs. The recruitment of CAFs from the microenvironment is essential for remodeling the tumor’s ECM and allowing tumor motility and metastasis (Monteran and Erez, 2019). Our findings directly confirm the involvement of NREP in this complex process.
During the development of GC, a large number of peripheral blood mononuclear cells are attracted to the tumor mesenchyme and transform into TAMs (Sica et al., 2006). Phenotypic analysis has revealed that in progressive GC, infiltrating TAMs often show the immunosuppressive M2 phenotype and play a key role in promoting tumor EMT (Suarez-Carmona et al., 2017). Recent studies have found that tumor cells undergoing EMT promote the M2 phenotype in macrophages by secreting tumor metabolites, and M2 macrophages in turn secrete a variety of cytokines to promote tumor transformation to the mesenchyme, leading to a vicious cycle (Li et al., 2019). CAFs are also known to enhance TAM recruitment in the TME, creating a positive feedback loop between CAFs and TAMs and the ECM (Cho et al., 2018). Therefore, we first analyzed the relationship between the levels of NREP and the infiltration of multiple immune cells based on TCGA-STAD data and found that the level of M2 macrophage infiltration was positively correlated with NREP expression; moreover, this correlation showed the highest statistical significance. Similar results were obtained from two other independent GEO datasets. Our co-culture experiments also confirmed the positive effect of NREP on the levels of CD163 and CD206 (MRC1), which are surface markers of M2 macrophages. Therefore, our findings indicate that NREP promotes M2 macrophage activation — a process that is considered strongly carcinogenic.
Taken together, our results demonstrate that NREP is elevated in GC cells and tissues. High NREP levels are associated with some clinicopathological features of GC and a poor patient prognosis. Our results show that NREP may act as an important player in the complex gene regulatory machinery driving GC via processes such as EMT activation, CAF activation, actin cytoskeleton remodeling, and M2 macrophage infiltration, ultimately promoting tumor development. However, our study has a few limitations. First, in vivo experimental evidence was lacking, and there was insufficient clinical evidence. Therefore, more focused research is needed to elucidate the detailed biological functions and mechanistic roles of NREP in GC and to uncover the functional and regulatory niches of this gene.
Data Availability Statement
The original contributions presented in the study are included in the article/Supplementary Material, further inquiries can be directed to the corresponding author/s.
Ethics Statement
The studies involving human participants were reviewed and approved by the Ethics Committee of the Jiangsu Province Hospital of Chinese Medicine. The patients/participants provided their written informed consent to participate in this study. The animal study was reviewed and approved by the Ethics Committee of the Jiangsu Province Hospital of Chinese Medicine.
Author Contributions
J-pL and Y-hZ developed the experimental plan. Y-jL and S-hZ performed all experiments. S-hZ and Y-dH analyzed the data. Y-jL and J-pL wrote the manuscript. All authors have read and approved the final manuscript.
Funding
The present study was supported by the Youth Science and Technology Project of Suzhou (No. KJXW2019059); the Suzhou Science and Technology Development Plan (No. SYSD2019006); and the Zhangjiagang TCM Hospital Youth Science and Technology Project (No. ZZYQ1915).
Conflict of Interest
The authors declare that the research was conducted in the absence of any commercial or financial relationships that could be construed as a potential conflict of interest.
Publisher’s Note
All claims expressed in this article are solely those of the authors and do not necessarily represent those of their affiliated organizations, or those of the publisher, the editors and the reviewers. Any product that may be evaluated in this article, or claim that may be made by its manufacturer, is not guaranteed or endorsed by the publisher.
Acknowledgments
We are grateful to all the participants of the present study.
Supplementary Material
The Supplementary Material for this article can be found online at: https://www.frontiersin.org/articles/10.3389/fcell.2021.746194/full#supplementary-material
Supplementary Figure 1 | Prognostic roles of 10 hub genes and relationship with sample types in patients from the TCGA-STAD dataset. (A–J) Expression of FBLN1, ELN, FN1, COL1A2, LUM, COL1A1, COL3A1, VCAN, BGN, and ACTA2 in different sample types (normal vs. tumor) based on the TCGA-STAD dataset. High expression, red; low expression, blue. TPM: Transcripts Per Kilobase Million. (K–T) Survival analysis based on FBLN1, ELN, FN1, COL1A2, LUM, COL1A1, COL3A1, VCAN, BGN, and ACTA2 expression.
Supplementary Figure 2 | Validation of cell transfection efficiency.
Footnotes
- ^ https://cistrome.shinyapps.io/timer/
- ^ https://www.oncomine.org/
- ^ https://www.proteinatlas.org/
- ^ https://string-db.org/
References
Al-Batran, S. E., Pauligk, C., and Götze, T. O. (2020). Perioperative chemotherapy for gastric cancer in FLOT4 - Authors’ reply. Lancet 395:e4. doi: 10.1016/s0140-6736(19)32516-4
Borriello, L., Nakata, R., Sheard, M. A., Fernandez, G. E., Sposto, R., Malvar, J., et al. (2017). Cancer-Associated Fibroblasts Share Characteristics and Protumorigenic Activity with Mesenchymal Stromal Cells. Cancer Res. 77, 5142–5157. doi: 10.1158/0008-5472.Can-16-2586
Bustin, S. A., Benes, V., Nolan, T., and Pfaffl, M. W. (2005). Quantitative real-time RT-PCR–a perspective. J. Mol. Endocrinol. 34, 597–601. doi: 10.1677/jme.1.01755
Chang, H. Y., Sneddon, J. B., Alizadeh, A. A., Sood, R., West, R. B., Montgomery, K., et al. (2004). Gene expression signature of fibroblast serum response predicts human cancer progression: similarities between tumors and wounds. PLoS Biol. 2:E7. doi: 10.1371/journal.pbio.0020007
Chen, B., Khodadoust, M. S., Liu, C. L., Newman, A. M., and Alizadeh, A. A. (2018). Profiling Tumor Infiltrating Immune Cells with CIBERSORT. Methods Mol. Biol. 1711, 243–259. doi: 10.1007/978-1-4939-7493-1_12
Chen, Q., Yang, W., Wang, X., Li, X., Qi, S., Zhang, Y., et al. (2017). TGF-β1 Induces EMT in Bovine Mammary Epithelial Cells Through the TGFβ1/Smad Signaling Pathway. Cell Physiol. Biochem. 43, 82–93. doi: 10.1159/000480321
Chia, N. Y., and Tan, P. (2016). Molecular classification of gastric cancer. Ann. Oncol. 27, 763–769. doi: 10.1093/annonc/mdw040
Cho, H., Seo, Y., Loke, K. M., Kim, S. W., Oh, S. M., Kim, J. H., et al. (2018). Cancer-Stimulated CAFs Enhance Monocyte Differentiation and Protumoral TAM Activation via IL6 and GM-CSF Secretion. Clin. Cancer Res. 24, 5407–5421. doi: 10.1158/1078-0432.Ccr-18-0125
De Steur, W. O., van Amelsfoort, R. M., Hartgrink, H. H., Putter, H., Meershoek-Klein Kranenbarg, E., van Grieken, N. C. T., et al. (2021). Adjuvant chemotherapy is superior to chemoradiation after D2 surgery for gastric cancer in the per-protocol analysis of the randomized CRITICS trial. Ann. Oncol. 32, 360–367. doi: 10.1016/j.annonc.2020.11.004
Derynck, R., and Weinberg, R. A. (2019). EMT and Cancer: more Than Meets the Eye. Dev. Cell 49, 313–316. doi: 10.1016/j.devcel.2019.04.026
Donaldson, J. G. (2015). Immunofluorescence Staining. Curr. Protoc. Cell Biol. 69, 41–47. doi: 10.1002/0471143030.cb0403s69
Doncheva, N. T., Morris, J. H., Gorodkin, J., and Jensen, L. J. (2019). Cytoscape StringApp: network Analysis and Visualization of Proteomics Data. J. Proteome Res. 18, 623–632. doi: 10.1021/acs.jproteome.8b00702
Duan, F. F., Barron, G., Meliton, A., Mutlu, G. M., Dulin, N. O., and Schuger, L. (2019). P311 Promotes Lung Fibrosis via Stimulation of Transforming Growth Factor-β1, -β2, and -β3 Translation. Am. J. Respir. Cell Mol. Biol. 60, 221–231. doi: 10.1165/rcmb.2018-0028OC
Fei, H. J., Chen, S. C., Zhang, J. Y., Li, S. Y., Zhang, L. L., Chen, Y. Y., et al. (2018). Identification of significant biomarkers and pathways associated with gastric carcinogenesis by whole genome-wide expression profiling analysis. Int. J. Oncol. 52, 955–966. doi: 10.3892/ijo.2018.4243
Franz, M., Rodriguez, H., Lopes, C., Zuberi, K., Montojo, J., Bader, G. D., et al. (2018). GeneMANIA update 2018. Nucleic Acids Res. 46, W60–W64. doi: 10.1093/nar/gky311
Genin, M., Clement, F., Fattaccioli, A., Raes, M., and Michiels, C. (2015). M1 and M2 macrophages derived from THP-1 cells differentially modulate the response of cancer cells to etoposide. BMC Cancer 15:577. doi: 10.1186/s12885-015-1546-9
Giampazolias, E., and Tait, S. W. (2016). Mitochondria and the hallmarks of cancer. FEBS J. 283, 803–814. doi: 10.1111/febs.13603
Gyurkó, D. M., Veres, D. V., Módos, D., Lenti, K., Korcsmáros, T., and Csermely, P. (2013). Adaptation and learning of molecular networks as a description of cancer development at the systems-level: potential use in anti-cancer therapies. Semin. Cancer Biol. 23, 262–269. doi: 10.1016/j.semcancer.2013.06.005
Hnasko, T. S., and Hnasko, R. M. (2015). The Western Blot. Methods Mol. Biol. 1318, 87–96. doi: 10.1007/978-1-4939-2742-5_9
Ji, X., Bu, Z. D., Yan, Y., Li, Z. Y., Wu, A. W., Zhang, L. H., et al. (2018). The 8th edition of the American Joint Committee on Cancer tumor-node-metastasis staging system for gastric cancer is superior to the 7th edition: results from a Chinese mono-institutional study of 1663 patients. Gastric Cancer 21, 643–652. doi: 10.1007/s10120-017-0779-5
Kalluri, R. (2016). The biology and function of fibroblasts in cancer. Nat. Rev. Cancer 16, 582–598. doi: 10.1038/nrc.2016.73
Kojima, Y., Acar, A., Eaton, E. N., Mellody, K. T., Scheel, C., Ben-Porath, I., et al. (2010). Autocrine TGF-beta and stromal cell-derived factor-1 (SDF-1) signaling drives the evolution of tumor-promoting mammary stromal myofibroblasts. Proc. Natl. Acad. Sci. U. S. A. 107, 20009–20014. doi: 10.1073/pnas.1013805107
Kuleshov, M. V., Jones, M. R., Rouillard, A. D., Fernandez, N. F., Duan, Q., Wang, Z., et al. (2016). Enrichr: a comprehensive gene set enrichment analysis web server 2016 update. Nucleic Acids Res. 44, W90–W97. doi: 10.1093/nar/gkw377
Li, H., Yao, Z., He, W., Gao, H., Bai, Y., Yang, S., et al. (2016). P311 induces the transdifferentiation of epidermal stem cells to myofibroblast-like cells by stimulating transforming growth factor β1 expression. Stem Cell Res. Ther. 7:175. doi: 10.1186/s13287-016-0421-1
Li, S., Zhao, W., and Sun, M. (2020). An analysis regarding the association between the ISLR gene and gastric carcinogenesis. Front. Genet. 11:620. doi: 10.3389/fgene.2020.00620
Li, W., Li, D. M., Chen, K., Chen, Z., Zong, Y., Yin, H., et al. (2012). Development of a gene therapy strategy to target hepatocellular carcinoma based inhibition of protein phosphatase 2A using the α-fetoprotein promoter enhancer and pgk promoter: an in vitro and in vivo study. BMC Cancer 12:547. doi: 10.1186/1471-2407-12-547
Li, W., Zhang, X., Wu, F., Zhou, Y., Bao, Z., Li, H., et al. (2019). Gastric cancer-derived mesenchymal stromal cells trigger M2 macrophage polarization that promotes metastasis and EMT in gastric cancer. Cell Death Dis. 10:918. doi: 10.1038/s41419-019-2131-y
Liao, Z., Tan, Z. W., Zhu, P., and Tan, N. S. (2019). Cancer-associated fibroblasts in tumor microenvironment - Accomplices in tumor malignancy. Cell Immunol. 343:103729. doi: 10.1016/j.cellimm.2017.12.003
Liu, C. J., Hu, F. F., Xia, M. X., Han, L., Zhang, Q., and Guo, A. Y. (2018). GSCALite: a web server for gene set cancer analysis. Bioinformatics 34, 3771–3772. doi: 10.1093/bioinformatics/bty411
Liu, X., and Meltzer, S. J. (2017). Gastric Cancer in the Era of Precision Medicine. Cell. Mol. Gastroenterol. Hepatol. 3, 348–358. doi: 10.1016/j.jcmgh.2017.02.003
Long, X., Xiong, W., Zeng, X., Qi, L., Cai, Y., Mo, M., et al. (2019). Cancer-associated fibroblasts promote cisplatin resistance in bladder cancer cells by increasing IGF-1/ERβ/Bcl-2 signalling. Cell Death Dis. 10:375. doi: 10.1038/s41419-019-1581-6
Machlowska, J., Baj, J., Sitarz, M., Maciejewski, R., and Sitarz, R. (2020). Gastric Cancer: epidemiology, Risk Factors, Classification, Genomic Characteristics and Treatment Strategies. Int. J. Mol. Sci. 21:4012. doi: 10.3390/ijms21114012
Margadant, C., and Sonnenberg, A. (2010). Integrin-TGF-beta crosstalk in fibrosis, cancer and wound healing. EMBO Rep. 11, 97–105. doi: 10.1038/embor.2009.276
Mariani, L., Mcdonough, W. S., Hoelzinger, D. B., Beaudry, C., Kaczmarek, E., Coons, S. W., et al. (2001). Identification and validation of P311 as a glioblastoma invasion gene using laser capture microdissection. Cancer Res. 61, 4190–4196.
May, R. C., and Machesky, L. M. (2001). Phagocytosis and the actin cytoskeleton. J. Cell Sci. 114, 1061–1077.
Meric-Bernstam, F., Johnson, A. M., Dumbrava, E. E. I., Raghav, K., Balaji, K., Bhatt, M., et al. (2019). Advances in HER2-Targeted Therapy: novel Agents and Opportunities Beyond Breast and Gastric Cancer. Clin. Cancer Res. 25, 2033–2041. doi: 10.1158/1078-0432.Ccr-18-2275
Mierke, C. T. (2019). The matrix environmental and cell mechanical properties regulate cell migration and contribute to the invasive phenotype of cancer cells. Rep. Prog. Phys. 82:064602. doi: 10.1088/1361-6633/ab1628
Misra, S., Ghatak, S., Moreno-Rodriguez, R. A., Norris, R. A., Hascall, V. C., and Markwald, R. R. (2021). Periostin/Filamin-A: a Candidate Central Regulatory Axis for Valve Fibrogenesis and Matrix Compaction. Front. Cell Dev. Biol. 9:649862. doi: 10.3389/fcell.2021.649862
Monteran, L., and Erez, N. (2019). The Dark Side of Fibroblasts: cancer-Associated Fibroblasts as Mediators of Immunosuppression in the Tumor Microenvironment. Front. Immunol. 10:1835. doi: 10.3389/fimmu.2019.01835
Nizioł, M., Zińczuk, J., Zaręba, K., Guzińska-Ustymowicz, K., and Pryczynicz, A. (2021). Immunohistochemical Analysis of the Expression of Adhesion Proteins: TNS1, TNS2 and TNS3 in Correlation with Clinicopathological Parameters in Gastric Cancer. Biomolecules 11:640. doi: 10.3390/biom11050640
Pan, J. H., Zhou, H., Cooper, L., Huang, J. L., Zhu, S. B., Zhao, X. X., et al. (2019). LAYN Is a Prognostic Biomarker and Correlated With Immune Infiltrates in Gastric and Colon Cancers. Front. Immunol. 10:6. doi: 10.3389/fimmu.2019.00006
Pape, J., Magdeldin, T., Stamati, K., Nyga, A., Loizidou, M., Emberton, M., et al. (2020). Cancer-associated fibroblasts mediate cancer progression and remodel the tumouroid stroma. Br. J. Cancer 123, 1178–1190. doi: 10.1038/s41416-020-0973-9
Pasquale, V., Ducci, G., Campioni, G., Ventrici, A., Assalini, C., Busti, S., et al. (2020). Profiling and Targeting of Energy and Redox Metabolism in Grade 2 Bladder Cancer Cells with Different Invasiveness Properties. Cells 9:2669. doi: 10.3390/cells9122669
Pastushenko, I., and Blanpain, C. (2019). EMT Transition States during Tumor Progression and Metastasis. Trends Cell Biol. 29, 212–226. doi: 10.1016/j.tcb.2018.12.001
Pauli, C., Hopkins, B. D., Prandi, D., Shaw, R., Fedrizzi, T., Sboner, A., et al. (2017). Personalized In Vitro and In Vivo Cancer Models to Guide Precision Medicine. Cancer Discov. 7, 462–477. doi: 10.1158/2159-8290.Cd-16-1154
Porcelli, L., Iacobazzi, R. M., Di Fonte, R., Serratì, S., Intini, A., Solimando, A. G., et al. (2019). CAFs and TGF-β Signaling Activation by Mast Cells Contribute to Resistance to Gemcitabine/Nabpaclitaxel in Pancreatic Cancer. Cancers 11:330. doi: 10.3390/cancers11030330
Powers, R. K., Goodspeed, A., Pielke-Lombardo, H., Tan, A. C., and Costello, J. C. (2018). GSEA-InContext: identifying novel and common patterns in expression experiments. Bioinformatics 34, i555–i564. doi: 10.1093/bioinformatics/bty271
Rojas, A., Araya, P., Gonzalez, I., and Morales, E. (2020). Gastric Tumor Microenvironment. Adv. Exp. Med. Biol. 1226, 23–35. doi: 10.1007/978-3-030-36214-0_2
Rossari, F., Minutolo, F., and Orciuolo, E. (2018). Past, present, and future of Bcr-Abl inhibitors: from chemical development to clinical efficacy. J. Hematol. Oncol. 11:84. doi: 10.1186/s13045-018-0624-2
Scott, L. J. (2018). Apatinib: a Review in Advanced Gastric Cancer and Other Advanced Cancers. Drugs 78, 747–758. doi: 10.1007/s40265-018-0903-9
Shan, M. J., Meng, L. B., Guo, P., Zhang, Y. M., Kong, D., and Liu, Y.B. (2021). Screening and identification of key biomarkers of gastric cancer: three genes jointly predict gastric cancer. Front. Oncol. 11:591893. doi: 10.3389/fonc.2021.591893
Sica, A., Schioppa, T., Mantovani, A., and Allavena, P. (2006). Tumour-associated macrophages are a distinct M2 polarised population promoting tumour progression: potential targets of anti-cancer therapy. Eur. J. Cancer 42, 717–727. doi: 10.1016/j.ejca.2006.01.003
Smyth, E. C., Nilsson, M., Grabsch, H. I., van Grieken, N. C., and Lordick, F. (2020). Gastric cancer. Lancet 396, 635–648. doi: 10.1016/s0140-6736(20)31288-5
Son, S. E., Kim, N. J., and Im, D. S. (2021). Development of Free Fatty Acid Receptor 4 (FFA4/GPR120) Agonists in Health Science. Biomol. Ther. 29, 22–30. doi: 10.4062/biomolther.2020.213
Stradiot, L., Mannaerts, I., and van Grunsven, L. A. (2018). P311, Friend, or Foe of Tissue Fibrosis? Front. Pharmacol. 9:1151. doi: 10.3389/fphar.2018.01151
Studler, J. M., Glowinski, J., and Lévi-Strauss, M. (1993). An abundant mRNA of the embryonic brain persists at a high level in cerebellum, hippocampus and olfactory bulb during adulthood. Eur. J. Neurosci. 5, 614–623. doi: 10.1111/j.1460-9568.1993.tb00527.x
Sturm, G., Finotello, F., Petitprez, F., Zhang, J. D., Baumbach, J., Fridman, W. H., et al. (2019). Comprehensive evaluation of transcriptome-based cell-type quantification methods for immuno-oncology. Bioinformatics 35, i436–i445. doi: 10.1093/bioinformatics/btz363
Suarez-Carmona, M., Lesage, J., Cataldo, D., and Gilles, C. (2017). EMT and inflammation: inseparable actors of cancer progression. Mol. Oncol. 11, 805–823. doi: 10.1002/1878-0261.12095
Szklarczyk, D., Gable, A. L., Nastou, K. C., Lyon, D., Kirsch, R., Pyysalo, S., et al. (2021). The STRING database in 2021: customizable protein-protein networks, and functional characterization of user-uploaded gene/measurement sets. Nucleic Acids Res. 49, D605–D612. doi: 10.1093/nar/gkaa1074
Telegina, D. V., Suvorov, G. K., Kozhevnikova, O. S., and Kolosova, N. G. (2019). Mechanisms of Neuronal Death in the Cerebral Cortex during Aging and Development of Alzheimer’s Disease-Like Pathology in Rats. Int. J. Mol. Sci. 20:5632. doi: 10.3390/ijms20225632
Thul, P. J., and Lindskog, C. (2018). The human protein atlas: a spatial map of the human proteome. Protein Sci. 27, 233–244. doi: 10.1002/pro.3307
Tian, J., Guo, S., Chen, H., Peng, J. J., Jia, M. M., Li, N. S., et al. (2018). Combination of Emricasan with Ponatinib Synergistically Reduces Ischemia/Reperfusion Injury in Rat Brain Through Simultaneous Prevention of Apoptosis and Necroptosis. Transl. Stroke Res. 9, 382–392. doi: 10.1007/s12975-017-0581-z
Urra, H., Henriquez, D. R., Cánovas, J., Villarroel-Campos, D., Carreras-Sureda, A., Pulgar, E., et al. (2018). IRE1α governs cytoskeleton remodelling and cell migration through a direct interaction with filamin A. Nat. Cell Biol. 20, 942–953. doi: 10.1038/s41556-018-0141-0
Wilke, H., Muro, K., Van Cutsem, E., Oh, S. C., Bodoky, G., Shimada, Y., et al. (2014). Ramucirumab plus paclitaxel versus placebo plus paclitaxel in patients with previously treated advanced gastric or gastro-oesophageal junction adenocarcinoma (RAINBOW): a double-blind, randomised phase 3 trial. Lancet Oncol. 15, 1224–1235. doi: 10.1016/s1470-2045(14)70420-6
Wu, T., and Dai, Y. (2017). Tumor microenvironment and therapeutic response. Cancer Lett. 387, 61–68. doi: 10.1016/j.canlet.2016.01.043
Yang, Y., Xiao, M., Song, Y., Tang, Y., Luo, T., Yang, S., et al. (2019). H-score of 11β-hydroxylase and aldosterone synthase in the histopathological diagnosis of adrenocortical tumors. Endocrine 65, 683–691. doi: 10.1007/s12020-019-02022-8
Yao, Z., Li, H., He, W., Yang, S., Zhang, X., Zhan, R., et al. (2017). P311 Accelerates Skin Wound Reepithelialization by Promoting Epidermal Stem Cell Migration Through RhoA and Rac1 Activation. Stem Cells Dev. 26, 451–460. doi: 10.1089/scd.2016.0249
Yao, Z., Yang, S., He, W., Li, L., Xu, R., Zhang, X., et al. (2015). P311 promotes renal fibrosis via TGFβ1/Smad signaling. Sci. Rep. 5:17032. doi: 10.1038/srep17032
Yuan, Q., Sun, N., Zheng, J., Wang, Y., Yan, X., Mai, W., et al. (2019). Prognostic and Immunological Role of FUN14 Domain Containing 1 in Pan-Cancer: friend or Foe? Front. Oncol. 9:1502. doi: 10.3389/fonc.2019.01502
Yue, M. M., Lv, K., Meredith, S. C., Martindale, J. L., Gorospe, M., and Schuger, L. (2014). Novel RNA-binding protein P311 binds eukaryotic translation initiation factor 3 subunit b (eIF3b) to promote translation of transforming growth factor β1-3 (TGF-β1-3). J. Biol. Chem. 289, 33971–33983. doi: 10.1074/jbc.M114.609495
Zeng, D., Li, M., Zhou, R., Zhang, J., Sun, H., Shi, M., et al. (2019). Tumor Microenvironment Characterization in Gastric Cancer Identifies Prognostic and Immunotherapeutically Relevant Gene Signatures. Cancer Immunol. Res. 7, 737–750. doi: 10.1158/2326-6066.Cir-18-0436
Keywords: NREP, gastric cancer, bioinformatics, epithelial–mesenchymal transition, cancer-associated fibroblasts, M2 macrophages
Citation: Liu Y-j, Zeng S-h, Hu Y-d, Zhang Y-h and Li J-p (2021) Overexpression of NREP Promotes Migration and Invasion in Gastric Cancer Through Facilitating Epithelial-Mesenchymal Transition. Front. Cell Dev. Biol. 9:746194. doi: 10.3389/fcell.2021.746194
Received: 23 July 2021; Accepted: 01 October 2021;
Published: 20 October 2021.
Edited by:
Ira Ida Skvortsova, Innsbruck Medical University, AustriaReviewed by:
Zhigang Bai, Beijing Friendship Hospital, ChinaYufang Hou, Institute of Materia Medica, Chinese Academy of Medical Sciences and Peking Union Medical College, China
Copyright © 2021 Liu, Zeng, Hu, Zhang and Li. This is an open-access article distributed under the terms of the Creative Commons Attribution License (CC BY). The use, distribution or reproduction in other forums is permitted, provided the original author(s) and the copyright owner(s) are credited and that the original publication in this journal is cited, in accordance with accepted academic practice. No use, distribution or reproduction is permitted which does not comply with these terms.
*Correspondence: Yong-hua Zhang, zjgzy043@njucm.edu.cn; Jie-pin Li, zjgzy027@njucm.edu.cn
†These authors share first authorship