Analysis of Antimicrobial-Triggered Membrane Depolarization Using Voltage Sensitive Dyes
 J. Derk te Winkel
 Declan A. Gray1‡
  Leendert W. Hamoen
 Henrik Strahl
- 1Centre for Bacterial Cell Biology, Institute for Cell and Molecular Biosciences, Newcastle University, Newcastle upon Tyne, UK
- 2Swammerdam Institute for Life Sciences, University of Amsterdam, Amsterdam, Netherlands
The bacterial cytoplasmic membrane is a major inhibitory target for antimicrobial compounds. Commonly, although not exclusively, these compounds unfold their antimicrobial activity by disrupting the essential barrier function of the cell membrane. As a consequence, membrane permeability assays are central for mode of action studies analysing membrane-targeting antimicrobial compounds. The most frequently used in vivo methods detect changes in membrane permeability by following internalization of normally membrane impermeable and relatively large fluorescent dyes. Unfortunately, these assays are not sensitive to changes in membrane ion permeability which are sufficient to inhibit and kill bacteria by membrane depolarization. In this manuscript, we provide experimental advice how membrane potential, and its changes triggered by membrane-targeting antimicrobials can be accurately assessed in vivo. Optimized protocols are provided for both qualitative and quantitative kinetic measurements of membrane potential. At last, single cell analyses using voltage-sensitive dyes in combination with fluorescence microscopy are introduced and discussed.
Introduction
Due to its central cellular role and the relatively easy accessibility for extracellular agents, the bacterial cytoplasmic membrane is a major target for antimicrobial compounds such as membrane-targeting peptides (Yeaman and Yount, 2003; Brogden, 2005; Wimley and Hristova, 2011). Disrupting the membrane function by an antimicrobial compound can simultaneously inhibit several essential processes and therefore amounts to a serious assault on a bacterial cell. This weak point is exploited by other bacteria and fungi to gain a competitive advantage in their shared habitats (Hibbing et al., 2010), and by higher organism as a part of their innate immune system (Aerts et al., 2008; Guani-Guerra et al., 2010). The membrane targeting natural peptides produced for these purposes, and synthetic ones with comparable mechanism of action, represent a largely untapped reservoir of potentially promising antibacterial lead-compounds (Giuliani et al., 2007; Riedl et al., 2011).
In many cases, dissipation of the membrane potential is either the sole mechanism of action, or contributes to the potency of the compound. This can either be caused by formation of ion-conducting membrane pores, by otherwise increasing membrane ion-permeability, or by acting as an ion carrier (Yeaman and Yount, 2003; Brogden, 2005; Wimley and Hristova, 2011). An assessment of membrane permeability is therefore one of the critical experiments in analysing the mode of action of membrane-targeting compounds. Currently, changes in membrane permeability are most commonly detected by membrane impermeable fluorescent dyes such as propidium iodide (PI) and Sytox Green. These dyes stain the cell nucleoid when the membrane integrity is severely compromised or large pores are formed (Roth et al., 1997; Sochacki et al., 2011; Stiefel et al., 2015), however, they do not detect changes in ion permeability which can nevertheless inhibit and kill bacterial cells by dissipating transmembrane potential (Wenzel et al., 2012). Changes in membrane potential can be detected by following voltage-dependent distribution of either radioactively labeled tetraphenylphosphonium ion (TPP+) or fluorescent dyes. Guidance for the use of TPP+ will be provided elsewhere by Wilmes and Sahl (Unpublished). Therefore, this method is not discussed here. Recently, membrane potential-dependent protein localization has emerged as a proxy for membrane depolarization (Strahl and Hamoen, 2010). In this manuscript, we will discuss the benefits and disadvantages of both fluorescence-based approaches, and provide experimental protocols and advice on how voltage sensitive proteins and dyes can be efficiently used in mode of action studies of membrane-targeting antimicrobials.
Materials and Methods
Strains, Media, and Growth Conditions
Strains and conditions for gene induction are listed in Table 1. All bacterial strains were grown either in Lysogeny Broth (LB) [10 g tryptone, 5 g/l yeast extract, 10 g/l NaCl] or Schaeffer's sporulation medium (SSM) [2.0 g/l (NH4)2SO4, 14.0 g/l K2HPO4, 6.0 g/l KH2PO4, 1.0 g/l Na3-citrate · 2H20, 6.4 g/l MgSO4 · 7H20, 1.1 mg/l (NH4)5Fe(C6H4O7)2 (ferric ammonium citrate), 0.2 g/l Casamino acids, 5 g/l D-Glucose, 0.2 g/l L-Tryptophan] at 30 or 37°C under vigorous shaking with the following exceptions. For dissipation of membrane potential with K+ carrier valinomycin, cells were grown in a medium composed of 10 g/l tryptone, 5 g/l yeast extract, 50 mM Hepes pH 7.5, and varying concentrations of KCl and NaCl. The time-lapse microscopy experiments were carried out in chemically defined medium (CDM) [62 mM K2HPO4, 44 mM KH2PO4, 15 mM (NH4)2SO4, 6.5 mM Na3-citrate, 0.8 mM MgSO4,0.6 mM MgCl2, 210 μM CaCl2, 22.5 μM MnCI2, 1.5 μM FeCl3, 0.3 μM ZnCl2, 0.6 μM Thiamin-HCl, 2.2 mM D-Glucose, 2.1 mM L-Glutamic acid, 6 μM L-Tryptophan; (De Jong et al., 2011)].
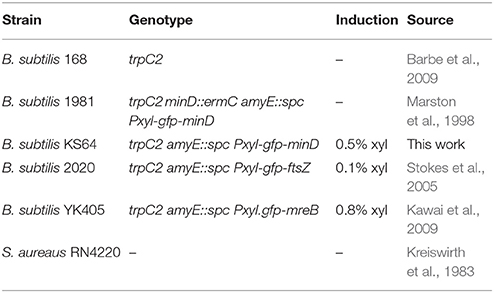
Table 1. Strains and Plasmids.
Fluorescence Microscopy
For regular fluorescence microscopy, cells were grown to exponential growth phase followed by immobilization on Teflon-coated multi-spot microscope slides (Hendley-Essex) covered with a thin layer of agarose. For this aim, a solution of 1.2% electrophoresis-grade agarose was prepared in deionized H2O and cooled down to ~50°C. Five hundred microliters of the agarose solution was spread on a Teflon-coated slide and quickly covered with another clean, uncoated slide. The agarose was allowed to solidify for 10 min at room temperature without applied pressure. The weight of the slide, combined with the viscosity of the solution at 50°C resulted in agarose slides with a suitable thickness. Slides prepared in this manner were either used immediately, or stored maximally for 3 h in a cold humid environment in order to prevent extensive drying. Immediately before use, the slide was quickly warmed to room temperature and the uncoated slide removed by sliding it across the polymerized agarose surface. Polymerized agarose adheres well to the Teflon-coating allowing the upper clean slide to be removed with ease. 0.5 μl of a cell culture was applied to the exposed agarose surface, very briefly air-dried until the liquid-drop had evaporated, and covered with a microscopy coverslip. The applied small medium drop provides sufficient nutrients to keep the cells energized, but access to O2 under the coverslip was found to be limited resulting in a gradual loss of membrane potential. For these reasons, microscopy was carried out within a time window of 10 min after addition of the coverslip. The applied medium drop also provides osmolytes and we found that a combined contribution of residual non-polymerized agarose, the buffer slightly concentrated by evaporation, and the added osmolality provided by the cell suspension triggers plasmolysis-related artifacts especially in de-energized cells. The use of agarose dissolved in buffer or medium is therefore not recommended. Poly-L-lysine-coated microscopy slides were found to trigger partial dissipation of membrane potential (Strahl and Hamoen, 2010). We therefore strongly advise against the use of poly-L-lysine as a cell adhesive. Visualization of bacterial membranes was achieved by 5 min incubation in the presence of 1μg/ml of a hydrophobic membrane dye nile red (Sigma-Aldrich) prior to microscopy.
The fluorescence microscopy described in this article was carried out using Nikon Eclipse Ti (Nikon Plan Fluor 100x/1.30 Oil Ph3 DLL and Plan Apo 100x/1.40 Oil Ph3 objectives), and Applied Precision DeltaVision RT (Zeiss Plan-Neofluar 63x/1.30 Oil Ph3 and Plan-Neofluar 100x/1.30 Oil Ph3) microscopes. The images were acquired with Metamorph 6 (Molecular Devices), softWoRx Suite (Applied Precision), and analyzed using ImageJ v.1.48 (National Institutes of Health).
Microscopic Analysis of Membrane Potential
For the microscopic determination of membrane potential using voltage-sensitive dye 3,3′-Dipropylthiadicarbocyanine iodide [DiSC3(5)] (Anaspec or Sigma-Aldrich), early-mid logarithmic growth phase cell suspensions were incubated with 2 μM DiSC3(5) directly in the growth medium. The incubation was carried out under shaking for 5 min, immediately followed by microscopy. A final concentration of 0.5–1% DiSC3(5)-solvent dimethyl sulfoxide (DMSO) was found to be crucial in order to maintain appropriate solubility; lower solvent concentrations resulted in a strongly reduced cellular fluorescence. The incubation was carried out at growth temperature, and under vigorous shaking in order to maintain good energization of the cells. This step was routinely carried out with 2 ml round bottom Eppendorf tubes containing 200 μl cell suspension in a thermomixer. To provide sufficient aeration, the lids of the tubes were perforated. When dissipation of membrane potential was tested, a compound of interest was added in parallel to DiSC3(5). Addition of 5 μM gramicidin (a mixture of gramicidin A, B, C, and D) was routinely used as a positive control. This peptide mixture triggers a rapid and full dissipation of membrane potential by forming small cation specific channels (Kelkar and Chattopadhyay, 2007). If longer incubation times are required, the cell suspension can be pre-treated with the compound of interest, followed by 5 min staining with DiSC3(5). The imaging of DiSC3(5)-stained cells was carried out using commonly available Cy5-filter sets.
In contrast to another voltage sensitive dye DiBAC4(3) which will be discussed later, DiSC3(5) does not exhibit strong affinity to glass surfaces and regular uncoated microscopy coverslips can be used. Strong affinity toward PDMS, which is commonly used to fabricate microfluidic devises, has however been observed by us and others (Prindle et al., 2015) thus complicating the use of this dye in a microfluidic setup.
Fluorescence Quantification from Micrographs
The quantification of cellular DiSC3(5) fluorescence was carried out in a semi-automated manner using ImageJ. The fluorescent images were first background-subtracted in order to remove signal originating from unincorporated dye and medium. The phase contrast images acquired in parallel to fluorescence images were used to identify cells as regions of interest (ROI), for which DiSC3(5) fluorescence was measured. For micrographs in which cells were well separated, an automated cell detection, carried out as described in the ImageJ-manual in the context of image thresholding and particle detection, was found to be sufficient. In most cases, however, cells adhered to each other or grew in chains. In this case the ROI's were determined manually for each cell in an image field by drawing a line with an appropriate pixel width along the length axis of the cells. When applying this method, care was taken to ensure that the ROI maximally covered the cell while still remaining entirely within boundaries of the cell. At last, the average fluorescence intensity of each cell (ROI) was measured using the fluorescence images. All the steps described above were carried out with standard ImageJ but an ImageJ-plugin ObjectJ can be used to further automate this process (Vischer et al., 2015).
Time-Lapse Microscopy
The time-lapse microscopy was carried out as described in De Jong et al. (2011) with the following modifications. Instead of growing B. subtilis pre-culture in TLM-medium, cells were grown overnight in SMM-medium, followed by 1:10 dilution in CDM-medium. The cultures adapted to growth in CDM were used to inoculate the time-lapse microscopy slides in an appropriate dilution. The principal methodology regarding the preparation of time lapse-microscopy slides is described in De Jong et al. (2011). For the time-lapse microscopy using a voltage-dependent dye, 10 μM Bis-(1,3-dibutylbarbituric acid) trimethine oxonol [DiBAC4(3)] (Anaspec or Sigma-Aldrich) was included in the solid time-lapse growth medium. This dye was dissolved in dimethylformamide (DMF) and a final solvent concentration of 1% DMF was maintained in the growth medium. DiBAC4(3) exhibits considerable affinity to glass surfaces which strongly interferes with fluorescent imaging. This binding was supressed by pre-treating the coverslips accordingly (see below). Commonly available FITC or GFP filters were used to image DiBAC3(4)-stained cells.
Polydopamine Coating
To prevent binding of DiBAC4(3) to glass surfaces, the coverslips used in combination with DiBAC4(3) were coated with polymerized L-dopamine (Zhang et al., 2013; Strahl et al., 2015). In brief, a large drop of a fresh solution of 2 mg/ml L-dopamine in 1 mM Tris pH 8.0 was spread on the required coverslip surface, followed by an incubation for 30 min at room temperature. Subsequently, non-polymerized L-dopamine and Tris was removed by aspiration and submersion of the coverslip in deionized H2O. Remaining H2O was removed by evaporation at 37°C for 30 min. Coverslips pre-treated in this manner were stored in a dark, dry, and dust-free environment.
Fluorometric Measurement of Membrane Potential Using DiSC3(5)
The fluorometric measurements of membrane potential using voltage-sensitive dye DiSC3(5) were carried out on black polystyrene microtiter plates (Labsystems) using BMG Fluostar Optima fluorometer equipped with 610 ± 5 nm excitation, and 660 ± 5 nm emission filters. However, any temperature-regulated fluorometer capable for excitation and detection at the required wavelengths should in principle be compatible. The measurements were routinely carried out directly in LB medium supplemented with 0.5 mg/ml BSA. Addition of BSA was found to reduce absorption of DiSC3(5) to polystyrene surfaces. An optimal cell density and dye concentration were found to be the key parameters determining the signal-to-noise ratio in this assay. For B. subtilis an OD600 of 0.2, combined with 1 μM DiSC3(5) was found to provide a good fluorescence intensity difference between fully energized and depolarized cells in LB. For S. aureus an OD600 of 0.3 is recommended. When adapting this assay to new bacterial species or media, the optimal cell density and dye concentration should first be determined.
To carry out the assay, cells were grown in LB medium until logarithmic growth was obtained, and diluted to an OD600 of 0.2 in a pre-warmed LB supplemented with 0.5 mg/ml BSA. One hundred and thirty five microliters the diluted cells were transferred to the microtiter plate and the fluorescence was followed for 2–3 min in order to obtain values for medium and cell background fluorescence. After obtaining a baseline, DiSC3(5) dissolved in DMSO was added to each well to a final concentration of 1 μM DiSC3(5) and 1% DMSO. Maintaining 1% DMSO was critical for good solubility and fluorescence of the dye. The fluorescence quenching was measured until a stable signal intensity was achieved, followed by addition of the compound of interest. One micro molar of channel-forming peptide gramicidin was found to be a suitable positive control. If a rapid depolarization was observed, no compensation for cell growth was required. If the depolarization was slow, cell growth was found to result in a gradual shift in the fluorescence values observed with the untreated control sample. An inhibition of cell growth with 5 μg/ml chloramphenicol was found to suppress this shift and resulted in stable fluorescence levels. Maintaining appropriate aeration during the measurement was found to be crucial to maintain stable fluorescence levels for polarized cells. For these reasons, the microtiter plates were subjected to vigorous shaking between each measurement point. Following this regime, the development of membrane potential upon addition of a compound of interest can be followed for up to 60 min.
Calibration of DiSC3(5) Assay
For the calibration of DiSC3(5) assay, Nernst equation (see below) was used to calculate medium K+ concentrations () which correspond to the desired K+ equilibrium potentials. Three hundred micro molars was used as a close approximation for the cellular K+ concentration () of B. subtilis (Whatmore et al., 1990).
The calculated values (Table 2) were used to prepare media with different K+ concentrations (). To maintain an identical ionic strength in all media (300 mM), NaCl was added accordingly. K+ present in yeast extract (~6 mM for final concentration for 5 g/l) was taken into calculation. B. subtilis was grown in the different media to a logarithmic growth phase, diluted to an OD600of 0.2, and subjected to the fluorometric DiSC3(5) assay as descried above. The membrane potential was dissipated by addition of 5 μM K+ carrier valinomycin. This concentration was found to be sufficient to fully depolarize B. subtilis cells without interfering significantly with DiSC3(5) fluorescence. Upon addition, the increased membrane K+ permeability results in dissipation of the membrane potential to values pre-determined by the K+ gradient across the membrane. The resulting calibration ladder was used to convert relative DiSC3(5) fluorescence values into absolute values.
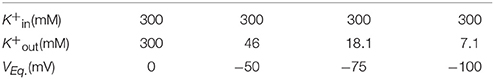
Table 2. Calculated K+ equilibrium potentials used in calibration of DiSC3(5) assay.
Results and Discussion
Delocalization of MinD as a Proxy for Membrane Depolarization
Previously, we have shown that the membrane potential is crucial for correct cellular localization of certain membrane proteins in B. subtilis and E. coli (Strahl and Hamoen, 2010). One of the identified proteins was the cell division regulator MinD (Marston et al., 1998; Rothfield et al., 2005). Under normal growth conditions, a B. subtilis GFP-MinD fusion protein is membrane-associated, and enriched at cell poles and cell division sites. Upon depolarization, the membrane association of this protein is destabilized resulting in a clear loss of polar localization pattern and an increasingly cytoplasmic GFP signal (Strahl and Hamoen, 2010; Figure 1A). Based on this discovery, fluorescence microscopy using MinD localization as a proxy for changes in membrane potential has emerged as a convenient tool (Chimerel et al., 2012; Eun et al., 2012; Wenzel et al., 2012, 2013; Foss et al., 2013). While localization of MinD is a useful indicator for membrane depolarization, there are two complications, which should be taken into consideration when using this method.
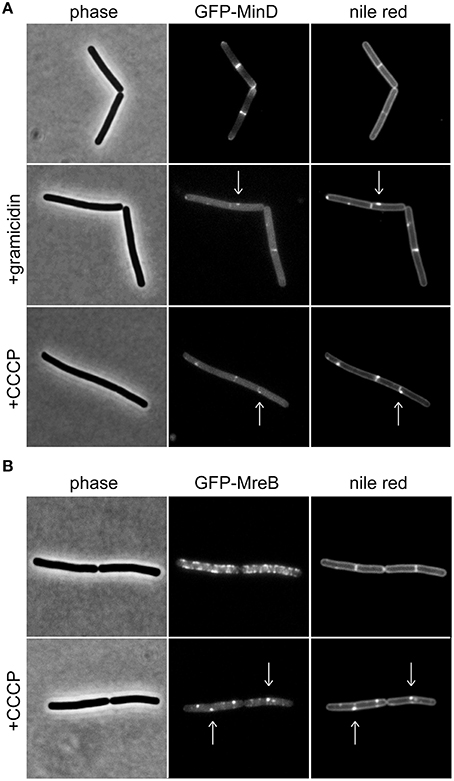
Figure 1. Membrane potential-dependent localization pattern of MinD and MreB. (A) Phase contrast images (left panel) of B. subtilis cells expressing GFP-MinD (middle panel), and stained with fluorescent membrane dye nile red (right panel) in the absence and presence of the small cation channel forming antimicrobial peptide gramicidin (1 μM), or H+ ionophore CCCP (100 μM). Note the loss of polar membrane associated localization pattern upon depolarization, and a few remaining foci which colocalize with fluorescent nile red foci (arrows). (B) Phase contrast images (left panel) of B. subtilis cells expressing GFP-MreB (middle panel), and stained with fluorescent membrane dye nile red (right panel) in the absence and presence of CCCP (100 μM). Note the clustering of the protein upon depolarization which triggers the fluorescent nile red foci (arrows). Strains used: B. subtilis KS64 (GFP-MinD), and B. subtilis YK405 (GFP-MreB).
MinD is an ATP-binding protein and both binding and hydrolysis of ATP alters its localization pattern (Karoui and Errington, 2001; Strahl and Hamoen, 2010). As a consequence, reduced cellular ATP levels could be mis-interpreted as membrane depolarization. As shown in Figure 1A, dissipation of membrane potential results in an increasingly cytoplasmic GFP-MinD fluorescence signal but a few remaining membrane associated fluorescent foci are also observed. B. subtilis actin homolog MreB, a protein involved in cell wall synthesis, is also delocalized upon membrane depolarization (Strahl and Hamoen, 2010). Recently, we have shown that delocalization of MreB causes a pattern of lipid domains to emerge which are characterized by an increased membrane fluidity, and therefore attract membrane dyes and proteins such as MinD (Figure 1B; Strahl et al., 2014). Thus, the change in localization of MinD upon membrane depolarization is caused by a combination of two factors: a direct interference with MinD-membrane binding (resulting in cytoplasmic signal), and an indirect effect caused by delocalization of MreB (resulting in localization in membrane foci). While both patterns are caused by membrane depolarization, care should be taken when interpreting an observed delocalization into foci as an indicator for membrane depolarization. In this case, a mere delocalization of MreB rather than dissipation of membrane potential is an alternative explanation.
For these reasons, we recommend that localization analysis of MinD should be used in combination with more direct techniques such as those introduced in the following sections. MinD-localization assay does, however, provide a rapid method to rule out potential membrane depolarization effects, and is a valuable complementary tool to augment the dye-based techniques especially when extensive interference with dye-fluorescence is observed (discussed below).
Membrane Potential Measurement Using Voltage Sensitive Dye DiSC3(5)
DiSC3(5) is a cationic membrane-permeable fluorescent dye. The charged nature combined with sufficient hydrophobicity to penetrate lipid bilayers allows this dye to act as a potentiometric probe and accumulate in polarized cells until a Nernstian equilibrium is achieved (Waggoner, 1976, 1979; Bashford, 1981; Ehrenberg et al., 1988). The strong accumulation in energized cells results in quenching of the overall fluorescence of the cell suspension. Upon depolarization, the dye is rapidly released into the medium resulting in dequenching that can be followed fluorometrically (Figure 2A; Singh and Nicholls, 1985; Shapiro, 1994).
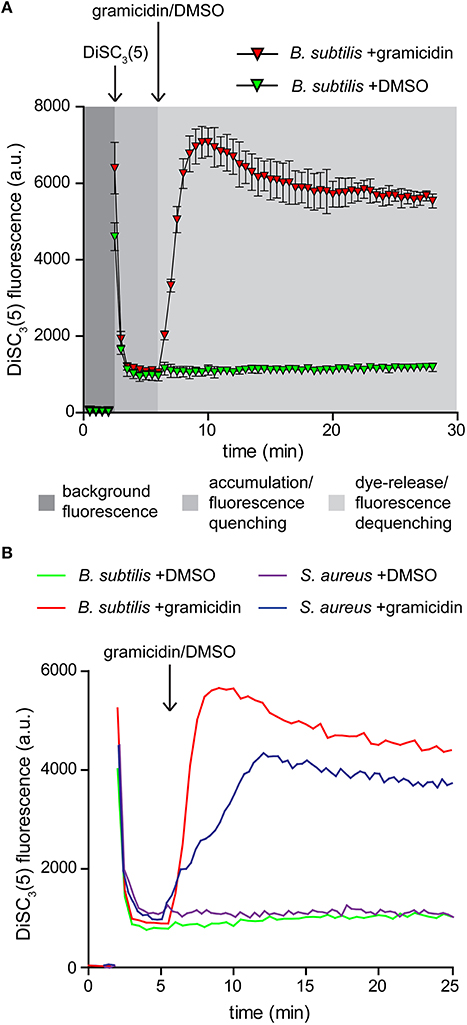
Figure 2. Membrane potential sensitive fluorescent dye DiSC3(5). (A) Fluorescence intensity changes of DiSC3(5) in a cell suspension. The time points of dye and gramicidin addition are highlighted with arrows. Note the strong quenching of DiSC3(5) fluorescence upon accumulation in cells, and the dequenching upon membrane depolarization. The solvent used to solubilize gramicidin (DMSO) has no influence on the fluorescence intensity levels. The graph depicts average and standard deviation of three technical replicates. (B) A comparison of fluorescence intensity changes of DiSC3(5) upon accumulation in polarized B. subtilis and S. aureus cells, and upon depolarization with gramicidin (1 μM). The time point of gramicidin addition is highlighted with an arrow. Strains used: B. subtilis 168 (wild type) and S. aureus RN4220 (wild type).
Two critical parameters should be considered when using this dye for analysing membrane depolarization triggered by an antimicrobial compound. To obtain a strong response based on fluorescence quenching, both the cell density and the dye concentration should be optimized. Higher dye concentration results in stronger overall fluorescence signals but the fluorescence difference between polarized and depolarized cells is reduced. The same is observed for an increased cell density. We found a concentration of 1 μM DiSC3(5), combined with an OD600 of 0.2 to be optimal for B. subtilis. For S. aureus a slightly elevated cell density of OD600 = 0.3 provided comparable signals (Figure 2B).
Since the assay is based on fluorescence quenching, potential interaction between the dye and the compound of interest, or strong light absorption could influence the measured fluorescence. For these reasons it is crucial to verify that the compound of interest does not significantly alter the dye fluorescence at the used concentrations. We found it easiest to perform this control by simply repeating the fluorometric assay in the absence of cells. As shown in Figure 3, gramicidin and K+-specific carrier valinomycin are compatible with DiSC3(5) assay whereas the commonly used protonophore CCCP is incompatible. In contrast, Valinomycin cannot be used in combination with another frequently used voltage-sensitive dye DiBAC3(4) (discussed later).
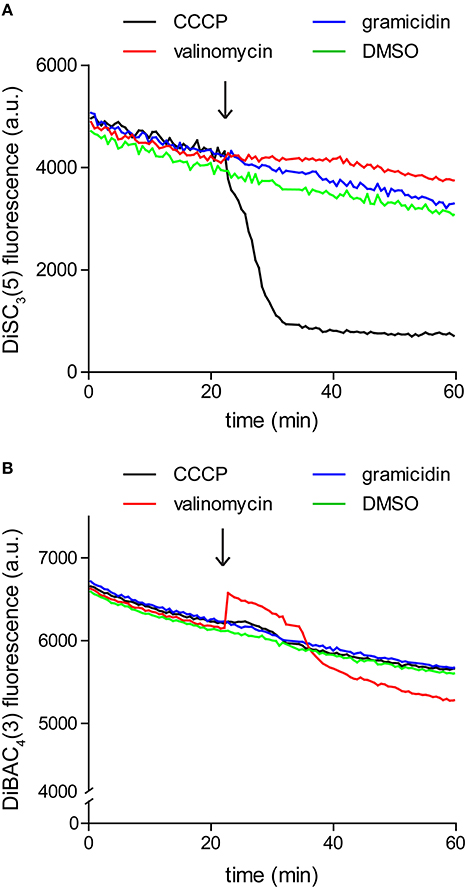
Figure 3. Interference between dye fluorescence and ionophores. (A) Fluorescence intensity of 1 μM DiSC3(5) in LB medium upon addition of channel-forming peptide gramicidin (1 μM), K+ carrier depsipeptide valinomycin (5 μM), and a non-peptide protonophore CCCP (30 μM). The time point of addition is highlighted with an arrow. Note the gradual decay of fluorescence signal due to binding on the polystyrene-surface of the microtiter plate, and the strong reduction of fluorescence upon addition of CCCP, which disqualifies the use of CCCP in combination with DiSC3(5). (B) Fluorescence intensity of 10 μM DiBAC4(3) in LB medium upon addition of channel forming peptide gramicidin (1 μM), K+ carrier depsipeptide valinomycin (5 μM), and the non-peptide protonophore CCCP (30 μM). In case of this dye, interference is observed with valinomycin.
Calibration of the Fluorometric DiSC3(5) Assay
Since DiSC3(5) follows a Nernstian distribution across the membrane, its fluorescence can also be used for a quantitative measurement of the membrane potential. For this aim, partial depolarization triggered by the K+ carrier valinomycin serves as a convenient method to generate a calibration curve. Following the Goldman-Hodgkin-Katz voltage equation, membrane potential is determined by the relative contribution of membrane gradients for each ion. The extent, to which an ion gradient contributes to the overall membrane potential, depends on the permeability (both passive and active) of the membrane to the individual ion species. Under normal conditions, the transport of H+ across the membrane greatly surpasses the contribution of other ions. This is mainly due to the high H+ transport activity of the respiratory chain. As a consequence, the membrane potential is normally dominated by the H+ gradient (Mitchell, 1961; Saraste, 1999). This changes upon addition of the K+-specific carrier valinomycin (Shapiro, 1994). When supplied at sufficient concentrations, the relative permeability of the cell membrane for K+ is increased to an extent in which the K+ gradient across the membrane becomes the predominant factor. Upon addition of valinomycin, the membrane potential now equilibrates with the K+ gradient resulting in a level which can be calculated using the Nernst-equation (see Table 2). K+ gradient as such can easily be modified by altering the medium K+/Na+-ratio since cells strive to maintain a stable cytoplasmic K+ concentration in media with comparable osmolality (Whatmore et al., 1990). This method provides the means to measure DiSC3(5) fluorescence at different membrane potential levels (Figure 4A), and thus to calibrate the DiSC3(5) assay (Figure 4B; Singh and Nicholls, 1985; Vecer et al., 1997; Breeuwer and Abee, 2004). Using this approach, we estimated the membrane potential of B. subtilis to reach ~ −110 mV under the growth conditions used in our experiments. This value is in good agreement with previously published estimates (Hosoi et al., 1980; Zaritsky et al., 1981).
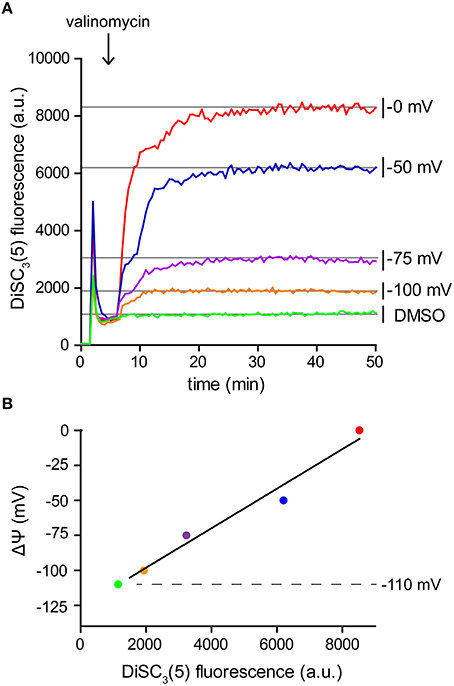
Figure 4. Calibration of DiSC3(5) assay. (A) Fluorescence intensity of DiSC3(5) in B. subtilis cell suspensions in media with varying K+ concentrations. Upon addition of K+ carrier valinomycin (4 μM), membrane potential reaches stable levels pre-determined by the K+ gradient across the membrane (see Table 2). The time point of valinomycin addition is highlighted with an arrow. (B) The fluorescence levels obtained from the experiment shown in panel (A) can be used to calibrate the arbitrary DiSC3(5) fluorescence values. The estimated membrane potential for untreated B. subtilis cells (−110 mV) is indicated with a dashed line. Strain used: B. subtilis 168 (wild type).
Single Cell Analysis Using DiSC3(5)
As mentioned earlier, changes in localization of GFP-MinD provides a convenient assay to test candidate compounds for their ability to dissipate the membrane potential. However, delocalization is a relatively subjective measure. As an alternative, direct fluorescence microscopy of DiSC3(5)-stained cells provides a comparably simple and rapid assay (Figure 5A). The spectral properties of DiSC3(5) allows fluorescence microscopy to be performed with commonly available filters used to detect Cy5 and similar fluorophores. Although accumulation of DiSC3(5) does cause self-quenching, the remaining cellular fluorescence is still very strong and provides a good signal to background ratio. Upon depolarization, the change in cellular fluorescence is large (>100-fold) thus providing an unambiguous readout (Figures 5B,C).
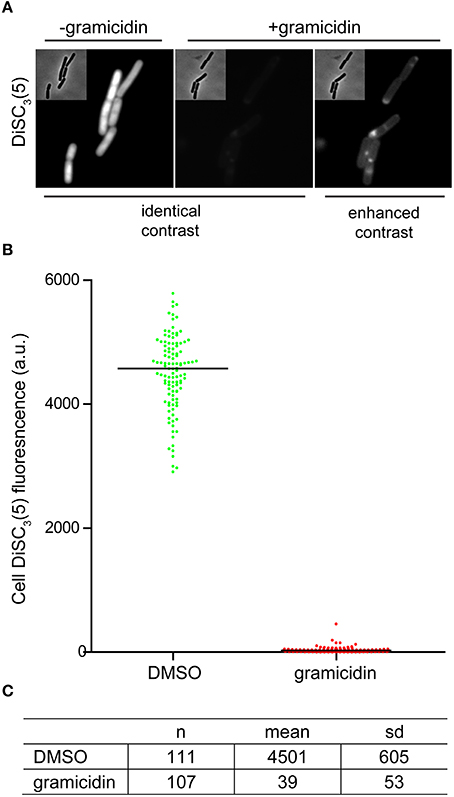
Figure 5. Microscopic single-cell measurement of membrane potential using DiSC3(5). (A) Fluorescence microscopy of DiSC3(5)-stained B. subtilis cells in the absence (left panel) and presence (right panels) of the small cation channel forming antimicrobial peptide gramicidin (5 μM). In the left, the polarized and depolarized cells are depicted with identical contrast settings providing a direct comparison. On the right, the contrast of the fluorescence image is enhanced in order to visualize the remaining staining. (B) The cellular DiSC3(5) fluorescence was quantified for logarithmic growth phase cells in the presence and absence of gramicidin (5 μM). The column scatter plot depicts the individual single-cell intensities and the median thereof. (C) The mean and standard deviation of the DiSC3(5)-fluorescence for the individual cells analyzed in graph (B) are shown. Strain used: B. subtilis 168 (wild type).
The speed and extent of membrane depolarization by an antimicrobial compound is frequently used in discussing pore formation as a potential mechanism of action (Silverman et al., 2003; Spindler et al., 2011). Since normal fluorometric assays only measure the cell population average, a cell-to-cell heterogeneity can result in seemingly slow depolarization kinetics even when full and rapid depolarization of individual cells takes place. By detecting such heterogeneity, the single cell analysis using DiSC3(5) provides a valuable control experiment to support conclusions drawn from fluorometric measurements. At last, the far-red fluorescence of DiSC3(5) is compatible with simultaneous detection of GFP. Changes in membrane potential upon antimicrobial challenge, and the consequences on cellular organization and protein localization can therefore be directly correlated on a single-cell level (Figure 6).
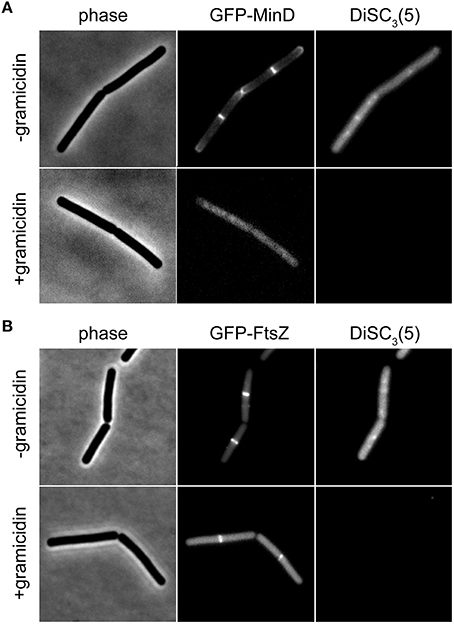
Figure 6. Compatibility of DiSC3(5) and GFP in microscopic single-cell experiments. (A) Phase contrast image (left panel) of cells expressing GFP-MinD (middle panel) and stained with DiSC3(5) (right panel) in the absence and presence of gramicidin (5 μM). Note the strong decrease in DiSC3(5) fluorescence and delocalization of MinD upon depolarization. (B) Phase contrast image (left panel) of cells expressing GFP-FtsZ (middle panel) and stained with DiSC3(5) (right panel) in the absence and presence of gramicidin (5 μM). Note the reduced septal signal of FtsZ upon depolarization. Strains used: B. subtilis KS64 (GFP-MinD), and B. subtilis 2020 (GFP-FtsZ).
Time-Lapse Microscopy Using Voltage-Sensitive Dyes
Time-lapse microscopy, in combination with microfluidic devices, is developing into a powerful tool in antibiotic mode of action studies. The strength of this approach is the direct and continuous observation of individual cells upon antimicrobial challenge (Sochacki et al., 2011; Barns and Weisshaar, 2013; Nonejuie et al., 2013). Very recently, time-lapse microscopy was used in combination with a cationic dye thioflavin T to analyse fluctuation of membrane potential in bacterial cell communities (Prindle et al., 2015). The voltage-dependent behavior of this dye is, however, at this stage only poorly characterized.
Several dyes commonly used to stain bacterial cells are growth inhibitory, and can therefore not be combined with time-lapse microscopy. This also turned out to be true for DiSC3(5) and a clear growth inhibition of B. subtilis was observed which makes DiSC3(5) incompatible with time-lapse experiments. However, another applicable voltage-dependent dye [DiBAC3(4)] does not inhibit growth at concentrations up to 10 μM (data not shown).
The voltage-sensitivity of DiBAC3(4) is based on the same fundamental principle as DiSC3(5) (Brauner et al., 1984; Epps et al., 1994). In contrast to positively charged DiSC3(5), however, DiBAC3(4) is an anion and the response of this dye to the membrane potential is accordingly opposite. In polarized cells, the dye is excluded from the cells due to the negative charge. This results in low fluorescent staining of well-energized cells. Upon depolarization, the dye can now enter the cell and strongly stain the cellular membranes. Indeed, when DiBAC3(4) was included in a regular time-lapse microscopy setup, this dye could be used as a reporter for membrane potential levels even in long term experiments spanning over 17 h (see Figure 7 and Supplementary Movie 1). Thus, voltage dependent dyes can be used in combination with time-lapse experiments allowing continuous monitoring of membrane potential at a single cell level.
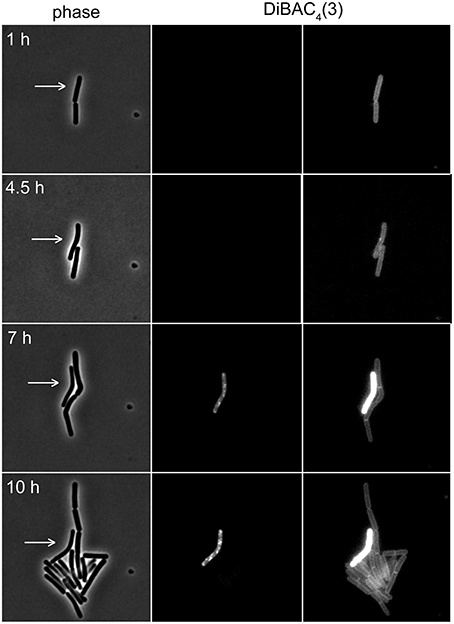
Figure 7. Time-lapse microscopy using voltage sensitive dye DiBAC4(3). Selected images of a time-lapse microscopy experiment carried out with B. subtilis cells stained with DiBAC4(3). Phase contrast images (left panel) and DiBAC4(3) fluorescence images (right panels) are depicted. Due to the strong fluorescence intensity difference between polarized and depolarized cells, the images are shown with two different contrast settings. High fluorescence intensity of DiBAC4(3) indicates low membrane potential. An individual cell that failed to enter logarithmic growth and subsequently undergoes membrane depolarization, is indicated with an arrow. See Supplementary Movie 1 for an example of a whole time-lapse series. Strain used: B. subtilis 168 (wild type).
Summary
In this manuscript, we describe several techniques to analyse bacterial membrane potential in vivo. While the applied spectroscopic and microscopic techniques are not novel, the emphasis here is on providing readily optimized generic assays for antibiotic research. The benefits and weaknesses of the individual assays, their analytical basis, and the underlying theory are discussed in order to provide a good starting point for a reader without extensive background knowledge. The methods presented here should be easy to implement and utilize commonly available equipment such as fluorescence plate reader and a regular fluorescence microscope. Every individual experiment is different and slight modifications to the presented generic protocols are likely to be necessary. We hope that the included details, controls, and the discussion will provide the means to easily adopt the introduced methods to the specific research questions. The techniques described here are optimized for B. subtilis but are, in principle, well transferable for use with other bacterial species.
Author Contributions
JT, DG, KS, and HS carried out the experiments and analyzed the data; HS and LH designed the project; HS wrote the paper.
Funding
HS was supported by Wellcome Trust Institutional Strategic Support Funds (ISSF) grant 105617/Z/14/Z, DG by Biotechnology and Biological Sciences Research Council (BBSRC) DTP Studentship BB/J014516/1, and LH by Netherlands Organisation for Scientific Research (NWO) grant STW-Vici 12128.
Conflict of Interest Statement
The authors declare that the research was conducted in the absence of any commercial or financial relationships that could be construed as a potential conflict of interest.
Supplementary Material
The Supplementary Material for this article can be found online at: https://www.frontiersin.org/article/10.3389/fcell.2016.00029
Supplementary Movie 1. Time-lapse microscopy using voltage sensitive dye DiBAC4(3). Time-lapse microscopy of B. subtilis cells stained with DiBAC4(3) over a time period of 17 h. Depicted are phase contrast images (left panel) and DiBAC4(3) fluorescence images (right panel) with a time resolution of 5 min. High fluorescence intensity of DiBAC4(3) indicates low membrane potential levels. Note the overall reduction of membrane potential upon entry into nutrient starvation-induced stationary growth phase. Strain used: B. subtilis 168 (wild type).
References
Aerts, A. M., Francois, I. E., Cammue, B. P., and Thevissen, K. (2008). The mode of antifungal action of plant, insect and human defensins. Cell. Mol. Life Sci. 65, 2069–2079. doi: 10.1007/s00018-008-8035-0
Barbe, V., Cruveiller, S., Kunst, F., Lenoble, P., Meurice, G., Sekowska, A., et al. (2009). From a consortium sequence to a unified sequence: the Bacillus subtilis 168 reference genome a decade later. Microbiology 155, 1758–1775. doi: 10.1099/mic.0.027839-0
Barns, K. J., and Weisshaar, J. C. (2013). Real-time attack of LL-37 on single Bacillus subtilis cells. Biochim. Biophys. Acta 1828, 1511–1520. doi: 10.1016/j.bbamem.2013.02.011
Bashford, C. L. (1981). The measurement of membrane potential using optical indicators. Biosci. Rep. 1, 183–196. doi: 10.1007/BF01114904
Brauner, T., Hulser, D. F., and Strasser, R. J. (1984). Comparative measurements of membrane potentials with microelectrodes and voltage-sensitive dyes. Biochim. Biophys. Acta 771, 208–216. doi: 10.1016/0005-2736(84)90535-2
Breeuwer, P., and Abee, T. (2004). Assessment of the membrane potential, intracellular pH and respiration of bacteria employing fluorescence techniques. Mol. Microb. Ecol. Manual, Second Edition 8.01, 1563–1580. doi: 10.1007/978-1-4020-2177-0_8
Brogden, K. A. (2005). Antimicrobial peptides: pore formers or metabolic inhibitors in bacteria? Nat. Rev. Microbiol. 3, 238–250. doi: 10.1038/nrmicro1098
Chimerel, C., Field, C. M., Pinero-Fernandez, S., Keyser, U. F., and Summers, D. K. (2012). Indole prevents Escherichia coli cell division by modulating membrane potential. Biochim. Biophys. Acta 1818, 1590–1594. doi: 10.1016/j.bbamem.2012.02.022
De Jong, I. G., Beilharz, K., Kuipers, O. P., and Veening, J. W. (2011). Live cell imaging of Bacillus subtilis and Streptococcus pneumoniae using automated time-lapse microscopy. J. Vis. Exp. 53, 176–188. doi: 10.3791/3145
Ehrenberg, B., Montana, V., Wei, M. D., Wuskell, J. P., and Loew, L. M. (1988). Membrane potential can be determined in individual cells from the nernstian distribution of cationic dyes. Biophys. J. 53, 785–794. doi: 10.1016/S0006-3495(88)83158-8
Epps, D. E., Wolfe, M. L., and Groppi, V. (1994). Characterization of the steady-state and dynamic fluorescence properties of the potential-sensitive dye bis-(1,3-dibutylbarbituric acid)trimethine oxonol (Dibac4(3)) in model systems and cells. Chem. Phys. Lipids 69, 137–150. doi: 10.1016/0009-3084(94)90035-3
Eun, Y. J., Foss, M. H., Kiekebusch, D., Pauw, D. A., Westler, W. M., Thanbichler, M., et al. (2012). DCAP: a broad-spectrum antibiotic that targets the cytoplasmic membrane of bacteria. J. Am. Chem. Soc. 134, 11322–11325. doi: 10.1021/ja302542j
Foss, M. H., Eun, Y. J., Grove, C. I., Pauw, D. A., Sorto, N. A., Rensvold, J. W., et al. (2013). Inhibitors of bacterial tubulin target bacterial membranes. Medchemcomm 4, 112–119. doi: 10.1039/C2MD20127E
Giuliani, A., Pirri, G., and Nicoletto, S. F. (2007). Antimicrobial peptides: an overview of a promising class of therapeutics. Cent. Eur. J. Biol. 2, 1–33. doi: 10.2478/s11535-007-0010-5
Guani-Guerra, E., Santos-Mendoza, T., Lugo-Reyes, S. O., and Teran, L. M. (2010). Antimicrobial peptides: general overview and clinical implications in human health and disease. Clin. Immunol. 135, 1–11. doi: 10.1016/j.clim.2009.12.004
Hibbing, M. E., Fuqua, C., Parsek, M. R., and Peterson, S. B. (2010). Bacterial competition: surviving and thriving in the microbial jungle. Nat. Rev. Microbiol. 8, 15–25. doi: 10.1038/nrmicro2259
Hosoi, S., Mochizuki, N., Hayashi, S., and Kasai, M. (1980). Control of membrane potential by external H+ concentration in Bacillus subtilis as determined by an ion-selective electrode. Biochim. Biophys. Acta 600, 844–852. doi: 10.1016/0005-2736(80)90487-3
Karoui, M. E., and Errington, J. (2001). Isolation and characterization of topological specificity mutants of minD in Bacillus subtilis. Mol. Microbiol. 42, 1211–1221. doi: 10.1046/j.1365-2958.2001.02710.x
Kawai, Y., Daniel, R. A., and Errington, J (2009). Regulation of cell wall morphogenesis in Bacillus subtilis by recruitment of PBP1 to the MreB helix. Mol. Microbiol. 71, 1131–1144. doi: 10.1111/j.1365-2958.2009.06601.x
Kelkar, D. A., and Chattopadhyay, A. (2007). The gramicidin ion channel: a model membrane protein. Biochim. Biophys. Acta 1768, 2011–2025. doi: 10.1016/j.bbamem.2007.05.011
Kreiswirth, B. N., Lofdahl, S., Betley, M. J., O'Reilly, M., Schlievert, P. M., Bergdoll, M. S., et al. (1983). The toxic shock syndrome exotoxin structural gene is not detectably transmitted by a prophage. Nature 305, 709–712. doi: 10.1038/305709a0
Marston, A. L., Thomaides, H. B., Edwards, D. H., Sharpe, M. E., and Errington, J. (1998). Polar localization of the MinD protein of Bacillus subtilis and its role in selection of the mid-cell division site. Genes Dev. 12, 3419–3430. doi: 10.1101/gad.12.21.3419
Mitchell, P. (1961). Coupling of phosphorylation to electron and hydrogen transfer by a chemi-osmotic type of mechanism. Nature 191, 144–148. doi: 10.1038/191144a0
Nonejuie, P., Burkart, M., Pogliano, K., and Pogliano, J. (2013). Bacterial cytological profiling rapidly identifies the cellular pathways targeted by antibacterial molecules. Proc. Natl. Acad. Sci. U.S.A. 110, 16169–16174. doi: 10.1073/pnas.1311066110
Prindle, A., Liu, J., Asally, M., Ly, S., Garcia-Ojalvo, J., and Suel, G. M. (2015). Ion channels enable electrical communication in bacterial communities. Nature 527, 59–63. doi: 10.1038/nature15709
Riedl, S., Zweytick, D., and Lohner, K. (2011). Membrane-active host defense peptides–challenges and perspectives for the development of novel anticancer drugs. Chem. Phys. Lipids 164, 766–781. doi: 10.1016/j.chemphyslip.2011.09.004
Roth, B. L., Poot, M., Yue, S. T., and Millard, P. J. (1997). Bacterial viability and antibiotic susceptibility testing with SYTOX green nucleic acid stain. Appl. Environ. Microbiol. 63, 2421–2431.
Rothfield, L., Taghbalout, A., and Shih, Y. L. (2005). Spatial control of bacterial division-site placement. Nat. Rev. Microbiol. 3, 959–968. doi: 10.1038/nrmicro1290
Saraste, M. (1999). Oxidative Phosphorylation at the fin de siècle. Science 283, 1488–1493. doi: 10.1126/science.283.5407.1488
Shapiro, H. M. (1994). Cell membrane potential analysis. Methods Cell. Biol. 41, 121–133. doi: 10.1016/S0091-679X(08)61713-6
Silverman, J. A., Perlmutter, N. G., and Shapiro, H. M. (2003). Correlation of daptomycin bactericidal activity and membrane depolarization in Staphylococcus aureus. Antimicrob. Agents Chemother. 47, 2538–2544. doi: 10.1128/AAC.47.8.2538-2544.2003
Singh, A. P., and Nicholls, P. (1985). Cyanine and safranine dyes as membrane potential probes in cytochrome c oxidase reconstituted proteoliposomes. J. Biochem. Biophys. Methods 11, 95–108. doi: 10.1016/0165-022X(85)90045-4
Sochacki, K. A., Barns, K. J., Bucki, R., and Weisshaar, J. C. (2011). Real-time attack on single Escherichia coli cells by the human antimicrobial peptide LL-37. Proc. Natl. Acad. Sci. U.S.A. 108, E77–E81. doi: 10.1073/pnas.1101130108
Spindler, E. C., Hale, J. D., Giddings, T. H. Jr., Hancock, R. E., and Gill, R. T. (2011). Deciphering the mode of action of the synthetic antimicrobial peptide Bac8c. Antimicrob. Agents Chemother. 55, 1706–1716. doi: 10.1128/AAC.01053-10
Stiefel, P., Schmidt-Emrich, S., Maniura-Weber, K., and Ren, Q. (2015). Critical aspects of using bacterial cell viability assays with the fluorophores SYTO9 and propidium iodide. BMC Microbiol. 15:36. doi: 10.1186/s12866-015-0376-x
Stokes, N. R., Sievers, J., Barker, S., Bennett, J. M., Brown, D. R., Collins, I., et al. (2005). Novel inhibitors of bacterial cytokinesis identified by a cell-based antibiotic screening assay. J. Biol. Chem. 280, 39709–39715. doi: 10.1074/jbc.M506741200
Strahl, H., Bürmann, F., and Hamoen, L. W. (2014). The actin homologue MreB organizes the bacterial cell membrane. Nat. Commun. 5:3442. doi: 10.1038/ncomms4442
Strahl, H., and Hamoen, L. W. (2010). Membrane potential is important for bacterial cell division. Proc. Natl. Acad. Sci. U.S.A. 107, 12281–12286. doi: 10.1073/pnas.1005485107
Strahl, H., Ronneau, S., Gonzalez, B. S., Klutsch, D., Schaffner-Barbero, C., and Hamoen, L. W. (2015). Transmembrane protein sorting driven by membrane curvature. Nat. Commun. 6, 8728. doi: 10.1038/ncomms9728
Vecer, J., Herman, P., and Holoubek, A. (1997). Diffusion membrane potential in liposomes: setting by ion gradients, absolute calibration and monitoring of fast changes by spectral shifts of diS-C3(3) fluorescence maximum. Biochim. Biophys. Acta 1325, 155–164. doi: 10.1016/S0005-2736(96)00254-4
Vischer, N. O., Verheul, J., Postma, M., van den Berg van Saparoea, B., Galli, E., Natale, P., et al. (2015). Cell age dependent concentration of Escherichia coli divisome proteins analyzed with ImageJ and ObjectJ. Front. Microbiol. 6:586. doi: 10.3389/fmicb.2015.00586
Waggoner, A. (1976). Optical probes of membrane potential. J. Membr. Biol. 27, 317–334. doi: 10.1007/BF01869143
Waggoner, A. S. (1979). Dye indicators of membrane potential. Annu. Rev. Biophys. Bioeng. 8, 47–68. doi: 10.1146/annurev.bb.08.060179.000403
Wenzel, M., Kohl, B., Munch, D., Raatschen, N., Albada, H. B., Hamoen, L., et al. (2012). Proteomic response of Bacillus subtilis to lantibiotics reflects differences in interaction with the cytoplasmic membrane. Antimicrob. Agents Chemother. 56, 5749–5757. doi: 10.1128/AAC.01380-12
Wenzel, M., Patra, M., Senges, C. H., Ott, I., Stepanek, J. J., Pinto, A., et al. (2013). Analysis of the mechanism of action of potent antibacterial hetero-tri-organometallic compounds: a structurally new class of antibiotics. ACS Chem. Biol. 8, 1442–1450. doi: 10.1021/cb4000844
Whatmore, A. M., Chudek, J. A., and Reed, R. H. (1990). The effects of osmotic upshock on the intracellular solute pools of Bacillus subtilis. J. Gen. Microbiol. 136, 2527–2535. doi: 10.1099/00221287-136-12-2527
Wimley, W. C., and Hristova, K. (2011). Antimicrobial peptides: successes, challenges and unanswered questions. J. Membr. Biol. 239, 27–34. doi: 10.1007/s00232-011-9343-0
Yeaman, M. R., and Yount, N. Y. (2003). Mechanisms of antimicrobial peptide action and resistance. Pharmacol. Rev. 55, 27–55. doi: 10.1124/pr.55.1.2
Zaritsky, A., Kihara, M., and MacNab, R. M. (1981). Measurement of membrane potential in Bacillus subtilis: a comparison of lipophilic cations, rubidium ion, and a cyanine dye as probes. J. Membr. Biol. 63, 215–231. doi: 10.1007/BF01870983
Keywords: membrane potential, depolarization, membrane permeability, antimicrobial, voltage-sensitive dye, potentiometric dye
Citation: te Winkel JD, Gray DA, Seistrup KH, Hamoen LW and Strahl H (2016) Analysis of Antimicrobial-Triggered Membrane Depolarization Using Voltage Sensitive Dyes. Front. Cell Dev. Biol. 4:29. doi: 10.3389/fcell.2016.00029
Received: 19 February 2016; Accepted: 24 March 2016;
Published: 13 April 2016.
Edited by:
Mauricio Antonio Retamal, Universidad del Desarrollo, ChileReviewed by:
Luis Gonzalo Cuello, Texas Tech University Health Sciences Center, USAEmma Denham, University of Warwick, UK
Copyright © 2016 te Winkel, Gray, Seistrup, Hamoen and Strahl. This is an open-access article distributed under the terms of the Creative Commons Attribution License (CC BY). The use, distribution or reproduction in other forums is permitted, provided the original author(s) or licensor are credited and that the original publication in this journal is cited, in accordance with accepted academic practice. No use, distribution or reproduction is permitted which does not comply with these terms.
*Correspondence: Henrik Strahl, h.strahl@ncl.ac.uk
†Present Address: J. Derk te Winkel, Department of Biology I, Ludwig-Maximilians-University Munich, Planegg-Martinsried, Germany
‡These authors have contributed equally to this work.