Transformational IoT sensing for air pollution and thermal exposures
 Jovan Pantelic
 Negin Nazarian
 Clayton Miller3
  Forrest Meggers
 Jason Kai Wei Lee
 Dusan Licina
- 1Well Living Lab, Delos Living LLC, Rochester, MN, United States
- 2Climate-Resilient Cities Lab, Faculty of Built Environment, University of New South Wales, Kensington, NSW, Australia
- 3Building and Urban Data Science Lab, Department of the Built Environment, College of Design and Engineering, National University of Singapore, Singapore, Singapore
- 4CHAOS Lab, School of Architecture and the Andlinger Center for Energy and the Environment, Princeton University, Princeton, NJ, United States
- 5Human Potential Translational Research Programme, Yong Loo Lin School of Medicine, National University of Singapore, Singapore, Singapore
- 6Human-Oriented Built Environment Lab, School of Architecture, Civil and Environmental Engineering, École Polytechnique Fédérale de Lausanne, Lausanne, Switzerland
Cities today encounter significant challenges pertaining to urbanization and population growth, resource availability, and climate change. Concurrently, unparalleled datasets are generated through Internet of Things (IoT) sensing implemented at urban, building, and personal scales that serve as a potential tool for understanding and overcoming these issues. Focusing on air pollution and thermal exposure challenges in cities, we reviewed and summarized the literature on IoT environmental sensing on urban, building, and human scales, presenting the first integrated assessment of IoT solutions from the data convergence perspective on all three scales. We identified that there is a lack of guidance on what to measure, where to measure, how frequently to measure, and standards for the acceptable measurement quality on all scales of application. The current literature review identified a significant disconnect between applications on each scale. Currently, the research primarily considers urban, building, and personal scale in isolation, leading to significant data underutilization. We addressed the scientific and technological challenges and opportunities related to data convergence across scales and detailed future directions of IoT sensing along with short- and long-term research and engineering needs. IoT application on a personal scale and integration of information on all scales opens up the possibility of developing personal thermal comfort and exposure models. The development of personal models is a vital promising area that offers significant advancements in understanding the relationship between environment and people that requires significant further research.
1 Introduction
The United Nations projects that 68% of the population by 2050 will live in the cities (UN, 2018). Numerous challenges arise for the cities that will need to provide a livable environment for such a large portion of the human population housed in a high-density environment. The global increase in air pollution represents one of the world’s growing concerns. WHO states “almost all of the global population (99%) breathe air that exceeds air quality limits (WHO, 2021).” Air pollution impacts cardiovascular health (Mills et al., 2009), pulmonary health (Pope, 2000), and cognitive performance (Peters et al., 2015). Sources of indoor pollution are cooking, cleaning, candle/incense burning, smoking (Habre et al., 2014), and building materials (Liu et al., 2013) while ambient sources include combustion products, photochemical reaction products, and metals (Habre et al., 2014). A combination of ambient and indoor air pollution exposure is associated with (Liu et al., 2013) million premature deaths annually (Air pollution, 2022), highlighting the significance and magnitude of the problem. On the other hand, cities face significant challenges of urban overheating driven by global climate change and urban development (Nazarian et al., 2021a). These compounding effects represent a threat to human thermal comfort in outdoor spaces as well as indoor environments where buildings have to provide comfort under warmer summer conditions utilizing low-energy design strategies (Holmes and Hacker, 2007). One of the critical problems in alleviating the air pollution exposures and thermal comfort is understanding the complete set of contributing factors that impact the entire ecosystem and the effectiveness of potential mitigation strategies. The effectiveness of mitigation strategies needs to be quantified to implement solutions based on the knowledge. This requires the ability to quantify various aspects of the urban environment, motivating integrated and multi-scale environmental sensing in cities. The Internet of Things (IoT) technologies are the paradigm that emphasizes such ubiquitous sensing installed using modern wireless communications enabling quantification of a full set of environmental parameters that affect air pollution exposure and thermal comfort. It is a novel approach to monitoring, assessing, and ultimately addressing challenges related to air pollution exposure and thermal stress and comfort (Grimm et al., 2008; Bibri, 2018). Compared to conventional sensing, IoT sensing offers increased environmental information with higher spatial granularity and reduced and less centralized resources. These sensor networks focus on data volume and the potential to train machine learning models to allow informed decision-making.
The emergence of new green certification schemes for buildings and communities, businesses that offer IoT environmental sensing, analytics, and building management system integration, alongside wearable tech ecosystems focusing on human wellness, increased concerns about the indoor air quality in the COVID-19 pandemic, represent the driving forces behind widespread IoT adaptation (Parkinson et al., 2019a). These new trends, however, do not come without challenges. At the moment, there is still a set of technological, scientific, and legal challenges regarding data acquisition and analytics that provides critical information necessary to solve environmental challenges on the human, building, and urban scales.
1.1 Systematic review
Existing reviews focus on either urban scale (Jovašević-Stojanović et al., 2015; Muller et al., 2015; Kumar et al., 2016; Morawska et al., 2018), intended to address outdoor air quality and comfort, building scale (Schieweck et al., 2018; Parkinson et al., 2019a; Cahill et al., 2019) that deals with the indoor air quality and comfort, or personal scale (Ghahramani et al., 2019a; Nazarian and Lee, 2021). This separation between scales of the application keeps the research areas completely isolated. Several existing reviews summarized the conceptual application of IoT technology, sensor accuracy, challenges of field calibration, data acquisition, and storage (Morawska et al., 2018; Ullo and Sinha, 2020; Hajjaji et al., 2021). Moreover, despite the ongoing expansion of knowledge, challenges regarding data analytics and convergence perspectives across various spatial and temporal scales, which enable the conversion of data into knowledge, are yet to be addressed.
This paper fills the knowledge gap by synthesizing research and applying IoT sensing for air quality and thermal comfort indoors and outdoors. The presented research evidence is based on a critical synthesis of the existing literature drawn from broadly used databases such as Web of Science, Scopus, and Google Scholar. The selection process intended to identify relevant, high-quality papers on which the authors could base their conclusions. Each section of the current review covers a fairly distinctive area of research. Therefore, each section had a different and unique literature search that covered the application of IoT sensing on air quality and thermal comfort.
The selection of papers was generally done in two steps: by systematic bibliographic search and supplementary literature additions. The systematic bibliographic search relied on a combination of the following keywords: IoT sensing, low-cost sensing, indoor air quality, thermal comfort, urban heat, exposure, sensors, MRT, and proxy sensing. Based on the author’s expert knowledge in each area of the current review, we included supplementary literature additions. The search included papers published between 2008 and March 2022, but more recent papers received substantial emphasis given the novelty and recent research and application development in IoT sensing. Since this review covers interdisciplinary research, where each discipline has a unique publishing culture, we need to emphasize that supplementary literature additions were crucial to cover all relevant papers in the field. We were extra careful to cite previous review papers in each of the disciplines covered in this review.
Criteria for exclusion from the review included papers that only presented frameworks without demonstrating implementation and precise data collection and analysis methods. In order to give recommendations that could be relevant to building monitoring and benchmarking and uptake of IoT sensing implementation, the present authors decided to go beyond the simple synthesis of the otherwise sparse and broadly archival literature. Instead, the study also relied on the ‘grey’ literature (e.g., government reports, white papers, and other documentation, etc.) and on the authors’ collective long-term practical experience in the field globally.
1.2 Objectives
To bridge the knowledge gaps and respond to the fast-emerging trends, this review aims to interpret and synthesize the current state-of-the-art research on developing, employing, and assessing IoT technologies from the data convergence perspective for better assessment and response to issues related to human health and comfort. The current review aims to highlight the key scientific and technological questions that form an integrated vision for future directions in the field. We categorize three spatial scales for assessments: urban, building, and human scales (Figure 1). Based on the published literature for each scale, we evaluated the level of development of the field. In assessing air quality and thermal comfort in the urban (Section 2) and building context (Section 3), we focus on mapping the environment that causes “an exposure” of a population subgroup. Centered on assessing personal comfort and exposure directly at the point of contact with a specific individual, Section 4 addresses the emergence of the “Human-Centric” IoT sensing that overcomes the one-size-fits-all solutions promoted by traditional guidelines and measurement approaches. Section 5 addresses challenges related to data, technology, academic, and industry silos, privacy security, and human and data interaction. Although we mention issues involving privacy detail review of this complex legal topic is outside the scope of this review. Technological and scientific needs, challenges, and opportunities for cross-disciplinary advancement in short- and long-term future research efforts are further discussed in Section 6. We summarized our conclusions in Section 7.
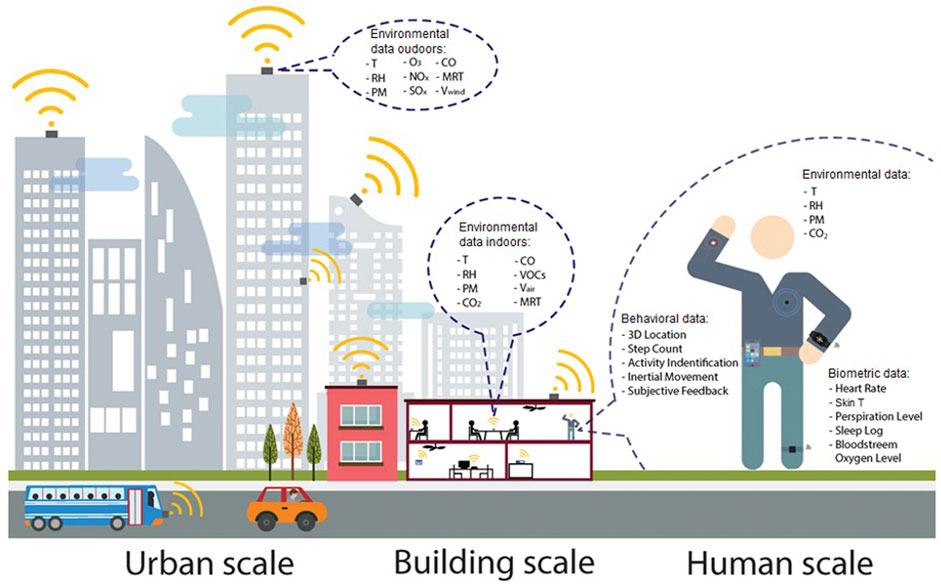
FIGURE 1. Schematic of IoT sensing applied to the built environment at the urban, building and human scales. The three scales encompass variations of environmental parameters, while the human scale also includes biometric (physiological) and behavioral data.
2 IoT sensing applied to urban scale
Urban scale sensing network in the city-state of Singapore covers 142 km2(Haze - The National Environment Agency, About Singapore), with the singleair quality measurement stations, the San Francisco Bay Area air quality network covers 47.6 km2 (Wikipedia contributors 2022, BAAQMD - Air Quality Data)per station while the state of Nebraska air quality monitoring network covers 10543.7 km2 (NDEE home) with the single station. These examples depict challanges in precisely defining urban scale as a particular surface area or distance.
Motivated by pressing environmental issues such as air pollution and thermal stress, this section discusses the emerging IoT technologies applied to air quality and thermal comfort sensing at the urban scale. In addition to summarizing the current state-of-the-art knowledge, issues related to the granularity of sensing, field calibration of sensors, existing methods for the IoT-based description of the urban environment, and the utility of collected information to improve air quality pollutants and heat exposure are reviewed. Lastly, we discuss the development of air quality exposure and thermal comfort models while highlighting the need for future developments.
2.1 Outdoor IoT sensing of air quality
Increasingly frequent episodes of elevated air pollution across different cities have evoked new questions related to the concentrations of urban air pollutants and their spatio-temporal patterns. Traditionally, information about human environmental exposure outdoors has been derived from the data gathered from governmental or environmental weather stations (Baxter et al., 2013; Özkaynak et al., 2013). Such information typically comes from gravimetric techniques and high-grade optical and chemical analyzers capable of integrated or longitudinal detection of a bouquet of ambient air pollutants. Collectively, this approach has offered important insights into ambient air quality that have been used to regulate air pollutant emissions, to propose control measures, and evaluate their efficiencies. Also, such monitoring stations have been long utilized as a benchmark for epidemiologists and public health authorities to produce formal guidelines for population exposures to specific air pollutants (Ott and Roberts, 1998; Xie et al., 2017; Dias and Tchepel, 2018; Caplin et al., 2019).
However, traditional monitoring of urban air quality faces several shortcomings. First and foremost, the conventional monitoring of urban air is stationary, sparse, and typically remote from human activities, and as such, it poorly resembles air inhaled by people (Miller et al., 2007; McKone et al., 2009; Goldman et al., 2010; Harrison et al., 2015; Pearce et al., 2016). This has been confirmed in studies that deployed wearable monitors and samplers for measuring PM10 (Jenkins et al., 1996; Scapellato et al., 2009; Broich et al., 2011), PM2.5 (Andresen et al., 2005; Crist et al., 2008; Steinle et al., 2015), PM1 (Williams et al., 2000; Johannesson et al., 2007; Velasco and Tan, 2016), CO2 (Gall et al., 2016), CO (Huang et al., 2012), NOx (Xu et al., 2017) and various volatile organic compounds (Rotko et al., 2000; O’Connell et al., 2014; Manzano et al., 2018). Failure of traditional approaches in representing the air pollution gradients at the urban, neighborhood, and parcel of land level points to a need for increased measurement granularity. Second, the high cost of conventional monitoring equipment (Clemitshaw, 2004), which includes costs related to instrument maintenance, data collection, and processing impedes their ubiquitous deployment. Finally, the information acquired is typically used by experts only and there is a lack of accessibility and interpretation of the information that supports citizen activities.
With the recent emergence of low-cost IoT sensors applied to urban scale, an opportunity has opened up to make use of affordable, accessible, robust, and non-expert friendly solutions. Dozens of projects have investigated the application of IoT sensing in urban environments, pointing toward the need for a paradigm shift in air quality monitoring that creates new information services tackling human needs, management of urban spaces, and environmental policies (Kumar et al., 2015; Castell et al., 2017; Schneider et al., 2017; Morawska et al., 2018). The specific goals are set at refined spatio-temporal air pollutant mapping of urban spaces in order to 1) pinpoint localized air pollution hotspots, 2) improve source apportionment, 3) enhance assessment and predictive models for air pollutant exposures. In addition, easy-to-use ubiquitous IoT sensing technologies can raise citizen awareness and enable both professionals and non-experts to acquire insights.
To date, the air quality IoT sensing deployment at the urban scale has been mostly based on the high placement density of stationary IoT sensors in areas commonly occupied by humans (Gao et al., 2015; Moltchanov et al., 2015; Castell et al., 2017; Zikova et al., 2017; Ahangar et al., 2019; Bulot et al., 2019; Johnston et al., 2019). These studies conclude that optimal granularity of low-cost IoT sensors can drastically improve 2D and 3D air quality mapping, which is essential information to be translated to urban planners, building designers, the general public, and other stakeholders. Without optimal sensing granularity that results in considerable spatial data gaps, it is impossible to accurately map the urban air quality—a challenge that can be overcome by combining the crowdsourced measurements with model data with comprehensive spatial coverage (Schneider et al., 2017). Other deployment methods include IoT sensor installation on mobile sensing platforms such as bicycles, cars, buses, and trams that can improve spatial coverage (Devarakonda et al., 2013; Mead et al., 2013; Castell et al., 2015; Hasenfratz et al., 2015; Lim et al., 2019). While economically more appealing due to the significantly reduced number of sensors, the mobility of the platform in conjunction with a prolonged response time of typical sensors can cause large signal distortion—an issue that can be overcome through the application of active sampling that employs pumps/fans as actuators (Arfire et al., 2016). Finally, urban air pollution mapping has also been conducted by means of wearable IoT sensors and smartphones (see Section 4.2) (Zhang et al., 2017; Nyarku et al., 2018; Ueberham and Schlink, 2018).
Despite the rapid progress in method development for IoT sensors in an urban context, several challenges persist. First, the identification of air pollution hotspots is limited as both scientific literature and regulations lack approaches to provide optimal spatial sensor granularity and placement across different urban typologies (Castell et al., 2017; Schneider et al., 2017). In addition, a disconnection between urban and building scales impedes our ability to better design and operate buildings. For example, building ventilation standards such as ASHRAE 62.1 requires a two-step investigation of outdoor air quality—1) compliance verification with the national outdoor air quality standards, and 2) an observational survey of the building site (American Society of Heating and Engineers, 2016). But for 1) the verification is based on measurements only at remote governmental stations and for 2) the building site survey lacks guidance on the type, duration, and location of measurements. Additionally, once the IoT-based information is acquired at the urban scale, it is necessary to trigger the right chain of actions, either via a feedback loop to encourage human actions and/or through an IoT gateway that links a cloud platform with automated controllers and devices. At present, methodologies on how to utilize that information are sparse, resulting in enormous data sets that are heavily underutilized (Zanella et al., 2014). The other challenges include a need for a framework to integrate different types of existing air quality sensors into a single monitoring network and a lack of standardized protocols that specify the required sensor robustness and data quality (Morawska et al., 2018). Lastly, the spectrum of air pollutants that should be monitored by IoT sensors is relatively vague with regard to environmental health knowledge. While it is neither practical nor technically feasible to measure all the air pollutants relevant to humans, future research should examine how to optimize the types of sensors to capture relevant air quality indicators.
2.2 Outdoor IoT sensing of the thermal environment
Similar to air quality monitoring in urban areas, the information regarding outdoor thermal environments is often derived from the stationary and at times remote, weather stations, neglecting the significant intra-urban variability of temperature, humidity, wind and radiation exposure (Fenner et al., 2017a). The advantages of IoT-based sensing in addressing such shortcomings are indisputable: crowd-sourced measurements 1) provide real-time data from various cities around the globe (inter-urban variability in urban temperature (Wörner et al., 2014), 2) span a wider range of spatial and temporal distributions within the built environment (intra-urban variability in thermal environment (Meier et al., 2017), 3) overcome the high and centralized costs for installation and maintenance over time (low-cost sensing and/or Web 2.0 technologies (Dayan and Hartley, 2013; Young et al., 2014), and 4) provide dynamic information regarding heat exposure and the population impact of thermal comfort (Grasso et al., 2017).
Accordingly, in the last few years, several studies have taken crucial steps in tackling the challenges in IoT thermal sensing in the built environment. Previous research was mainly focused on monitoring of environmental parameters primarily temperature and humidity and largely divided into the employment of stationary or mobile sensors, with only a few studies combining the two to span a larger spatial and temporal distribution to improve accuracy (Muller et al., 2015; Shi et al., 2021). Among stationary amateur thermal sensors applied outdoors, there has been the emergence of low-cost citizen weather stations with connectivity to smartphones, local Wi-Fi networks and cloud in real time. Such units have become mainstream consumer peripherals in recent years with tens of thousands now deployed in cities across the world, including the United Kingdom (Chapman et al., 2017; Chapman and Bell, 2018), Germany (Meier et al., 2015; Fenner et al., 2017b; Meier et al., 2017), France (Napoly et al., 2018), Russia (Varentsov et al., 2021), and the Netherlands (de Vos et al., 2017). The crowdsourced datasets have also been combined with high-resolution data on urban form and fabric to provide more in-depth analyses of urban design impacts on thermal environments (Potgieter et al., 2021); or compared with remotely-sensed measurements of urban thermal environments globally (Venter et al., 2021) demonstrating the shortcomings of satellite data for urban heat risk assessments.
Although the low cost and ease of use of citizen weather stations have promoted their widespread use, they are largely focused on urban temperature and humidity as a proxy for thermal comfort, while other environmental parameters (such as radiation and wind speed), as well as physiological and behavioral factors, are often neglected. Several efforts are emerging to crowdsource urban wind (Droste et al., 2020; Chen et al., 2021), focusing on quantifying the uncertainty in wind speed data based on the realistic application of sensors in the built environment. Overall, such quantification of bias appears to be one of the key challenges of using citizen weather stations. Bell et al. (2015) provided a detailed assessment of data accuracy and concluded that any application of such low-cost sensing monitoring stations will require a quality-control system capable of removing gross errors, correcting instrument bias, and providing an uncertainty estimate, which is collectively needed to ensure effective outdoor IoT sensing of the thermal environment. Responding to this need, more holistic quality-control measures for crowdsourced air temperature observations are recently developed (Fenner et al., 2021), enabling a more consistent use of citizen weather station data in worldwide applications.
IoT platforms’ reduced size and cost further enable distributed and mobile deployments at the urban scale. Several mobile sensing methodologies deployed to date can be categorized in four major formats: 1) portable amateur weather stations, 2) smartphones, 3) vehicle-based sensors, and 4) wearable devices (Section 4). It is worth noting that compared to the IoT air quality measurements (Section 2.1), the portable and smartphone sensors for thermal comfort are distinguished from wearables, as the latter can provide physiological parameters, such as heart rate and skin temperature, corresponding to the thermal environment.
In the first category, the National Science Experiment in Singapore (low-cost wireless SENSg devices (Wilhelm et al., 2016) is arguably the largest deployment of portable amateur weather stations with 50,000 sensors employed in Singapore for the assessment of thermal comfort among various other objectives (Monnot et al., 2016a; Happle et al., 2017). However, the data regarding the thermal environment has not been extensively utilized, perhaps due to measures required for data quality controls in dynamic use. Second, temperature and pressure obtained from smartphone batteries are proposed to obtain a spatial and temporal map of air temperature in cities (Overeem et al., 2013; Pape et al., 2015; Droste et al., 2017; Martilli et al., 2017). Although this methodology provides an unprecedented dataset on city-scale thermal environment, the uncertainties of data collection are of concern and increase in cities with more extreme weather and higher precipitation when the smartphone is most likely to be held enclosed (Martilli et al., 2017). A closer comparison of mobile measurements with scientific-grade sensors reveals that, even when smartphones are exposed to ambient air, uncertainties are increased with higher humidity (where the smartphone hygrometer is saturated) and bias corrections are needed for Sun exposure and high wind speeds (Cabrera et al., 2021), which is yet to be developed for realistic and dynamic data measurements. In the third category, mobile sensors mounted on vehicles, bicycles, and public transit systems have been used to make strategic transects through cities to observe thermal comfort variables, providing valuable real-time data, particularly in the face of extreme events in cities (Heusinkveld et al., 2014; Castell et al., 2015; Anjomshoaa et al., 2018). Lastly, vehicle-based data, while still understudied, are more comprehensive in obtaining behavioral patterns and can be used to develop personal comfort models given a rich dataset (Mahoney and O’Sullivan, 2013; Fugiglando, 2018). Overall, it is important to consider that if the spatial distribution of thermal exposure in urban areas is of interest, data collected using mobile sensors require post-processing in the form of time-detrending and sensor lag correction (Häb et al., 2015; Middel and Krayenhoff, 2019).
In addition to stationary and mobile IoT environmental sensing, a few novel data-driven analyses can be noted which, in combination with previously described methods, represent a paradigm shift in thermal comfort assessments at the urban scale. First, IoT technologies have enabled the assessment of thermal comfort on human activity and behavior in the built environment. For instance, in addition to environmental measurements, Wi-Fi connectivity data in outdoor spaces have been used to obtain real-time occupancy data and to explain outside dwelling patterns modified by thermal environments (Reinhart et al., 2017; Dhariwal et al., 2019). Using Wi-fi scanners in public courtyards, Reinhart et al. (2017) recorded occupancy patterns over 10-month in addition to measurements of air temperature, relative humidity, wind speed and direction, and solar radiation. The thermal environment (characterized by biometeorological thermal comfort indices) was found to strongly correlate with lunch-time activity by regular users. These correlations suggest that IoT measurements of the thermal environment outdoors can be used by designers and planners to predict the spatiotemporally differentiated use of outdoor areas. Second, in the last decade, additional proxy datasets, such as social media data on Facebook and Twitter have introduced an alternative approach to crowdsensing urban heatwaves and the consequent impact on human activity (Grasso et al., 2017). Lastly, methodologies in urban climate informatics (Middel et al., 2022), such as crowdsourcing urban form information in the WUDAPT project (Bechtel et al., 2019) and crowdsourcing the Street View Imagery (Juhász and Hochmair, 2016; Middel et al., 2019) have enabled the city-scale calculation of thermal comfort parameters such as sky view factor and mean radiant temperature (MRT), which can complement low-cost IoT sensing of air temperature and humidity implemented across cities to achieve a comprehensive analysis of thermal comfort outdoors.
Despite a great deal of progress, the assessment of thermal comfort has been slow in harnessing crowdsourcing and IoT-based technologies for data collection (Chapman et al., 2017). Several challenges contribute to this fact. The first challenge pertains to the extent of the parameters that need to be monitored: an accurate thermal comfort assessment requires a range of environmental, behavioral, and physiological (Section 4) parameters which are complex to include in one sensing unit. Air temperature and humidity are far easier to obtain than radiation exposure and wind speed. Additionally, thermal comfort is defined as the “state of mind” (ASHRAE Standard 55) in response to the thermal environment, and therefore, the heat transfer in the environment cannot sufficiently describe the “comfort for all” (Nikolopoulou et al., 2001). The characteristics of urban spaces and the mode of activity of the occupants dramatically influence the thermal comfort perception, increasing the need for comprehensive, yet accurate, data collection mechanisms that include subjective feedback. The second challenge relates to the ease of use for widespread adoption of sensing units. The size of the devices, power (cordless vs. corded) and the lifetime of the devices in the field, and more importantly, the data communication method (wired vs. wireless) are crucial factors for long-term and scalable employment. Ideally, the IoT-based thermal comfort sensor that can record all relevant parameters is 1) of a size that is employable in a non-intrusive way 2) able to log data with sufficient storage for the long term, and 3) able to communicate the data wirelessly with a sufficient frequency. Lastly, even when all the above-mentioned conditions, the cost must not be prohibitive. Large city-scale deployment of IoT sensing for thermal comfort still faces substantial price barriers, particularly in research.
3 IoT sensing applied to building scale
Since people spend around 90% of their time indoors (Klepeis et al., 2001), building scale thermal environments and air quality have proportionally the highest influence on occupants’ thermal comfort and one if not the most important influences on air pollution exposure. Therefore, it is absolutely critical to characterize the indoor environment. IoT environmental sensing has the goal to enable an understanding of the dynamics of building operations. This section summarizes the capabilities of IoT sensing to characterize the thermal environment and indoor air quality, sensing methodologies for longitudinal evaluation of buildings operations, and the field of proxy sensing.
3.1 State-of-the-art continuous measurement capabilities indoors
Several IoT platforms for monitoring air quality and thermal environment have been deployed in residential and commercial buildings (Edirisinghe et al., 2012; Abraham and Li, 2014; Kim et al., 2014; Salamone et al., 2015; Ali et al., 2016; Scarpa et al., 2017; Pantelic et al., 2018a; Carre and Williamson, 2018; Coleman and Meggers, 2018; Idrees et al., 2018; Martín-Garín et al., 2018; Parkinson et al., 2019a), educational facilities (Palacios Temprano et al., 2020; Ulpiani et al., 2021), industrial settings (Li et al., 2018), occupant exposure assessments (Jackson-Morris et al., 2016; Kelly et al., 2017; Curto et al., 2018; Pantelic et al., 2020) and on mobile platforms (Jin et al., 2018a).
With regard to assessing thermal environments, indoor IoT sensing platforms typically measure air temperature and relative humidity and often lack the capabilities to measure comprehensive sets of thermal environment indicators that include air velocity or mean radiant temperature (MRT). Monitoring air velocity is particularly important in spaces that use elevated air movement as a means to achieve thermal comfort (Zhai et al., 2015; Schiavon et al., 2017). Advancements in air velocity measurements have been made with the development of low-cost ultrasonic velocity sensors (Ghahramani et al., 2019b) and the integration and deployment of 2D hot-wire anemometers in indoor sensing platforms13. With the increasing popularity of high-rise glass towers, radiative heat transfer can make up approximately half of the heat transfer between occupants and the surrounding indoor environment (Teitelbaum et al., 2019), making MRT measurements critical for indoor thermal comfort assessments. The black globe thermometer provides a reasonable and affordable solution for MRT measurements (Thorsson et al., 2007; Parkinson et al., 2019a) but recent works have shown that black globes cannot accurately measure MRT due to the significant impact of airspeed on the measurement (Guo et al., 2018; Teitelbaum et al., 2020a; Teitelbaum et al., 2020b; Teitelbaum et al., 2022). Uncertainty of MRT measurement is proportional to globe diameter and depends on the convection regime (Teitelbaum et al., 2022). When ambient air velocity is lower than 0.2 m/s, the black globe sensor used for MRT measurement is in the mixed convection regime that is challenging to account for using the correction factor (Teitelbaum et al., 2022). Accurate measurement of MRT on a building scale can be achieved with infrared thermal scanning and mapping of the physical environment with LiDAR (Light Detection and Ranging) technology (Houchois et al., 2019).
With regards to air quality, the common air quality indices at the building scale include CO, CO2, PM2.5, PM10, TVOC, O3, CH2O, NO2, and radon. The current IoT sensors for PM2.5 have reasonable accuracy, within a factor of 2 from a reference, which suggests their suitability for indoor air quality management; however, their accuracy can be compromised if the dominant source includes particles of the ultrafine size range (Wang et al., 2015; Manikonda et al., 2016; Singer and Delp, 2018; Wang et al., 2020; Demanega et al., 2021). A more recent study showed very good agreement between low-cost IoT PM2.5 sensors with scientific-grade instruments (Hegde et al., 2020; He et al., 2021) especially after applying RH corrections (Tagle et al., 2020; Zou et al., 2021). The CO2 sensors generally have good agreement with reference monitors (Demanega et al., 2021). Measurement of PM10 in most proposed platforms is based on models that derive concentration from the same dataset as PM2.5 (Kim and Oh, 2018), and not from direct measurement. Although studies indicated that low-cost TVOC sensors can be deployed indoors despite their poor quantitative agreement (Moreno-Rangel et al., 2018; Demanega et al., 2021), the common issue is that they cannot differentiate physicochemical properties of hundreds of individual organic compounds (Jackson-Morris et al., 2016; Kelly et al., 2017; Curto et al., 2018) some of which are strongly linked to health effects (Schieweck et al., 2018). O3 sensors have been utilized in several studies (Firdhous et al., 2017; Zhang et al., 2021). Low-cost O3 sensors can be calibrated to measure concentrations encountered in indoor environments (Pang et al., 2017) with recent studies addressing machine learning-based learning-based calibration improvements (Ferrer-Cid et al., 2020). A review of low-cost IoT sensor operation by the Air Quality Sensor Performance Evaluation Center suggested that O3 sensors are able to provide useful qualitative and quantitative measurements when used off the shelf (Collier-Oxandale et al., 2020). Measurement of indoor radon with IoT environmental sensing has been recently proposed (Blanco-Novoa et al., 2018; Pereira et al., 2020) CO sensor detection range is a topic that needs further research (Nandi et al., 2019) and both metal-oxide and optical-based sensors need improvement on the lower end of detection limit (Nandy et al., 2018). At the moment a low-cost IoT CH2O sensor capable of measuring CH2O is under development (van den Broek et al., 2020). NO2 was previously measured (Coleman and Meggers, 2018; Collier-Oxandale et al., 2020), but general methods for calibration are still missing for these sensors deployed on a building scale. Based on scientific evidence it can be argued that IoT sensing of indoor chemistry is still in its early stages.
Existing IoT sensing platforms can measure the basic parameters of the indoor air quality matrix (Pantelic et al., 2018b). Various studies have used different evaluation methods to assess IoT environmental sensors’ accuracy and reliability. The sensing drift of low-cost sensors over time is yet another unknown that requires further investigation (Chojer et al., 2020). Nonetheless, the quality and variety of the low-cost sensors have been increasing over the years, but the development of standards and guidelines for testing methods, sensing network accuracy, repeatability, and reliability should be considered a priority (Schieweck et al., 2018; Chojer et al., 2020). Further research efforts are necessary to understand the relationships between single point sensor accuracy (Rackes et al., 2018) and the whole network accuracy (Parkinson et al., 2019a).
3.2 Characterization of indoor air quality and thermal comfort
Monitoring air quality and thermal environment enable characterization of buildings performance, which is useful for management and benchmarking. Measurement with conventional methods and instruments can provide a temporal snapshot of building operation. Similar to the urban scale, limitations of conventional methods include cost, the time necessary to measure a large number of points in time and space (Parkinson et al., 2019a; Parkinson et al., 2019b), size and noise of equipment, and accessibility of sampling locations (Kumar et al., 2016). The low-cost IoT sensing has the potential to overcome some of these limitations and provide a longitudinal evaluation of building performance with refined spatio-temporal representation. Certification schemes offer credits for the implementation of continuous monitoring (RESET, 2022; WELL, 2022) and represent one of the key drivers of the widespread application of IoT sensing (Parkinson et al., 2019a; Parkinson et al., 2019b). The development of continuous monitoring guidelines for temporal and spatial sensing resolution has become one of the critical research priorities (Heinzerling et al., 2013; Parkinson et al., 2019b; Licina and Bhangar, 2019). At the moment the set of indicators required by standards is not covered by available IoT sensing platforms which present another area that needs development.
Some of the most used current indoor air quality continuous monitoring guidelines/standards are summarized in Table 1. These consider air pollutants that need to be measured, the accuracy of equipment, sensor placement, measurement time, and analytical tools. Guidelines summarized in Table 1 describe different approaches, data collection methodologies, instrument requirements, and various analytical performance indicators. The development of these guidelines is largely expert-based and usually not scientifically validated. Regarding sensor density and placement, several research studies explored sensing densities from ∼9 m2 up to ∼100 m2 per sensor (Ali et al., 2016; Pantelic et al., 2018a; Li et al., 2018; Parkinson et al., 2019b; Clements et al., 2019). Although some of these studies demonstrated significant spatial variation of measured parameters, their results cannot be used for the validation of existing continuous monitoring guidelines/standards due to significant differences in objectives and sensor placement methodologies. The failure of the well-mixed assumption in some environments (Pantelic and Tham, 2013) brings additional potential complexities to the sensor granularity and placement problem. Other location recommendations for example to place a sensor 1 m away from doors, windows, and diffusers are simply practice-based, and not grounded in research. The upscaling sensor deployment sensors have to be named systematically so that data collected in multiple buildings can be correctly understood and interpreted. Naming schemas are a critical aspect of integration and are addressed later in Section 5. Measurement frequency is another variable where the recommendation of 1 min or 10 min sampling frequency is not well-grounded in research. From the certification perspective as discussed earlier the current IoT technology cannot capture all relevant parameters. As a result, for proper characterization of the indoor environment, we still need to couple continuous monitoring with conventional industrial-hygienist practices like measuring individual VOCs. This also extends to the thermal environment and the necessity for the maturation of measurement technology. Considering the speed with which the industry adopts green building certification schemes and the impact they have on the built environment, the development of science-based validated building benchmarking should be made a top priority.
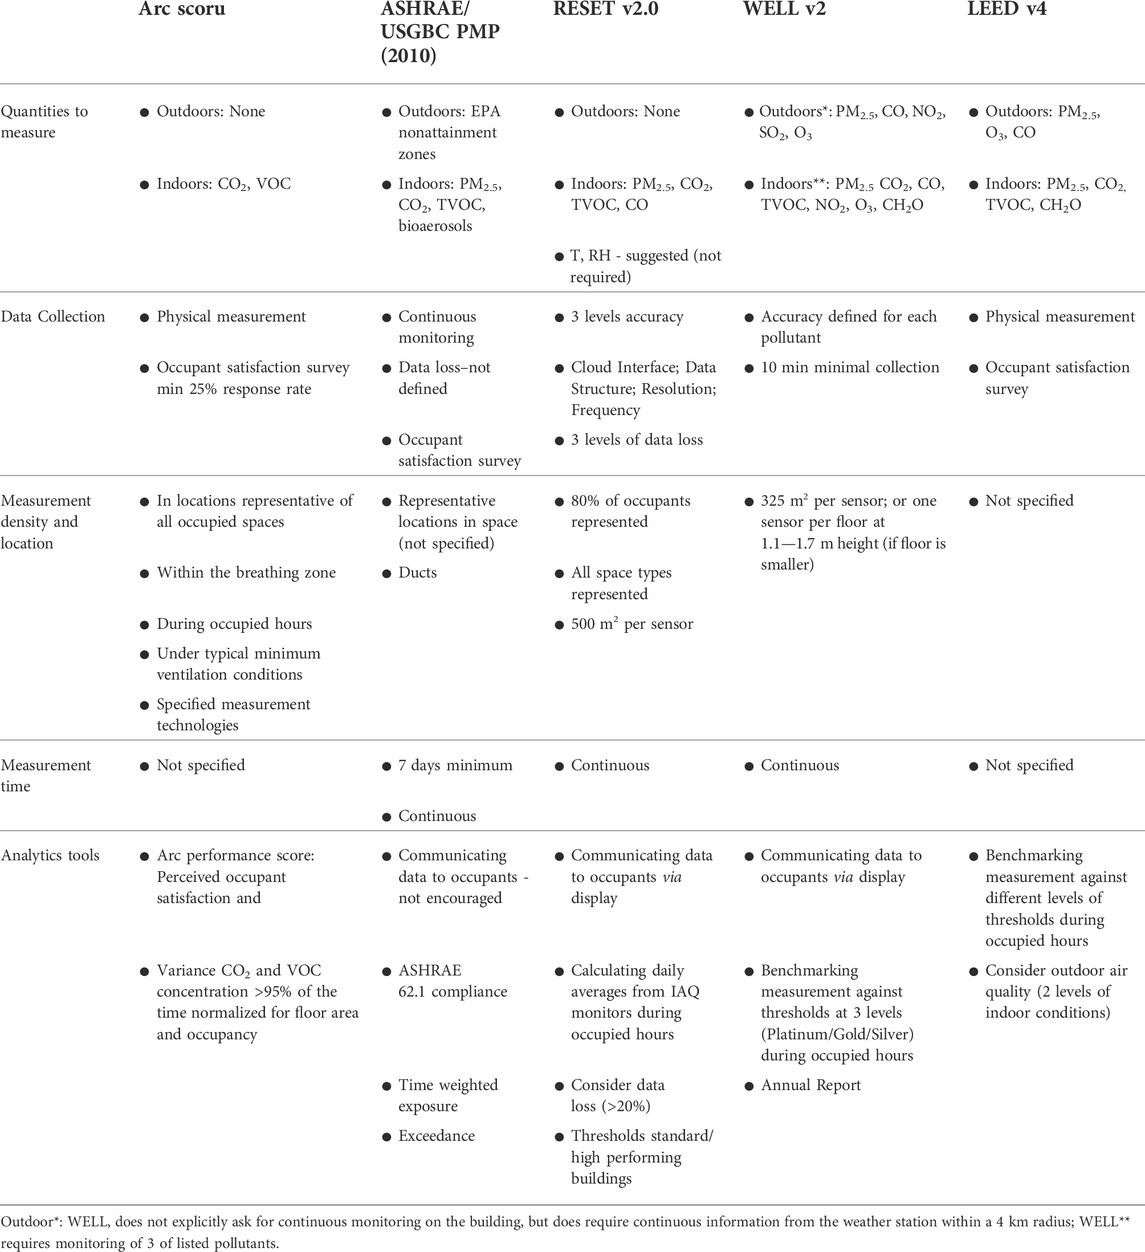
TABLE 1. Summary of guidelines/standards available for deployment of air quality sensors for continuous monitoring in buildings.
Thermal environment and thermal comfort studies that address the application of IoT sensing on the building scale can be classified into two groups. In the first group of studies, the objective of continuous monitoring of the thermal environment is to provide information as an input parameter to estimate thermal comfort (Parkinson et al., 2019b; Valinejadshoubi et al., 2021). Although the effectiveness of PMV/PPD models to estimate occupant satisfaction in the field using thermal environment measurement can be questioned (Cheung et al., 2019), this approach is used to assess building operation compliance with certification schemes and standards (Revel et al., 2014a; Parkinson et al., 2019b; Wang et al., 2019). The second group of studies surveys individuals alongside thermal environment monitoring to obtain assessments of thermal comfort and develop personal comfort models (Kim et al., 2018a; Kim et al., 2018b; Kim et al., 2019). Utilization of this approach demonstrated that personal comfort devices can increase occupants’ satisfaction by over 95% (Kim et al., 2019). The use of infrared thermography for real-time monitoring of personal thermal comfort (Revel et al., 2012; Revel et al., 2014b) represents another opportunity for human-centric assessments of comfort at the building scale, but so far has mainly relied on a single parameter (e.g., skin temperature) tracking of thermal environment and is yet to be integrated with comprehensive IoT thermal environment monitoring. Published studies point towards the development of personalized thermal comfort models, but actual use in the building operation of these models is still unclear. The combination of thermal environment mapping and survey of occupant satisfaction is an important research area that can improve the operation of existing and new buildings by providing optimal thermal comfort setpoints.
3.3 Proxy sensing
When several environmental parameters are measured in space and that information is used to infer knowledge about some other property or process, that can be considered proxy sensing or context-aware computing. Prior research suggests that humans have a unique environmental footprint, including CO2 (Persily and de Jonge, 2017), particulate matter and bioaerosols (Bhangar et al., 2016; Licina et al., 2016), various volatile organic compounds (Tang et al., 2016), as well as sound (Li et al., 1991; Sabatier and Ekimov, 2008), that can form a basis for the use of context-aware computing to detect occupants and their activities in the space. Occupants proxy sensing was explored using a combination of CO2, Lux, T and RH (Candanedo and Feldheim, 2016), passive infrared, TVOC, and CO2 (Pedersen et al., 2017), only CO2 (Dong et al., 2010; Jin et al., 2018b), CO2, energy consumption of lighting, and energy consumption of appliances (Ryu and Moon, 2016), CO2, RH, T and pressure (Chen et al., 2016), passive infrared, CO2 and RH (Han et al., 2012), PM2.5, PM10, T and RH (Jeon et al., 2018). The number of occupants in a building is an important parameter for understanding space utilization and energy use patterns. The presence of people can be measured directly with the surveys, based on radio frequency signals, passive infrared, ultrasonic, video cameras or global positioning information, Bluetooth, wireless local area network signals (Yang et al., 2016), but all these methods require significant labor and are usually very costly to perform, especially at the large scale. The use of proxy sensing with environmental IoT sensors has the potential to significantly reduce the cost of these processes. Besides the detection of the number of occupants in the space, Ghahramani et al. (2018) used environmental sensing to detect occupants’ workplace social interactions. The challenge remains to demonstrate that proxy detection of the number of occupants and type of social interactions can be generalized and upscaled.
4 IoT sensing applied at the human scale–Wearable IoT sensing
Unlike stationary IoT sensing which often aims to assess exposures of a population subgroup, wearable devices, i.e., smart electronic devices that can be worn or be integrated into clothing (i.e., standoff sensors), are at the heart of new capabilities that pervasive connectivity can bring at the human scale. Currently, various health- and fitness-oriented wearables are commercially available which can sense, store, and track the temporal variability in human activities (such as steps and locations) and biometric data (including heart rate, perspiration levels, and oxygen levels in the bloodstream). The potential of wearables in promoting positive health outcomes and enhancing human comfort and well-being is indisputable and scientific research has been able to evaluate and validate various wearable technologies. This section aims to review such applications in wearable IoT sensing, particularly focused on air pollution exposure, physiological monitoring, and thermal comfort.
4.1 Physiological and health monitoring
It is likely that the impending increase in air pollution and urban overheating in many cities around the globe will discourage outdoor physical activity and therefore impact the health of individuals (Chan and Ryan, 2009; Paulin and Hansel, 2016; Nazarian et al., 2021b; Romanello et al., 2021). Generic recommendations and guidelines have been developed to address these concerns, but given the fact that environmental health impacts vary greatly for individuals, the adoption of general guidelines often does not optimize the health and performance of every individual and even can at times induce negative health implications (Tan et al., 2015). As there is extensive variability intolerance to a given absolute level of stress, individual monitoring of physiological status has the potential to optimize health and performance (Piwek et al., 2016; Notley et al., 2019). The development of individualized guidelines for environmental health through IoT sensing at a human scale that accounts for intrinsic and extrinsic factors is envisaged.
In recent years, the use of smart devices is becoming more prevalent to provide users with personalized data for self-diagnosis and behavior alterations to optimize health and performance (Piwek et al., 2016). In occupational settings, smart devices can be used to monitor workers in real-time and therefore protect them from excessive heat strain (Notley et al., 2018), which is particularly useful for high-risk workers. These smart devices offer unprecedented opportunities to collect rich sources of data to guide interventional strategies.
While the proliferation of smart devices at times serves as motivational tools to initiate health and performance programs, accuracy can be lacking, and more importantly, there is an absence of validated models to translate the raw data to actionable advisory for the users. Dias and Paulo Silva Cunha (Dias and Cunha, 2018) reviewed important aspects of smart devices for health, listing the state-of-the-art wearable vital signs sensing technologies, including their system architectures and specifications. There are also a number of concerns about the safety, reliability, and security of using consumer wearables in healthcare (Piwek et al., 2016), which are similarly applicable to the use of wearables for environmental monitoring at the human scale. To this end, the Electronic Patient-Reported Outcome Consortium proposed a framework by listing a set of recommendations in relation to the selection of and evidentiary considerations for wearable devices to ensure adequate precision, accuracy, and reliability of data collected (Byrom et al., 2018), which to date are not widely used in wearable environmental sensing.
Prospectively, as smart devices become more accurate, more sophisticated modeling techniques will also be harnessed. For example, an artificial intelligence platform solely based on patient data is used to prospectively guide drug dosage to the patient with prostate cancer, resulting in durable response and no disease progression (Pantuck et al., 2018). Instead of using population-based algorithms, this platform only harnesses data from the individual of interest to enable small data set-driven optimization. This could be particularly amenable to human performance and health optimization, considering the fact that human responses to a given stressor are varied. In addition, the profile of an individual is expected to shift during the course of time. The ability to dynamically modulate inputs to affect optimal outcomes therefore will drive a powerful and unique ability to truly personalize health and performance in a sustained manner.
4.2 Wearable sensors for air quality
Direct assessment of personal level exposure accounting for the dynamic nature of human activities has been identified as a central area in air pollutant exposure research (Steinle et al., 2013; Health Effects Institute, 2015; Marć et al., 2015; Borghi et al., 2017; Spinelle et al., 2017). Portable air quality monitors with local data storage have been previously used in air quality studies to quantify individual exposures (Steinle et al., 2013; Marć et al., 2015; Borghi et al., 2017; Spinelle et al., 2017). The use of portable air monitors with local data storage is associated with a limited number of study participants, laborious manual work, frequent data download, cataloging, and keeping of activity diaries which prevents real-time use of the data (Steinle et al., 2013; Marć et al., 2015; Borghi et al., 2017; Spinelle et al., 2017). On the contrary, wearable IoT sensors represent the progression of technology for personal exposure estimation and offer a promise for automation of environmental data collection, simultaneous GPS tracking (Predić et al., 2013; Antonić et al., 2014; Wong et al., 2014; Zhuang et al., 2015; Tian et al., 2016; Zhang et al., 2017; Yang et al., 2018), and upscaling to citizen scientist data collection strategies (Piedrahita et al., 2014; Nikzad et al., 2012; Jerrett et al., 2017; von Schneidemesser et al., 2019). Improvements in personal exposure assessment were suggested by combining (wearable/portable) behavioral sensors with wearable sensors that capture environmental and biometric data (Fletcher et al., 2014; Hu et al., 2014) as illustrated in Figure 1. A recent survey of occupant needs rated wearable PM2.5 sensors just behind wearable air cleaners (Wang et al., 2021) indicating an increase in population awareness of the importance of environmental impacts on health.
There has been significant development of wearable IoT environmental sensors in recent years. Deng et al. (2016) developed a portable wireless VOC sensing kit and demonstrated its application for measuring personal exposure. Zhang et al. (2017) show the application of wearable IoT sensors for PM2.5 monitoring integrated with location and temperature data and demonstrated how they can be used for IAQ mapping of underground stations. Hojaiji et al. (2017) develop wireless wearable PM and N2 sensors for personal exposure measurement. Xu et al. (2019) developed a wearable PM2.5 sensor and demonstrated how crowdsourcing can be used to detect large variations of air pollution in the city. Zhong et al. (2020) used wearable CO2 sensors for monitoring and forecasting the indoor environment. Cureau et al. (2022) developed and implemented a wearable wi-fi connected system for mapping urban environments from the pedestrian’s perspective as an aid to city planners. Kane et al. (2022) developed wearable IoT PM sensors for personal exposure measurement and modification of people’s behavior based on the results of communication. Kortoçi et al. (2022) showed how wearable air quality monitors provide insights into personal pollution exposure and the micro-climates of the city measuring PM, CO, NO2, and O3. Besides insight into personal exposure through crowdsourcing wearable air quality sensors is a useful tool in mapping air pollution hot spots on the urban scale (Buehler et al., 2021; Hernández-Gordillo et al., 2021; Cureau et al., 2022).
In a recent systematic review of the environmental monitoring with the wearable sensor application, Salamone et al. (2021) included 39 papers that address air quality monitoring among them 5 addressed wearable IoT sensors and pointed out that air quality monitoring calibration is an issue and not often reported. Hernández-Gordillo et al. (2021) reviewed recent advancements in low-cost IoT wearable sensors and pointed out that sensors still have challenges related to sensitivity, selectivity, measurement accuracy, and drift. Authors also concluded that further development of models for data processing in addition to lack of community engagement is the challenge to overcome. Abboushi et al. (2022) reviewed the use of wearable devices for studying the connection between personal exposure and health and reported issues related to missing data points, data resolution, and measurement of a limited number of pollutants. Narayana et al. (2022) reviewed state-of-the-art low-cost IoT environmental sensing and concluded that sensing quality is still an issue and proposed a framework for enhancing data reliability. To address issues related to wearable low-cost IoT sensor drift due to sensitivity to environmental conditions Buehler et al. (2021) an online calibration method. Wearable devices with sensors for real-time gas-phase air pollutants measurement have issues with calibration (Cao and Thompson, 2016).
Wearable air quality IoT sensors are still facing significant challenges in application. The accurate positioning on humans that can capture true exposures still remains a research question. Human micro-environment concentrations are influenced by chemical and particle emissions from skin oils, clothing, cosmetics, and exhalation (Rim et al., 2009; Licina et al., 2017; Licina et al., 2019). These local emissions create a cloud of TVOC, CO2, and particles (Pantelic et al., 2020) that can affect the readings of other air pollution sensors (Maag et al., 2018). For air pollutants coming from exhaled breath, determining accurate sensor location is the key open challenge. For instance, when personal exposure to CO2 was estimated with sensors worn around the neck, results showed that exhaled CO2 from some of the users directly impacts sensor reading, which led to a personal exposure overestimation (Ghahramani et al., 2019a).
Wearable IoT air quality sensors offer great potential for determining and potentially mitigating personal air pollutant exposures, and through crowdsourcing, increasing spatio-temporal air pollution mapping on building and urban scales. To be successfully implemented, they require further development on the hardware side to improve sensing accuracy, an array of pollutants they can measure, size, and battery life. On the application side, determining a wearable sensing location on a person that best represents personal inhalation exposure at the minimal level of physical intrusiveness represents a key open research question. Wearable air quality sensors have not reached measurement accuracy and non-intrusiveness levels that would enable their massive deployment and ultimately, refinement of personal exposure models.
4.3 Wearables for thermal comfort prediction
Unlike the air quality measurements in the built environment, thermal comfort is highly subjective and greatly depends on the individual’s physiology and psychology. Conventional methods of thermal comfort assessment, however, are often either based on the thermal physical models of the environment or focused on the physiological, behavioral, and psychological factors that form the individual’s thermal comfort perception (Rupp et al., 2015). To address this shortcoming, wearable technologies have introduced a more comprehensive perspective of thermal comfort in the past few years by combining environmental measurements with physiological and behavioral assessments. A combination of these factors leads to personal thermal exposure assessments, aiming to determine how different individuals and subpopulations not only experience different heat exposures but also experience different levels of discomfort, physiological strain, or psychological stress when subjected to the same thermal environments (Nazarian and Lee, 2021). For instance, wearable sensing of skin is proposed, as human skin is considered the mediator between the environment and the human body, and therefore, skin temperature and conductance play a major role in thermoregulatory processes involved in thermal comfort and heat stress (Zhang et al., 2010; Takada et al., 2013; Dai et al., 2017). Studies such as Sim et al. (2016) showed that wrist skin temperatures can be used to predict whole-body thermal sensation. Additionally, several recent studies have identified the potential of heart rate and heart rate variability data to indicate thermal sensation in the built environment (Buller et al., 2013). This, in addition to the advancement of ubiquitous sensing and IoT in the built environment domain, has opened new doors for the use of wearables in thermal comfort assessments. A range of wearable solutions, either for activity (fitness) or health-tracking, has gained traction in the market and is enabling a shift in approaches presented in thermal comfort assessment and physiological assessments.
Wearable technologies represent a range of opportunities for comfort and health assessments in the built environment. The most prominent opportunity, perhaps, is to approach thermal comfort analysis as “human-centric” as opposed to “one-size-fits-all” by adding behavioral and physiological components. Incorporating an integrated monitoring approach to thermal exposure, physiological and behavioral parameters can be recorded alongside environmental conditions, providing opportunities for detection of heat impact as well as personalized comfort classification (Jayathissa et al., 2019; Nazarian et al., 2021b). Additionally, wearables travel with the individuals in the realistic exposure scenarios, and therefore, data collected by wearables combined with the GPS data can provide the spatiotemporal distribution of environmental parameters as well as the ways in which individuals respond to that environment. Nonetheless, the use of wearable solutions for thermal comfort is an emerging field, and only a handful of studies propose wearable solutions for thermal comfort assessments (Nakayoshi et al., 2015; Hasan et al., 2016; Moatassem et al., 2016; Liu et al., 2018; Salamone et al., 2018; Ojha et al., 2019). Among these, Nakayoshi et al. (2015) represented the most comprehensive measurements of thermal comfort, incorporating all the relevant thermal variables, including environmental parameters (air temperature, relative humidity, wind speed, and MRT) in the proximity of a human body, physiological measurements (such as heart rate and skin temperature), and subjective feedback, which found a correlation between skin temperature and thermal comfort index (SET) with dependencies on gender. The unique wearable system that was developed in this study involved five sensing units that were all worn by the participants in multiple locations: hat, belt, hand, and forehead skin and carried in a small sash. However, this methodology, although comprehensive for research purposes, is considered impractical for implementation in real-life applications and limits the scalability of IoT sensing. Other studies further relied on a combination of fixed and wearable sensors to enhance feasibility. Studies for example, combined wearable devices for skin and heart rate monitoring with fixed indoor sensing to evaluate the distinction between different users in an indoor building space (Moatassem et al., 2016; Chaudhuri et al., 2018; Salamone et al., 2018). Lopez et al. (2018) further developed a neck-mounted wearable thermo-conditioning system that directly cools or warms the human body based on the estimation of the user’s thermal sensation by biological information (such as real-time heart rate interbeat interval recorded at the earlobe). However, the efficacy of this method is not validated and is similarly facing challenges in application.
The interest in wearable solutions for thermal comfort in the built environment has grown massively, but the challenges are still manifold. As noted in several examples, scalability presents one of the main limitations. To date, the deployment of wearable technologies is done for a limited number of participants under the supervised experimental setting due to the challenges in design and performance. The limitation on the ease of use (such that participants are willing to wear the devices for an extended amount of time), reliability, and robustness under the dynamic conditions of use and data communication restrictions significantly contribute to the scalability challenge. Additionally, although the costs of wearables are lower than standard references for thermal comfort assessment, they are still significantly high compared to other IoT monitoring solutions and cannot be regarded as “low-cost” sensing. In addition to the challenges of scalability, many critical research questions still hold: There is an urgent need to assess the wearable devices developed in the commercial market to ensure that they provide accurate physiological, environmental, and behavioral parameters for thermal comfort assessment. This involves quantifying the biases associated with individual sensing as opposed to fixed/portable IoT environmental sensors. Additionally, in the absence of universal heat indices for personal exposure (Notley et al., 2019), it is crucial that future research assess the best way to describe the personalized data obtained from wearables in a comprehensive and consistent way. Accordingly, in addition to more progress on sensor solutions for monitoring personal exposure and comfort, there is a need for a quantitative specification of the performance of wearable devices with respect to thermal comfort.
5 Challenges of multi-scale and interdisciplinary IoT
This paper has covered studies focused on the use of IoT for thermal comfort and air quality at three scales: urban, building, and human levels. The value achieved in each of these scales through the use of IoT is maturing, yet important practical challenges persist that impede the maximization of its potential through the convergence of data from the three domains. This section outlines the major barriers to the research and industrial application of IoT for addressing human thermal comfort and air quality issues at the urban, building, and human scales. The consistent theme that was found in the literature was the lack of interoperability and communication between various systems, industry stakeholders, and research cultures.
5.1 Data silos
The literature shows that IoT data sources are commonly found in various self-contained systems that collect, process, and visualize the collected, continuous IoT streams for specific purposes (Tang et al., 2019). The lack of data integration and interoperability in the United States building industry has shown to cost up $15.8 billion per year (Gallaher et al., 2004). There are several examples in the literature of manual data convergence after data collection (Monnot et al., 2016b; Wilhelm et al., 2016; Benita et al., 2019; Ojha et al., 2019), but only a handful of studies used a combination of multi-scale sensing in an integrated manner (Pantelic et al., 2019; Jayathissa et al., 2020; Luo et al., 2021; Miller et al., 2021). Pantelic et al. (2019) and Luo et al. (2021) used indoor and outdoor air quality data measured with devices from different vendors stored in separate databases. The outdoor dataset stored in one database had a machine learning-based real-time correction factor applied while indoor sensors did not. Since inputs from both sensors were required for the calculation of performance indicators authors had to use a set of sensors placed next to each other to obtain correction factors necessary for the meaningful comparison. The necessity to provide correction factors as a part of data integration represents a significant challenge in upscaling even for the same type of data. The isolated or self-contained nature of these data sets results from fragmented implementations of IoT solutions from different vendors and stakeholders that create parallel, independent databases of data.
Jayathissa et al. (2020) developed and method to converge Micro Ecological Momentary Assessment of thermal comfort with environmental IoT sensing. The convergence of these two data silos creates opportunities for the development of personal comfort models. Miller et al. (2021) developed a data convergence platform that combines momentarily thermal comfort assessment with Cozie Fitbit smartwatch, environmental data collection with outdoor and indoor IoT sensing network, and location data collection using Bluetooth technology mapped spatially and temporally to Building Information Model. Predicting which building zones would best fit a particular individual based on data inputs suggested by Miller et al. (2021) required significant effort to overcome data silos and integration issues. Although papers by Jayathissa et al. (2020) and Miller et al. (2021) represent significant steps towards the development of personal thermal comfort models both studies are experimental and use enrolment of a controlled number of participants. Scalability to a large population and the necessity to dynamically respond to changes in data collection are still work in progress.
5.2 Technology and industry silos
The primary reason data silos occur in the IoT domain is the lack of incentive for industry players to create solutions that emphasize data exchange and interoperability (Gallaher et al., 2004; Shen et al., 2010; Costa et al., 2013). The various stakeholders at each scale (urban designers, building architects, engineers and operations, and individual consumers) are not demanding solutions that require the convergence of data, mostly because these markets do not exist yet. Industry silos are well depicted in the design of natural and hybrid ventilated buildings where although government-owned and operated ambient air quality stations are distributed across the whole United States, a review of the pollution patterns based on those measurements is not considered, while values for indoor air quality are defined but monitoring is not required (ASHRAE Design Guide for Natural Ventilation).
A good example is the building management system (BMS) industry. Each modern commercial building with a BMS system is essentially containing an IoT system that could be a source of environmental sensor data that could enhance the data from other scales and applications (Miller et al., 2021). The interplay between lack of standardized naming schema (Quinn and McArthur, 2021) that allows making sense of the data by other machines and/or humans and any guidelines for strategic sensor placement that would generate meaningful data (Balaji et al., 2018; Wang et al., 2018; Quinn et al., 2020). This situation is increased further with the ubiquitous deployment of sensors beyond traditional BMS. The lack of unified meta-modeling schemas results in huge amounts of IoT data available, but with a limited practical overlap of use due to interoperability problems (Balaji et al., 2018; Wang et al., 2018; Quinn et al., 2020).
5.3 Research silos
Reviews of IoT implementation exclusively address urban scale (Kumar et al., 2015; Morawska et al., 2018), building scale (Kumar et al., 2016; Schieweck et al., 2018), or personal scale (Mamun and Yuce, 2019). We located only two research papers Pantelic et al. (2019) and Luo et al. (2021) that address the application of IoT environmental sensing on multiple scales simultaneously. This suggests that the current research landscape fosters traditional delineation between urban, building, and personal scales as separate research fields with marginal attempts to perform research across scales. This is an interdisciplinary field comprising of environmental, building, communication, and artificial intelligence scientists. Research communities use diverse methodologies, and experimental approaches, rank the importance of factors differently and have their own set of conferences and journal outlets as well as cultures for publication. From a technical perspective IoT environmental sensing has its foundation in computer science and electrical/electronic engineering disciplines that value conference publications hosted by the Association for Computing Machinery (ACM), where a majority of the technical innovation from the hardware, software and data science aspects of wide-scale IoT deployment is made. The conventional built environment, engineering, and air quality domains, on the other hand, value journal publications and often do not put the same emphasis on conference publications. Additionally, urban scale and building scale phenomena is kept separate by addressing exclusively ambient air quality as an environmental problem and indoor air quality referring to air inside the buildings as an engineering problem. This difference creates a gap between these categories of research that impedes the progress of interdisciplinary innovation.
5.4 Privacy, security, and liability
One may imagine that full-scale IoT integration and alignment could occur by breaking down the silos. This convergence would create a plethora of opportunities to solve major problems related to air quality, human health, and the other benefits that are discussed in this paper. For example, having the building management system understand the metabolism and activity level of its occupants using wearable devices would highly improve the ability of that building to provide thermal comfort. However, these converged data can also be used in ways that are not in the best interests of the humans involved (Atlam and Wills, 2020; Tawalbeh et al., 2020). As these scales become increasingly interconnected, challenges will increase around data ownership, data storage, access, privacy protection, and security. This ongoing digitalization must be performed with strong security and privacy guarantees that permit occupants to trust the new features and services that smart buildings offer to them. Furthermore, an important question arising from this is whether access to the new information created by these convergences produces liability to act on the part of governments and companies. The present legal and institutional laws do not create liability for municipalities, building owners, and managers. Any future changes towards increased liability will need to be accompanied by additional guidance.
5.5 Human-data interaction
People become aware of pollutants in the air when concentration levels go beyond the odor thresholds (Wolkoff, 1998; Wolkoff and Nielsen, 2001). Considering that people do not have great sensitivity to air pollution detection meaningful communication about ambient and indoor air quality represents an important tool that will help people to modify behavior and reduce their exposure (Wargocki and Da Silva, 2015). With the increased spatial and temporal granularity of air quality information, IoT sensing enables real-time data communication.
On an urban scale, air quality information is communicated to occupants using Air Quality Index (AQI) connects air pollution and health (Plaia and Ruggieri, 2011). A traditional approach to the relationship between building scale data and stakeholders was to silo them apart to avoid any potential occupant’s concerns and complaints (ASHRAE, 2010). ASHRAE Standard 62 (Castell et al., 2015) does not address the communication of building indoor air quality and thermal comfort information to occupants. Recently develop measurement protocols WELL (Manikonda et al., 2016) and RESET (RESET, 2022) suggest communicating data to occupants but they do not specify how. A dashboard’s objective is to convert measured data into meaningful information for stakeholders (Marini, 2011). To be effective dashboard design have to match specific users (Marini, 2011; Petersen et al., 2017). An environmental dashboard designed for community education and awareness resulted in community-level energy and water savings (Petersen et al., 2017). A dashboard designed for building managers enables them to effectively detect malfunction and save energy, but the same dashboard (Timm and Deal, 2016) had an insignificant impact on occupants’ energy-related behavior (Timm and Deal, 2016). A properly designed dashboard can be a critical tool in exposure reduction, but there is a lack of research that connect dashboard design and targeted group behavior modification. With the increased data volume, effective communication with the stakeholders is an essential question that requires further research.
6 Opportunities of multi-scale and interdisciplinary IoT
6.1 Data convergence technologies
To address the data silo issue, there are several key technological research directions that can work towards breaking down these silos. The integration of these data streams from each scale and domain is often first approached through segmentation and clustering techniques that seek to group similar behavior based on the values of the sensor readings (temporal) and the location in which the reading was taken (spatial). This type of effort is exemplified in a previously discussed Singaporean study of 50,000 students carrying IoT environmental and personal fitness devices meant to segment behavior related to activity, transport and environmental exposure patterns (Wilhelm et al., 2016). These segmented data insights were applied to other studies focused on air-conditioning (human-building data convergence) (Happle et al., 2017), routing (human-urban) (Monnot et al., 2017), and emotional well-being (Monnot et al., 2017; Benita et al., 2019). Another key study focused on the collection of various types of wearable sensors to study the influence of the urban setting on a physiological response (Blanco-Novoa et al., 2018). Both studies included a series of unsupervised machine learning steps that focused on dividing the data into spatio-temporal regions for the purpose of human understanding and interpretation. The methods created in these studies essentially seek to find the overlap between the human-building-urban scales.
Theoretically, individualized wearable data (human), the BMS (building) and city-scale environmental air quality (urban) sensors could be connected through a process of tagging convergence using these techniques as well. Metadata tagging could also start fixing information related to the spatial aspects of the IoT sensors. These systems would automatically identify data schema/model and metadata to provide context to data collection (physical installation information, orientation, nearest relevant building features like windows, ventilation diffusers, occupant(s). From this effort, projects such as the BRICK schema have emerged (Balaji et al., 2018). BRICK allows for a consistent framework for IoT metadata tagging that enables the preservation of point hierarchies and relationships between points. The aptly named Mortar platform integrates with BRICK to test various types of analytics approaches such as automated fault detection and diagnostics (Fierro et al., 2018). The Plaster platform rounds out the stack is an open-source platform for testing various IoT metadata classification strategies (Koh et al., 2018). The BRICK schema continues to be developed to incorporate new types of data including occupants (Chamari et al., 2022; Luo et al., 2022) and building information models (BIM). There are also crucial discussion forming around the convergence of BIM and geographic information systems (GIS) (Zhu and Wu, 2022). The air quality field has also attempted to standardize the terminology of levels of data processing for various scales of implementation (Schneider et al., 2019). Portability, reproducibility, and generalizability can all be used to describe efforts in this direction. These descriptors will only be possible once the IoT networks from the various sources outlined here are well-organized, consolidated and scalable. The development of these type of data standards are promoting the scalability and usability of the data from the larger building stock.
An example of converged use of multiscale data was demonstrated in Pantelic et al. (2019) during the episodes of wildfire air pollution where IoT environmental sensing had a crucial role in characterizing building resilience or determining natural ventilation potential and utilization (Luo et al., 2021). With the increase in global air pollution and associated negative impacts on health (Silva et al., 2017) ubiquitous sensing offers a unique opportunity to better design and operate building enclosures, especially in naturally ventilated or mix-mode buildings—a topic largely unexplored to date.
6.2 Catalysts for market change
Disruptive and transformational technology like IoT environmental sensing requires catalysts to propel market transformation. Policies can serve as necessary catalysts. For example, the State of California has legislated Wildfire Smoke Clean Air Centers for Vulnerable Populations (Legislature, 2020), and Seattle, Washington instituted clean air shelters. Quantification that buildings actually operate as clean air shelters is necessary, where continuous monitoring enabled with IoT sensing offers a transition from qualitative to quantitative. Certification schemes summarized in Table 1 award points for implementation of IoT-based continuous monitoring to characterize building operation. Alongside additional points, IoT-based continuous monitoring could become a cost-effective performance evaluation solution that can replace the current sporadic, complex and expensive evaluations by a certified assessor. These two benefits acting in synergy represent another market catalyst.
6.3 Interdisciplinary scientific research opportunities
Research domains can improve their analysis of different scales through interdisciplinary research in terms of laboratories, departments, conferences, and other key dissemination venues. From the technical perspective, one of the key immediate research opportunities across all scales includes standardization of sensor accuracy, interoperability, testing protocols, and data quality. This innovation is especially necessary for TVOC sensors where both accuracy and calibration require standardization and particulate matter sensors where differences between laboratory and field calibration need to be addressed. Another important multidisciplinary research opportunity includes the validation of guidelines for sampling and analytics of human-related metrics across the three scales. The current absence of evidence-based guidelines for sampling and analytics of human-related metrics (e.g., thermal comfort, exposure, health, and productivity) across the three scales impedes the successful adoption of IoT technologies. The emerging guidelines for building IoT sensing (e.g., RESET, WELL v2) would benefit from the establishment of the performance metrics and from the ability to convert data into simple indicators that can be optimized for human exposures and experiences. A significant challenge to bringing these opportunities to realization is the lack of research grants opportunities that will focus on the value of interdisciplinary problems and the incentive structure of academic careers. With the industry moving at a faster pace than scientific evidence, these domains are risking creating a situation where the implementation of this technology will not realize its full potential.
6.4 Seeking consent from individuals and privacy technologies
One of the key questions is how data created by these different scales is going to interface with the humans that create them. There is much risk abatement and security that can be gained from large-scale urban sensing, but the opposite can also be true when unintended applications are derivations that create risks from the data sources. Just as no one envisions the apps that exist on smartphones today, no one realized the risks of surveillance from ubiquitous smartphone cameras. But just as with smartphones, IoT and being able to distribute it to continuous sensing will have benefits that far outweigh the risks that address health, energy security, social well-being and happiness. A solution for the integration of various scales of data includes the development of technologies and privacy standards that give users the choice as to what part of their data can be used for which purposes. The COVID-19 crisis is a great example of a situation in which the convergence of various data sources from IoT could assist in the ability to mitigate the spread of the disease and the privacy tolerances of people who provide those data are changed due to the potential impact those data convergences could have.
6.5 Data visualization and human-in-the-loop interactive technologies
In order for cities, buildings, and humans to make informed decisions based on shared information–they need to achieve more advanced means of communication with each other. Air quality information is challenging to interpret (Kovalerchuk et al.) considering that it consist of real time multidimensional matrix (e.g., CO, NOx, SOx, PMx). Besides multidimensional matrix of pollutants, citizens cannot rely on thier experience because unhealthy tresholds defined by air quality standards might not be detected by olfactory systems (Wolkoff 1998; Wolkoff and Nielsen 2001). To make this complx decisin making problem easier for citizens to understand and ultimately adjust their bahavior to reduce exposure, traditional way to inform the public about the ambient or urban scale air pollution is through using air pollution indexes like the Pollution Standard Index (PSI), Air Quality Indexes (AQI) by EPA or revised AQI (RAQI) (Plaia and Ruggieri 2011). AQI, for example, converts the measured level of a single air pollutant (e.g. PM2.5) into an index from 0 to 500, and based on the value of the index air quality is assigned to one of six categories that range from “Good” to “Harmful.” For different levels of citizen’s sensitivity to air pollution and for each categorey AQI would recomend certain behavior (e.g., people with lung problems should stay at home and close to windows). Due to the limited number of measurement stations, large areas on the urban scale would be described with the single number.
Visual analytics is an important component for humans to make decisions based on the data generated. Several visual analytics paradigms are available with the most popular giving guidance on how the data are presented (Schneider et al., 2019). Air quality informtion presented on a map is effective way to communicate air pollution information (Zhou et al., 2016) especially comparing to the tables with numbers (Chen 2019). An interactive web-based geo-visual analytics platform with Coordinated Multiple Views were expored for air quality visualization using geographical map, a linear timeline, a heatmap, and adjacent small multiples maps representing changes associated with timestamps (Wu et al., 2020). Several geo-visual analytics based city dashboards were compared in Jing et al. (2019) with a focus on users observation of spatio and temporal changes, but not if presented information lead to bahavioral changes that caused reduction of exposure. Bachechi et al. (Kovalerchuk et al.) reviewd 6 air quality platforms across eight features and showed that only two fo those platforms actually suggest actionable items general public can perform to reduce exposure. Effective communication of data collected through environmental sensing is especially important for air quality, as our olfactory systems cannot detect all air pollutants. A number of dashboards were studies in Jing et al. (2019) classified into operational, analytical and strategical dashboards from the perspective of air quality information presentation and forecasting. Althoug displac of the air quality information can be public, intended stakeholders can be city planners, regulatory bodies, or citizens. It is very important to understand who will be the users and what is the intended outcome of tthe use. If general public needs to consume information presented on the dashboard it is important to present that information in a way useful for citizens. A recent study analyzed whether people noticed or used dashboards in the first place and what attributes contribute to a higher probability of human interaction (Granderson et al., 2011).
Several methodologies have surfaced in recent years from the visual analytics community focused on the user testing of building performance dashboards. Benchmarking against the thresholds, visualizing quantities as contour (heat) maps and dashboards.
IAQ visualization with occupants text message notification resulted in improved understanding of occpants understanding of IAQ in their homes (Moore et al., 2018). Kim and Li (2020) proposed a new conceptual framework to increase IAQ awarness, and understanding of the received information that can potentially result in meaningful actions. Kim et al. (2020) designed a child-friendly interface prototypes for IAQ visualization. In the follow-up study Kim et al. (2019) reported that children assess IAQ through a sense of smell, visual cleanliness, and thermal comfort and that these aspects need to be incorporated in the visualization tool to be effective, that were incorporated in AirBuddy, app for indoor and outdoor air quality visualization (Kim et al., 2022). Kim and Paulos (2010) and Kim et al. (2013) developed IAQ visualization tool that enabled IAQ awareness increase and promoted changes in occupant behaviour that resulted in reduction of their exposure. This work showed potential that beyond increasing awareness and understanding IAQ visualization can lead to people’s behavioural changes and reduction of exposure. Some recent advancments utilized Virtual Reality to visualize IAQ (Natephra et al., 2019). Literature review of IAQ visualization proposed a framework that allows the definition of needs, assets, and appropriate tools for visualization for virus risk monitoring (Niedrite et al., 2022).
The last component of this human-system interaction is the ability of humans to give their subjective feedback information for various purposes. In the thermal comfort studies, in particular, it is well-understood that purely environmental or physiological approaches are not fully equipped for characterizing comfort conditions in urban spaces and an understanding of the dynamic “human parameter” (including the psychological adaptation, cultural and climatic history, environmental stimulation and expectations) is necessary for determining the comfort implications for the people (Nikolopoulou et al., 2001; Porter et al., 2004). However, the collection and analysis of subjective feedback is typically a tedious or expensive task. Accordingly, the integration of the momentary assessment with IoT techniques could revolutionize how the data in the built environment is tagged with information generated by occupants. Smartphone and smartwatch apps can be leveraged to create ecological momentary assessments that prompt a user to provide instantaneous feedback in an elegant and least-intrusive way (Moskowitz and Young, 2006; Jayathissa et al., 2020; Sae-Zhang et al., 2020; Quintana et al., 2021; Abdelrahman et al., 2022). An example of wearable devices that can be leveraged to create ecological momentary assessments that prompt a user to provide instantaneous feedback in an elegant way (Moskowitz and Young, 2006; Sae-Zhang et al., 2020; Quintana et al., 2021; Abdelrahman et al., 2022). An example of using smartphone apps is discussed by Liu et al. (2018) where subjects are prompted by their cell phone (through a text reminder) to take an online survey and report their “right now” thermal comfort as often as possible.
7 Discussion
The current review covers the implementation of IoT environmental sensing on urban, building, and personal scales from the data convergence point. We have identified scientific and engineering advancements and challenges on each scale and between the scales. The state-of-the-art knowledge, current gaps, and necessary research directions are below. The results are summarizes in Table 2.
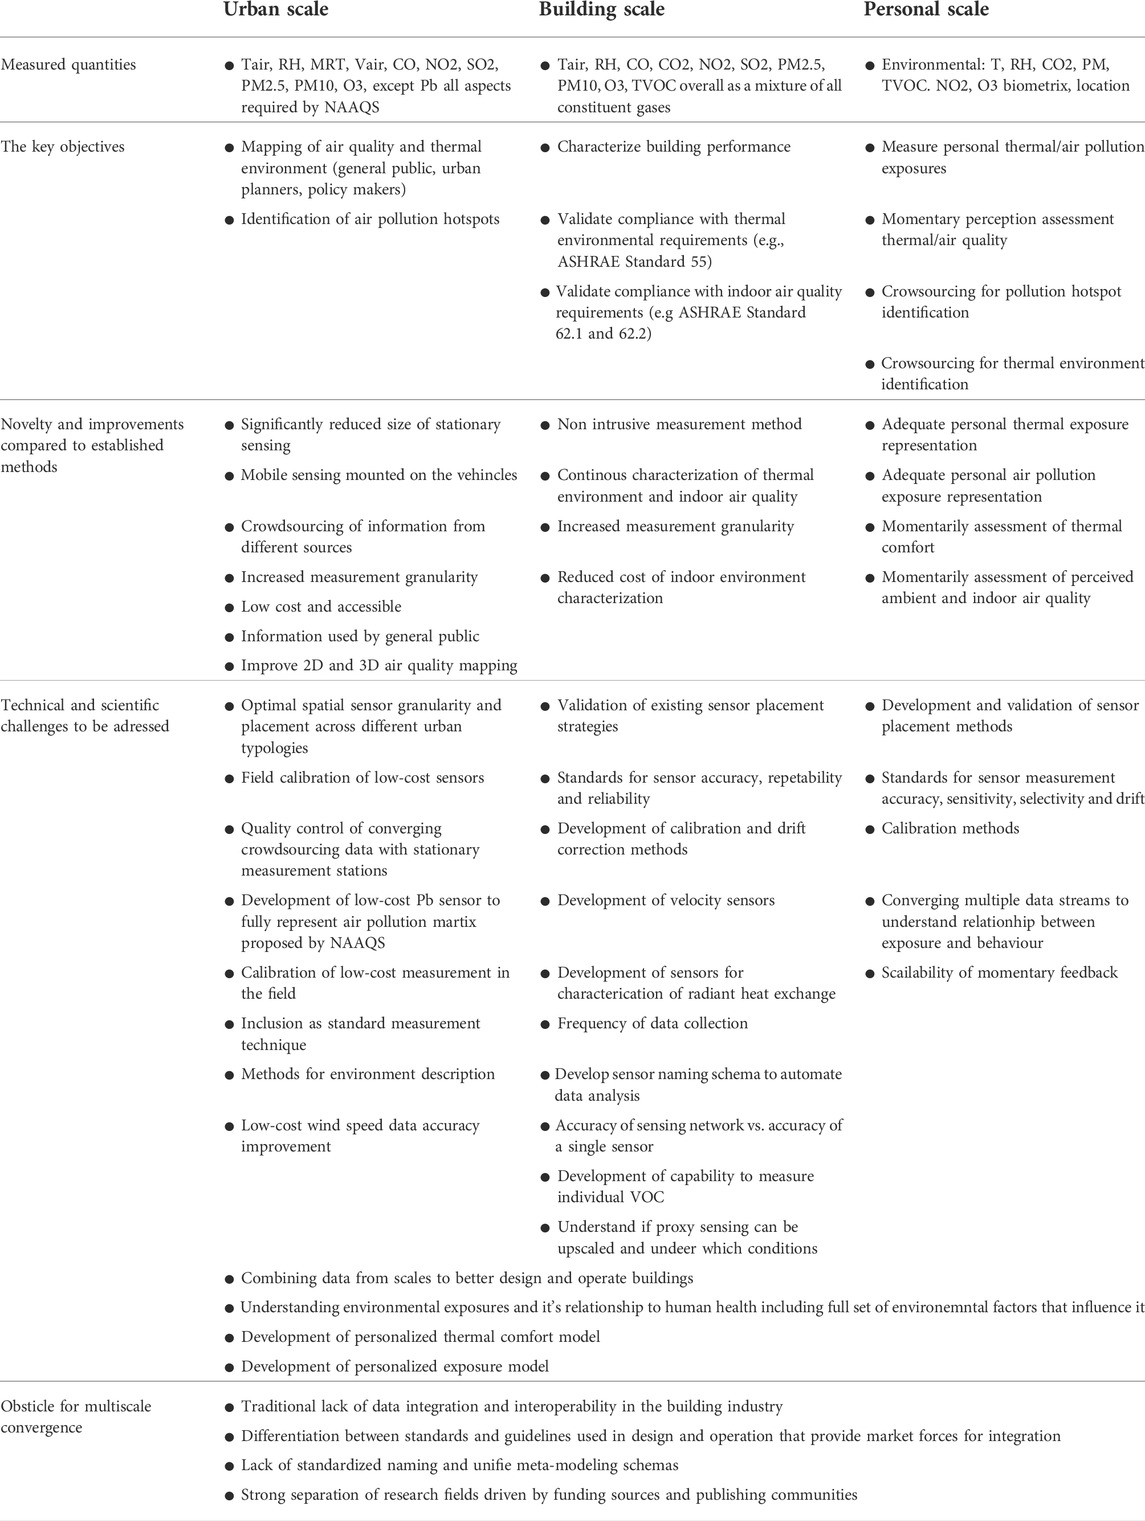
TABLE 2. Summary of the key review findings.
There are several commonplace issues for each scale. On all three scales, there is a need to develop guidelines on what to measure, where and with what density to place sensors, how frequently we need to collect data, what is required accuracy, and how to utilize the collected dataset to consider data convergence. On urban and building scales, several air pollution and themral enviroment sensors have reached acceptable performance, sensors for some of the sensors needs to be develop to capture a sufficient number of air pollution indicators and some air pollution sensir require accuracy and reliability improvements. IoT sensors for thermal environment characterization need the development of capabilities to measure air velocity and radiant aspects of heat exchange at a large scale and at a low cost. All the listed developments are necessary to advance and upscale adoptation of this new technology.
Urban scale air quality and thermal environment management through IoT sensing is a promising line of research and innovation. Recent advances in IoT sensing and information technologies offer an opportunity to create insights from many urban environmental measurements at reduced cost and effort. On an urban scale, stationary and mobile sensors (vehicles, smartphones, portable, wearable) are used to characterize the environment. Presently, worldwide legislation linking urban air pollution and heat levels, population exposures, and health outcomes do not sufficiently consider data collected by low-cost IoT sensors. To be incorporated into existing guidelines for urban climate characterization and ultimately legislation, it is necessary to set the right set of indicators which is supported by optimal monitoring guidelines that contain information about what/how to measure, how often, and where, and minimal data quality standards as well as how to utilize the acquired dataset.
Building scale IoT sensing is gaining traction through requirements of building certification schemes. The low-cost IAQ sensors need development to capture air pollutants of concern (e.g., individual VOCs, formaldehyde, ultrafine particles, various inorganic gases, etc.). The development of indexes for building benchmarking considering continuous monitoring capabilities represents areas with the highest research priorities. Proxy sensing is a promising emerging field that maps environmental signatures to different activities, with insufficiently understood scalability at this point.
Contrary to the conventional sensing units, which were often initiated from the research domain and later entered the commercial market, the wearable IoT movement is primarily led by the commercial sector with research trying to catch up. Personal scale sensing enables refined assessment of environmental exposures and development of relevant models, but a number of questions regarding the hardware, accuracy, measurement location considering personal air pollution cloud or thermal boundary layer and data convergence need to be resolved first.
Converging data of different types and from different sources represent a challenge that a few studies attempted to address. Developing practical frameworks to enable data integration is a research and engineering priority centered around the practical application of scaling data convergence. The development of standardized naming schemas is necessary. The current literature review identified a significant disconnect between each scale and significant inter-scale data underutilization. Traditional inter-scale differentiation is strongly supported by academic research with only a few studies that show how data from one scale can promote a more efficient operation related to another scale. Privacy, security, and liability are issues of concern, although more detail analysis was outside the scope of the current review. Some recent studies and sensing guidelines suggest that IAQ data should be communicated to people, but it is still not known what the most efficient ways are to present data and what behavioral outcomes they might produce. While there are immediate opportunities to enhance the uptake of IoT sensing technologies across cities, buildings, and humans by overcoming data, technological, and research silos, fundamental scientific and engineering developments are still necessary.
On the scientific forefront, the most important path forward is development of personal thermal comfort and air pollution exposure models that will provide deeper understanding of how environment impacts health, productivity and comfort. One of the major issue is basic understanding of what quantities we need to include into personalized thermal comfort model that will enable proper mapping of comfort as a state of mind and measuremable thermal parameters both environmental and bimetrix. Another extremly important scientific issue is understanding relationship between air pollution exposure and human health and productivity. This area has received significant attention over the years, linking large scale population health survey to remote air quality stations. Personal samling and manual association of other types of data to the measured exposure dataset is a tedious process are resulted in limited data sets. We are still missing full understanding of the set of air pollutants and their respective concentrations that have acute and chronic health effects and how to link personalized exposure to health impacts. These are the two most significant advancement that will require technology enabled advancements in science because we need ability to generate large data sets. Personal exposure and thermal comfort models represent a paradigm shift and their development should be one of the scientific priorities. A wide range of data analytics, machine learning, and statistical methods are being developed to support the use of generated data sets.
At the engineering forefront, converging occupant feedback and environment characterization on urban, building, and personal scales will help us to tune building operation setpoints to maximize the thermal comfort of a particular occupant cohort and reduce their exposures.
Author contributions
JP–concept creating, writing, reviewing and leading the process. NN–concept creating, writing, reviewing. CM–concept creating, writing, reviewing. FM–concept creating, writing, reviewing. JL–writing, reviewing. DL–concept creating, writing, reviewing.
Conflict of interest
JP was employed by Delos Living LLC.
The remaining authors declare that the research was conducted in the absence of any commercial or financial relationships that could be construed as a potential conflict of interest.
Publisher’s note
All claims expressed in this article are solely those of the authors and do not necessarily represent those of their affiliated organizations, or those of the publisher, the editors and the reviewers. Any product that may be evaluated in this article, or claim that may be made by its manufacturer, is not guaranteed or endorsed by the publisher.
References
Abboushi, B., Safranek, S., Bermudez, E. R. F., Pratoomratana, S., Chen, Y., Poplawski, M., et al. (2022). A review of the use of wearables in indoor environmental quality studies and an evaluation of data accessibility from a wearable device. Front. Built Environ. 8. doi:10.3389/fbuil.2022.787289
Abdelrahman, M. M., Chong, A., and Miller, C. (2022). Personal thermal comfort models using digital twins: Preference prediction with BIM-extracted spatial–temporal proximity data from Build2Vec. Build. Environ. 207, 108532. doi:10.1016/j.buildenv.2021.108532
Abraham, S., and Li, X. (2014). A cost-effective wireless sensor network system for indoor air quality monitoring applications. Procedia Comput. Sci. 34, 165–171. doi:10.1016/j.procs.2014.07.090
Ahangar, F. E., Freedman, F. R., and Venkatram, A. (2019). Using low-cost air quality sensor networks to improve the spatial and temporal resolution of concentration maps. Int. J. Environ. Res. Public Health 16.
Air pollution (2022). Air pollution. Available at: https://www.who.int/health-topics/air-pollution.
Ali, A. S., Zanzinger, Z., Debose, D., and Stephens, B. (2016). Open source building science sensors (OSBSS): A low-cost arduino-based platform for long-term indoor environmental data collection. Build. Environ. 100, 114–126. doi:10.1016/j.buildenv.2016.02.010
American Society of Heating, R., and Engineers, A. C. (2016). Standard 62.1 user’s manual: Based on ANSI/ASHRAE standard 62.1-2016, ventilation for acceptable indoor air quality. Peachtree Corners, GA: ASHRAE.
Andresen, P. R., Ramachandran, G., Pai, P., and Maynard, A. (2005). Women’s personal and indoor exposures to PM2.5 in Mysore, India: Impact of domestic fuel usage. Atmos. Environ. X. 39, 5500–5508. doi:10.1016/j.atmosenv.2005.06.004
Anjomshoaa, A., Duarte, F., Rennings, D., Matarazzo, T. J., deSouza, P., and Ratti, C. (2018). City scanner: Building and scheduling a mobile sensing platform for smart city services. IEEE Internet Things J. 5, 4567–4579. doi:10.1109/jiot.2018.2839058
Antonić, A., Bilas, V., Marjanović, M., Matijašević, M., Oletić, D., Pavelić, M., et al. (2014). “Urban crowd sensing demonstrator: Sense the zagreb air,” in 2014 22nd International Conference on Software, Telecommunications and Computer Networks (SoftCOM) (Split, Croatia: IEEE), 423–424. doi:10.1109/SOFTCOM.2014.7039132
Arfire, A., Marjovi, A., and Martinoli, A. (2016). “Enhancing measurement quality through active sampling in mobile air quality monitoring sensor networks,” in 2016 IEEE International Conference on Advanced Intelligent Mechatronics (AIM) (Banff, AB, Canada: IEEE), 1022–1027. doi:10.1109/AIM.2016.7576904
ASHRAE (2010). Performance measurement protocols for commercial buildings. Available at: https://www.techstreet.com/standards/performance-measurement-protocols-for-commercial-buildings?product_id=1703581.
Atlam, H. F., and Wills, G. B. (2020). “IoT security, privacy, safety and ethics,” in InDigital twin technologies and smart cities, 123–149. doi:10.1007/978-3-030-18732-3_8
Balaji, B., Bhattacharya, A., Fierro, G., Gao, J., Gluck, J., Hong, D., et al. (2018). Brick : Metadata schema for portable smart building applications. Appl. Energy 226, 1273–1292. doi:10.1016/j.apenergy.2018.02.091
Baxter, L. K., Dionisio, K. L., Burke, J., Ebelt Sarnat, S., Sarnat, J. A., Hodas, N., et al. (2013). Exposure prediction approaches used in air pollution epidemiology studies: Key findings and future recommendations. J. Expo. Sci. Environ. Epidemiol. 23, 654–659. doi:10.1038/jes.2013.62
Bechtel, B., Alexander, P. J., Beck, C., Bohner, J., Brousse, O., Ching, J., et al. (2019). Generating WUDAPT Level 0 data – current status of production and evaluation. Urban Clim. 27, 24–45. doi:10.1016/j.uclim.2018.10.001
Bell, S., Cornford, D., and Bastin, L. (2015). How good are citizen weather stations? Addressing a biased opinion. Weather 70, 75–84. doi:10.1002/wea.2316
Benita, F., Bansal, G., and Tunçer, B. (2019). Public spaces and happiness: Evidence from a large-scale field experiment. Health Place 56, 9–18. doi:10.1016/j.healthplace.2019.01.014
Bhangar, S., Adams, R. I., Pasut, W., Huffman, J. A., Arens, E. A., Taylor, J. W., et al. (2016). Chamber bioaerosol study: Human emissions of size-resolved fluorescent biological aerosol particles. Indoor Air 26, 193–206. doi:10.1111/ina.12195
Bibri, S. E. (2018). The IoT for smart sustainable cities of the future: An analytical framework for sensor-based big data applications for environmental sustainability. Sustain. Cities Soc. 38, 230–253. doi:10.1016/j.scs.2017.12.034
Blanco-Novoa, O., Fernández-Caramés, T. M., Fraga-Lamas, P., and Castedo, L. (2018). A cost-effective IoT system for monitoring indoor radon gas concentration. Sensors 18, 2198. doi:10.3390/s18072198
Borghi, F., Spinazzè, A., Rovelli, S., Campagnolo, D., Buono, L. D., Cattaneo, A., et al. (2017). Miniaturized monitors for assessment of exposure to air pollutants: A review. Int. J. Environ. Res. Public Health 14, 909. doi:10.3390/ijerph14080909
Broich, A. V., Gerharz, L. E., and Klemm, O. (2011). Personal monitoring of exposure to particulate matter with a high temporal resolution. Environ. Sci. Pollut. Res. 19, 2959–2972. doi:10.1007/s11356-012-0806-3
Buehler, C., Xiong, F., Zamora, M. L., Skog, K. M., Kohrman-Glaser, J., Colton, S., et al. (2021). Stationary and portable multipollutant monitors for high-spatiotemporal-resolution air quality studies including online calibration. Atmos. Meas. Tech. 14, 995–1013. doi:10.5194/amt-14-995-2021
Buller, M. J., Tharion, W. J., Cheuvront, S. N., Montain, S. J., Kenefick, R. W., Castellani, J., et al. (2013). Estimation of human core temperature from sequential heart rate observations. Physiol. Meas. 34, 781–798. doi:10.1088/0967-3334/34/7/781
Bulot, F. M. J., Johnston, S. J., Basford, P. J., Easton, N. H. C., Apetroaie-Cristea, M., Foster, G. L., et al. (2019). Long-term field comparison of multiple low-cost particulate matter sensors in an outdoor urban environment. Sci. Rep. 9, 7497. doi:10.1038/s41598-019-43716-3
Byrom, B., Watson, C., Doll, H., Coons, S. J., Eremenco, S., Ballinger, R., et al. (2018). Selection of and evidentiary considerations for wearable devices and their measurements for use in regulatory decision making: Recommendations from the ePRO Consortium. Value Health 21, 631–639. doi:10.1016/j.jval.2017.09.012
Cabrera, A. N., Droste, A., Heusinkveld, B. G., and Steeneveld, G.-J. (2021). The potential of a smartphone as an urban weather station—an exploratory analysis. Front. Environ. Sci. 9. doi:10.3389/fenvs.2021.673937
Cahill, J., Portales, R., McLoughin, S., Nagan, N., Henrichs, B., and Wetherall, S. (2019). IoT/sensor-based infrastructures promoting a sense of home, independent living, comfort and wellness. Sensors (Basel). 19, 485. doi:10.3390/s19030485
Candanedo, L. M., and Feldheim, V. (2016). Accurate occupancy detection of an office room from light, temperature, humidity and CO2 measurements using statistical learning models. Energy Build. 112, 28–39. doi:10.1016/j.enbuild.2015.11.071
Cao, T., and Thompson, J. E. (2016). Personal monitoring of ozone exposure: A fully portable device for under $150 usd cost. Sensors Actuators B Chem. 224, 936–943. doi:10.1016/j.snb.2015.10.090
Caplin, A., Ghandehari, M., Lim, C., Glimcher, P., and Thurston, G. (2019). Advancing environmental exposure assessment science to benefit society. Nat. Commun. 10, 1236. doi:10.1038/s41467-019-09155-4
Carre, A., and Williamson, T. (2018). Design and validation of a low cost indoor environment quality data logger. Energy Build. 158, 1751–1761. doi:10.1016/j.enbuild.2017.11.051
Castell, N., Dauge, F. R., Schneider, P., Vogt, M., Lerner, U., Fishbain, B., et al. (2017). Can commercial low-cost sensor platforms contribute to air quality monitoring and exposure estimates? Environ. Int. 99, 293–302. doi:10.1016/j.envint.2016.12.007
Castell, N., Kobernus, M., Liu, H. Y., Schneider, P., Lahoz, W., Berre, A. J., et al. (2015). Mobile technologies and services for environmental monitoring: The Citi-Sense-MOB approach. Urban Clim. 14, 370–382. doi:10.1016/j.uclim.2014.08.002
Chamari, L., Petrova, E., and Pauwels, P. (2022). “A web-based approach to BMS, BIM and IoT integration: A case study,” in CLIMA 2022.
Chan, C. B., and Ryan, D. A. (2009). Assessing the effects of weather conditions on physical activity participation using objective measures. Int. J. Environ. Res. Public Health 6, 2639–2654. doi:10.3390/ijerph6102639
Chapman, L., Bell, C., and Bell, S. (2017). Can the crowdsourcing data paradigm take atmospheric science to a new level? A case study of the urban heat island of london quantified using netatmo weather stations: Crowdsourcing the london UHI. Int. J. Climatol. 37, 3597–3605. doi:10.1002/joc.4940
Chapman, L., and Bell, S. J. (2018). High-resolution monitoring of weather impacts on infrastructure networks using the internet of things. Bull. Am. Meteorol. Soc. 99, 1147–1154. doi:10.1175/bams-d-17-0214.1
Chaudhuri, T., Zhai, D., Soh, Y. C., Li, H., and Xie, L. (2018). Random forest based thermal comfort prediction from gender-specific physiological parameters using wearable sensing technology. Energy Build. 166, 391–406. doi:10.1016/j.enbuild.2018.02.035
Chen, J., Saunders, K., and Whan, K. (2021). Quality control and bias adjustment of crowdsourced wind speed observations. Q. J. R. Meteorol. Soc. 147, 3647–3664. doi:10.1002/qj.4146
Chen, Z., Masood, M. K., and Soh, Y. C. (2016). A fusion framework for occupancy estimation in office buildings based on environmental sensor data. Energy Build. 133, 790–798. doi:10.1016/j.enbuild.2016.10.030
Cheung, T., Schiavon, S., Parkinson, T., Li, P., and Brager, G. (2019). Analysis of the accuracy on PMV – PPD model using the ASHRAE global thermal comfort database II. Build. Environ. 153, 205–217. doi:10.1016/j.buildenv.2019.01.055
Chojer, H., Branco, P. T. B. S., Martins, F. G., Alvim-Ferraz, M. C. M., and Sousa, S. I. V. (2020). Development of low-cost indoor air quality monitoring devices: Recent advancements. Sci. Total Environ. 727, 138385. doi:10.1016/j.scitotenv.2020.138385
Clements, N., Zhang, R., Jamrozik, A., Campanella, C., and Bauer, B. (2019). The spatial and temporal variability of the indoor environmental quality during three simulated office studies at a living lab. Buildings 9, 62. doi:10.3390/buildings9030062
Clemitshaw, K. (2004). A review of instrumentation and measurement techniques for ground-based and airborne field studies of gas-phase tropospheric chemistry. Crit. Rev. Environ. Sci. Technol. 34, 1–108. doi:10.1080/10643380490265117
Coleman, J. R., and Meggers, F. (2018). Sensing of indoor air quality—characterization of spatial and temporal pollutant evolution through distributed sensing. Front. Built Environ. 4, 28. doi:10.3389/fbuil.2018.00028
Collier-Oxandale, A., Feenstra, B., Papapostolou, V., Zhang, H., Kuang, M., Der Boghossian, B., et al. (2020). Field and laboratory performance evaluations of 28 gas-phase air quality sensors by the AQ-SPEC program. Atmos. Environ. X. 220, 117092. doi:10.1016/j.atmosenv.2019.117092
Costa, A., Keane, M. M., Torrens, J. I., and Corry, E. (2013). Building operation and energy performance: Monitoring, analysis and optimisation toolkit. Appl. Energy 101, 310–316. doi:10.1016/j.apenergy.2011.10.037
Crist, K. C., Liu, B., Kim, M., Deshpande, S. R., and John, K. (2008). Characterization of fine particulate matter in Ohio: Indoor, outdoor, and personal exposures. Environ. Res. 106, 62–71. doi:10.1016/j.envres.2007.06.008
Cureau, R. J., Pigliautile, I., and Pisello, A. L. A. (2022). A new wearable system for sensing outdoor environmental conditions for monitoring hyper-microclimate. Sensors 22, 502. doi:10.3390/s22020502
Curto, A., Donaire-Gonzalez, D., Barrera-Gomez, J., Marshall, J., Nieuwenhuijsen, M., Wellenius, G., et al. (2018). Performance of low-cost monitors to assess household air pollution. Environ. Res. 163, 53–63. doi:10.1016/j.envres.2018.01.024
Dai, C., Zhang, H., Arens, E., and Lian, Z. (2017). Machine learning approaches to predict thermal demands using skin temperatures: Steady-state conditions. Build. Environ. 114, 1–10. doi:10.1016/j.buildenv.2016.12.005
Dayan, A., and Hartley, T. (2013). AirPI air quality and weather project. Available at: http://airpi.es.
de Vos, L., Leijnse, H., Overeem, A., and Uijlenhoet, R. (2017). The potential of urban rainfall monitoring with crowdsourced automatic weather stations in Amsterdam. Hydrol. Earth Syst. Sci. 21, 765–777. doi:10.5194/hess-21-765-2017
Demanega, I., Mujan, I., Singer, B. C., Andelkovic, A. S., Babich, F., and Licina, D. (2021). Performance assessment of low-cost environmental monitors and single sensors under variable indoor air quality and thermal conditions. Build. Environ. 187, 107415. doi:10.1016/j.buildenv.2020.107415
Deng, Y., Chen, C., Xian, X., Tsow, F., Verma, G., McConnell, R., et al. (2016). A novel wireless wearable volatile organic compound (VOC) monitoring device with disposable sensors. Sensors 16, 2060. doi:10.3390/s16122060
Devarakonda, S., Sevusu, P., Liu, H., and Liu, R. (2013). Real-time air quality monitoring through mobile sensing in metropolitan areas. Proceedings of the 2nd.
Dhariwal, J., Manandhar, P., Bande, L., Marpu, P., Armstrong, P., and Reinhart, C. F. (2019). Evaluating the effectiveness of outdoor evaporative cooling in a hot, arid climate. Build. Environ. 150, 281–288. doi:10.1016/j.buildenv.2019.01.016
Dias, D., and Cunha, P. S. (2018). Wearable health devices—vital sign monitoring, systems and technologies. Sensors (Basel). 18, 2414. doi:10.3390/s18082414
Dias, D., and Tchepel, O. (2018). Spatial and temporal dynamics in air pollution exposure assessment. Int. J. Environ. Res. Public Health 15, 558. doi:10.3390/ijerph15030558
Dong, B., Andrews, B., Lam, K. P., Hoynck, M., Zhang, R., Chiou, Y. S., et al. (2010). An information technology enabled sustainability test-bed (ITEST) for occupancy detection through an environmental sensing network. Energy Build. 42, 1038–1046. doi:10.1016/j.enbuild.2010.01.016
Droste, A. M., Heusinkveld, B. G., Fenner, D., and Steeneveld, G.-J. (2020). Assessing the potential and application of crowdsourced urban wind data. Q. J. R. Meteorol. Soc. 146, 2671–2688. doi:10.1002/qj.3811
Droste, A. M., Pape, J. J., Overeem, A., Leijnse, H., Steeneveld, G. J., Van Delden, A. J., et al. (2017). Crowdsourcing urban air temperatures through smartphone battery temperatures in são Paulo, Brazil. J. Atmos. Ocean. Technol. 34, 1853–1866. doi:10.1175/jtech-d-16-0150.1
Edirisinghe, R., Setunge, S., Zhang, K., Dias, D., and Samapth, P. (2012). Sensor network to validate IEQ ofpublic building green retrofit.
Fenner, D., Bechtel, B., Demuzere, M., Kittner, J., and Meier, F. (2021). CrowdQC+—a quality-control for crowdsourced air-temperature observations enabling world-wide urban climate applications. Front. Environ. Sci. 9. doi:10.3389/fenvs.2021.720747
Fenner, D., Meier, F., Bechtel, B., Otto, M., and Scherer, D. (2017). Intra and inter ‘local climate zone’ variability of air temperature as observed by crowdsourced citizen weather stations in Berlin, Germany. metz. 26, 525–547. doi:10.1127/metz/2017/0861
Fenner, D., Meier, F., Bechtel, B., Otto, M., and Scherer, D. (2017). Using crowdsourced data from citizen weather stations to analyse air temperature in ‘local climate zones’ in Berlin, Germany. EGU General Assem. Conf. Abstr. 19, 13007.
Ferrer-Cid, P., Barcelo-Ordinas, J. M., Garcia-Vidal, J., Ripoll, A., and Viana, M. (2020). Multisensor data fusion calibration in IoT air pollution platforms. IEEE Internet Things J. 7, 3124–3132. doi:10.1109/jiot.2020.2965283
Fierro, G., Pritoni, M., Abdelbaky, M., Lengyel, D., Leyden, J., Prakash, A., et al. (2018). “Mortar: An open testbed for portable building analytics,” in Proceedings of the 5th Conference on Systems for Built Environments (New York, NY, USA: ACM), 172–181.
Firdhous, M. F. M., Sudantha, B. H., and Karunaratne, P. M. (2017). “IoT enabled proactive indoor air quality monitoring system for sustainable health management,” in 2017 2nd International Conference on Computing and Communications Technologies (ICCCT), 216–221.
Fletcher, R. R., Oreskovic, N. M., and Robinson, A. I. (2014). “Design and clinical feasibility of personal wearable monitor for measurement of activity and environmental exposure,” in 2014 36th Annual International Conference of the IEEE Engineering in Medicine and Biology Society, 874–877.
Fugiglando, U. (2018). Developing personal thermal comfort models for the control of HVAC in cars using field data. Windsor Conf.
Gall, E. T., Cheung, T., Luhung, I., Schiavon, S., and Nazaroff, W. W. (2016). Real-time monitoring of personal exposures to carbon dioxide. Build. Environ. 104, 59–67. doi:10.1016/j.buildenv.2016.04.021
Gallaher, M. P., O’Connor, A. C., Dettbarn, J. L., and Gilday, L. T. (2004). Cost analysis of inadequate interoperability in the U.S. capital facilities industry. doi:10.6028/NIST.GCR.04-867
Gao, M., Cao, J., and Seto, E. (2015). A distributed network of low-cost continuous reading sensors to measure spatiotemporal variations of PM2.5 in Xi’an, China. Environ. Pollut. 199, 56–65. doi:10.1016/j.envpol.2015.01.013
Ghahramani, A., Pantelic, J., Lindberg, C., Mehl, M., Srinivasan, K., Gilligan, B., et al. (2018). Learning occupants’ workplace interactions from wearable and stationary ambient sensing systems. Appl. Energy 230, 42–51. doi:10.1016/j.apenergy.2018.08.096
Ghahramani, A., Pantelic, J., Vannucci, M., Pistore, L., Liu, S., Gilligan, B., et al. (2019). Personal CO2 bubble: Context-dependent variations and wearable sensors usability. J. Build. Eng. 22, 295–304. doi:10.1016/j.jobe.2018.11.015
Ghahramani, A., Zhu, M., Przybyla, R. J., Andersen, M. P., Galicia, P. J., Peffer, T., et al. (2019). Measuring air speed with a low-power MEMS ultrasonic anemometer via adaptive phase tracking. IEEE Sens. J. 19, 8136. doi:10.1109/JSEN.2019.2920648
Goldman, G. T., Mulholland, J. A., Russell, A. G., Srivastava, A., Strickland, M. J., Klein, M., et al. (2010). Ambient air pollutant measurement error: Characterization and impacts in a time-series epidemiologic study in atlanta. Environ. Sci. Technol. 44, 7692–7698. doi:10.1021/es101386r
Granderson, J., Piette, M. A., and Ghatikar, G. (2011). Building energy information systems: User case studies. Energy Effic. 4, 17–30. doi:10.1007/s12053-010-9084-4
Grasso, V., Crisci, A., Morabito, M., and Nesi, P. (2017). Public crowdsensing of heat waves by social media data. Adv. Sci. Technol. Water Resour. 14, 217. doi:10.5194/asr-14-217-2017
Grimm, N. B., Faeth, S. H., Golubiewski, N. E., Redman, C. L., Wu, J., Bai, X., et al. (2008). Global change and the ecology of cities. Science 319, 756–760. doi:10.1126/science.1150195
Guo, H., Teitelbaum, E., Houchois, N., Bozlar, M., and Meggers, F. (2018). Revisiting the use of globe thermometers to estimate radiant temperature in studies of heating and ventilation. Energy Build. 180, 83–94. doi:10.1016/j.enbuild.2018.08.029
Häb, K., Ruddell, B. L., and Middel, A. (2015). Sensor lag correction for mobile urban microclimate measurements. Urban Clim. 14, 622–635. doi:10.1016/j.uclim.2015.10.003
Habre, R., Coull, B., Moshier, E., Godbold, J., Grunin, A., Nath, A., et al. (2014). Sources of indoor air pollution in New York City residences of asthmatic children. J. Expo. Sci. Environ. Epidemiol. 24, 269–278. doi:10.1038/jes.2013.74
Hajjaji, Y., Boulila, W., Farah, I. R., Romdhani, I., and Hussain, A. (2021). Big data and IoT-based applications in smart environments: A systematic review. Comput. Sci. Rev. 39, 100318. doi:10.1016/j.cosrev.2020.100318
Han, Z., Gao, R. X., and Fan, Z. (2012). “Occupancy and indoor environment quality sensing for smart buildings,” in 2012 IEEE International Instrumentation and Measurement Technology Conference Proceedings, 882–887.
Happle, G., Wilhelm, E., Fonseca, J. A., and Schlueter, A. (2017). Determining air-conditioning usage patterns in Singapore from distributed, portable sensors. Energy Procedia 122, 313–318. doi:10.1016/j.egypro.2017.07.328
Harrison, W. A., Lary, D., Nathan, B., and Moore, A. G. (2015). The neighborhood scale variability of airborne particulates. J. Environ. Prot. (Irvine, Calif. 6, 464–476. doi:10.4236/jep.2015.65045
Hasan, M. H., Alsaleem, F., and Rafaie, M. (2016). Sensitivity study for the PMV thermal comfort model and the use of wearable devices biometric data for metabolic rate estimation. Build. Environ. 110, 173–183. doi:10.1016/j.buildenv.2016.10.007
Hasenfratz, D., Saukh, O., Walser, C., Hueglin, C., Fierz, M., Arn, T., et al. (2015). Deriving high-resolution urban air pollution maps using mobile sensor nodes. Pervasive Mob. Comput. 16, 268–285. doi:10.1016/j.pmcj.2014.11.008
He, R., Han, T., Bachman, D., Carluccio, D. J., Jaeger, R., Zhang, J., et al. (2021). Evaluation of two low-cost PM monitors under different laboratory and indoor conditions. Aerosol Sci. Technol. 55, 316–331. doi:10.1080/02786826.2020.1851649
Health Effects Institute (2015). HEI strategic plan for understanding the health effects of air pollution: 2015-2020. Massachusetts, USA: Health Effects Institute.
Hegde, S., Min, K. T., Moore, J., Lundrigan, P., Patwari, N., Collingwood, S., et al. (2020). Indoor household particulate matter measurements using a network of low-cost sensors. Aerosol Air Qual. Res. 20, 381–394. doi:10.4209/aaqr.2019.01.0046
Heinzerling, D., Schiavon, S., Webster, T., and Arens, E. (2013). Indoor environmental quality assessment models: A literature review and a proposed weighting and classification scheme. Build. Environ. 70, 210–222. doi:10.1016/j.buildenv.2013.08.027
Hernández-Gordillo, A., Ruiz-Correa, S., Robledo-Valero, V., Hernández-Rosales, C., and Arriaga, S. (2021). Recent advancements in low-cost portable sensors for urban and indoor air quality monitoring. Air Qual. Atmos. Health 14, 1931–1951. doi:10.1007/s11869-021-01067-x
Heusinkveld, B. G., Steeneveld, G. J., van Hove, L. W. A., Jacobs, C. M. J., and Holtslag, A. A. M. (2014). Spatial variability of the Rotterdam urban heat island as influenced by urban land use. J. Geophys. Res. Atmos. 119, 677–692. doi:10.1002/2012jd019399
Hojaiji, H., Goldstein, O., King, C. E., Sarrafzadeh, M., and Jerrett, M. (2017). “Design and calibration of a wearable and wireless research grade air quality monitoring system for real-time data collection,” in 2017 IEEE Global Humanitarian Technology Conference (GHTC), 1–10.
Holmes, M. J., and Hacker, J. N. (2007). Climate change, thermal comfort and energy: Meeting the design challenges of the 21st century. Energy Build. 39, 802–814. doi:10.1016/j.enbuild.2007.02.009
Houchois, N., Teitelbaum, E., Chen, K. W., Rucewicz, S., and Meggers, F. (2019). The SMART sensor: Fully characterizing radiant heat transfer in the built environment. J. Phys. Conf. Ser. 1343, 012073. doi:10.1088/1742-6596/1343/1/012073
Hu, K., Davison, T., Rahman, A., and Sivaraman, V. (2014). “Air pollution exposure estimation and finding association with human activity using wearable sensor network,” in Proceedings of the MLSDA 2014 2Nd Workshop on Machine Learning for Sensory Data Analysis (Gold Coast, Australia: ACM).
Huang, J., Deng, F., Wu, S., and Guo, X. (2012). Comparisons of personal exposure to PM2.5 and CO by different commuting modes in Beijing, China. Sci. Total Environ. 425, 52–59. doi:10.1016/j.scitotenv.2012.03.007
Idrees, Z., Zou, Z., and Zheng, L. (2018). Edge computing based IoT architecture for low cost air pollution monitoring systems: A comprehensive system Analysis, design considerations & development. Sensors 18, 3021. doi:10.3390/s18093021
Jackson-Morris, A., Bleymann, K., Lyall, E., Aslam, F., Bam, T. S., Chowdhury, I., et al. (2016). Low-cost air quality monitoring methods to assess compliance with smoke-free regulations: A multi-center study in six low- and middle-income countries. Nicotine Tob. Res. 18, 1258–1264. doi:10.1093/ntr/ntv290
Jayathissa, P., Quintana, M., Abdelrahman, M., and Miller, C. (2020). Humans-as-a-Sensor for buildings—intensive longitudinal indoor comfort models. Buildings 10, 174. doi:10.3390/buildings10100174
Jayathissa, P., Quintana, M., Sood, T., Nazarian, N., and Miller, C. (2019). Is your clock-face cozie? A smartwatch methodology for the in-situ collection of occupant comfort data. J. Phys. Conf. Ser. 1343, 012145. doi:10.1088/1742-6596/1343/1/012145
Jenkins, P., Xue, J., Spengler, J., WaLLace, L., and Pellizzari, E. (1996). Personal exposure to airborne particles and metals: Results from the particle TEAM study in riverside, California. J. Expo. Anal. Environ. Epidemiol. 6, 57–78.
Jeon, Y., Cho, C., Seo, J., Kwon, K., Park, H., Oh, S., et al. (2018). IoT-based occupancy detection system in indoor residential environments. Build. Environ. 132, 181–204. doi:10.1016/j.buildenv.2018.01.043
Jerrett, M., Donaire-Gonzalez, D., Popoola, O., Jones, R., Cohen, R. C., Almanza, E., et al. (2017). Validating novel air pollution sensors to improve exposure estimates for epidemiological analyses and citizen science. Environ. Res. 158, 286–294. doi:10.1016/j.envres.2017.04.023
Jin, M., Bekiaris-Liberis, N., Weekly, K., Spanos, C. J., and Bayen, A. M. (2018). Occupancy detection via environmental sensing. IEEE Trans. Autom. Sci. Eng. 15, 443–455. doi:10.1109/tase.2016.2619720
Jin, M., Liu, S., Schiavon, S., and Spanos, C. (2018). Automated mobile sensing: Towards high-granularity agile indoor environmental quality monitoring. Build. Environ. 127, 268–276. doi:10.1016/j.buildenv.2017.11.003
Johannesson, S., Gustafson, P., Molnár, P., Barregard, L., and Sällsten, G. (2007). Exposure to fine particles (PM2.5 and PM1) and black smoke in the general population: Personal, indoor, and outdoor levels. J. Expo. Sci. Environ. Epidemiol. 17, 613–624. doi:10.1038/sj.jes.7500562
Johnston, S. J., Basford, P. J., Bulot, F. M. J., Apetroaie-Cristea, M., Easton, N. H. C., Davenport, C., et al. (2019). City scale particulate matter monitoring using LoRaWAN based air quality IoT devices. Sensors 19, 209. doi:10.3390/s19010209
Jovašević-Stojanović, M., Bartonova, A., Topalovic, D., Lazovic, I., Pokric, B., and Ristovski, Z. (2015). On the use of small and cheaper sensors and devices for indicative citizen-based monitoring of respirable particulate matter. Environ. Pollut. 206, 696–704. doi:10.1016/j.envpol.2015.08.035
Juhász, L., and Hochmair, H. H. (2016). User contribution patterns and completeness evaluation of mapillary, a crowdsourced street level photo service: Contribution patterns of mapillary. Trans. GIS 20, 925–947. doi:10.1111/tgis.12190
Kane, F., Abbate, J., Landahl, E. C., and Potosnak, M. J. (2022). Monitoring particulate matter with wearable sensors and the influence on student environmental attitudes. Sensors 22, 1295. doi:10.3390/s22031295
Kelly, K. E., Whitaker, J., Petty, A., Widmer, C., Dybwad, A., Sleeth, D., et al. (2017). Ambient and laboratory evaluation of a low-cost particulate matter sensor. Environ. Pollut. 221, 491–500. doi:10.1016/j.envpol.2016.12.039
Keogh, E., Lin, J., and Fu, A. (2005). “Hot SAX: Efficiently finding the most unusual time series subsequence,” in Fifth IEEE International Conference on Data Mining (ICDM’05), 8.
Kim, J., Bauman, F., Raftery, P., Arens, E., Zhang, H., Fierro, G., et al. (2019). Occupant comfort and behavior: High-resolution data from a 6-month field study of personal comfort systems with 37 real office workers. Build. Environ. 148, 348–360. doi:10.1016/j.buildenv.2018.11.012
Kim, J., Chu, C., and Shin, S. (2014). ISSAQ: An integrated sensing systems for real-time indoor air quality monitoring. IEEE Sens. J. 14, 4230–4244. doi:10.1109/jsen.2014.2359832
Kim, J., Schiavon, S., and Brager, G. (2018). Personal comfort models – a new paradigm in thermal comfort for occupant-centric environmental control. Build. Environ. 132, 114–124. doi:10.1016/j.buildenv.2018.01.023
Kim, J., Zhou, Y., Schiavon, S., Raftery, P., and Brager, G. (2018). Personal comfort models: Predicting individuals’ thermal preference using occupant heating and cooling behavior and machine learning. Build. Environ. 129, 96–106. doi:10.1016/j.buildenv.2017.12.011
Kim, S. K., and Oh, T. I. (2018). Real-time PM10 concentration prediction LSTM model based on IoT streaming sensor data. J. Korea Academia-Industrial Coop. Soc. 19, 310–318.
Klepeis, N. E., Nelson, W. C., Ott, W. R., Robinson, J. P., Tsang, A. M., Switzer, P., et al. (2001). The national human activity pattern survey (NHAPS): A resource for assessing exposure to environmental pollutants. J. Expo. Sci. Environ. Epidemiol. 11, 231–252. doi:10.1038/sj.jea.7500165
Koh, J., Hong, D., Gupta, R., Whitehouse, K., Wang, H., and Agarwal, Y. (2018). “Plaster: An integration, benchmark, and development framework for metadata normalization methods,” in Proceedings of the 5th Conference on Systems for Built Environments (New York, NY, USA: ACM), 1–10.
Kortoçi, P., Motlagh, N. H., Zaidan, M. A., Fung, P. L., Varjonen, S., Rebeiro-Hargrave, A., et al. (2022). Air pollution exposure monitoring using portable low-cost air quality sensors. Smart Health 23, 100241. doi:10.1016/j.smhl.2021.100241
Kumar, P., Morawska, L., Martani, C., Biskos, G., Neophytou, M., Di Sabatino, S., et al. (2015). The rise of low-cost sensing for managing air pollution in cities. Environ. Int. 75, 199–205. doi:10.1016/j.envint.2014.11.019
Kumar, P., Skouloudis, A. N., Bell, M., Viana, M., Carotta, M. C., Biskos, G., et al. (2016). Real-time sensors for indoor air monitoring and challenges ahead in deploying them to urban buildings. Sci. Total Environ. 560-561, 150–159. doi:10.1016/j.scitotenv.2016.04.032
Legislature (2020). Bill text - AB-836 wildfire smoke clean air Centers for vulnerable populations incentive pilot program. Available at: http://leginfo.legislature.ca.gov/faces/billNavClient.xhtml?bill_id=201920200AB836.
Li, J., Li, H., Ma, Y., Wang, Y., Abokifa, A. A., Lu, C., et al. (2018). Spatiotemporal distribution of indoor particulate matter concentration with a low-cost sensor network. Build. Environ. 127, 138–147. doi:10.1016/j.buildenv.2017.11.001
Li, X. F., Logan, R. J., and Pastore, R. E. (1991). Perception of acoustic source characteristics: Walking sounds. J. Acoust. Soc. Am. 90, 3036–3049. doi:10.1121/1.401778
Licina, D., and Bhangar, S. (2019). Occupant health & well-being in green buildings: Trends and Future Directions. ASHRAE J.
Licina, D., Bhangar, S., Brooks, B., Baker, R., Firek, B., Tang, X., et al. (2016). Concentrations and sources of airborne particles in a neonatal intensive care unit. PLoS ONE 11, e0154991. doi:10.1371/journal.pone.0154991
Licina, D., Morrison, G. C., and Beko, G. (2019). Clothing-mediated exposure to chemicals and particles. Sci. Technol. China.
Licina, D., Tian, Y., and Nazaroff, W. W. (2017). Emission rates and the personal cloud effect associated with particle release from the perihuman environment. Indoor Air 27, 791–802. doi:10.1111/ina.12365
Lim, C. C., Kim, H., Vilcassim, M. R., Thurston, G. D., Gordon, T., Chen, L. C., et al. (2019). Mapping urban air quality using mobile sampling with low-cost sensors and machine learning in Seoul, South Korea. Environ. Int. 131, 105022. doi:10.1016/j.envint.2019.105022
Liu, S., Jin, M., Das, H., and Spanos, C. (2018). Personal thermal comfort models based on physiological parameters measured by wearable sensors. Proc.
Liu, Z., Ye, W., and Little, J. C. (2013). Predicting emissions of volatile and semivolatile organic compounds from building materials: A review. Build. Environ. 64, 7–25. doi:10.1016/j.buildenv.2013.02.012
Lopez, G., Takahashi, K., Nkurikiyeyezu, K., and Yokokubo, A. (2018). “Development of a wearable thermo-conditioning device controlled by human factors based thermal comfort estimation,” in 2018 12th France-Japan and 10th Europe-Asia Congress on Mechatronics (Tsu, Japan: IEEE), 255–259.
Luo, M., Hong, Y., and Pantelic, J. (2021). Determining building natural ventilation potential via IoT-based air quality sensors. Front. Environ. Sci. 9, 144. doi:10.3389/fenvs.2021.634570
Luo, N., Fierro, G., Liu, Y., Dong, B., and Hong, T. (2022). Extending the Brick schema to represent metadata of occupants. Autom. Constr. 139, 104307. doi:10.1016/j.autcon.2022.104307
Maag, B., Zhou, Z., and Thiele, L. (2018). W-Air: Enabling personal air pollution monitoring on wearables. Proc. ACM interact. Mob. Proc. ACM Interact. Mob. Wearable Ubiquitous Technol. 2 (24), 1–25. doi:10.1145/3191756
Mahoney, W. P., and O’Sullivan, J. M. (2013). Realizing the potential of vehicle-based observations. Bull. Am. Meteorol. Soc. 94, 1007–1018. doi:10.1175/bams-d-12-00044.1
Mamun, M. A. A., and Yuce, M. R. (2019). Sensors and systems for wearable environmental monitoring toward IoT-enabled applications: A review. IEEE Sens. J. 19, 7771–7788. doi:10.1109/jsen.2019.2919352
Manikonda, A., Zíková, N., Hopke, P. K., and Ferro, A. R. (2016). Laboratory assessment of low-cost PM monitors. J. Aerosol Sci. 102, 29–40. doi:10.1016/j.jaerosci.2016.08.010
Manzano, C. A., Dodder, N. G., Hoh, E., and Morales, R. (2018). Patterns of personal exposure to urban pollutants using personal passive samplers and GC× GC/ToF–MS. Environ. Sci. Technol. 53, 614–624. doi:10.1021/acs.est.8b06220
Marć, M., Tobiszewski, M., Zabiegała, B., de la Guardia, M., and Namieśnik, J. (2015). Current air quality analytics and monitoring: A review. Anal. Chim. Acta X. 853, 116–126. doi:10.1016/j.aca.2014.10.018
Martilli, A., Betancourt, T., and Delle Monache, L. (2017). On the use of cell phones data to characterize the atmosphere in urban areas.
Martín-Garín, A., Millán-García, J. A., Baïri, A., Millán-Medel, J., and Sala-Lizarraga, J. M. (2018). Environmental monitoring system based on an Open Source Platform and the Internet of Things for a building energy retrofit. Autom. Constr. 87, 201–214. doi:10.1016/j.autcon.2017.12.017
McKone, T. E., Ryan, P. B., and Ozkaynak, H. (2009). Exposure information in environmental health research: Current opportunities and future directions for particulate matter, ozone, and toxic air pollutants. J. Expo. Sci. Environ. Epidemiol. 19, 30–44. doi:10.1038/jes.2008.3
Mead, M. I., Popoola, O., Stewart, G., Landshoff, P., Calleja, M., Hayes, M., et al. (2013). The use of electrochemical sensors for monitoring urban air quality in low-cost, high-density networks. Atmos. Environ. X. 70, 186–203. doi:10.1016/j.atmosenv.2012.11.060
Meier, F., Fenner, D., Grassmann, T., Jänicke, B., Otto, M., and Scherer, D. (2015). “Challenges and benefits from crowd sourced atmospheric data for urban climate research using Berlin, Germany, as testbed,” in ICUC9–9th International Conference on Urban Climate jointly with 12th Symposium on the Urban Environment.
Meier, F., Fenner, D., Grassmann, T., Otto, M., and Scherer, D. (2017). Crowdsourcing air temperature from citizen weather stations for urban climate research. Urban Clim. 19, 170–191. doi:10.1016/j.uclim.2017.01.006
Middel, A., and Krayenhoff, E. S. (2019). Micrometeorological determinants of pedestrian thermal exposure during record-breaking heat in Tempe, Arizona: Introducing the MaRTy observational platform. Sci. Total Environ. 687, 137–151. doi:10.1016/j.scitotenv.2019.06.085
Middel, A., Lukasczyk, J., Zakrzewski, S., Arnold, M., and Maciejewski, R. (2019). Urban form and composition of street canyons: A human-centric big data and deep learning approach. Landsc. Urban Plan. 183, 122–132. doi:10.1016/j.landurbplan.2018.12.001
Middel, A., Nazarian, N., Demuzere, M., and Bechtel, B. (2022). Urban climate informatics: An emerging research field. Front. Environ. Sci. 10. doi:10.3389/fenvs.2022.867434
Miller, C., Abdelrahman, M., Chong, A., Biljecki, F., Quintana, M., Frei, M., et al. (2021). The Internet-of-Buildings (IoB) — digital twin convergence of wearable and IoT data with GIS/BIM. J. Phys. Conf. Ser. 2042, 012041. doi:10.1088/1742-6596/2042/1/012041
Miller, K. A., Siscovick, D. S., Sheppard, L., Shepherd, K., Sullivan, J. H., Anderson, G. L., et al. (2007). Long-term exposure to air pollution and incidence of cardiovascular events in women. N. Engl. J. Med. Overseas. Ed. 356, 447–458. doi:10.1056/nejmoa054409
Mills, N. L., Donaldson, K., Hadoke, P. W., Boon, N. A., MacNee, W., Cassee, F. R., et al. (2009). Adverse cardiovascular effects of air pollution. Nat. Clin. Pract. Cardiovasc. Med. 6, 36–44. doi:10.1038/ncpcardio1399
Moatassem, A., Caroline, C., Tam, V., and Anh, N. (2016). Sensing occupant comfort using wearable technologies. Constr. Res. Congr. 2016, 940–950.
Moltchanov, S., Levy, I., Etzion, Y., Lerner, U., Broday, D. M., and Fishbain, B. (2015). On the feasibility of measuring urban air pollution by wireless distributed sensor networks. Sci. Total Environ. 502, 537–547. doi:10.1016/j.scitotenv.2014.09.059
Monnot, B., Benita, F., and Piliouras, G. (2017). “Routing games in the wild: Efficiency, equilibration and regret,” in Web and Internet economics, 340–353. doi:10.1007/978-3-319-71924-5_24
Monnot, B., Wilhelm, E., Piliouras, G., Zhou, Y., Dahlmeier, D., Lu, H. Y., et al. (2016). “Inferring activities and optimal trips: Lessons from Singapore’s national science experiment,” in Complex systems design & management asia (Berlin, Germany: Springer International Publishing), 247–264.
Monnot, B., Wilhelm, E., Piliouras, G., Zhou, Y., Dahlmeier, D., Lu, H. Y., et al. (2016). “Inferring activities and optimal trips: Lessons from Singapore’s national science experiment,” in Advances in intelligent systems and computing (Berlin, Germany: Springer International Publishing), 247–264.
Morawska, L., Thai, P. K., Liu, X., Asumadu-Sakyi, A., Ayoko, G., Bartonova, A., et al. (2018). Applications of low-cost sensing technologies for air quality monitoring and exposure assessment: How far have they gone? Environ. Int. 116, 286–299. doi:10.1016/j.envint.2018.04.018
Moreno-Rangel, A., Sharpe, T., Musau, F., and McGill, G. (2018). Field evaluation of a low-cost indoor air quality monitor to quantify exposure to pollutants in residential environments. J. Sens. Sens. Syst. 7, 373–388. doi:10.5194/jsss-7-373-2018
Moskowitz, D. S., and Young, S. N. (2006). Ecological momentary assessment: What it is and why it is a method of the future in clinical psychopharmacology. J. Psychiatry Neurosci. 31, 13–20.
Muller, C. L., Chapman, L., Johnston, S., Kidd, C., Illingworth, S., Foody, G., et al. (2015). Crowdsourcing for climate and atmospheric sciences: Current status and future potential: Crowdsourcing for climate and atmospheric sciences. Int. J. Climatol. 35, 3185–3203. doi:10.1002/joc.4210
Nakayoshi, M., Kanda, M., Shi, R., and de Dear, R. (2015). Outdoor thermal physiology along human pathways: A study using a wearable measurement system. Int. J. Biometeorol. 59, 503–515. doi:10.1007/s00484-014-0864-y
Nandi, C., Debnath, R., and Debroy, P. (2019). “Intelligent control systems for carbon monoxide detection in IoT environments,” in Guide to ambient intelligence in the IoT environment: Principles, technologies and applications. Editor Z. Mahmood (Berlin, Germany: Springer International Publishing), 153–176.
Nandy, T., Coutu, R. A., and Ababei, C. (2018). Carbon monoxide sensing technologies for next-generation cyber-physical systems. Sensors 18, 3443. doi:10.3390/s18103443
Napoly, A., Grassmann, T., Meier, F., and Fenner, D. (2018). Development and application of a statistically-based quality control for crowdsourced air temperature data. Front. Earth Sci. 6, 118. doi:10.3389/feart.2018.00118
Narayana, M. V., Jalihal, D., and Nagendra, S. M. S. (2022). Establishing A sustainable low-cost air quality monitoring setup: A survey of the state-of-the-art. Sensors 22, 394. doi:10.3390/s22010394
Nazarian, N., Krayenhoff, S., Bechtel, B., Hondula, D., Paolini, R., Vanos, J. K., et al. (2021). Integrated assessment of urban overheating impacts on human life. Earth Space Sci. Open Archive. doi:10.1002/essoar.10508877.2
Nazarian, N., and Lee, J. K. W. (2021). Personal assessment of urban heat exposure: A systematic review. Environ. Res. Lett. 16, 033005.
Nazarian, N., Liu, S., Kohler, M., Lee, J. K. W., Miller, C., Chow, W. T. L., et al. (2021). Project coolbit: Can your watch predict heat stress and thermal comfort sensation? Environ. Res. Lett. 16, 034031. doi:10.1088/1748-9326/abd130
Nikolopoulou, M., Baker, N., and Steemers, K. (2001). Thermal comfort in outdoor urban spaces: Understanding the human parameter. Sol. Energy 70, 227–235. doi:10.1016/s0038-092x(00)00093-1
Nikzad, N., Verma, N., Ziftci, C., Bales, E., Quick, N., Zappi, P., et al. (2012). CitiSense: Improving geospatial environmental assessment of air quality using a wireless personal exposure monitoring system. Proc. Conf. Wirel. Health 11, 1–11.
Notley, S. R., Flouris, A. D., and Kenny, G. P. (2019). Occupational heat stress management: Does one size fit all? Am. Am. J. Ind. Med. 62, 1017–1023. doi:10.1002/ajim.22961
Notley, S. R., Flouris, A. D., and Kenny, G. P. (2018). On the use of wearable physiological monitors to assess heat strain during occupational heat stress. Appl. Physiol. Nutr. Metab. 43, 869–881. doi:10.1139/apnm-2018-0173
Nyarku, M., Mazaheri, M., Jayaratne, R., Dunbabin, M., Rahman, M. M., Uhde, E., et al. (2018). Mobile phones as monitors of personal exposure to air pollution: Is this the future? PLoS ONE 13, e0193150. doi:10.1371/journal.pone.0193150
O’Connell, S. G., Kincl, L. D., and Anderson, K. A. (2014). Silicone wristbands as personal passive samplers. Environ. Sci. Technol. 48, 3327–3335. doi:10.1021/es405022f
Ojha, V. K., Griego, D., Kuliga, S., Bielik, M., Bus, P., Schaeben, C., et al. (2019). Machine learning approaches to understand the influence of urban environments on human’s physiological response. Inf. Sci. (N. Y). 474, 154–169. doi:10.1016/j.ins.2018.09.061
Ott, W. R., and Roberts, J. W. (1998). Everyday exposure to toxic pollutants. Sci. Am. 278, 86–91. doi:10.1038/scientificamerican0298-86
Overeem, A., R. Robinson, J. C., Leijnse, H., Steeneveld, G. J., P. Horn, B. K., and Uijlenhoet, R. (2013). Crowdsourcing urban air temperatures from smartphone battery temperatures: Air temperatures from smartphones. Geophys. Res. Lett. 40, 4081–4085. doi:10.1002/grl.50786
Özkaynak, H., Baxter, L. K., Dionisio, K. L., and Burke, J. (2013). Air pollution exposure prediction approaches used in air pollution epidemiology studies. J. Expo. Sci. Environ. Epidemiol. 23, 566–572. doi:10.1038/jes.2013.15
Palacios Temprano, J., Eichholtz, P., Willeboordse, M., and Kok, N. (2020). Indoor environmental quality and learning outcomes: Protocol on large-scale sensor deployment in schools. BMJ Open 10, e031233. doi:10.1136/bmjopen-2019-031233
Pang, X., Shaw, M. D., Lewis, A. C., Carpenter, L. J., and Batchellier, T. (2017). Electrochemical ozone sensors: A miniaturised alternative for ozone measurements in laboratory experiments and air-quality monitoring. Sensors Actuators B Chem. 240, 829–837. doi:10.1016/j.snb.2016.09.020
Pantelic, J., Dawe, M., and Licina, D. (2019). Use of IoT sensing and occupant surveys for determining the resilience of buildings to forest fire generated PM2.5. PLoS ONE 14, e0223136. doi:10.1371/journal.pone.0223136
Pantelic, J., Liu, S., Pistore, L., Licina, D., Vannucci, M., Sadrizadeh, S., et al. (2020). Personal CO2 cloud: Laboratory measurements of metabolic CO2 inhalation zone concentration and dispersion in a typical office desk setting. J. Expo. Sci. Environ. Epidemiol. 30, 328–337. doi:10.1038/s41370-019-0179-5
Pantelic, J., Rysanek, A., Miller, C., Peng, Y., Teitelbaum, E., Meggers, F., et al. (2018). Comparing the indoor environmental quality of a displacement ventilation and passive chilled beam application to conventional air-conditioning in the Tropics. Build. Environ. 130, 128–142. doi:10.1016/j.buildenv.2017.11.026
Pantelic, J., and Tham, K. W. (2013). Adequacy of air change rate as the sole indicator of an air distribution system’s effectiveness to mitigate airborne infectious disease transmission caused by a cough release in the room with overhead mixing ventilation: A case study. HVAC&R Res. 19, 947–961. doi:10.1080/10789669.2013.842447
Pantelic, J., Webster, T., Heinzerling, D., and Paliaga, G. (2018). IoT tools for assessing building operation. ASHRAE J. 60.
Pantuck, A. J., Lee, D. K., Kee, T., Wang, P., Lakhotia, S., Silverman, M. H., et al. (2018). Artificial intelligence: Modulating BET bromodomain inhibitor ZEN-3694 and enzalutamide combination dosing in a metastatic prostate cancer patient using CURATE.AI, an artificial intelligence platform (adv. Therap. 6/2018). Adv. Ther. (Weinh). 1, 1870020. doi:10.1002/adtp.201870020
Pape, J. J., Overeem, A., Leijnse, H., Robinson, J., Steeneveld, G. J., Horn, B. K. P., et al. (2015). Urban air temperature estimation from smartphone battery temperatures. EMS Annu. Meet. Abstr. 12, 242.
Parkinson, T., Parkinson, A., and de Dear, R. (2019). Continuous IEQ monitoring system: Context and development. Build. Environ. 149, 15–25. doi:10.1016/j.buildenv.2018.12.010
Parkinson, T., Parkinson, A., and de Dear, R. (2019). Continuous IEQ monitoring system: Performance specifications and thermal comfort classification. Build. Environ. 149, 241–252. doi:10.1016/j.buildenv.2018.12.016
Paulin, L. M., and Hansel, N. N. (2016). Physical activity and air pollution exposures in the urban environment. Am. J. Respir. Crit. Care Med. 194, 786–787. doi:10.1164/rccm.201604-0889ed
Pearce, J. L., Waller, L. A., Sarnat, S. E., Chang, H. H., Klein, M., Mulholland, J. A., et al. (2016). Characterizing the spatial distribution of multiple pollutants and populations at risk in Atlanta, Georgia. Spat. Spatiotemporal. Epidemiol. 18, 13–23. doi:10.1016/j.sste.2016.02.002
Pedersen, T. H., Nielsen, K. U., and Petersen, S. (2017). Method for room occupancy detection based on trajectory of indoor climate sensor data. Build. Environ. 115, 147–156. doi:10.1016/j.buildenv.2017.01.023
Pereira, F., Lopes, S. I., Carvalho, N. B., and Curado, A. (2020). RnProbe: A LoRa-enabled IoT edge device for integrated radon risk management. IEEE Access 8, 203488–203502. doi:10.1109/access.2020.3036980
Persily, A., and de Jonge, L. (2017). Carbon dioxide generation rates for building occupants. Indoor Air 27, 868–879. doi:10.1111/ina.12383
Peters, R., Peters, J., Booth, A., and Mudway, I. (2015). Is air pollution associated with increased risk of cognitive decline? A systematic review. Age Ageing 44, 755–760. doi:10.1093/ageing/afv087
Petersen, J. E., Rosenberg Daneri, D., Frantz, C., and Shammin, M. R. (2017). “Environmental dashboards: Fostering pro-environmental and pro-community thought and action through feedback,” in Handbook of theory and practice of sustainable development in higher education: Volume 3. Editors W. Leal Filho, M. Mifsud, C. Shiel, and R. Pretorius (Berlin, Germany: Springer International Publishing), 149–168.
Piedrahita, R., Xiang, Y., Masson, N., Ortega, J., Collier, A., Jiang, Y., et al. (2014). The next generation of low-cost personal air quality sensors for quantitative exposure monitoring. Atmos. Meas. Tech. 7, 3325–3336. doi:10.5194/amt-7-3325-2014
Piwek, L., Ellis, D. A., Andrews, S., and Joinson, A. (2016). The rise of consumer health wearables: Promises and barriers. PLoS Med. 13, e1001953. doi:10.1371/journal.pmed.1001953
Plaia, A., and Ruggieri, M. (2011). Air quality indices: A review. Rev. Environ. Sci. Biotechnol. 10, 165–179. doi:10.1007/s11157-010-9227-2
Pope, C. A. (2000). Review: Epidemiological basis for particulate air pollution health standards. Aerosol Sci. Technol. 32, 4–14. doi:10.1080/027868200303885
Porter, S. R., Whitcomb, M. E., and Weitzer, W. H. (2004). Multiple surveys of students and survey fatigue. New Dir. Institutional Res. 2004, 63–73. doi:10.1002/ir.101
Potgieter, J., Nazarian, N., Lipson, M. J., Hart, M. A., Ulpiani, G., Morrison, W., et al. (2021). Combining high-resolution land use data with crowdsourced air temperature to investigate intra-urban microclimate. Front. Environ. Sci. 9. doi:10.3389/fenvs.2021.720323
Predić, B., Yan, Z., Eberle, J., Stojanovic, D., and Aberer, K. (2013). “ExposureSense: Integrating daily activities with air quality using mobile participatory sensing,” in 2013 IEEE International Conference on Pervasive Computing and Communications Workshops (PERCOM Workshops), 303–305.
Quinn, C., and McArthur, J. J. (2021). A case study comparing the completeness and expressiveness of two industry recognized ontologies. Adv. Eng. Inf. 47, 101233. doi:10.1016/j.aei.2020.101233
Quinn, C., Shabestari, A. Z., Misic, T., Gilani, S., Litoiu, M., and McArthur, J. (2020). Building automation system - BIM integration using a linked data structure. Autom. Constr. 118, 103257. doi:10.1016/j.autcon.2020.103257
Quintana, M., Abdelrahman, M., Frei, M., Tartarini, F., and Miller, C. (2021). “Longitudinal personal thermal comfort preference data in the wild,” in Proceedings of the 19th ACM Conference on Embedded Networked Sensor Systems (New York, NY, USA: Association for Computing Machinery), 556–559.
Rackes, A., Ben-David, T., and Waring, M. S. (2018). Sensor networks for routine indoor air quality monitoring in buildings: Impacts of placement, accuracy, and number of sensors. Sci. Technol. Built Environ. 24, 188–197. doi:10.1080/23744731.2017.1406274
Reinhart, C. F., Dhariwal, J., and Gero, K. (2017). Biometeorological indices explain outside dwelling patterns based on Wi-Fi data in support of sustainable urban planning. Build. Environ. 126, 422–430. doi:10.1016/j.buildenv.2017.10.026
RESET (2022). RESET®. Available at: https://www.reset.build/.
Revel, G. M., Arnesano, M., and Pietroni, F. (2014). “A low-cost sensor for real-time monitoring of indoor thermal comfort for ambient assisted living,” in Ambient assisted living (Berlin, Germany: Springer International Publishing), 3–12.
Revel, G. M., Arnesano, M., and Pietroni, F. (2014). Development and validation of a low-cost infrared measurement system for real-time monitoring of indoor thermal comfort. Meas. Sci. Technol. 25, 085101. doi:10.1088/0957-0233/25/8/085101
Revel, G. M., Sabbatini, E., and Arnesano, M. (2012). Development and experimental evaluation of a thermography measurement system for real-time monitoring of comfort and heat rate exchange in the built environment. Meas. Sci. Technol. 23, 035005. doi:10.1088/0957-0233/23/3/035005
Rim, D., Novoselec, A., and Morrison, G. (2009). The influence of chemical interactions at the human surface on breathing zone levels of reactants and products. Indoor Air 19, 324–334. doi:10.1111/j.1600-0668.2009.00595.x
Romanello, M., McGushin, A., Di Napoli, C., Drummond, P., Hughes, N., Jamart, L., et al. (2021). The 2021 report of the lancet countdown on health and climate change: Code red for a healthy future. Lancet 398, 1619–1662. doi:10.1016/S0140-6736(21)01787-6
Rotko, T., Oglesby, L., Künzli, N., and Jantunen, M. J. (2000). Population sampling in European air pollution exposure study, EXPOLIS: Comparisons between the cities and representativeness of the samples. J. Expo. Sci. Environ. Epidemiol. 10, 355–364. doi:10.1038/sj.jea.7500101
Rupp, R. F., Vásquez, N. G., and Lamberts, R. (2015). A review of human thermal comfort in the built environment. Energy Build. 105, 178–205. doi:10.1016/j.enbuild.2015.07.047
Ryu, S. H., and Moon, H. J. (2016). Development of an occupancy prediction model using indoor environmental data based on machine learning techniques. Build. Environ. 107, 1–9. doi:10.1016/j.buildenv.2016.06.039
Sabatier, J. M., and Ekimov, A. E. A. (2008). “Review of human signatures in urban environments using seismic and acoustic methods,” in 2008 IEEE Conference on Technologies for Homeland Security, 215–220.
Sae-Zhang, P., Quintana, M., and Miller, C. (2020). “Differences in thermal comfort state transitional time among comfort preference groups,” in 16th Conference of the International Society of Indoor Air Quality and Climate: Creative and Smart Solutions for Better Built Environments, Indoor Air 2020, 166587.
Salamone, F., Belussi, L., Curro, C., Danza, L., Ghellere, M., Guazzi, G., et al. (2018). Integrated method for personal thermal comfort assessment and optimization through users’ feedback, IoT and machine learning: A case study †. Sensors 18, 1602. doi:10.3390/s18051602
Salamone, F., Belussi, L., Danza, L., Ghellere, M., and Meroni, I. (2015). Design and development of nEMoS, an all-in-one, low-cost, web-connected and 3D-printed device for environmental analysis. Sensors 15, 13012–13027. doi:10.3390/s150613012
Salamone, F., Masullo, M., and Sibilio, S. (2021). Wearable devices for environmental monitoring in the built environment: A systematic review. Sensors 21, 4727. doi:10.3390/s21144727
Scapellato, M. L., Canova, C., de Simone, A., Carrieri, M., Maestrelli, P., Simonato, L., et al. (2009). Personal PM10 exposure in asthmatic adults in padova, Italy: Seasonal variability and factors affecting individual concentrations of particulate matter. Int. J. Hyg. Environ. Health 212, 626–636. doi:10.1016/j.ijheh.2009.06.001
Scarpa, M., Ravagnin, R., Schibuola, L., and Tambani, C. (2017). Development and testing of a platform aimed at pervasive monitoring of indoor environment and building energy. Energy Procedia 126, 282–288. doi:10.1016/j.egypro.2017.08.155
Schiavon, S., Yang, B., Donner, Y., Chang, V. W. C., and Nazaroff, W. W. (2017). Thermal comfort, perceived air quality, and cognitive performance when personally controlled air movement is used by tropically acclimatized persons. Indoor Air 27, 690–702. doi:10.1111/ina.12352
Schieweck, A., Uhde, E., Salthammer, T., Salthammer, L. C., Morawska, L., Mazaheri, M., et al. (2018). Smart homes and the control of indoor air quality. Renew. Sustain. Energy Rev. 94, 705–718. doi:10.1016/j.rser.2018.05.057
Schneider, P., Bartonova, A., Castell, N., Dauge, F. R., Gerboles, M., Hagler, G. S., et al. (2019). Toward a unified terminology of processing levels for low-cost air-quality sensors. Environ. Sci. Technol. 53, 8485–8487. doi:10.1021/acs.est.9b03950
Schneider, P., Castell, N., Vogt, M., Dauge, F. R., Lahoz, W. A., and Bartonova, A. (2017). Mapping urban air quality in near real-time using observations from low-cost sensors and model information. Environ. Int. 106, 234–247. doi:10.1016/j.envint.2017.05.005
Shen, W., Hao, Q., Mak, H., Neelamkavil, J., Xie, H., Dickinson, J., et al. (2010). Systems integration and collaboration in architecture, engineering, construction, and facilities management: A review. Adv. Eng. Inf. 24, 196–207. doi:10.1016/j.aei.2009.09.001
Shi, R., Hobbs, B. F., Zaitchik, B. F., Waugh, D. W., Scott, A. A., and Zhang, Y. (2021). Monitoring intra-urban temperature with dense sensor networks: Fixed or mobile? An empirical study in baltimore, MD. Urban Clim. 39, 100979. doi:10.1016/j.uclim.2021.100979
Silva, R. A., West, J. J., Lamarque, J. F., Shindell, D. T., Collins, W. J., Faluvegi, G., et al. (2017). Future global mortality from changes in air pollution attributable to climate change. Nat. Clim. Chang. 7, 647–651. doi:10.1038/nclimate3354
Sim, S. Y., Koh, M., Joo, K., Noh, S., Park, S., Kim, Y., et al. (2016). Estimation of thermal sensation based on wrist skin temperatures. Sensors 16, 420. doi:10.3390/s16040420
Singer, B. C., and Delp, W. W. (2018). Response of consumer and research grade indoor air quality monitors to residential sources of fine particles. Indoor Air 28, 624–639. doi:10.1111/ina.12463
Spinelle, L., Gerboles, M., Kok, G., Persijn, S., and Sauerwald, T. (2017). Review of portable and low-cost sensors for the ambient air monitoring of benzene and other volatile organic compounds. Sensors 17, 1520. doi:10.3390/s17071520
Steinle, S., Reis, S., and Sabel, C. E. (2013). Quantifying human exposure to air pollution–moving from static monitoring to spatio-temporally resolved personal exposure assessment. Sci. Total Environ. 443, 184–193. doi:10.1016/j.scitotenv.2012.10.098
Steinle, S., Reis, S., Sabel, C. E., Semple, S., Twigg, M. M., Braban, C. F., et al. (2015). Personal exposure monitoring of PM2.5 in indoor and outdoor microenvironments. Sci. Total Environ. 508, 383–394. doi:10.1016/j.scitotenv.2014.12.003
Tagle, M., Rojas, F., Reyes, F., Vasquez, Y., Hallgren, F., Linden, J., et al. (2020). Field performance of a low-cost sensor in the monitoring of particulate matter in Santiago, Chile. Environ. Monit. Assess. 192, 171. doi:10.1007/s10661-020-8118-4
Takada, S., Matsumoto, S., and Matsushita, T. (2013). Prediction of whole-body thermal sensation in the non-steady state based on skin temperature. Build. Environ. 68, 123–133. doi:10.1016/j.buildenv.2013.06.004
Tan, D. W., Yap, S. H., Wang, M., Fan, P. W., Teo, Y. S., Krishnasamy, P., et al. (2015). Body mass changes across a variety of running race distances in the tropics. Sports Med. Open 2, 26. doi:10.1186/s40798-016-0050-3
Tang, S., Shelden, D. R., Eastman, C. M., Pishdad-Bozorgi, P., and Gao, X. (2019). A review of building information modeling (BIM) and the internet of things (IoT) devices integration: Present status and future trends. Autom. Constr. 101, 127–139. doi:10.1016/j.autcon.2019.01.020
Tang, X., Misztal, P. K., Nazaroff, W. W., and Goldstein, A. H. (2016). Volatile organic compound emissions from humans indoors. Environ. Sci. Technol. 50, 12686–12694. doi:10.1021/acs.est.6b04415
Tawalbeh, L., Muheidat, F., Tawalbeh, M., and Quwaider, M. (2020). IoT privacy and security: Challenges and solutions. Appl. Sci. (Basel). 10, 4102. doi:10.3390/app10124102
Teitelbaum, E., Alsaad, H., Aviv, D., Kim, A., Voelker, C., Meggers, F., et al. (2022). Addressing a systematic error correcting for free and mixed convection when measuring mean radiant temperature with globe thermometers. Sci. Rep. 12, 6473. doi:10.1038/s41598-022-10172-5
Teitelbaum, E., Chen, K. W., Aviv, D., Bradford, K., Ruefenacht, L., Sheppard, D., et al. (2020). Membrane-assisted radiant cooling for expanding thermal comfort zones globally without air conditioning. Proc. Natl. Acad. Sci. U. S. A. 117, 21162–21169. doi:10.1073/pnas.2001678117
Teitelbaum, E., Chen, K. W., Meggers, F., Guo, H., Houchois, N., Pantelic, J., et al. (2020). Globe thermometer free convection error potentials. Sci. Rep. 10, 2652. doi:10.1038/s41598-020-59441-1
Teitelbaum, E., Jayathissa, P., Miller, C., and Meggers, F. (2019). Withdrawn: Design with Comfort: Enhancing the psychrometric chart with radiation and convection dimensions. Energy Build. doi:10.1016/j.enbuild.2019.07.007
Thorsson, S., Lindberg, F., Eliasson, I., and Holmer, B. (2007). Different methods for estimating the mean radiant temperature in an outdoor urban setting. Int. J. Climatol. 27, 1983–1993. doi:10.1002/joc.1537
Tian, R., Dierk, C., Myers, C., and Paulos, E. (2016). “MyPart: Personal, portable, accurate, airborne particle counting,” in Proceedings of the 2016 CHI Conference on Human Factors in Computing Systems (New York, NY, USA: ACM), 1338–1348.
Timm, S. N., and Deal, B. M. (2016). Effective or ephemeral? The role of energy information dashboards in changing occupant energy behaviors. Energy Res. Soc. Sci. 19, 11–20. doi:10.1016/j.erss.2016.04.020
Ueberham, M., and Schlink, U. (2018). Wearable sensors for multifactorial personal exposure measurements – a ranking study. Environ. Int. 121, 130–138. doi:10.1016/j.envint.2018.08.057
Ullo, S. L., and Sinha, G. R. (2020). Advances in smart environment monitoring systems using IoT and sensors. Sensors 20, 3113. doi:10.3390/s20113113
Ulpiani, G., Nazarian, N., Zhang, F., and Pettit, C. J. (2021). Towards a living lab for enhanced thermal comfort and air quality: Analyses of standard occupancy, weather extremes, and COVID-19 pandemic. Front. Environ. Sci. 9. doi:10.3389/fenvs.2021.725974
UN (2018). UN. Available at: https://www.un.org/development/desa/en/news/population/2018-revision-of-world-urbanization-prospects.html.
Valinejadshoubi, M., Moselhi, O., Bagchi, A., and Salem, A. (2021). Development of an IoT and BIM-based automated alert system for thermal comfort monitoring in buildings. Sustain. Cities Soc. 66, 102602. doi:10.1016/j.scs.2020.102602
van den Broek, J., Klein Cerrejon, D., Pratsinis, S. E., and Güntner, A. T. (2020). Selective formaldehyde detection at ppb in indoor air with a portable sensor. J. Hazard. Mat. 399, 123052. doi:10.1016/j.jhazmat.2020.123052
Varentsov, M., Fenner, D., Meier, F., Samsonov, T., and Demuzere, M. (2021). Quantifying local and mesoscale drivers of the urban heat island of moscow with reference and crowdsourced observations. Front. Environ. Sci. 9. doi:10.3389/fenvs.2021.716968
Velasco, E., and Tan, S. H. (2016). Particles exposure while sitting at bus stops of hot and humid Singapore. Atmos. Environ. X. 142, 251–263. doi:10.1016/j.atmosenv.2016.07.054
Venter, Z. S., Chakraborty, T., and Lee, X. (2021). Crowdsourced air temperatures contrast satellite measures of the urban heat island and its mechanisms. Sci. Adv. 7, eabb9569. doi:10.1126/sciadv.abb9569
von Schneidemesser, E., Steinmar, K., Weatherhead, E. C., Bonn, B., Gerwig, H., and Quedenau, J. (2019). Air pollution at human scales in an urban environment: Impact of local environment and vehicles on particle number concentrations. Sci. Total Environ. 688, 691–700. doi:10.1016/j.scitotenv.2019.06.309
Wang, H., Wang, L., Kang, H., Hwang, M. H., Lee, D. G., and Ju, D. Y. (2021). Public needs for wearable particulate matter devices and their influencing factors. Electronics 10, 3069. doi:10.3390/electronics10243069
Wang, W., Brambley, M. R., Kim, W., Somasundaram, S., and Stevens, A. J. (2018). Automated point mapping for building control systems: Recent advances and future research needs. Autom. Constr. 85, 107–123. doi:10.1016/j.autcon.2017.09.013
Wang, Y., Li, J., Jing, H., Zhang, Q., Jiang, J., and Biswas, P. (2015). Laboratory evaluation and calibration of three low-cost particle sensors for particulate matter measurement. Aerosol Sci. Technol. 49, 1063–1077. doi:10.1080/02786826.2015.1100710
Wang, Z., Delp, W. W., and Singer, B. C. (2020). Performance of low-cost indoor air quality monitors for PM2.5 and PM10 from residential sources. Build. Environ. 171, 106654. doi:10.1016/j.buildenv.2020.106654
Wang, Z., Parkinson, T., Li, P., Lin, B., and Hong, T. (2019). The Squeaky wheel: Machine learning for anomaly detection in subjective thermal comfort votes. Build. Environ. 151, 219–227. doi:10.1016/j.buildenv.2019.01.050
Wargocki, P., and Da Silva, N. (2015). Use of visual CO2feedback as a retrofit solution for improving classroom air quality. Indoor Air 25, 105–114. doi:10.1111/ina.12119
Well (2022). Well. Available at: https://v2.wellcertified.com/v/en/air.
WHO (2021). WHO global air quality guidelines: Particulate matter (PM2.5 and PM10), ozone, nitrogen dioxide, sulfur dioxide and carbon monoxide. Available at: https://www.who.int/publications/i/item/9789240034228.
Wilhelm, E., Siby, S., Zhou, Y., Ashok, X. J. S., Jayasuriya, M., Foong, S., et al. (2016). Wearable environmental sensors and infrastructure for mobile large-scale urban deployment. IEEE Sens. J. 16, 8111–8123. doi:10.1109/jsen.2016.2603158
Williams, R., Creason, J., Zweidinger, R., Watts, R., Linda Sheldon, , and Shy, C. (2000). Indoor, outdoor, and personal exposure monitoring of particulate air pollution: The baltimore elderly epidemiology-exposure pilot study. Atmos. Environ. X. 34, 4193–4204. doi:10.1016/s1352-2310(00)00209-0
Wolkoff, P. (1998). Impact of air velocity, temperature, humidity, and air on long-term voc emissions from building products. Atmos. Environ. X. 32, 2659–2668. doi:10.1016/s1352-2310(97)00402-0
Wolkoff, P., and Nielsen, G. D. (2001). Organic compounds in indoor air—Their relevance for perceived indoor air quality? Atmos. Environ. X. 35, 4407–4417. doi:10.1016/s1352-2310(01)00244-8
Wong, M. S., Yip, T. P., and Mok, E. (2014). Development of a personal integrated environmental monitoring system. Sensors 14, 22065–22081. doi:10.3390/s141122065
Wörner, D., von Bomhard, T., Röschlin, M., and Wortmann, F. (2014). “Look twice: Uncover hidden information in room climate sensor data.” in 2014 International Conference on the Internet of Things (IOT) (Cambridge, MA, USA: IEEE), 25–30.
Xie, X., Semanjski, I., Gautama, S., Tsiligianni, E., Deligiannis, N., Rajan, R., et al. (2017). A review of urban air pollution monitoring and exposure assessment methods. ISPRS Int. J. Geoinf. 6, 389. doi:10.3390/ijgi6120389
Xu, J., Jiang, H., Zhao, H., and Stephens, B. (2017). Mobile monitoring of personal NOx exposures during scripted daily activities in chicago, IL. Aerosol Air Qual. Res. 17, 1999–2009. doi:10.4209/aaqr.2017.02.0063
Xu, S., Zou, B., Lin, Y., Zhao, X., Li, S., and Hu, C. (2019). Strategies of method selection for fine-scale PM2.5 mapping in an intra-urban area using crowdsourced monitoring. Atmos. Meas. Tech. 12, 2933–2948. doi:10.5194/amt-12-2933-2019
Yang, J., Santamouris, M., and Lee, S. E. (2016). Review of occupancy sensing systems and occupancy modeling methodologies for the application in institutional buildings. Energy Build. 121, 344–349. doi:10.1016/j.enbuild.2015.12.019
Yang, L., Li, W., Ghandehari, M., and Fortino, G. (2018). People-centric cognitive internet of things for the quantitative analysis of environmental exposure. IEEE Internet Things J. 5, 2353–2366. doi:10.1109/jiot.2017.2751307
Young, D. T., Chapman, L., Muller, C. L., Cai, X.-M., and Grimmond, C. S. B. A. (2014). A low-cost wireless temperature sensor: Evaluation for use in environmental monitoring applications. J. Atmos. Ocean. Technol. 31, 938–944. doi:10.1175/jtech-d-13-00217.1
Zanella, A., Bui, N., Castellani, A., Vangelista, L., and Zorzi, M. (2014). Internet of things for smart cities. IEEE Internet Things J. 1, 22–32. doi:10.1109/jiot.2014.2306328
Zhai, Y., Zhang, Y., Zhang, H., Pasut, W., Arens, E., and Meng, Q. (2015). Human comfort and perceived air quality in warm and humid environments with ceiling fans. Build. Environ. 90, 178–185. doi:10.1016/j.buildenv.2015.04.003
Zhang, H., Arens, E., Huizenga, C., and Han, T. (2010). Thermal sensation and comfort models for non-uniform and transient environments, part III: Whole-body sensation and comfort. Build. Environ. 45, 399–410. doi:10.1016/j.buildenv.2009.06.020
Zhang, H., Srinivasan, R., and Ganesan, V. (2021). Low cost, multi-pollutant sensing system using raspberry pi for indoor air quality monitoring. Sustainability 13, 370. doi:10.3390/su13010370
Zhang, R., Ravi, D., Yang, G., and Lo, B. (2017). “A personalized air quality sensing system - a preliminary study on assessing the air quality of London underground stations,” in 2017 IEEE 14th International Conference on Wearable and Implantable Body Sensor Networks (BSN) (Eindhoven, Netherlands: IEEE), 111–114. doi:10.1109/BSN.2017.7936020
Zhong, S., Alavi, H. S., and Lalanne, D. (2020). “Hilo-wear: Exploring wearable interaction with indoor air quality forecast,” in Extended Abstracts of the 2020 CHI Conference on Human Factors in Computing Systems (New York, NY, USA: Association for Computing Machinery), 1–8.
Zhu, J., and Wu, P. (2022). BIM/GIS data integration from the perspective of information flow. Autom. Constr. 136, 104166. doi:10.1016/j.autcon.2022.104166
Zhuang, Y., Lin, F., Yoo, E. H., and Xu, W. (2015). “AirSense: A portable context-sensing device for personal air quality monitoring,” in Proceedings of the 2015 Workshop on Pervasive Wireless Healthcare (New York, NY, USA: ACM), 17–22.
Zikova, N., Hopke, P. K., and Ferro, A. R. (2017). Evaluation of new low-cost particle monitors for PM2.5 concentrations measurements. J. Aerosol Sci. 105, 24–34. doi:10.1016/j.jaerosci.2016.11.010
Keywords: IoT environmental sensing, air quality, indoor air quality, thermal comfort, personal exposure, personal comfort
Citation: Pantelic J, Nazarian N, Miller C, Meggers F, Lee JKW and Licina D (2022) Transformational IoT sensing for air pollution and thermal exposures. Front. Built Environ. 8:971523. doi: 10.3389/fbuil.2022.971523
Received: 17 June 2022; Accepted: 10 October 2022;
Published: 24 October 2022.
Edited by:
Hasim Altan, Arkin University of Creative Arts and Design (ARUCAD), CyprusReviewed by:
Claudio Martani, Purdue University, United StatesPrathap Ramamurthy, City College of New York (CUNY), United States
Copyright © 2022 Pantelic, Nazarian, Miller, Meggers, Lee and Licina. This is an open-access article distributed under the terms of the Creative Commons Attribution License (CC BY). The use, distribution or reproduction in other forums is permitted, provided the original author(s) and the copyright owner(s) are credited and that the original publication in this journal is cited, in accordance with accepted academic practice. No use, distribution or reproduction is permitted which does not comply with these terms.
*Correspondence: Jovan Pantelic, jovan.pantelic@delos.com