Minimising damage to houses by designing for high internal pressures
 Korah Parackal
 Geoff Boughton
  David Henderson
- Cyclone Testing Station, College of Science and Engineering, James Cook University, Townsville, QLD, Australia
Internal pressurisation of buildings during a severe wind event, such as a tropical cyclone or thunderstorm, can often cause severe structural failures, as observed during damage investigations. Wind loading standards worldwide provide design data for internal pressure design. However, the implementation of these data often depends on the location of the building in relation to the levels of wind hazard in the relevant country. Recent observations during Tropical Cyclone (TC) Seroja in an intermediate wind region (wind region B) in Western Australia indicated the need for the design for full internal pressures of buildings in this wind region. This paper presents an overview of the damage investigation conducted after TC Seroja that highlights significant damage to buildings due to the lack of design for internal pressures. Additionally, a case study of a house modelled using the vulnerability analysis software VAWS is presented showing the improvements in the performance of buildings designed for internal pressures. TheVAWS models showed that both the design for full internal pressure and the use of debris rated shutters were both effective at reducing the level of serious structural damage and making houses more resilient. The robustness and resilience of buildings increase significantly if they are designed for high internal pressure because the failure of a window or door (a local failure) will not lead to a major structural failure.
1 Introduction
Internal pressurisation of buildings during a windstorm is caused by openings in the building envelope. Openings on the windward wall can cause positive internal pressures that can significantly increase the net uplift loads within the structural system of a building and can lead to severe structural failures unless the design engineer has anticipated those internal pressures. An opening on a side wall can lead to significant negative internal pressures (suction), which can increase the net wind load across a windward wall. These openings can be caused by a number of scenarios: doors or windows may have been left open for ventilation; they may have been opened as part of the operation of the building; they may have broken under differential wind pressure if the door or window is not wind-rated to the appropriate pressure; or in some cases, wind-borne debris may impact the building and cause an opening in the building envelope. While most of these scenarios can lead to an opening on any wall, wind-borne debris will always strike a windward wall.
Net uplift loads are the vector sum of external wind loads due to suction on the outside of the roof and internal wind loads due to positive internal pressures. Damage to the roofing or the roof structure can occur if they have not been designed to resist the higher net uplift load that comes with internal pressurisation.
There are two approaches to internal pressure design that can be prescribed in Codes and Standards: One method is to design the building for high internal pressure, assuming that there will be a breach in the building envelope. This approach is required for Australia’s cyclonic regions (C and D). The other design approach is to assume that the building envelope remains intact and evaluate net pressures using a lower internal pressure. The assumptions in this approach are that windows and doors can be closed in preparation for a storm and that the probability of debris impact in most events is low. Design using low internal pressure is currently adopted by most engineers in Australia’s non-cyclonic and intermediate wind regions (A and B) when designing according to the Australian Standards AS/NZS 1170.2 (2021) and AS 4055 (2021).
The American Standard ASCE (2022) classifies buildings as enclosed, partially enclosed, partially open and open, with internal pressure coefficients provided for each classification. Houses are generally classified as enclosed buildings and as such follow a similar design philosophy as the Australian standards for wind regions A and B. However, houses in hurricane prone regions of the United States are required to have glazed openings protected with an impact protection system or use impact resistant glazing.
Internal pressures in buildings due to wind have been the subject of extensive research (Holmes, 1979; Vickery, 1986, 1994) including full-scale (Ginger and Letchford, 1999; Humphreys et al., 2019; Estephan et al., 2021) and wind tunnel model-scale studies (Kopp et al., 2008; Bodhinayake et al., 2020). This paper has used the findings of this research to inform the modelling of building response to openings that may occur during wind events.
Damage investigations in Australia and North America, where light framed construction is predominant, have indicated that internal pressurization is a common cause of severe structural failures (Boughton et al., 2011; Morrison et al., 2014). Where designers have not anticipated high positive internal pressure, these damage investigations have indicated the following failure modes due to higher net uplift forces than the capacity of tie-down details: failure of roof cladding at the cladding fasteners; failure of batten-to-rafter connections; failure of roof trusses or within the roof structure; or separation of the roof structure from the top of the walls. A recent damage investigation in Australia (Boughton et al., 2021) that explored the role of internal pressure in these mechanisms is presented in Section 3. Section 4 presents a summary of computer modelling of some damage mitigation strategies - designing a building for full internal pressure or providing full envelope protection by the installing shutters on windows and doors.
2 Internal pressure design
The net loads and pressures on the roof, walls, and structural and cladding components are a combination of internal and external pressures across the building envelope. Figure 1 shows a sealed building; no openings allow air into the internal space. The external pressures are represented by arrows. Negative pressures (suction) are shown by arrows that point away from the surface. Suction pressures on the external surface of the roof apply upward forces to the building. The wind applies positive pressures on only the windward wall.
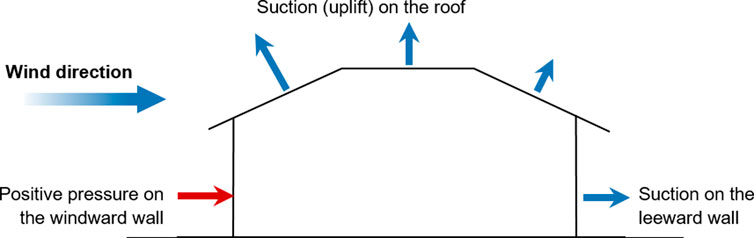
FIGURE 1. Typical external pressures on a sealed building.
If the envelope is not sealed, and has one or more openings, the resulting internal pressure is a function of the number, size, and location of the openings and the permeability (leakage) of the building. If there is only an opening in a windward wall, the internal pressure will be very close to the positive pressure at the opening.
This situation is illustrated in Figure 2 and shows that the net pressure across the roof is the sum of upward pressure on the underside of the roof and upward suction on the external surface of the roof. The net pressure on the roof in Figure 2 is significantly higher than the net pressure in Figure 1. Therefore, openings in the windward wall can substantially affect the net pressures on all the building elements.
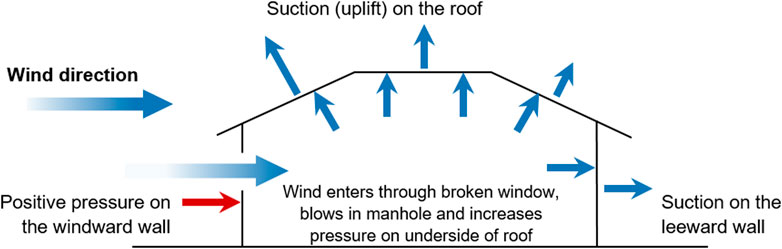
FIGURE 2. Typical internal pressures on a building with an opening on a windward wall.
2.1 Cyclonic and non-cyclonic wind regions
Figure 3 shows the wind regions in Australia (Wind regions C and D are currently designated cyclonic regions.)
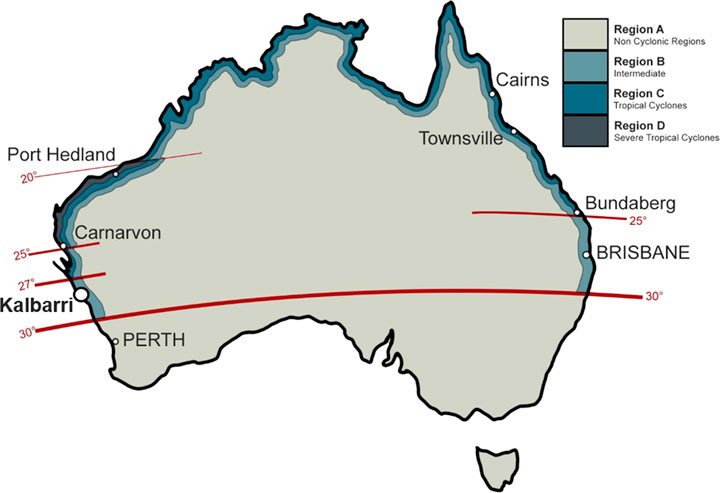
FIGURE 3. Wind regions in Australia.
Critical winds (near the ultimate design wind speed) tend to be caused by short-duration events such as severe thunderstorms in the non-cyclonic regions, and by tropical cyclones in the cyclonic regions. Tropical cyclones can last for many hours but thunderstorms typically have strong winds for minutes. This difference means that tree branches and building debris picked up by the wind in tropical cyclones can travel further and have a higher probability of hitting another building compared with winds in thunderstorms. As well, after an opening has been created in a building envelope during a tropical cyclone, there is a very high chance that a subsequent gust will cause simultaneous internal and external pressures and lead to increased net pressures across the roof, as illustrated in Figure 2.
2.2 Current strategies for internal pressure design in Australia
A building’s performance under the net pressures shown in Figure 2 is determined by whether the designer assumed there would be an opening in a windward wall (e.g., a broken window or door) when designing the tie-downs.
Two wind loading standards are used in Australia: AS/NZS 1170.2 (2021) for wind loads on any building, and AS 4055 (2021) for wind loads on houses only.
2.2.1 Wind loads on houses using AS 4055
AS 4055 is a simplified wind loading standard for houses and is generally compatible with AS/NZS 1170.2. Design according to AS 4055 assumes a sealed building envelope for non-cyclonic regions (internal pressure coefficient,
2.2.2 Wind loads on any building using AS/NZS 1170.2
Over the past decade, AS/NZS 1170.2 provisions have been amended several times to clarify the intention of the assumptions made about internal pressures and limit the options available for the cyclonic wind regions. AS/NZS 1170.2 allows the designer more flexibility based on the type of structure being designed, and the selection of internal pressure coefficients depends on the size of normal openings assumed and if other openings can be formed due to wind loads or debris impact.
For buildings in all wind regions (cyclonic and non-cyclonic) non-wind-rated windows and doors must be considered openings unless they are capable of resisting the wind loads caused by the ultimate design wind speed. Few swinging entrance doors in houses are rated for wind pressures, so these doors should be treated as potential openings. Internal pressures in any building with large openings are evaluated by considering the ratio of the open area on the wall with the large opening to the open area on all other walls. The open area is the face area of any assumed openings plus leakage on the same wall. Leakage is typically between 0.1% of the wall area for relatively well-sealed buildings to more than 1% for sheds. A table in AS/NZS 1170.2 relates the
In cyclonic regions, parts of buildings less than 25 m above the ground must be designed for internal pressures based on an opening area on one surface greater or equal to twice the area of openings on all other wall and roof surfaces. Typically, these requirements for cyclonic regions result in positive internal pressure coefficients,
For buildings in non-cyclonic regions, AS/NZS 1170.2 also requires the designer to consider possible openings in the building. Doors including large access doors and windows that are normally closed must be considered openings unless they are designed to resist ultimate limit state wind pressures. However, the requirement for debris resistance of these doors and windows is not required in non-cyclonic regions. Designers often choose the internal pressure that leads to the lowest structure cost and use the lowest internal pressure in the options available. They therefore often use a positive internal pressure coefficient
Although not mandated in the Australian codes and standards, debris screens over windows have the potential to reduce the chance of internal pressurization occurring. Debris screens can reduce the likelihood of severe structural failures occurring in buildings that have not been designed for high internal pressure.
3 Tropical cyclone Seroja
Tropical Cyclone Seroja (TC Seroja) crossed the wind region B coast just south of Kalbarri, Western Australia on 11 April 2021, as shown in Figure 4. It was classified as a category three tropical cyclone and had a central pressure of 971 hPa. Its predicted maximum wind speed at landfall was 170 km/h (Bureau of Meteorology, 2021). An anemometer close to Kalbarri recorded a peak 0.2 s gust of around 50 m/s (180 km/h). Satellite images of the cyclone and computer models of the wind field showed that Kalbarri experienced the passage of the eye wall. Figure 4 showed that after crossing the coast, TC Seroja continued to track over agricultural areas and caused severe damage to buildings in several towns along its path. Insurance claims to date for this event exceed $336M (Insurance Council of Australia, 2022) from a total affected population along its 500 km path of less than 50,000 people. The investigation of structural damage of buildings focused on Kalbarri, a growing town with around 700 houses, including around 120 contemporary buildings.
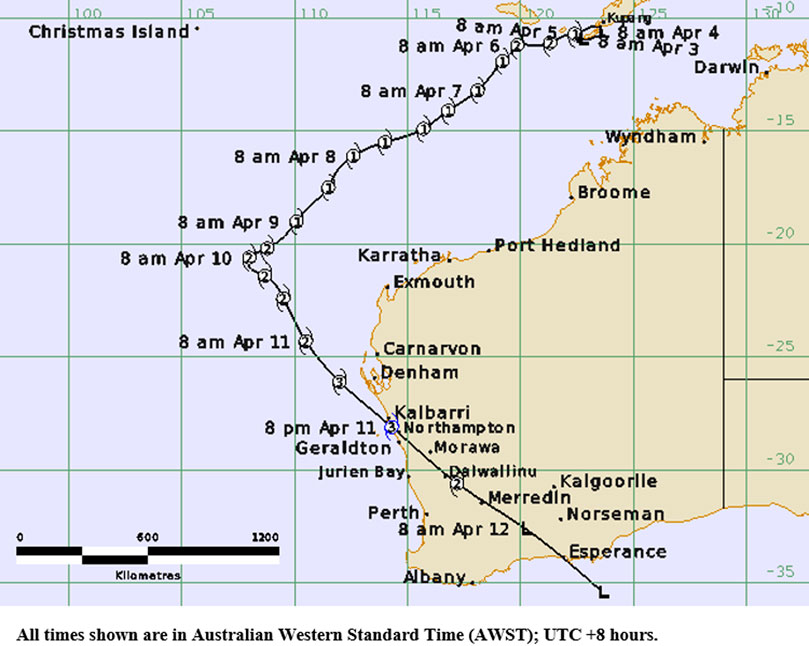
FIGURE 4. Track of TC seroja (Bureau of Meteorology).
3.1 Damage investigation
The Cyclone Testing Station led a joint damage investigation with the Western Australian Department of Fire and Emergency Services and the Western Australian Department of Mines Industry, Regulation and Safety (Boughton et al., 2021). As part of this work, all Bureau of Meteorology and some other anemometer records were analysed to establish a wind field. The design wind speeds for all buildings in the affected areas were not exceeded in TC Seroja. The most significantly affected areas around Kalbarri would have experienced winds lower than 90% of the appropriate design wind speed.
The investigation team spent most of its time in the coastal town of Kalbarri that experienced the highest wind speeds as the cyclone crossed the mid-west coast. The investigation focused mainly on contemporary buildings defined as those constructed in the past 20 years. Over the past 20 years, the design wind speed for wind region B has remained unchanged and most structural provisions for the design and construction of houses in wind region B have not changed significantly. Houses built during this period reflect the current requirements in the National Construction Code.
The most common construction types for houses in Kalbarri were double brick houses with timber-framed roofs, or timber- or steel-framed houses. All of the buildings in the affected region were designed using previous versions of AS 4055 or AS/NZS 1170.2, which classified this part of the coast as non-cyclonic region B. Nearly all buildings would have been designed for low internal pressure. In many cases, the building had successfully resisted wind actions during previous storms and during TC Seroja until the building envelope was breached. The investigation found that the capacities of the roof tie-down connections were exceeded immediately after the internal pressure increased in response to the windward wall damage. Figure 5 shows some significant roof damage following the failure of an element on the windward wall.
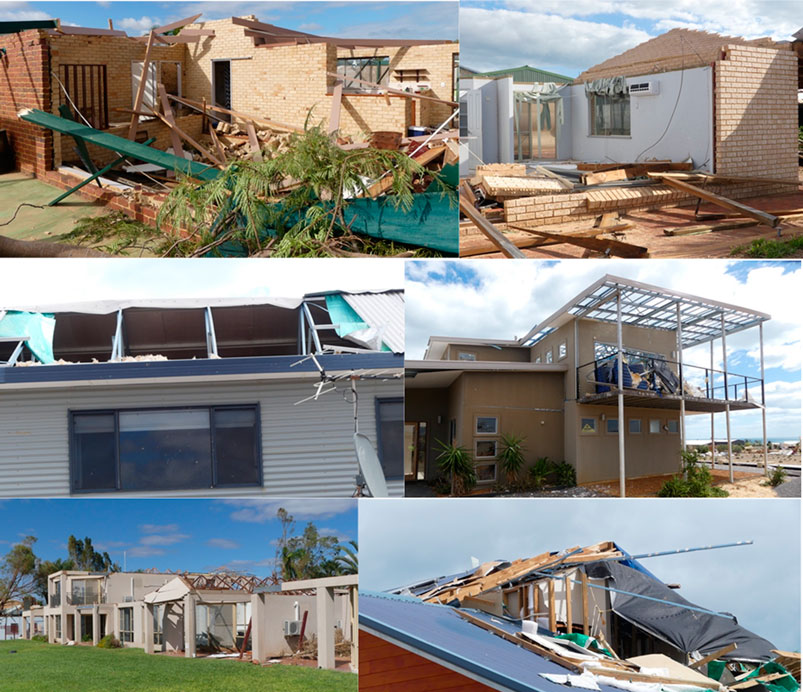
FIGURE 5. Roof damage because of high internal pressure.
Damage Assessments coordinated by the State Emergency Services (SES) systematically assessed all buildings in the town to determine if they were habitable and if they needed tarpaulins. The SES Damage Assessments showed that around 70% of all buildings had some damage to the roof, ranging from minor flashing damage through to complete loss of roof structure. This made it impossible to inspect all damaged houses in detail in the time before the clean-up removed all of the structural evidence.
The SES Damage Assessment estimated that more than 10% of the contemporary houses in Kalbarri had significant damage to the roof (more than half of the roof area damaged). The joint damage investigation team studied around two-thirds of these houses and found for all of the contemporary houses with significant roof damage that were inspected, the damage was initiated by internal pressure following damage to doors or windows. Occupants reported that roof loss occurred immediately after windward windows or doors broke. In some cases, door furniture such as latches failed, which allowed doors to blow in. Garage doors failed by becoming free from their tracks, or windows broke under wind pressure. In other cases, wind-borne debris broke elements of the envelope on the windward side of the building. The debris included tree branches, sheets of metal or fibre cement roofing, individual tiles, and portions of roofs or verandas. The damage sequence in all of the inspected buildings was based on the way walls had collapsed, the final position of doors or windows in the damaged house or debris from an external source found on the floor under the damaged components.
Several contemporary houses that were inspected during the investigation and had only minor roof damage had not experienced high internal pressure (In these cases, there was no evidence of window or door failures.)
However, after examining two-thirds of the contemporary houses that had significant roof damage, and finding that the damage in every case was initiated by internal pressure, there is confidence in concluding that in most cases where contemporary houses experienced significant damage in TC Seroja, internal pressure was instrumental in the failure.
If a building is designed for low internal pressure, then any local damage to the windward wall in a tropical cyclone can start a process that leads to significant structural damage to the roof. A structural performance requirement in the National Construction Code reads: “A building … must be designed to sustain local damage, with the structural system as a whole remaining stable and not being damaged to an extent disproportionate to the original local damage.” This is the principle of robustness and the loss of a roof because a window or door breaks does not satisfy this principle. Contemporary houses in wind region C that have experienced recent tropical cyclones have not demonstrated the same sensitivity to internal pressure because designers are required to design for full internal pressure in the cyclone-prone regions. TC Seroja demonstrated much higher levels of significant roof damage in contemporary houses because designers had not been required to design for full internal pressure in wind region B.
Internal pressure has also played a role in building failures where the roof damage was significant in other wind events in Wind Region A (Boughton and Falck, 2008), and in Wind Region B (Leitch et al., 2008). Similar observations have been made after tropical cyclones in other countries e.g., TC Evan (Walker, 2013) and TC Winston (Yee, 2016) in Fiji, and tornadoes and hurricanes in the United States (Minor, 1994; Morrison et al., 2014). In many of the significantly damaged buildings in these events, designers had not been required to design the building for full internal pressure.
There have been several other non-documented investigations of smaller events in non-cyclone areas of Dubbo and Port Stephens NSW, and Dianella, Hilton, and Beeliar in WA. In each of these storm events, roofs of buildings were completely removed following the failure of windows and doors or where doors and windows were left open, while similar buildings nearby without openings had minimal roof damage.
TC Seroja demonstrated that buildings are currently vulnerable to wind loads if designed for an internal pressure coefficient,
4 VAWS modelling–case study
Vulnerability and Adaptation to Wind Simulation (VAWS) is a software package that has been developed to model the vulnerability of small buildings such as houses and light industrial sheds to wind loading. It is publicly available via Geoscience Australia (Geoscience Australia, 2020). Previous work documenting the development of the VAWS software is presented in Smith et al. (2020).
VAWS uses probability-based reliability analysis and structural analysis to model the loading and response of houses under wind loads. It is based on models developed from the results of damage assessments, research on internal pressures and an extensive test database of component properties. It calculates the extent of damage that could be experienced by houses under different wind speeds. By changing the attributes of buildings, VAWS can also be used to estimate the change in vulnerability afforded by retrofit measures that improve a building’s resilience to windstorms.
4.1 Overall program logic
The VAWS model applies a component-based approach to modelling vulnerability based on the premise that overall building damage is related to the failure of key connections. The program requires a user-specified building model for the house type and assigns values to parameters from probability distributions. These parameters include structural component spacings, component and connection strengths, external pressure coefficients, shielding factors, wind speed profile with height, building orientation with respect to wind direction, debris damage parameters, leakiness of the envelope to wind-driven rain, and component masses. For a given building configuration, VAWS analyses the structural response for a range of wind velocity increments. For each wind speed increment, VAWS calculates the forces in all critical connections using influence coefficients and assesses which connections have failed. It translates these into a damage scenario, estimates the costs of the repair and calculates a damage index at each wind speed.
4.1.1 Roof damage and load redistribution
The VAWS program accounts for load redistribution and progressive failures of the roof structure by using structural analysis methods with several simplifying assumptions. Connections considered in the analysis are cladding fasteners, batten to rafter connections and rafter to wall connections. The program relates pressures applied on envelope zones to the loads on cladding connections and the supporting structure using influence coefficients. Once connections have failed, the effects of redistribution are preserved for subsequent wind speed increments so that subsequent higher wind loads act on the damaged structure. Redistribution of loads following connection failures is modelled by changing the values of the influence coefficients depending on the position of the failed connection in the load path.
4.1.2 Wind-borne debris and water ingress
Wind-borne debris impact on the envelope and the resulting damage is simulated by modelling the generation, trajectories and impact of debris in VAWS by a dedicated module (Holmes et al., 2010; Wehner et al., 2010). Additionally, water ingress at each increment is evaluated using user-defined empirical relationships as a function of wind speed and the extent of current damage to the house envelope. The level of water ingress is estimated so that the repair costs associated with water damage to internal linings can be estimated.
4.1.3 Damage costing
VAWS determines a repair cost for a damaged house by modelling the damage state(s) of the house at each wind speed and then costing the repair work. The modelled house may have experienced one or more damage states (for example, loss of roof sheeting and debris damage to walls). The repair cost for each damage state is made up of three components calculated separately: repair of the external envelope, repair of consequential damage to the interior, and repair of internal linings and fittings caused by water ingress.
VAWS expresses repair costs as a damage index calculated in Eq. 1:
4.2 VAWS analysis of a modern brick veneer house
The VAWS vulnerability modelling software was used to perform a case study on a house with a timber-framed roof, brick veneer walls and a metal sheet roof with different strategies of internal pressure design. The case study house was 19.3 m long and 10 m wide with a 22.5-degree roof pitch, as shown in Figure 6. The roof structure consisted of prefabricated timber trusses at 900 mm centres with battens at nominally 900 mm centres. Although several house types exist in each wind region in Australia, for light-framed construction, the effects of internal pressurization are similar, therefore a single house type was selected as an example for this paper.
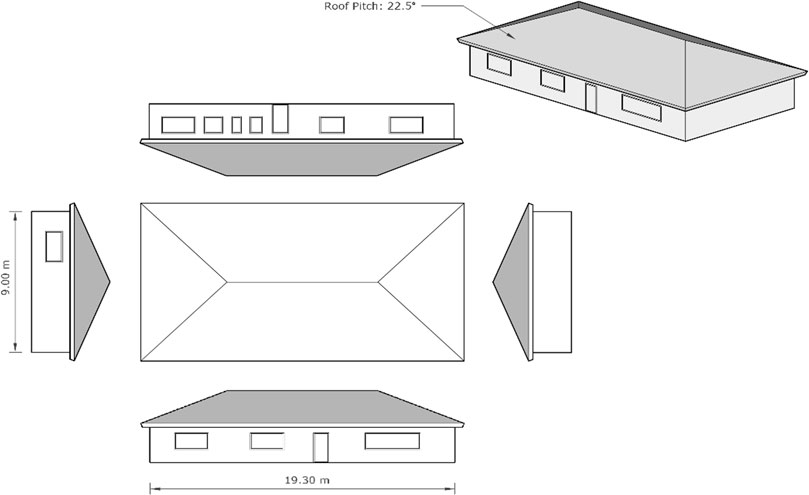
FIGURE 6. Case study house.
4.2.1 Modelling scenarios
Three scenarios were modelled using the VAWS software. These scenarios were based on wind classifications from AS 4055:2021:
- N2—A house designed for low internal pressure. This would usually be the case in wind Region B under current wind standards. The “N” refers to a non-cyclonic internal pressure design specification (Cp,i = +0.2, –0.3).
- C1—A house designed for high internal pressures. This scenario represents the performance of the same house with higher specification tie-downs. The “C” refers to a cyclonic internal pressure design specification (Cp,i = +0.7, –0.65).
- N2 + window and door protection–A house designed for low internal pressure (Cp,i = +0.2, –0.3 as illustrated in Figure 1), but with the addition of debris-rated shutters for all windows and doors. The shutters will minimise the chance of internal pressurisation due to debris impact or windows and doors blowing in under wind pressures.
Connections specified in Australian framing manuals were used in the case studies (AS 1684.2, 2021; AS 1684.3, 2021). Log normal probability distributions for connection strengths were derived from the characteristic strengths of the connection details specified in the framing manuals. Modifications were made to some connection models to reproduce accurate load redistribution behaviour and failure modes seen in damage surveys. For each scenario, 100 realisations of the VAWS simulation were run with different parameters defined by the probability distributions. This gave the range of performances that could be expected with slightly different variations of connection strengths within the same house type.
4.2.2 VAWS outputs
The outputs from the 100 VAWS realisations for each internal pressure scenario are shown in Figure 7. The x axes of these plots are the 0.2 s gust wind speed at 10 m height at the location of the house. The y axis is a damage index, defined as the cost of the damage divided by the replacement cost of the house, defined in Eq. 1. Each wind increment for each realisation produced a single black dot corresponding to the damage index for the wind speed at each increment.
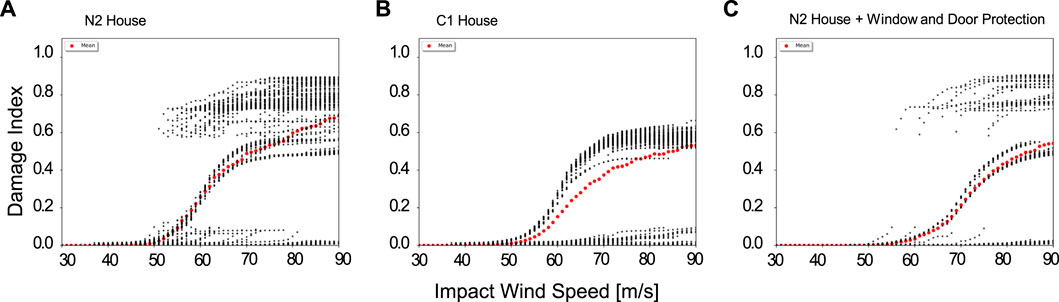
FIGURE 7. Vulnerability functions generated by the VAWS software for the case study house. (A) for an N2 wind rated house, (B) for a C1 wind rated house and (C) for a N2 wind rated house with window and door protection.
For each wind increment, the 100 points corresponding to the 100 replications were averaged to give the average damage index across the population of houses. This is shown as the red dotted lines in Figure 7. It should be noted that the spread of the data about the mean for each wind increment does not follow a single probability distribution and is multi-modal in nature. Each failure mode of the modelled structure gives a grouping of data that may differ considerably from the mean of all the failure modes.
Figure 7A shows the following observations for the N2 house. There are three damage states:
1. The lowest cluster of dots corresponds to houses with relatively strong connections, no debris or wind damage to the envelope, but with low leakage so levels of damage from water ingress are relatively low. As some elements fail with increasing wind speed, buildings jump from this damage state to the third damage state directly without going through the second damage state.
2. The intermediate damage state corresponding to the S-shaped cluster of black points represents water ingress to houses with leakage paths for water ingress. This portion of the curve also includes some cases of failures of individual minor connections and accompanying water ingress damage. The damage index increases as the wind speed increases.
3. The highest cluster of dots corresponds to houses in which a failure of a door or window has led to internal pressurisation of the house and caused significant roof damage. The damage index for this mode of failure was between 0.6 and 0.9. This damage state starts at the wind speed at which connections do not have the capacity to resist the extra loads that are caused by internal pressure. The damage index is high for this damage state.
Figure 7B shows the following observations for the C1 house. There are two damage states:
1. The lowest cluster of dots again corresponds to houses with relatively strong connections, and with low levels of damage from water ingress. Because the connections in C1 houses are stronger than those in N2 houses, there are more houses in this damage state.
2. The intermediate damage state corresponding to the S-shaped cluster of black points represents water ingress to houses with leakage paths for rain-water penetration. The damage index increases as the wind speed increases. Because damage from water ingress is not significantly changed by improving the strength of the connections, this damage state is similar to the one shown in Figure 7A.
3. Note that the highest cluster of dots shown in Figure 7A is completely missing in the C1 scenario as the tie-downs have sufficient strength to prevent roof damage following any failure of a window or door on the windward wall.
Figure 7C shows the following observations for the N2 house (window and door protection). There are three damage states:
1. The lowest cluster of dots is compressed compared with the N2 house in Figure 7A though it contains more points. The shutters significantly reduced the amount of water ingress through windows and doors, which has substantially reduced the level of water damage to linings. Most of the points lie on the zero damage index line. There are still a few houses in which roof connections fail and damage progresses rapidly through the roof leading to the third damage state without going through the second damage state.
2. The intermediate damage state corresponding to the S-shaped cluster of black points represents water ingress to houses with leakage paths for rain-water penetration. The rain protection offered by the shutters minimises the water ingress for this scenario, so there are fewer houses in this damage state.
3. The highest cluster of dots in this scenario is from houses in which some connections have failed and overloaded adjacent connections. The failure has spread throughout a significant portion of the roof giving a high damage index. There were no cases of high internal pressure with this scenario as all openings were protected.
Figure 7 shows the significant effect on damage from two different methods of addressing internal pressure:
• Design of the house to resist high internal pressure completely removed the damage state associated with overstressing roof connections due to internal pressure. It should be noted that the damage index calculated by VAWS also includes the effects of water ingress. Interrogating the model damage data further revealed that houses that no longer experienced failures due to internal pressure still experienced some water damage.
• Protection of windows and doors with shutters significantly reduced the occurrence of high internal pressure. In addition, the improvement in water ingress performance led to a reduction in damage to linings caused by water.
The highest damage state is associated with damage to the roof which leads to significant production of wind-borne debris, increasing the likelihood of creating openings in other houses. In Figure 7, the highest amount of debris would be released in the N2 scenario and the least in the C1 scenario. If whole communities are constructed to an N2 specification, then VAWS may underestimate the extent of the debris released and therefore the extent of severe damage may be even higher than that shown in Figure 7A.
5 Discussion
Wind loading standards such AS/NZS 1170.2 and AS 4055 incorporate high internal pressure from large openings for tropical cyclone areas, but not for non-cyclone areas. TC Seroja demonstrated that there is a strong case for requiring the design for higher internal pressure in intermediate wind regions such as Australia’s wind region B.
Design for internal pressure in most wind standards (e.g., AS/NZS 1170.2) requires engineers to consider a number of different scenarios for openings in the building envelope:
• Doors or windows left open for ventilation.
• Doors opened to get people into the building just before the peak gust arrives and the wind at the time makes it difficult to close.
• Garage doors opened to put vehicles away at the last minute before the wind event arrives.
• Failure of door or window latches, so that doors or windows blow in.
• Doors or windows struck by wind-borne debris. Observations have shown that trampolines, unsecured garden sheds and light outdoor furniture can become wind-borne debris at wind speeds significantly below the design wind speed. They could break windows or doors before a peak gust occurs.
• Un-rated windows and doors fail at wind speeds before the peak gust arrives.
The first three scenarios above can happen for wind events that occur with little warning, such as thunderstorm downbursts, but generally not for tropical cyclones where there is ample opportunity to prepare the building for the approaching winds. The last three opening scenarios could happen in any kind of wind event.
Currently, designers must assume doors and windows could become openings if they are not appropriately wind-rated. In Australian cyclone regions, high internal pressure must be used in design to resist the internal pressures that may occur if debris breaches the building envelope (Potential wind-borne debris is much more likely in long-duration tropical cyclones than in short-duration storms.) However, the first three opening scenarios can happen without the need for debris and could cause large internal pressures for short duration events. Designing all buildings for the possibility that there will be an opening on the windward wall will lead to the lowest probability of structural damage during a wind event in any wind region.
VAWS modelling of the response of houses to wind shows that design for full internal pressure is an effective way of reducing the level of serious structural damage and making houses more resilient. The robustness and resilience of buildings increase significantly if they are designed for high internal pressure because the failure of a window or door (a local failure) will not lead to a major structural failure.
VAWS showed that both the design for full internal pressure and the use of debris rated shutters were both effective at reducing the damage index at a given wind speed. However, fitting or closing shutters require more warning than is available before thunderstorms or downbursts, so is not a fail-safe solution for these wind events.
The costs associated with designing the whole structure to resist the higher internal pressure associated with openings on the windward wall are estimated to be around 1% of the building value in new construction. While events such as TC Seroja provide the economic justification of this cost for areas that could experience tropical cyclones, an economic justification of the benefit in the non-cyclone areas has yet to be performed. Where houses have already been designed with an assumption of low internal pressure, the VAWS model shows that retrofitting tie-down details is effective at reducing the level of damage.
6 Conclusion
Both the investigation of damage in wind events and simulation of wind damage in VAWS demonstrated that the design of the complete building for high internal pressures assuming the worst combination of openings can reduce levels of structural damage to the roof, and improve the resilience and robustness of buildings.
It is recommended that all buildings, including houses, in all wind regions are designed for high internal pressures to improve their resilience. This will make buildings robust i.e., able to retain their roof even if windows and doors suffer local damage or if some doors or windows are left open at the time of the event.
To facilitate this recommendation, the scenarios currently used in Australian Standards for wind actions for internal pressures in the tropical cyclone regions need to be extended to all wind regions. This will simplify the process of design for internal pressure as the same requirements will apply whether or not the building is in a cyclone region.
TC Seroja provided the justification to design for full internal pressure for wind region B, but further work is required to quantify the benefit in wind regions A.
Data availability statement
The raw data supporting the conclusions of this article will be made available by the authors, without undue reservation.
Author contributions
KP developed the concept of the paper and performed the vulnerability analyses using the VAWS software. GB and DF performed the damage investigation and presented the findings from Tropical Cyclone Seroja. DH and GB Provided editorial guidance on the paper and interpretation of the Australian Standards. DH and GB additionally provided a review of the vulnerability analysis outputs from the VAWS software.
Acknowledgments
The Authors acknowledge the contributions of Martin Wehner, Hyeuk Ryu and Mark Edwards from Geoscience Australia in the development of the VAWS software used for the vulnerability analyses performed in the current study.
Conflict of interest
The authors declare that the research was conducted in the absence of any commercial or financial relationships that could be construed as a potential conflict of interest.
Publisher’s note
All claims expressed in this article are solely those of the authors and do not necessarily represent those of their affiliated organizations, or those of the publisher, the editors and the reviewers. Any product that may be evaluated in this article, or claim that may be made by its manufacturer, is not guaranteed or endorsed by the publisher.
References
AS 1684.2 (2021). Residential timber-framed construction, Part 2: Non-cyclonic areas. Sydney, NSW: Standards Australia.
AS 1684.3 (2021). Residential timber-framed construction, Part 3: Cyclonic areas. Sydney, NSW: Standards Australia.
ASCE (2022). Minimum design loads for buildings and other structures, ASCE7-22. Washington, D.C., United Status: American Society for Civil Engineers.
Bodhinayake, G., Ginger, J., and Henderson, D. (2020). Correlation of internal and external pressures and net pressure factors for cladding design. Wind Struct. 30 (3), 219–229. doi:10.12989/was.2020.30.3.219
Boughton, G., Falck, D., Parackal, K., Henderson, D., and Bodhinayake, G. (2021). Tropical cyclone Seroja - damage to buildings in the mid-west costal region of western Australia. Townsville, QLD: Cyclone Testing Station, JCU.
Boughton, G., and Falck, D. (2008). Schoalwater and roleystone WA tornados: Wind damage to buildings. Townsville, QLD: James Cook University, School of Engineering, Cyclone Testing Station.
Boughton, G., Henderson, D., Ginger, J., Holmes, J., Walker, G., Leitch, C., et al. (2011). Tropical cyclone yasi: Structural damage to buildings. Townsville, QLD: Cyclone Testing Station, JCU.
Bureau of Meteorology (2021). Severe Tropical Cyclone Seroja. Available at: http://www.bom.gov.au/cyclone/history/seroja.shtml (Accessed September 2022).
Estephan, J., Gan Chowdhury, A., Elawady, A., and Erwin, J. (2021). Dependence of internal pressure in low-rise buildings on aerodynamic parameters, defect features and background leakage. J. Wind Eng. Industrial Aerodynamics 219, 104822. doi:10.1016/j.jweia.2021.104822
Geoscience Australia (2020). Vulnerability and adaptation to wind simulation (VAWS). Available at: https://github.com/GeoscienceAustralia/vaws (Accessed June 2022).
Ginger, J. D., and Letchford, C. W. (1999). Net pressures on a low-rise full-scale building. J. Wind Eng. Industrial Aerodynamics 83 (1), 239–250. doi:10.1016/S0167-6105(99)00075-6
Holmes, J. D. (1979). “Mean and fluctuating internal pressures caused by wind,” in Proceedings of the Fifth International Wind Engineering Conference, Fort Collins, CO, July 8–14, 1979.
Holmes, J., Wehner, M., Sandland, C., and Edwards, M. (2010). “Modelling damage to residential buildings from wind-borne debris - Part 1. Methodology,” in Proceedings of the 14th Australasian Wind Engineering Society Workshop, Canberra, Australia, August 5–6, 2010.
Humphreys, M. T., Ginger, J. D., and Henderson, D. J. (2019). Internal pressures in a full-scale test enclosure with windward wall openings. J. Wind Eng. Industrial Aerodynamics 189, 118–124. doi:10.1016/j.jweia.2019.03.024
Insurance Council of Australia (2022). Catastrophe 213: Cyclone Seroja. Available at: https://insurancecouncil.com.au/news-hub/current-catastrophes/catastrophe-213-cyclone-seroja/ (Accessed September 2022).
Kopp, G., Oh, J., and Inculet, D. (2008). Wind-induced internal pressures in houses. J. Struct. Eng. (N. Y. N. Y). 134 (7), 1129–1138. doi:10.1061/(asce)0733-9445(2008)134:7(1129)
Leitch, C., Ginger, J., Harper, B., Kim, P., Jayasinghe, N., and Somerville, L. (2008). Investigation of performance of housing in brisbane following storms on 16 and 19 november 2008-TR55. Townsville, QLD: Cyclone Testing Station.
Minor, J. (1994). Windborne debris and the building envelope. J. Wind Eng. Industrial Aerodynamics 53 (1–2), 207–227. doi:10.1016/0167-6105(94)90027-2
Morrison, M., Kopp, G., Gavanski, E., Miller, C., and Ashton, A. (2014). Assessment of damage to residential construction from the tornadoes in Vaughan, Ontario, on 20 August 2009. Can. J. Civ. Eng. 41 (6), 550–558. doi:10.1139/cjce-2013-0570
Smith, D. J., Edwards, M., Parackal, K., Ginger, J., Henderson, D., Ryu, H., et al. (2020). Modelling vulnerability of Australian housing to severe wind events: Past and present. Aust. J. Struct. Eng. 21 (3), 175–192. doi:10.1080/13287982.2020.1744900
Vickery, B. J. (1986). Gust-factors for internal-pressures in low rise buildings. J. Wind Eng. Industrial Aerodynamics 23, 259–271. doi:10.1016/0167-6105(86)90047-4
Vickery, B. J. (1994). Internal pressures and interactions with the building envelope. J. Wind Eng. Industrial Aerodynamics 53 (1), 125–144. doi:10.1016/0167-6105(94)90022-1
Walker, G. (2013). Summary report - the effect of Cyclone Evan on buildings and implications for the insurance industry. Sydney Australia: Aon Benfield Asia Pacific.
Wehner, M., Sandland, C., Holmes, J., Henderson, D., and Edwards, M. (2010). “Modelling damage to residential buildings from wind-borne debris - Part 2, implementation,” in Proceedings of the 14th Australasian Wind Engineering Society Workshop, Canberra, August 5–6, 2010, 58–61.
Keywords: tropical cyclones, damage investigations, codes and standards, wind loading, internal pressure
Citation: Parackal K, Boughton G, Henderson D and Falck D (2022) Minimising damage to houses by designing for high internal pressures. Front. Built Environ. 8:970673. doi: 10.3389/fbuil.2022.970673
Received: 16 June 2022; Accepted: 02 November 2022;
Published: 23 November 2022.
Edited by:
Kurtis Robert Gurley, University of Florida, United StatesReviewed by:
Franklin Lombardo, University of Illinois at Urbana-Champaign, United StatesAmal Elawady, Florida International University, United States
Copyright © 2022 Parackal, Boughton, Henderson and Falck. This is an open-access article distributed under the terms of the Creative Commons Attribution License (CC BY). The use, distribution or reproduction in other forums is permitted, provided the original author(s) and the copyright owner(s) are credited and that the original publication in this journal is cited, in accordance with accepted academic practice. No use, distribution or reproduction is permitted which does not comply with these terms.
*Correspondence: Korah Parackal, korah.parackal@jcu.edu.au