A 3D Measurement and Computerized Meshing Study to Promote Bus Ridership Among People Using Powered Mobility Aids
 Carolyn A. Unsworth
 Julian Chua
 Prasad Gudimetla
- 1Department of Exercise and Health Sciences, School of Health Medical and Applied Sciences, CQUniversity, Melbourne, VIC, Australia
- 2Department of Rehabilitation, School of Health and Welfare, Jönköping University, Jönköping, Sweden
- 3School of Engineering and Technology, CQUniversity, Bundaberg, QLD, Australia
People who use powered mobility aids such as wheelchairs and scooters need and want to use public transport. Buses are the most affordable and efficient form of public transport, capable of connecting people across local communities. However, with curbside rather than platform boarding and internal space limitations, buses also present many accessibility challenges for people using mobility aids during ingress, egress, and interior maneuverability. In Australia, people using mobility aids board low floor buses that are required to comply with the national bus accessibility standard, using the front doors. A new standard was recently created to provide a Blue Label identification for powered mobility aids suitable to access public transport. The accuracy of this standard to identify mobility aids suitable to use on buses has not been verified. This research used a world-first methodology that included 3-Dimensional (3D) scanning of 35 mobility aids and 21 buses. The resulting 735 scan combinations were efficiently meshed using Meshlab, an open-source software. The research demonstrated that (i) although none of the buses were compliant with the relevant standard in 3D, many could still facilitate the boarding of a variety of mobility aids, and (ii) the Blue Label, while a valuable guide, did not accurately identifying all mobility aids that would and would not be able to board buses. This research has shortlisted nine mobility aids that can be recommended to consumers as being able to fit all the full-size buses tested. The dimensions of mobility aids that appear to enable access on most buses were also identified for consumers to consider when purchasing a mobility aid. The novel 3D meshing methodology used in this research also revealed that most collision points between mobility aids and buses occur in the curved-corridor entry of the buses. To minimize this entry problem, future bus boarding designs should consider the option of double-door entry/exit in the middle of the bus, which is common in many other countries. Adoption of this strategy would mitigate some of the challenges that people using mobility aids encounter when accessing buses, thereby increasing public transport ridership among this group.
Introduction
Conservative estimates suggest that over 1 million Australians use a 3- or 4-wheeled powered or unpowered wheelchair or mobility scooter (Australian Bureau of Statistics (ABS), 2016), and that every day, ~4.3 million people in the UK (Office of Fair Trading, 2011) and 7.8 million people in the USA use wheelchairs or scooters or other mobility aids including walking sticks (also called canes), crutches or walkers (La Plante and Kaye, 2010). The number of people using any of these mobility aids internationally is expected to rise as the population ages and an increasing number of people turn to these devices to maintaining community mobility, and age in place (Grimmer et al., 2015). Given the affordability and efficiency of public transport, many people using mobility aids need and want to use this method of transport to access services, participate in community activities and spend time with friends and family (Pyer and Tucker, 2014; Steinfeld et al., 2018). However, increasing public transport ridership for this large and growing group relies people being able to use their mobility aid to safely board and maneuver within the conveyance.
Buses are an affordable and convenient form of public transport that have wide reach into the heart of local communities, yet they present many access challenges for people using mobility aids (May et al., 2010; Park and Chowdhury, 2018). A survey undertaken with 67 people who use mobility aids identified that the most important features when choosing a mobility aid were reliability and turning ability, both of which are essential attributes for accessibility on buses (Unsworth et al., 2019a). Survey participants identified that getting their mobility aid in and out of the bus and using the aid within the bus were particularly problematic due to the size of the mobility aid and accessories such as shopping baskets, and the interior space of the bus. This finding was reinforced by a systematic review of public transport access for people using mobility aids (Unsworth et al., 2019b). Of the 26 studies included in the review, 24 included information on buses, and while 14 studies investigated user experiences, five specifically examined bus formats and floor layouts and a further five focused on bus ramps and optimal ramp designs. D'Souza et al. (2017a,b) investigated the effect of low-floor bus interior configuration and passenger crowding on boarding and disembarking efficiency and safety, as well as determining the effect of seating configuration and passenger load on physical accessibility. They reported that ramp ascent was the most difficult task for manual wheelchair users, while interior circulation was most difficult for powered mobility device users. They noted that interior configurations with boarding and disembarking from mid/rear doorways were preferred by users. Bharathy and D'Souza (2018) developed an algorithm to determine the dimensions of the clear floor area required to best accommodate people in their mobility devices in buses. This team used 3D coordinates from participants to derive estimates of width, height and depth of persons and their mobility aids, and clear floor space required. They reported that only 59.4% of people and their mobility devices could fit into current floor spaces. Frost et al. (2015) investigated factors that contributed to ramp related incidents during bus boarding/alighting of people using mobility aids. Of their 414 participants, 4.6% (n = 35) had experienced a ramp-related accident. These accidents were more common when; boarding (6.3%) compared to alighting (2.2%), the ramp slope was greater than the maximum of 9.5° proposed Americans with Disabilities Act (1990), and when the ramp was deployed to street level as opposed to the sidewalk.
In Australia, access difficulties for people using mobility devices on buses continue to occur, despite the use of local access standards including the Disability Standards for Accessible Public Transport (DSAPT) (Department of Infrastructure Regional Development Australian Government, 2011; Department of Infrastructure Regional Development, 2013), AS/NZS3695 for mobility aids (Standards Australia, 2013), and AS/NZS ISO10865 for buses. Anecdotal evidence suggests that bus access problems may persist because the DSAPT reports two-dimensional (2D) measurements of floor space on vehicles for mobility aids that are driven by skilled drivers of average weight. Two dimensional measures don't account for access interference from the positioning of fare reading devices, support rails at chest height, and seat cushioning that may protrude and block what otherwise appears to be a wider clearance space for wheelchair access at 2D floor level. The DSAPT (Department of Infrastructure Regional Development Australian Government, 2011) specifies the width of a bus entrance and access corridor as 800 mm, the area designated for travel called Allocated Space as 850 mm wide minus clearance and 1,300 mm long minus clearance, with a height of 1,500 mm, and that a maneuvering area comprising a space that is that is not <2,070 mm width by 1,540 mm length is available for turning. This is illustrated in the aerial view presented in Figures 1, 2. Unlike many other countries such as Sweden and Germany where all door bus boarding is possible and enables people using mobility aids to enter via a mid or rear double door that leads directly to an allocated space, in Australia, ramp access is usually limited to front door boarding.
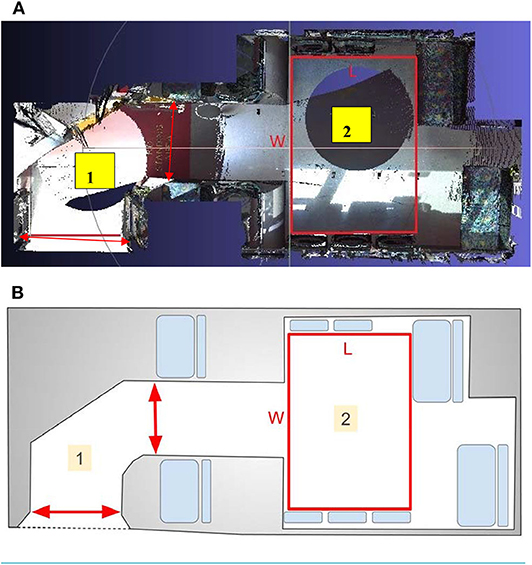
Figure 1. Location of entrance and corridor widths [1] and maneuvering area (L-length × W-width) [2] of a bus based against the Disability Standards for Accessible Public Transport (2011) using both aerial scans and line drawings. (A) 3D aerial scan of bus interior (plan view) showing entry widths and maneuvering area. (B) Line drawing of aerial scan from (A).
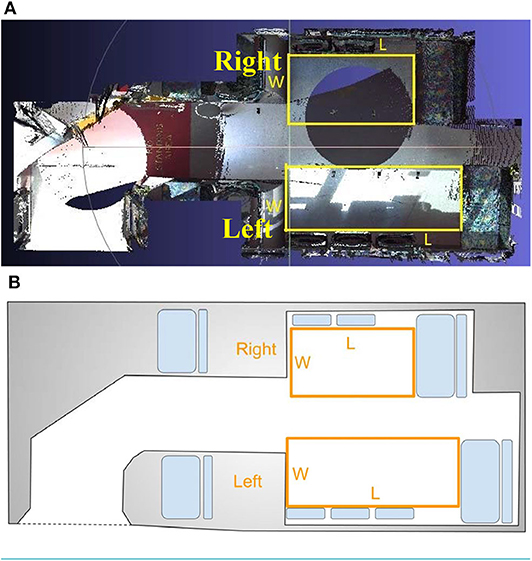
Figure 2. Example of Allocated Spaces (L-length × W- width) on a bus and how they vary, to determine compliance with Disability Standards for Accessible Public Transport (2011) using both aerial scans and line drawings. (A) 3D aerial scan of bus interior (plan view) showing allocated spaces. (B) Line drawing of aerial scan from (A).
A new Standards Australia–Technical Specification (AS–TS) has been developed to provide mobility aids with a White Label indicating suitability for use on footpaths and/or road-related areas, or a Blue Label indicating suitability for use on footpaths and/or road-related areas as well as meeting the criteria denoting suitability for use on public transport: AS–TS 3695.3:2018 (Standards Australia, 2018). The criteria for a Blue Label are: the aid measures ≤ 740 mm wide, is ≤ 1,500 mm, weighs ≤ 170 kg and that the mobility aid can successfully (according to 2D illustrations with measurements provided): (1) access a Swept Path (believed to represent the curved entrance of a bus); (2) travel a Narrow Access Path (the corridor from the curved entrance at the front of the bus to the designated travel area); (3) access an Allocated Space (the designated travel area); (4) complete a 180° turn within an area 2,070 mm × 1,540 mm area; and (5) traverse a Pavement Gap (believed to represent crossing a light rail or rail crossing gauge gap in a pavement or road surface). These illustrations with measures are available elsewhere (Unsworth et al., under review). Of note, the AS–TS make provision that mobility aids with a diagonal length of ≤ 1,200 mm are exempt from undertaking the Allocated Space Test.
Previous research (Unsworth et al., under review) examined the validity and practical implications of AS–TS 3695.3:2018 Blue Label. This study measured a sample of 35 mobility aids and tested them in five rigs built according to the 2D measures specified in the AS–TS to identify the measurements of mobility aids that are most likely to be awarded a Blue Label, as well as which of the 35 mobility aids tested would be awarded a Blue Label denoting suitability for use on public transport. The 35 mobility aids were tested by three real-world mobility aid users, as well as research team members. It was found that nine of 35 mobility aids would not be awarded a Blue Label, and the Allocated Space test presented the most challenge for these mobility aids, followed by successful completion of the 180° turn test. The measurements of powered mobility aids that were most likely to comply with AS–TS 3695.3:2018 Blue Label for public transport access were those with a diagonal length (D) <1,280 mm, overall length (L) <1,110 mm, and a measured turn radius <760 mm.
Testing to determine the accuracy of AS–TS 3695.3:2018 against the real-world fit of mobility aids on buses (and other transport such as trams and trains in the future) is also required. For example, to what extent are buses compliant with DSAP measures, and can powered mobility aids that are, and are not awarded a Blue Label access and maneuver within these buses? One of the limitations of the current AS–TS is that it relies on manufacturer specifications. However, our previous research identified that it was not possible to determine if mobility aids would be awarded a Blue Label based on these specifications alone (Unsworth et al., under review), and that building the test rigs was necessary. Anecdotally, it also seemed that there was limited consistency in the measures of the mobility aids that were and were not awarded a Blue Label. Therefore, research to determine the accuracy of the AS–TS 3695.3:2018 Blue Label to identify mobility aid access on buses that are and are not compliant with DSAPT is required, using either real word testing, or computer-generated simulations.
Testing real world access for the vast number of mobility aids on the market in the large number of bus formats in service would be an exhausting undertaking. However, the emergence of 3D scanning technology (Paquet and Feathers, 2004) and use of meshing software to develop accurate models for virtual examination is a convenient alternative to address this issue. We previously undertook a proof-of-principle study to demonstrate that 3D scans of mobility aids and buses could be accurately undertaken and meshed (Unsworth et al., 2018). The aims of the current paper were to use 3D scanning and meshing technology for the first time to help answer the following real-world accessibility questions: (i) which low floor transit buses that do and don't comply with the DSAPT standards, enable boarding for people using powered mobility aids that are or are not compliant with AS–TS 3695.3:2018 Blue Label measures, and (ii) what are the dimensions of mobility aids that fit most buses? To answer these questions, the following objectives were undertaken:
1) generate 3D scans and calculate accurate measurements for a sample of 35 mobility aids, which previous research has shown 25 of which do, and 10 do not achieve a Blue Label,
2) generate 3D scans and calculate measurements for a sample of 21 low-floor transit buses, and identify how many are compliant with the Australian specifications for buses according to the Disability Standards for Accessible Public Transport (DSAPT; Department of Infrastructure Regional Development Australian Government, 2011),
3) use our previously validated meshing software technique to manipulate the 35 powered mobility aids through the 21 buses (using collision detection to determine a grid of positions that the mobility aid could occupy, and a path finding algorithm), to determine how many of the mobility aids (25 with Blue Label, and 10 without) are actually compatible to access the buses and if they are not compatible, which section/s of the bus caused most problems, and
4) identify the measurements of powered mobility aids most likely to access transit buses.
Methods
Design
Three dimensional (3D) scanning has been widely used in the medical rehabilitation and engineering fields to aid design and fit processes such as in the design and customization of orthotics (Telfer and Woodburn, 2010) or for improving wheelchair seating design (Crytzer et al., 2016), as well as for mapping interiors to develop virtual environments (Henry et al., 2014). A proof of principle paper has previously demonstrated that 3D scanning and computerized meshing techniques can successfully identify the match or mis-match of mobility devices on public transport, and full details of the techniques used have been provided (Unsworth et al., 2018). A summary of these techniques to determine the match and mismatch between a sample of 35 mobility aids when maneuvered within 21 buses, is detailed below.
Bus and Mobility Aids Selected for Scanning
This research was undertaken in the large metropolitan city of Melbourne with a population of ~5 million people. Two large mobility aid suppliers were approached to provide access to a range of commonly used (and best-selling) 3- and 4- wheeled scooters as well as powered wheelchairs. A total of 35 mobility aids (16 powered wheelchairs and 19 scooters) were scanned in the time available for the research, which can be described as a convenience sample. These mobility aids have been previously described (Unsworth et al., under review) and four were classified as suitable for indoor use only (Class A) although several of these were sold as light-weight local and international travel aids, 27 were suitable for a mix of indoor and outdoor use (Class B) and four were suitable for outdoor use only (Class C).
The buses scanned in this research were similarly sourced from two of the largest providers of transit bus services in the city/suburban region (~25 km2). All buses were randomly pulled from service to suit the operational timetable on the days allocated for scanning. Twenty of the buses were standard low floor, two axel vehicles and the final conveyance was a low floor, two-axel miniature bus. The buses were from numerous chasses and body builders including MAN, Scania, Mercedes Benz, Volvo, Toyota, Optare, Designline, Denning, Gemilang, Iveco, and Volgren.
3D Scanning Technique
3D scanning collects data of interiors or objects and saves these in a digital format that can be converted into computer-aided design (CAD) models. These CAD models can then be used to take measurements or run computer simulations. Three-dimensional scanning of mobility aids has been successfully undertaken over the past 15 years (Paquet and Feathers, 2004). The scanner used in this research was a tripod-mounted Faro Focus X330 laser scanner (Faro, Lake Mary FL, USA). This scanner is capable of scanning the environment 360° in the horizontal (azimuthal) and vertical axes with a precision of ±2 millimeters at distances up to 10 meters. While the buses took approximately 45 min to scan, each mobility aid only took ~25 min. The primary output from a laser scanner is a “point cloud” of reflection positions. Poisson surface reconstruction (Kazhdan et al., 2006) can then be used to generate a tet-mesh of the point cloud, and render the required model. The positioning of the Faro Focus X330 laser scanner to scan both bus interiors as well as mobility aids is provided in Figure 3.
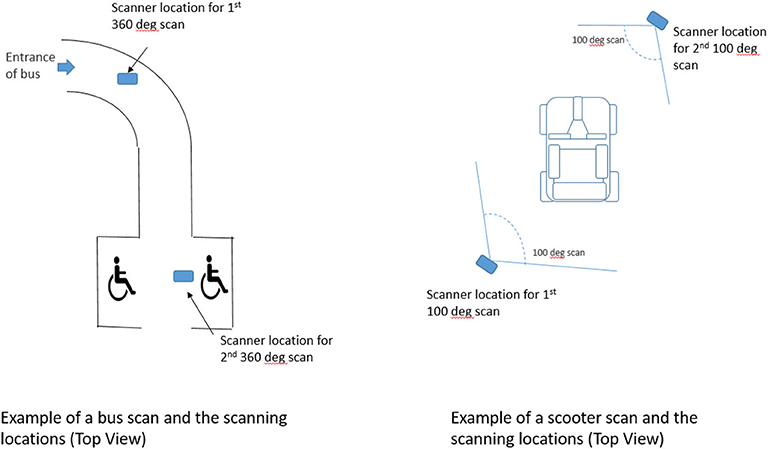
Figure 3. Positioning of the Faro Focus 330 laser scanner for both bus interiors and mobility aids.
Data Analyses Using Meshing Software
On completion of scanning the mobility aids and bus interiors, meshes of the two were generated. Faro Scene LT (Faro, Lake Mary FL, USA) was used to convert the proprietary Faro Scan data of the mobility aids and bus interiors to a PTX file which is in an open format for point cloud data. Meshlab, an open-source 3D meshing tool (Cignoni et al., 2008), was then used to align the powered mobility aid scans with each bus scan to create meshes, and Poisson surface reconstruction was used for further processing. Collision detection was then applied, using a hierarchical mesh decomposition for computational efficiency, to determine a grid of positions that the mobility aid could occupy in the bus and determine the allowable orientations of the mobility aid at each position. Finally, a path finding algorithm was employed to compute the range of allowable paths of the mobility aid through the bus from the entry to the exit point, thus providing exact details of the match or mis-match of each mobility aid to maneuver through each bus. The Find Path simulation is completed using two steps. First, using the occupiable grid of positions, the simulation attempts to identify a “direct path” between every two points adjacent to each other. A “direct path” exists when the radius of the arc formed between the two points is larger than the turning radius of the mobility aid. All the points that have a “direct path” create a “full path” graph. Then from the “full path” graph, the simulation determines if there is a path the mobility aid can use to travel from the entry to the exit point. For this simulation, the entry to exit point includes the swept path, through the narrow entrance, to the allocated space. This method enabled the research team to detect the access or collision for large numbers of powered mobility aids on each bus in a time efficient manner. Data processing for each of the 375 meshes (35 mobility aids × 21 buses) took ~30 min.
Results
Measures of the 35 Mobility Aids Scanned in 3D
On completion of 3D scanning, the measurements of the 35 mobility aids were recorded and are presented in Table 1, which also shows if each mobility aid passed or failed the Blue Label 2D test when the test rigs were built in 3D and the mobility aid driven through as previously reported (Unsworth et al., under review). As noted above, the AS–TS makes provision that mobility aids with a diagonal length of 1,200 mm or less are exempt from undertaking the Allocated Space Test, presumably because all mobility aids with this dimension or less would pass this test. It was found that the Shoprider GK4 (diagonal length of 1,149 mm) did not pass this test, suggesting this criterion is not always valid. However, this mobility aid was also not able to complete the 180° turn test within a 2,070 mm × 1,540 mm area and therefore failed to attain the criteria for a Blue Label anyway. As noted above, 25 of the mobility aids would have been allocated a Blue Label, and 10 would not.
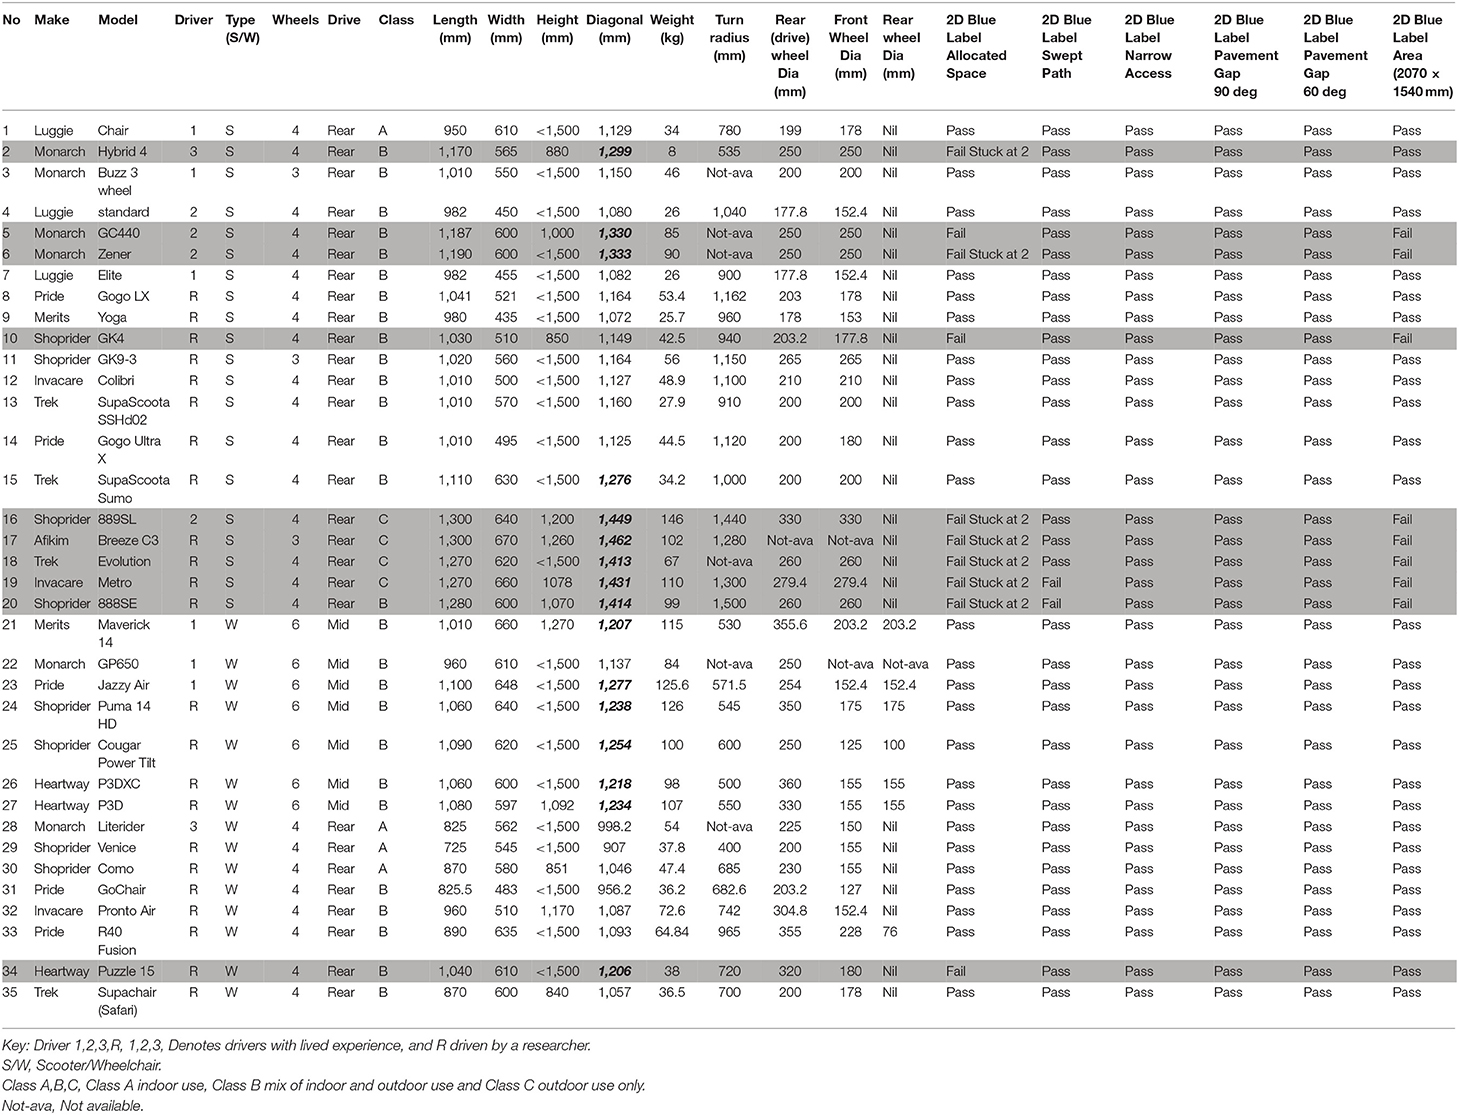
Table 1. Measures for mobility devices (Bold italic font indicating measure >1,200, and gray highlight indicates a failed Blue Label test).
Measures of the 21 Buses Scanned in 3D
Table 2 presents the measurements of the 20 of the buses scanned, while Figure 4 presents the measures of the first bus scanned against an aerial image showing the location of where measures were taken. The measures of the buses using both 2D as well as 3D data from the scans were compared against the Disability Standards for Accessible Public Transport (2011), and the findings reported in Table 3. The final column of Table 3 demonstrates that while overall three of the 21 buses were DSAPT compliant when using 2D measures, none were compliant when using the 3D measures.
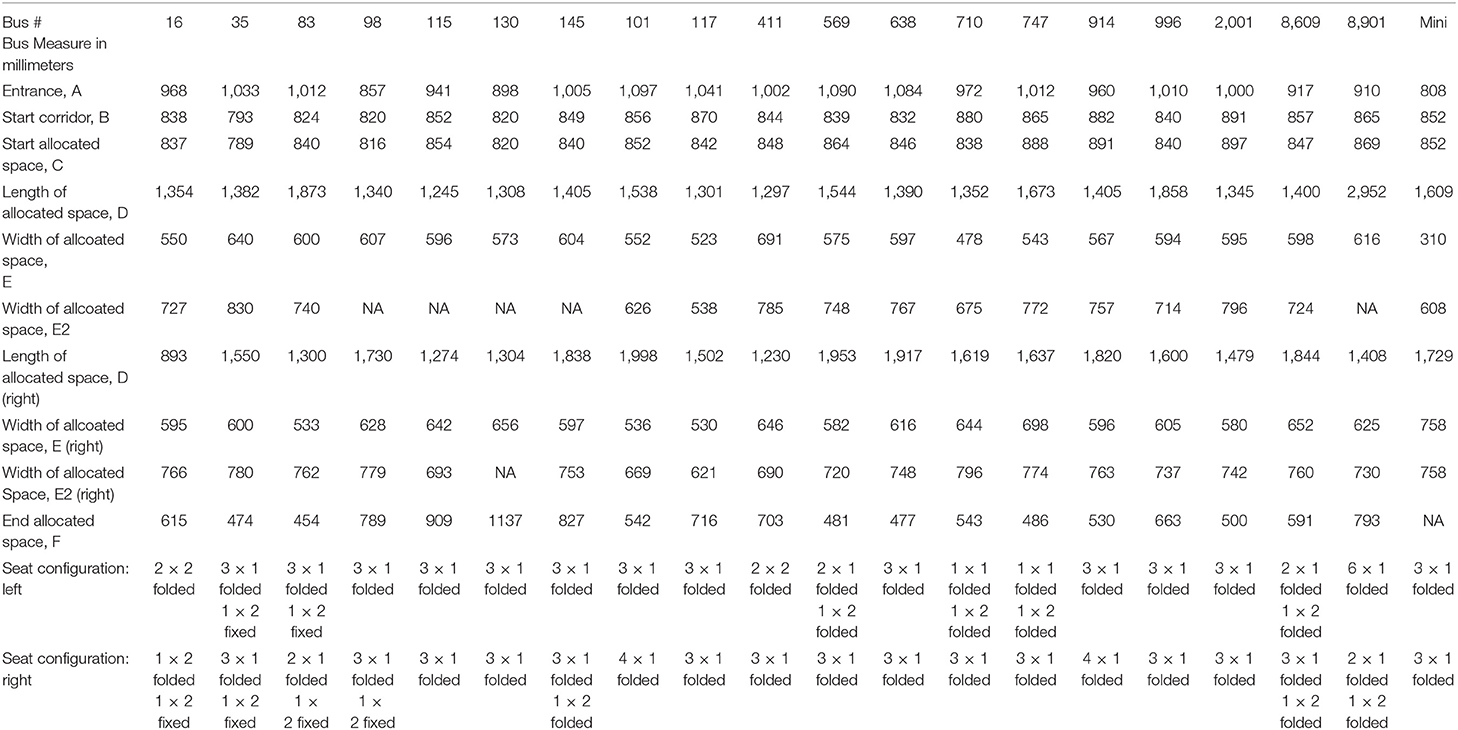
Table 2. Measures for buses scanned (Bus No. 7 scan and indicative dimensions included in Figure 1).
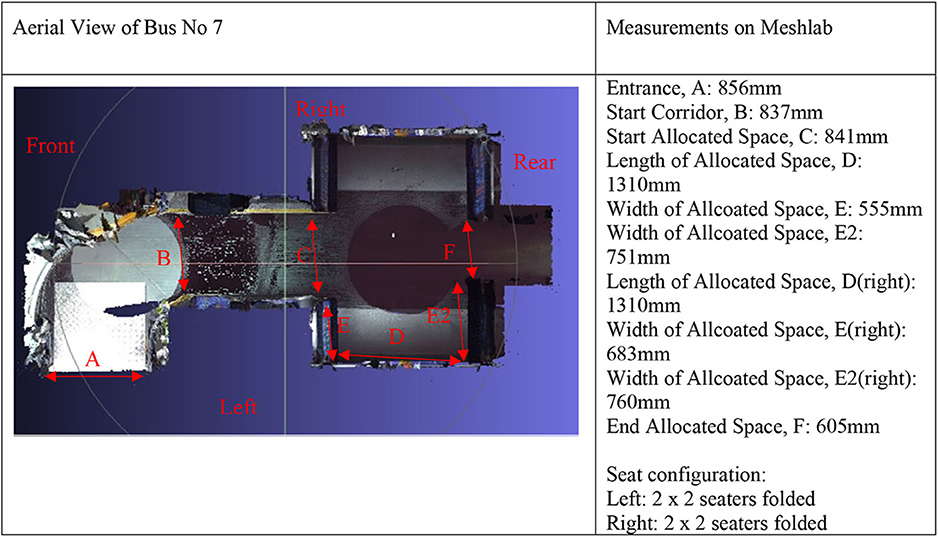
Figure 4. Scanned example of one bus with associated measures (remaining 20 bus measures located in Table 1).
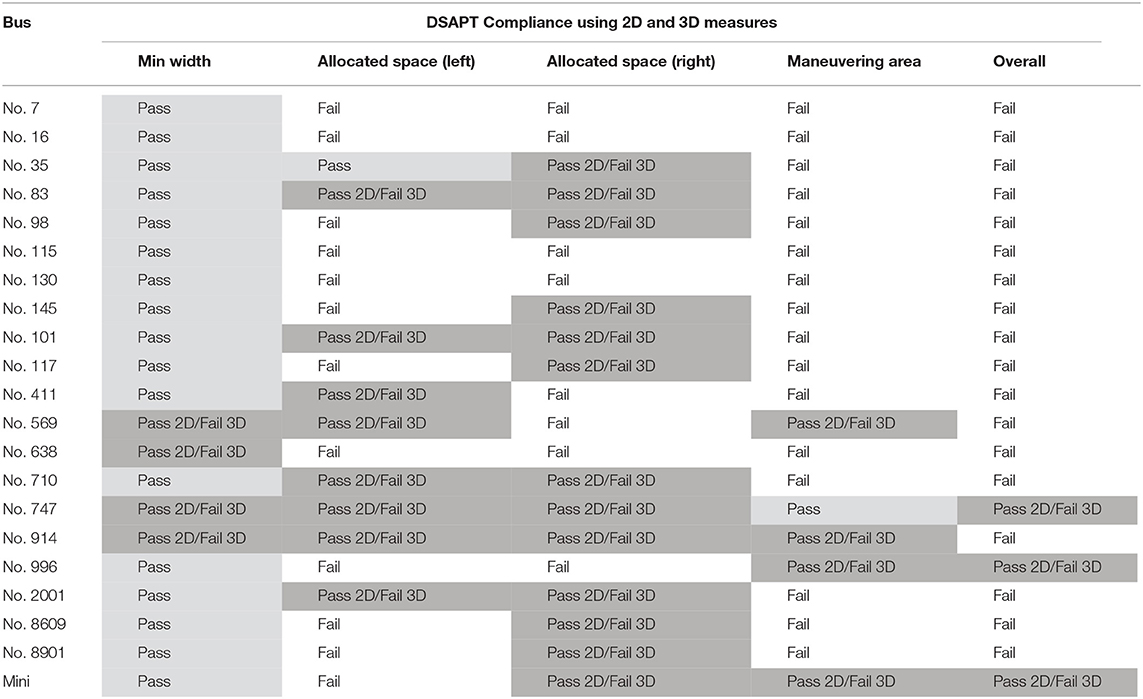
Table 3. Results from 2D and 3D measures of buses in relation to Disability Standards for Accessible Public Transport (DSAPT) (Department of Infrastructure Regional Development Australian Government, 2011) compliance.
Compatibility of Mobility Aids on Buses and the Measures of Mobility Aids Most Likely to Fit
The 3D mobility aid and bus scans were meshed using collision detection to determine the grid of positions that the mobility aid could occupy, as well as a path finding algorithm. Figure 5 demonstrates examples of the images generated from these meshing activities. Figure 5A provides an example of a Collision image (Left) and Find Path image (Right) of a mobility aid that was able to successfully navigate the Swept Path entry, Narrow Access corridor and Allocated Space for travel, and classified as a pass. Figure 5B provides an example of Find Path image (Left) of a mobility aid that could not enter the Swept Path of a bus (classified as fail), as well as a 3D Find Path image (Right) showing the mobility aid and the point of collision of the left rear wheel. Table 4 then provides a summary of each of the mobility aids and the number of buses they can fit on. The mobility aids listed in bold all achieve AS–TS 3695.3:2018 Blue Label, theoretically denoting compatibility with public transport. Of note, three mobility aids that did not achieve a Blue Label could access 12 or 13 of the 21 buses tested. Specifically, the Heartway Puzzle (wheelchair) and Shoprider GK4 (scooter) could both access 12, and the Monarch Hybrid (scooter) could access 13 of the 21 buses. It was also important to note that four of the mobility aids that would be awarded a Blue Label, were not able to successfully navigate 11 or more buses (Heartway P3D, Monarch GP650, Shoprider Puma 14HD, and Pride R40Fusion).
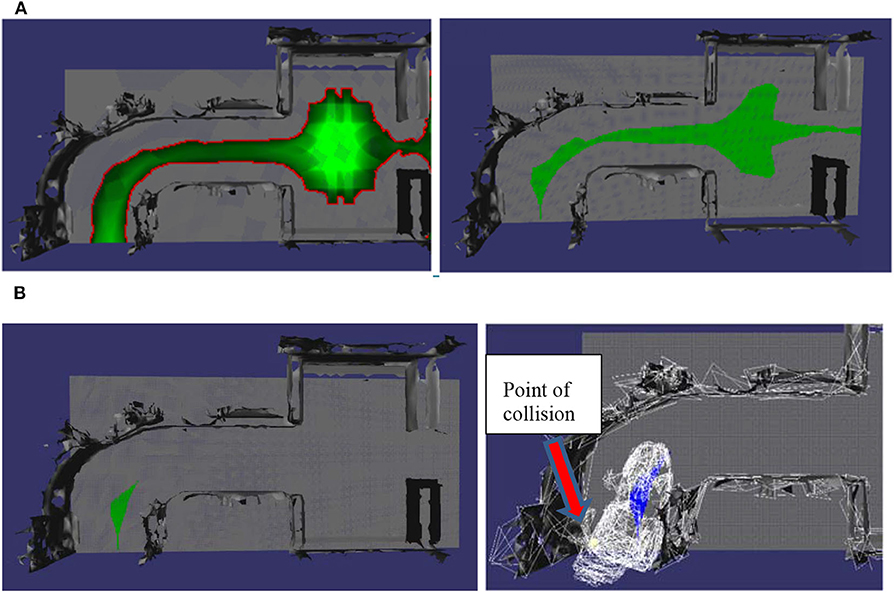
Figure 5. Examples of Find Path, and Collision images demonstrating where mobility aids could or could not access the bus and allocated space. (A) Example of Collision image (Left) and Find Path image (Right) of a mobility aid that matched a bus (pass). (B) Example of Find Path image (Left) of a mobility aid that could not enter a bus (fail) and a 3D Find Path image (Right) showing a point of collision.
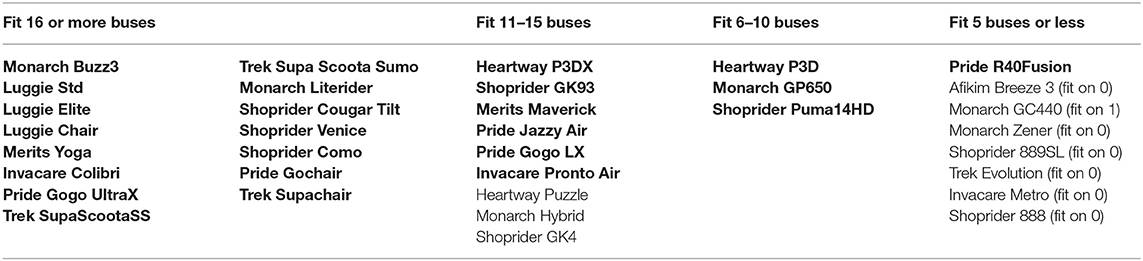
Table 4. Number of buses that can fit the following 35 mobility aids that do (bold font) and don't (regular font) meet the AS-TS 3695.3:2018 for public transport access.
The section of the bus that caused most problems when the mobility aid scans were meshed with the bus scans was the Swept Path entrance. The 735 meshing simulations were undertaken to determine each collision point, and then restart the simulation to identify any subsequent collision points. There were 286 (67%) collisions in the Swept Path, 0 collisions in the Narrow Path, and 141 (33%) collisions in the Allocated Space. The main features that contributed to the collision points in the Swept Path were protrusions from fare reading devices (many of which were located at approximately hip height of a standing person), cushioning from the first row of bus seats on either side of the entrance, and due to a small narrowing of the pathway that provides the transition between the Swept Path and the Narrow Access Path. All these features essentially reduced the functional width of the Swept Path area and prevented many of the larger powered mobility aids or those with smaller turning radii to enter, often causing a collision in the entry point as shown in Figure 5B.
The final aim of this research was to identify the measurements of powered mobility aids most likely to access transit buses. The measures identified draw on the measures of the mobility aids that could access the most buses. Nine of the 35 powered mobility aids were able to fit at least the 20 full-size transit buses, and five of these could fit on the mini bus as well: five were scooters with turn radii ranging from 650 to 995 mm (Monarch Buzz 3, Luggie Standard, Luggie Elite, Merits Yoga, and Pride GoGo Ultra X) and 4 were powered wheelchairs with turn radii of 300–310 mm (Shoprider Venice, Shoprider Como, Trek Supachair, and Luggie Chair). Their length ranged from 725 to 1,041 mm and their width range from 435 to 610 mm. However, it was the diagonal length (absorbing the width measure) that was most informative for determining guidelines for overall fit. Table 5 provides the measures of mobility aids recommend for use on buses and compares these against the Blue Label measures.
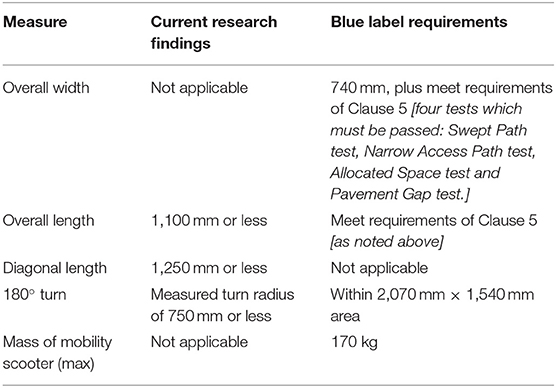
Table 5. Measures of mobility devices most suitable for bus access: Comparison of results from current research and AS–TS 3695.3:2018 Blue Label requirements.
Discussion
This discussion examines the outcome of the computerized meshing task to examine the accuracy of AS–TS 3695.3:2018 Blue Label to identify mobility aids that will and will not fit on transit buses, measures of mobility aids most likely to access buses, limitations of the research, and areas for further study. While Bharathy and D'Souza (2018) developed an algorithm to determine the dimensions of the clear floor area required to best accommodate people in their mobility devices in buses, the current research approached the same access problem from a different perspective, viz., how to identify which, from a sample of mobility aids, are compatible to access and maneuver within all 3D spaces of existing buses, and the dimensions of mobility aids most suited to this purpose. Previous research (Unsworth et al., under review) examined whether a sample of 35 mobility aids tested in purpose-built rigs according to AS–TS 3695.3:2018 would achieve a Blue Label denoting compatibility with public transport. Twenty-five of the mobility aids were compliant, and it was demonstrated that the test rigs needed to be built in order to accurately determine the label award. The current study then used a novel computerized meshing approach (Unsworth et al., 2018) to generate both Collision and Find Path analyses to identify any points at which a mobility device might collide and become stuck when entering, maneuvering within and exiting a bus.
In the current study, the Swept Path entrance of the buses proved most challenging for the mobility aids to maneuver within. However, in the previous study validating the Blue Label (Unsworth et al., under review), it was found that the Allocated Space caused most problems. In the previous study, eight of the 10 mobility aids that did not achieve Blue Label could not be positioned in the allocated space, and the final two aids could complete this task, but only with more than 5 min of small, skilled maneuvers. To maneuver into the Allocated Space, the mobility aids were driven to follow the specified pattern requiring the driver to make the following three moves: (1) drive forward down the bus corridor from front entrance, just past the allocated space (e.g., on the right), (2) reverse backwards using an elongated S into the allocated space, (3) exit the allocated space by driving forward while rotating 180° to exit from the front entrance. Seven of the 10 mobility aids encountered the collision point at turn number 2. reverse backwards using an elongated S into the allocated space. Research undertaken by Bharathy and D'Souza (2018) and D'Souza et al. (2017a,b) also focused on transit spaces as being most problematic for people using mobility aids. However, since the buses in these jurisdictions allow entry from mid doors, the need for curved swept entry, and any problems that generates were bypassed. The finding in the current study that the Swept Path is the main problem for accessibility for people using mobility devices also supports Australia to transition to positioning ramps at bifold mid bus doors and promote boarding for people using mobility aids from this point. Very few other studies have been conducted to compare the present study findings against. For example, while Koontz et al. (2010) also scanned mobility aids in 3D, their study aimed to then measure the minimum turning spaces for a wheelchair to maneuver in building corridor spaces.
Nine of the 35 powered mobility aids tested were identified as being able to fit at least 20 of the different transit buses. It is important to note that three of these are Class A mobility aids while the other six are Class B. Class A mobility aids are specified by manufacturers as suitable for indoor use such as in a home or shopping center. However, these devices are often lightweight and portable and therefore ideal to take on outings or use on domestic and international travel. In fact, many mobility aid retailers sell these devices to people wishing to travel, including navigating cobbled streets as found across Europe. It is also important to note that the simulations undertaken in this study assume that the bus has both left and right Allocated Spaces available for maneuverability. However, in reality one of the Allocated Spaces may already be occupied by someone who has a disability or by passengers with prams (Velho, 2019). This means that the potential space a mobility aid must maneuver within may be considerably smaller in real life than in simulations.
Several limitations of this research must be acknowledged. The computer simulations we undertook were very strict on determining a collision at any point of contact regardless of whether it was a soft (cushion) point of contact or hard (metal or plastic) contact which prevented further entry for the powered mobility aid. This has the advantage of “protecting” both mobility aids and buses against damage as well as wear and tear, but it is acknowledged that some mobility aids could potentially push past some collision points such as from seat cushioning, and gain access. In addition, the Find Path simulation we undertook does not currently have an automated method of testing all the different starting points or different starting angles for a mobility aid entering a bus. We considered several options for start points and angles but acknowledge that there might be a small number of rare configurations that might improve the Find Path outcomes produced in this study. In practice, however, it is unlikely that a person using a mobility aid would be able to replicate unusual entry angles that might improve access. In addition, many people using mobility aids also affix accessories such as shopping baskets to the front or rear or attach a walking aid such as a rollator on the rear. The measures taken in this research do not account for the additional space requirements generated by attaching any of these accessories on a mobility aid. Finally, this research only investigated a sample of 35 mobility aids and 21 buses from one area in Australia. Therefore, further scanning and meshing of a greater number of mobility aids and buses is required to extend our understanding of the measures of mobility aids most likely to access buses, and how the AS–TS 3695.3:2018 Blue Label may need to be revised to ensure that the measures provided are accurate in determining if a mobility aid will be able to fit on public transport or not. As demonstrated in previous research, the maneuverability of powered mobility aids, even from the same class are very different (Pellegrini et al., 2010), and therefore the access requirements for each must be individually tested. In future, and as 3D scanning becomes more affordable and commonplace, a target could be set of scanning 50% of all new buses as they go into service, and 50% of new mobility aids as they come onto the market. As the dataset of compatibility meshes grows, it is possible that the dimensions of mobility aids that will fit on most buses may alter from those reported in this paper.
Conclusion
Ensuring access for people using powered mobility aids on our public transport network, particularly buses, is vital for both users and service providers. Buses reach far into the community to support people with limited resources to connect with essential health and retail services, as well as to support participation in family, sporting, and cultural activities. While Standards such as DSAPT (Department of Infrastructure Regional Development Australian Government, 2011) and AS–TS 3695.3:2018 Blue Label have been developed to support this goal, without research to test and validate their use, they may hinder rather than promote best practice. This research demonstrated that although none of the buses were compliant with all aspects of the DSAPT, the meshing of 3D scans indicated that many powered mobility aids could still successfully access many buses and 13/21 of the buses could actually accommodate at least 22/35 powered mobility aids. However, there were problems with the Blue Label system not accurately indicating if a powered mobility aid could fit on a bus, and 3/35 powered mobility aids that would not achieve a Blue Label could actually access up to 13 buses, and 4/25 powered mobility aids that would be awarded a Blue Label could not access 11 or more buses. Nine powered mobility aids that were able to fit on all 20 full-size buses tested in this research are recommended for users to consider purchasing to optimize their access on buses. Furthermore, the length and diagonal length dimensions of mobility aids that appear to enable fit on most buses tested in this research were also identified for consumers to consider the use of mobility aids on buses beyond the 35 specifically measured in this research. Since the majority of mobility aids that could not gain entry on a bus experienced a collision point in the Swept Path entry, future bus design in Australia should investigate boarding people using powered mobility aids from double doors in the middle of the bus to a large adjacent allocated space, as occurs in bus boarding in other parts of the world. This research provides important information to support the decisions made by a range of end users including customers wishing to purchase a mobility aid as well as bus designers and commissioning teams. The findings from this research also serve to fill fundamental gaps and inconsistencies in statutory and policy obligations to ensure public transport is accessible for all, and thus increase ridership among the growing group of people who use mobility aids to access the community.
Data Availability Statement
The raw data supporting the conclusions of this article will be made available by the authors, without undue reservation.
Author Contributions
CU conceptualized the study. JC and CU collected the data, with discussion with PG. JC developed the data analysis technique and undertook all analyses. JC and CU interpreted the findings. CU, JC, and PG prepared the findings for publication, edited the manuscript, and approved the final manuscript submitted. All authors contributed to the article and approved the submitted version.
Funding
This research was funded from a grant from Department of Transport (formerly Public Transport Victoria), Victoria, Australia.
Conflict of Interest
The authors declare that the research was conducted in the absence of any commercial or financial relationships that could be construed as a potential conflict of interest.
Acknowledgments
Sincere thanks are extended to the bus companies for assisting with this research so enthusiastically and making the buses available for scanning, as well as Scooters Australia and Mobility Aids Australia for providing the mobility aids for testing. Thanks also to team in the Inclusive Public Transport Unit at Department of Transport for their great collaboration. We also acknowledge the input of Professor Drew Dawson and Associate Professor Anjum Naweed (CQUniversity), Professor Richard Tay (RMIT University) and Dr. Richard Huysmans (Raven Consulting) who were all involved in early discussions about the research and supported the initial funding applications. Sincere thanks are also extended to Dr. Toan Nguyen and Associate Professor David Barnes (Monash eResearch Centre, Monash University) who advised on the data processing.
References
Australian Bureau of Statistics (ABS) (2016). 4430.0 - Survey of Disability, Ageing and Carers 2015, Viewed 15 March 2020. Available online at: https://www.and.org.au/pages/disability-statistics.html
Bharathy, A., and D'Souza, C. (2018). Revisiting clear floor area requirement for wheeled mobility device users in public transportation. Transp. Res. Rec. 2672, 675–685. doi: 10.1177/0361198118787082
Cignoni, P., Callieri, M., Corsini, M., Dellepiane, M., Ganovelli, F., and Ranzuglia, G. (2008). “MeshLab: an open-source mesh processing tool,” in Proceedings of the Sixth Eurographics Italian Chapter Conference (Salerno), 129–136.
Crytzer, T. M., Hong, E., Dicianno, B. E., Pearlman, J., Schmeler, M., and Cooper, R. A. (2016). Identifying characteristic back shapes from anatomical scans of wheelchair users to improve seating design. Med. Eng. Phys. 38, 999–1007. doi: 10.1016/j.medengphy.2016.06.017
Department of Infrastructure and Regional Development (2013). Review of the Disability Standards for Accessible Public Transport. Canberra, ACT.
Department of Infrastructure and Regional Development and Australian Government (2011). Disability Standards for Accessible Public Transport. Canberra, ACT.
D'Souza, C., Paquet, V., Lenker, J. A., and Steinfeld, E. (2017a) Effects of transit bus interior configuration on performance of wheeled mobility users during simulated boarding disembarking. Appl. Ergon. 62, 94–106. doi: 10.1016/j.apergo.2017.02.008
D'Souza, C., Paquet, V., Lenker, J. A., and Steinfeld, E. (2017b) Self-reported difficulty preferences of wheeled mobility device users for simulated low-floor bus boarding, interior circulation disembarking. Disabil. Rehab. Assis. Technol. 14, 109–121. doi: 10.1080/17483107.2017.1401128
Frost, K. L., Bertocci, G., and Smalley, C. (2015). Ramp-related incidents involving wheeled mobility device users during transit bus boarding/alighting. Arch. Phys. Med. Rehabil. 96, 928–933. doi: 10.1016/j.apmr.2014.12.013
Grimmer, K., Kay, D., Foot, J., and Pastakia, K. (2015). Consumer views about ageing-in-place. Clin. Intervent. Aging. 10, 1803–1811. doi: 10.2147/CIA.S90672
Henry, P., Krainin, M., Herbst, E., Ren, X., and Fox, D. (2014). “RGB-D mapping: using depth cameras for dense 3D modeling of indoor environments,” in Experimental Robotics Springer Tracts in Advanced Robotics, Vol. 79, eds O. Khatib, V. Kumar, and G. Sukhatme (Berlin: Springer), 647–663.
Kazhdan, M., Bolitho, M., and Hoppe, H. (2006). “Poisson surface reconstruction,” in Proceedings of the 2006 Eurographics Symposium on Geometry Processing, eds K. Polthier and A. Sheffer (Cagliari), 61–70.
Koontz, A. M., Brindle, E. D., Kankipati, P., Feathers, D., and Cooper, R. A. (2010). Design features that affect the maneuverability of wheelchairs and scooters. Arch. Phys. Med. Rehab. 91, 759–764. doi: 10.1016/j.apmr.2010.01.009
La Plante, M. P., and Kaye, H. S. (2010). Demographics and trends in wheeled mobility equipment use and accessibility in the community. Assis. Technol. 22, 3–17. doi: 10.1080/10400430903501413
May, E., Garrett, R., and Ballantyne, A. (2010). Being mobile: electric mobility-scooters and their use by older people. Ageing Soc. 30, 1219–1237. doi: 10.1017/S0144686X10000334
Office of Fair Trading (2011). Mobility Aids: An Office of Fair Trading Market Study (OFT1374). London: UK Government.
Paquet, V., and Feathers, D. (2004). An anthropometric study of manual and powered wheelchair users. Int. J. Indus. Ergono 33, 191–204. doi: 10.1016/j.ergon.2003.10.003
Park, K., and Chowdhury, S. (2018). Investigating the barriers in a typical journey by public transport users with disabilities. J. Transport Health 10, 361–368. doi: 10.1016/j.jth.2018.05.008
Pellegrini, N., Bouche, S., Barbot, F., Figère, M., Guillon, B., and Lofaso, F. (2010). Comparative evaluation of electric wheelchair maneuverability. J. Rehab. Med. 42, 605–607. doi: 10.2340/16501977-0562
Pyer, T., and Tucker, F. (2014). With us, we, like, physically can't: transport, mobility and the leisure experiences of teenage wheelchair users. Mobilities 12, 36–52. doi: 10.1080/17450101.2014.970390
Standards Australia (2013). AS/NZS 3695.2:2013 Wheelchair Requirements and Test Methods for Electrically Powered Wheelchairs Including Electric Mobility Scooters. Sydney, NSW: SAI Global Limited.
Standards Australia (2015). AS/NZS ISO 10865.1:2015 Wheelchair Containment and Occupant Retention Systems for Accessible Transport Vehicles Designed for Use by Both Sitting and Standing Passenger Systems for Rearward-Facing Wheelchair-Seated Passengers. Sydney, NSW: SAI Global Limited.
Standards Australia (2018). SA TS 3695.3:2018 Wheelchairs Requirements for Designation of Powered Wheelchairs and Mobility Scooters for Public Transport and/or Road-Related Area Use. Sydney, NSW: SAI Global Limited.
Steinfeld, A., Maisel, J. L., and Steinfeld, E. (2018). Accessible Public Transportation. New York, NY: Routlege.
Telfer, S., and Woodburn, J. (2010). The use of 3D surface scanning for the measurement and assessment of the human foot. J. Foot Ankle Res. 3, 1–19. doi: 10.1186/1757-1146-3-19
Unsworth, C. A., Chua, J., Naweed, A., Gudimetla, P., Nguyen, T. D., and Barnes, D. G. (2018). Use of 3D scanning technology to determine bus access for people using powered mobility aids. J. Transport Health 10, 350–360. doi: 10.1016/j.jth.2018.07.002
Unsworth, C. A., Rawat, V., Sullivan, J., Tay, R., Naweed, A., and Gudimetla, P. (2019a). 'I'm very visible but seldom seen“: consumer choice and use of mobility aids on public transport. Disab. Rehab. Assis. Technol. 14, 122–132. doi: 10.1080/17483107.2017.1407829
Unsworth, C. A., So, M. H., Chua, J., Gudimetla, P., and Naweed, A. (2019b). A systematic review of what is known about public transport accessibility for people using mobility aids. Disab. Rehab. 4, 1–15. doi: 10.1080/09638288.2019.1697382
Keywords: public transport, wheelchair, mobility scooter, disability, 3D scanning, accessibility
Citation: Unsworth CA, Chua J and Gudimetla P (2020) A 3D Measurement and Computerized Meshing Study to Promote Bus Ridership Among People Using Powered Mobility Aids. Front. Built Environ. 6:90. doi: 10.3389/fbuil.2020.00090
Received: 28 March 2020; Accepted: 18 May 2020;
Published: 17 June 2020.
Edited by:
Richard Tay, RMIT University, AustraliaReviewed by:
Amiruddin Bin Ismail, Universiti Kebangsaan Malaysia, MalaysiaJonathan M. Bunker, Queensland University of Technology, Australia
Copyright © 2020 Unsworth, Chua and Gudimetla. This is an open-access article distributed under the terms of the Creative Commons Attribution License (CC BY). The use, distribution or reproduction in other forums is permitted, provided the original author(s) and the copyright owner(s) are credited and that the original publication in this journal is cited, in accordance with accepted academic practice. No use, distribution or reproduction is permitted which does not comply with these terms.
*Correspondence: Carolyn A. Unsworth, c.unsworth@cqu.edu.au