Muscle preflex response to perturbations in locomotion: In vitro experiments and simulations with realistic boundary conditions
 Matthew Araz1,2*
  Sven Weidner3
  Fabio Izzi1,4
  Alexander Badri-Spröwitz4,5
  Tobias Siebert3
  Daniel F. B. Haeufle1,2,6†
- 1Hertie Institute for Clinical Brain Research, University of Tübingen, Tübingen, Germany
- 2Institute for Modelling and Simulation of Biomechanical Systems, University of Stuttgart, Stuttgart, Germany
- 3Department of Motion and Exercise Science, Institute of Sport and Movement Science, University of Stuttgart, Stuttgart, Germany
- 4Dynamic Locomotion Group, Max Plank Institute for Intelligent Systems, Stuttgart, Germany
- 5Department of Mechanical Engineering, KU Leuven, Leuven, Belgium
- 6Center for Integrative Neuroscience, University of Tübingen, Tübingen, Germany
Neuromuscular control loops feature substantial communication delays, but mammals run robustly even in the most adverse conditions. In vivo experiments and computer simulation results suggest that muscles’ preflex—an immediate mechanical response to a perturbation—could be the critical contributor. Muscle preflexes act within a few milliseconds, an order of magnitude faster than neural reflexes. Their short-lasting action makes mechanical preflexes hard to quantify in vivo. Muscle models, on the other hand, require further improvement of their prediction accuracy during the non-standard conditions of perturbed locomotion. Our study aims to quantify the mechanical work done by muscles during the preflex phase (preflex work) and test their mechanical force modulation. We performed in vitro experiments with biological muscle fibers under physiological boundary conditions, which we determined in computer simulations of perturbed hopping. Our findings show that muscles initially resist impacts with a stereotypical stiffness response—identified as short-range stiffness—regardless of the exact perturbation condition. We then observe a velocity adaptation to the force related to the amount of perturbation similar to a damping response. The main contributor to the preflex work modulation is not the change in force due to a change in fiber stretch velocity (fiber damping characteristics) but the change in magnitude of the stretch due to the leg dynamics in the perturbed conditions. Our results confirm previous findings that muscle stiffness is activity-dependent and show that also damping characteristics are activity-dependent. These results indicate that neural control could tune the preflex properties of muscles in expectation of ground conditions leading to previously inexplicable neuromuscular adaptation speeds.
1 Introduction
Legged locomotion on uneven terrain is a complex motor control task performed seemingly effortless by humans and other animals (Blickhan et al., 2007). Animals reject unexpected ground perturbations (Daley and Biewener, 2006; Müller et al., 2014), despite considerable sensorimotor transmission delays affecting the feedback control (More et al., 2010; More and Donelan, 2018). This ability has long puzzled researchers in biomechanics and motorcontrol science. In vivo research on perturbed legged locomotion suggests that the intrinsic mechanical properties of muscles are essential for dynamic stability during the first 30 ms–50 ms after touchdown (Nishikawa et al., 2007; Daley et al., 2009; Gordon et al., 2020). During this brief interval, muscles and tendons react instantly through elastic and viscous-like properties. Brown and Loeb (2000, p. 161) labeled it preflex; the “…zero-delay, intrinsic response of a neuromusculoskeletal system to a perturbation”.
In vivo walking experiments are essential for understanding robust locomotion. However, the functional mechanical and control coupling of muscle groups during whole-body movement complicates unveiling the regulatory principles behind preflexes, reflexes, and voluntary neuromuscular control. By artificially contracting individual muscle fibers, in vitro research allows for precise isolation and investigation of muscles’ mechanical properties (Weidner et al., 2022). So far, a wide range of contraction settings have been explored, such as isometric, isotonic, and isovelocity (Brown et al., 2003; Gilliver et al., 2011; Tomalka et al., 2020). Yet, the exact boundary conditions of physiological muscle contraction are hard to replicate in in vitro experiments. Cyclic fiber contractions during in vitro experiments and follow-up work loop analyses are relatively realistic (Josephson, 1985). Even though it is possible to extract physiological kinematic trajectories of muscle contraction with the sonomicrometry method during in vivo experiments (Daley et al., 2009; Gordon et al., 2020), extracting the preflex phase is still challenging due to the relative oscillations of soft tissue at impact (Christensen et al., 2017). Therefore, stretch-shortening cycle investigations that are limited to sinusoidal length trajectories (Darby et al., 2013) only roughly present locomotion conditions.
Previous simulation studies support the hypothesis that intrinsic muscle properties play a crucial role in stabilizing locomotion against disturbances (Gerritsen et al., 1998; Van Der Krogt et al., 2009; John et al., 2013). Simulation studies revealed that feedforward adjustment of muscle stimulation, as observed during human locomotion (Müller et al., 2015), may allow to adjust muscle mechanics according to perturbed impact conditions (Haeufle et al., 2010; 2018). As a means of investigation, computer simulations combine the advantages of in vivo and in vitro investigations. They enable the analysis of complex whole-body movements similar to in vivo research while providing access to difficult-to-measure variables, similar to in vitro experiments. Nevertheless, computer models depend on simplified assumptions. Most investigations of muscle preflex use classic Hill-type muscle models, which are restricted in their ability to describe muscle contraction outside of specific conditions (Siebert et al., 2021). Hill-type muscle models are parameterized with empirical data from isometric, isotonic, and isovelocity muscle fiber experiments, mostly at maximum activity, which are controlled experimental conditions differing greatly from in vivo muscle loading. Compared to data from gait recordings, Hill-type muscle models were inaccurate in predicting muscle force during high-speed locomotion (Lee et al., 2013; Dick et al., 2017). Furthermore, several studies showed that Hill-type muscle models can only predict accurate joint kinetics and kinematics for perturbed quiet stance (Hu et al., 2011; De Groote et al., 2017) if they consider a model extension accounting for short-range stiffness (Cui et al., 2008). Therefore, it still needs to be discovered to what extent simulation studies with Hill-type models can validate experimental research on muscle preflex. On the other hand, in vitro experiments are required to test individual muscle fibers’ response to unexpected perturbation.
This study aims at understanding how individual muscle fibers exploit their intrinsic mechanical properties to respond to perturbations in realistic settings (in terms of physiological boundary conditions). We focus on how muscles’ elastic and viscous properties regulate energy absorption during the preflex phase to reject perturbations during locomotion impacts. We hypothesize that (1) the muscle’s force and mechanical work during and after the short-range stiffness (SRS) period, but within the 30 ms preflex period, changes in reaction to differences in stretch velocities induced by step-up and step-down ground level perturbations, and (2) mechanical muscle properties can be tuned by changing activity level in advance to touchdown. We conducted muscle fiber experiments with realistic kinematic trajectories at three different activity levels to prove our hypotheses. We obtained the kinematic trajectories by simulating vertical human hopping driven by a Hill-type muscle model under three levels of perturbations: step-up, no step and step-down. Further, we derived a quasistatic-scenario for muscle fiber experiments with the same lengthening patterns over a much larger time to eliminate fiber’s velocity effect on the muscle force production. These quasistatic-scenario experiments permit separating the elastic response from the viscous response of muscle fibers. Finally, we compared simulations with muscle fiber experiments to test the accuracy of Hill-type models in explaining fiber response. Our results show that during the preflex phase, intrinsic muscle characteristics adjust the muscle force in response to the perturbation level. Our findings corroborate that muscle activity can tune mechanical muscle properties in advance. On the other hand, we confirm previous findings that classical Hill-type muscle models—as the one used in our study—cannot accurately predict the force response in the preflex phase. This not only the case within the SRS phase (Hu et al., 2011; De Groote et al., 2017), but also after the SRS, where the change in force with stretch velocity (Weidner et al., 2022) is not predicted by the model.
2 Materials and methods
The goal of this study was to test the force response of muscle fibers in realistic perturbation scenarios. Boundary conditions for in vitro muscle fiber experiments were derived from a human hopping simulation (Figure 1A). It is a simplified model of human hopping which consist of a point mass, a single leg with two segments, and a classical Hill-type muscle model connected as a knee extensor (Geyer et al., 2003; Haeufle et al., 2014; Izzi et al., 2023) (For details of the model see Supplementary Section S1). We performed three simulations with the hopping model: a no-perturbation reference hopping (P0), a step-up perturbation (P↑), and a step-down perturbation (P↓). Figure 1B shows the stimulation profile applied during the hopping simulation. During the first 30 ms (preflex), the stimulation is kept constant due to the delay of neural transmission, and response against the perturbation is dependent only on elastic and viscous intrinsic properties. Then, stimulation rises linearly with time (approximated from experimental findings for hopping (Moritz and Farley, 2004) and walking (Müller et al., 2015; 2020)). We extracted kinematic trajectories and the stimulation state during the preflex phase (Figure 1B) of the contractile element. These data were used as boundary conditions for muscle fiber experiments (conducted with the fibers taken from rat muscles) and their corresponding simulations of the isolated contractile element (Figures 1C, D). Notice that in the vertical hopping model (Figure 1A) the neural stimulation (u) is first filtered by activation dynamics (Rockenfeller et al., 2015; Hatze, 1977). However, in the simulation of isolated contractile element there is no activation dynamics included, the neural stimulation sent to the muscle and the muscle activation level is equal (u = a). This was necessary since the simulation of the isolated contractile element mimics the in vitro muscle fiber experiments for which no activation dynamics take place. The highlighted preflex phase (Figure 1B, shaded area)—is the focus of our study. Figure 1B shows also the behavior shortly after the preflex phase. However, the data after the preflex is measured with constant activity levels, as the in vitro setup does not allow for a time-controlled activity change. In the hopping simulation, the muscle activity rises after the preflex phase. We recorded force-length traces during these experiments and matching simulations and analyzed the preflex phases of work-loops from the mechanical work of the muscle fiber. The following sections provide details of the experiments and simulations conducted.
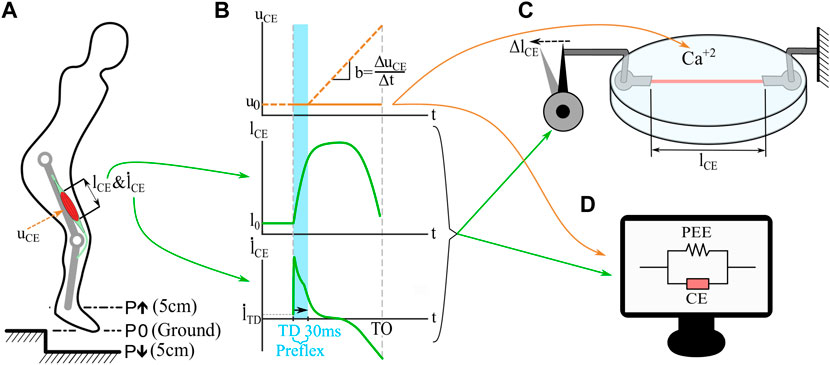
FIGURE 1. Simulations and in vitro experiments applied in this study. A Hill-type model muscle-tendon unit drives a knee extensor unit of the hopper (Geyer et al., 2003; Haeufle et al., 2014; Izzi et al., 2023). Single-leg hopping is computer-simulated (A) with three perturbation scenarios: 5 cm step-up (P↑), no perturbation (P0), and 5 cm step-down (P↓). The model outputs are length changes of the contractile element (lCE, (B)), and contraction velocities (
2.1 Muscle fiber experiments
2.1.1 Fiber preparation
One M. extensor digitorum longus (EDL) was extracted from a single female Wistar rat, which was sacrificed with an overdose of CO2 shortly before. We used n = 9 fibers from the extracted EDL muscle for our experiment. The specimen’s age was 8–10 months, at a body weight of 300 g–350 g. The specimen was kept at a 12 h light and 12 h dark cycle at a housing temperature of 22°C. The EDL muscle was obtained from the left hind limb. The experiment was conducted according to the guidelines of ARRIVE and approved according to the German animal protection law (Tierschutzgesetz §4(3), permit no. T170/18ST).
The techniques used for muscle preparation, storage, and activation of skinned single muscle fibers were carried out as described in detail in Tomalka et al. (2017). In summary, the EDL was prepared in 6–8 small fiber bundles, which were permeabilized in a skinning solution (see “Solutions”; Section 2.1.3) at 4°C temperature directly after preparation. Fiber bundles were transferred to a storage solution made of 50% glycerol and 50% skinning solution, and kept at −22°C for 6–8 weeks. Prior to conducting experiments, fibers were removed from the bundle using a dissecting microscope and fine forceps. Single fibers were cut into smaller muscle fiber segments with a length of 1 mm. Aluminum T-shaped clips were folded around both ends of the fiber. The fiber was then treated with a skinning solution consisting of a relaxing solution with 1% vol/vol Triton-X 100 for 3 min at 4°C until the complete removal of internal fiber membranes (Linari et al., 2007).
2.1.2 Experimental setup
The skinned muscle fiber was transferred from the skinning solution to the experimental chamber of the fiber test apparatus (600A, Aurora Scientific, ON, Canada). One clipped end was attached to a length controller (model 308B, Aurora Scientific, ON, Canada) and the other end to a force transducer (model 403A, Aurora Scientific, ON, Canada). Both attached ends were fixed with fingernail polish diluted with acetone (Getz et al., 1998). Transitions from the fiber end to the clip were treated with glutaraldehyde in rigor solution to improve mechanical performance and stability during the experiment (Hilber and Galler, 1998).
The central fiber segment was focused in the microscope and used to optically measure the sarcomere length (Weidner et al., 2022), which was set to 2.5 µm (means ± standard deviation) in the beginning. At this optimal sarcomere length lopt the fiber produces its maximum force Fmax (Stephenson and Williams, 1982). The corresponding muscle fiber length is defined as lopt. The height (h) and width (w) of the fiber was measured in 0.1 mm increments over the entire length of the fiber using a 10 x extra long working distance dry lens (NA 0.60, Nikon, Japan) and a 10 x eyepiece. The cross-sectional area of all tested muscle fibers was determined 5.25 × 10⁻⁹ m2 (±1.5 × 10⁻⁹) assuming an elliptical cross-section (π × h × w/4).
A high-speed video system (Aurora Scientific, 901B, Canada) in combination with a 10 x extra long working distance dry objective (NA 0.40, Nikon, Japan) and an accessory lens (2.5 x, Nikon, Japan) visualized and tracked dynamic changes in the sarcomere length. Videos were recorded at 300 Hz recording frequency.
2.1.3 Solutions
The relaxing solution contained 0.1 mol TES, 7.7 mmol MgCl2, 5.44 mmol Na2ATP, 25 mmol EGTA, 19.11 mmol Na2CP, 10 mmol GLH (pCa 9.0). The preactivating solution contained 0.1 mol TES, 6.93 mmol MgCl2, 5.45 mmol Na2ATP, 0.1 mmol EGTA, 19.49 mmol Na2CP, 10 mmol GLH, and 24.9 mmol HDTA. The skinning solution contained 0.17 mol potassium propionate, 2.5 mmol MgCl2, 2.5 mmol Na2ATP, 5 mmol EGTA, 10 mmol IMID, and 0.2 mmol PMSF. Recipes for activation solutions (‘ACT’) are shown in Table 1. The storage solution is the same as the skinning solution, except for the presence of 10 mmol GLH and 50% glycerol vol/vol. Cysteine and cysteine/serine protease inhibitors [trans-epoxysuccinyl-L-leucylamido-(4-guanidino) butane, E−64, 10 mM; leupeptin, 20 mg/mL] were added to all solutions to preserve lattice proteins and thus sarcomere homogeneity (Linari et al., 2007; Tomalka et al., 2017). KOH was applied to adjust to a pH 7.1 at 12 °C. Then, 450 U/mL of creatine kinase were added to all except skinning and storage solutions. Creatine kinase was obtained from Roche, Mannheim, Germany, and the remaining chemicals were obtained from Sigma, St Louis, MO. According to our calibration curve (Supplementary Figure S2) we chose concentrations of 6.73 pCa, 6.34 pCa and 6.3 pCa to best match the simulations boundary conditions.
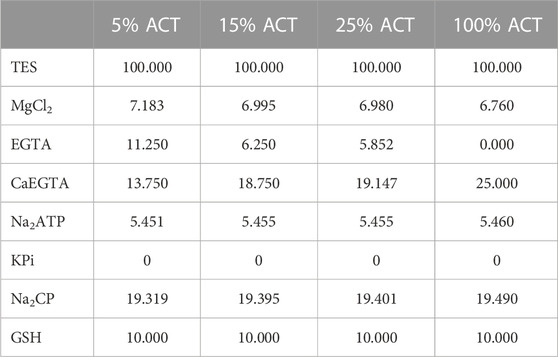
TABLE 1. Recipe of activation solutions used, values are in [mmol].
2.1.4 Experimental protocol
All experimental trials were conducted at a solution temperature of 12°C (±0.1). At this temperature, the skinned muscle fibers proved stable during work-loop experiments (Tomalka et al., 2021; Tomalka et al., 2020). Fibers can tolerate activation and active stretch protocols over a long period (Ranatunga, 1982; Ranatunga, 1984). A three-step approach was used to activate the fibers by calcium diffusion. First, muscle fibers were immersed for 60 s in a preactivation solution for equilibration. The fiber was then transferred to the activation solution. This led to a rapid increase in force until a plateau was reached. We defined the plateau as an isometric force increase of less than 1% rise of force within 1.5 s. After reaching the plateau, the perturbation was carried out. In the last step, the fiber was transferred to the relaxing solution, in which it was prepared for the subsequent activation for 400 s using cycling protocols (Tomalka et al., 2017).
The in vitro experiment included isometric contractions at optimal fiber length and three hopping stretch-shortening cycles based on the simulation data of the hopping model (Section 2.2). First, the activity level of the fiber in three sub-maximal conditions was checked using isometric contractions in 5%, 15%, 25%, and supra maximal activation solution at optimal fiber length. This step ensured matching boundary conditions with the simulation data. A flow chart of an experimental day for a single fiber is shown in Supplementary Figure S3. Hopping stretch-shortening cycles were applied to the fiber according to length and velocity data extracted from the simulations in the simulated dynamic-scenarios, and modified quasistatic-scenarios (see Section 2.2 for more details).
Both the order of stretch-shortening profiles and the order of activity levels within a perturbation, called a “block”, were randomized. Each block was surrounded by isometric reference contractions at optimal fiber length and full activity to take into account fiber degradation during force data normalization (Supplementary Figure S3).
Velocity, force, and length data were recorded at 1 kHz for isometric and quasistatic-scenario trials and 10 kHz for high-speed trials with an A/D interface (604A, Aurora Scientific, ON, Canada). The data acquisition was carried out with real-time software (600A, Aurora Scientific, ON, Canada). Data were loaded into MATLAB (MathWorks, MA, United States) and analyzed with a custom-written script. Forces during perturbation trials for every single fiber were divided by individual Fmax, and likewise, fiber length l by individual lopt, to normalize them.
2.2 Simulations
2.2.1 Generating hopping trajectories in simulation
To identify realistic boundary conditions for in vitro muscle fiber experiments, we extracted contractile element kinematics from a single-leg hopper simulation [(Izzi et al., 2023) based on the model by Geyer et al. (2003)]. The single-leg hopper is driven by a Hill-type muscle-tendon unit (MTU) model. The MTU model considers four elements: a contractile element representing the muscle fibers, a parallel elastic (PEE), a serial elastic (SEE), and a series damping (SDE) element (Haeufle et al., 2014). The modeled muscle-tendon unit extends the knee joint (Figure 1A). The leg features two massless segments connected by the knee hinge joint. The body mass is represented as a point mass located at the hip joint. For further details on the model, see Supplementary Material Section S1.
We simulated stable periodic hopping with the hopper model and introduced a step-up and a step-down perturbation (Figure 1A). During the flight phase, the muscle was stimulated with 15% constant stimulation, and the knee joint was fixed. After touchdown, the constant stimulation level continued for 30 ms throughout the preflex phase and then increased with a ramp input (b = 10 s−1, Figure 1B). Despite the constant stimulation during the preflex phase, the contractile element can change its force due to the elastic and viscous intrinsic properties, which are related to force-length and force-velocity, respectively. Since the Hill-type muscle is extending the knee in the hopping simulation, muscle-tendon unit and contractile element are stretched at the initial phases of the stretch-shortening cycle. Thus, the model operates at the eccentric section of the force-velocity relation (Haeufle et al., 2014):
Here
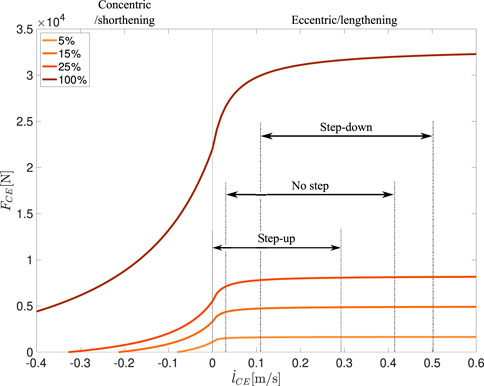
FIGURE 2. Force-velocity relation for the contractile element for activity levels of 5%, 15%, 25% and 100%. Shown intervals for each perturbation represent the stretch velocity ranges from touchdown to the end of preflex phase.
For a comparison between the biological muscle fiber and the Hill-type muscle model behavior, the parameters of the isometric force-length curve of the model were optimized to fit experimental data (Stephenson, 2003). More precisely, the width of the normalized bell-curve ΔWlimb and its exponent νCE,limb of the ascending limb were optimized with the lsqcurvefit function (MATLAB 2021b). All other parameters are based on Bayer et al. (2017), Kistemaker et al. (2006) and Mörl et al. (2012) and tabulated in the Supplementary Table S1.
2.2.2 Extracting boundary conditions
We simulated hopping for no-perturbation locomotion on ground level (P0), 5 cm step-up perturbation (P↑), and 5 cm step-down perturbation (P↓). Beyond step-up perturbations of 5 cm, the single-leg hopper generates unstable hopping patterns. Thus we decided to use a maximum perturbation height of 5 cm. The contractile element length and velocity profiles were extracted for each perturbation level. These kinematic data were used in muscle fiber experiments and isolated contractile element simulations to compare their reactions to the perturbations during the preflex phase.
We further derived quasistatic-scenario boundary conditions to differentiate between the muscle fibers’ velocity-dependent and length-dependent force modulation. To create a length-dependent force modulation, we generated quasistatic-scenario boundary conditions for each perturbation level. In these conditions, the time duration of the contractile element lengthening profiles obtained from each perturbation level was expanded by 80 times compared to the original duration. Thereby, the contraction velocity was decreased to negligible levels without exceeding the minimum speed limits of the experimental setup. Hence, the viscous contribution was minimized from the muscle fiber force response, and the muscles only reacted with their elastic properties to the perturbations.
2.2.3 Simulating isolated contractile element response
In the hopping simulation, the Hill-type muscle model calculates contractile element kinematics according to the dynamic balance of the serial (SEE and SDE) and contractile (CE and PEE) side of the model. However, in vitro experiments are conducted only with isolated muscle fascicles. To match in vitro conditions, we ran simulations solely with an isolated contractile element. Thereby, the isolated responses of the CE—corresponding to the muscle fibers—were calculated according to the provided contractile element length (lCE), contraction velocity (
We obtained the kinematic data of the contractile element from hopping simulations for step-up, no step and step-down perturbations. All perturbation cases were applied as input to the isolated contractile element model with constant activity levels of 5%, 15%, and 25%. Although the activity level increases after the preflex phase during hopping simulations, isolated contractile element model simulations must be kept constant to reproduce the conditions of in vitro muscle fiber experiments. In the experimental setup, the stimulation level is arranged with chemical baths, as explained in Section 2.1.3. The setup allows only a single stimulation level for each stretch-shortening cycle. Therefore, stimulation levels were kept constant in isolated contractile element simulations to match the experimental in vitro conditions.
2.3 Data analysis and statistics
2.3.1 Data analysis
The analysis of stretch-shortening cycles of both experimental and simulated fiber contractions focused on the preflex phase, which is the first 30 ms of dynamic-scenarios. We analyzed data in quasistatic-scenarios condition until the fiber lengthening reached the same level as at the end of the preflex phase in the dynamic-scenario conditions. We calculated the areas under force-length curves with the trapz function (MATLAB 2021b) to measure the work done by the muscle fibers and the isolated contractile element model. In addition, we estimated the muscle fiber’s short-range stiffness from the slope of fitted force-length curves during the initial phase of preflex [from 0.57–0.59
2.3.2 Statistics
SPSS 27 (IBM Corp., Armonk, NY) was used for the statistical analysis, with a significance level of p = 0.05. Initially, we tested for normal data distribution by running a Shapiro-Wilk, which was negative. Hence, we used a Friedman test to elucidate differences between the applied perturbations within one activity level. We executed comparisons pairwise for post hoc experimental data analysis. Results were fed into a Bonferroni correction to take multiple testing into account. We tested for differences between similar activity levels and applied perturbation between dynamic-scenario and quasistatic-scenario conditions with a two-sample paired sign test. Effect sizes for the pairwise comparisons were classified as small (d < 0.3), medium (0.3 < d < 0.5), and large (d > 0.5) using Cohen’s d (Cohen, 2013).
3 Results
During in vitro experiments, we found that intrinsic muscle properties adjust the force response to the perturbation condition within the preflex phase (Figure 3A, thick lines). Work loops of dynamic-scenario experiments for skinned fibers show muscle fibers are initially responding with similar force and with a linear and increasing trend between touchdown and 0.59
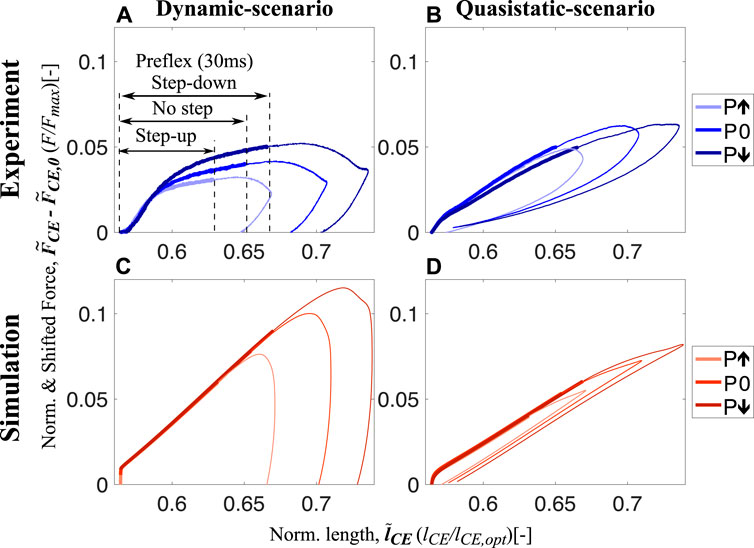
FIGURE 3. Shifted work loops for dynamic-scenario and quasistatic-scenario analysis step-up (P↑), no (P0) and step-down (P↓) perturbations for both experiments (A,B) and simulations (C,D) at 15% activity level (work loops for 5% and 25% are shared in Supplementary Figures S4, S5, respectively). The experimental data presented on (A,B) show the mean of all experimental trials. From touchdown to toe-off, all stretch-shortening cycle loops are plotted in the clockwise direction, and the thick and thin sections of the loops represent the preflex and remaining part of the stretch-shortening cycle, respectively. The preflex stretch gets longer from step-up to step-down perturbation since the muscle stretches faster in the same amount of time. The force-time curves for all experimental conditions with standard deviations can be found in Supplementary Figure S6 and Supplementary Figure S7 for dynamic-scenario and quasistatic-scenario, respectively.
The response we observed from the skinned fiber experiments does not match with the prediction of the isolated contractile element of the Hill-type muscle model (Figures 3A, C). For the Hill-type muscle model, an effect of the perturbation is only observed at touchdown (0.56
Contrary to the dynamic-scenario experiments (Figure 3A), force responses of skinned fibers in quasistatic-scenario stretches do not change according to the perturbation level (Figure 3B), during preflex. Initial force and the rise in force are similar for all perturbation levels. This result matches the prediction of the isolated contractile element of the Hill-type muscle model (Figure 3D).
We found that intrinsic muscle properties adjust the mechanical work during the preflex phase (preflex work) according to the perturbation condition. This is true in dynamic-scenario and quasistatic-scenario tests, both during experiments and simulation, and for all activity levels (Figure 4).
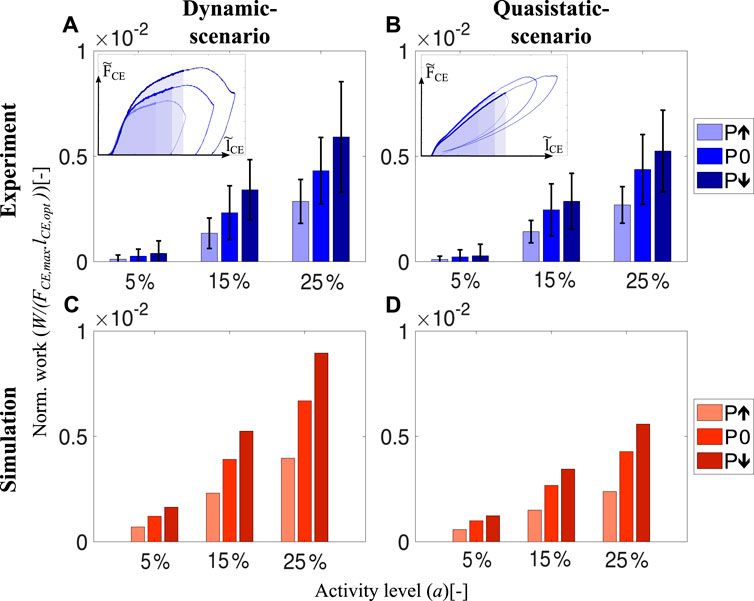
FIGURE 4. The amount of preflex work done by skinned fibers and the isolated contractile element of the Hill-type muscle model for all perturbation states and activity levels. In the dynamic-scenario analysis, work done during the preflex phase was calculated as the area under the force curve. Shaded areas in the insets (A) and (B) indicate changing perturbation levels. In the quasistatic-scenario analysis, the area till the lengthening reached at the end of the preflex phase was analyzed for each perturbation level. Bars in (A,B) and (C,D) indicate the work done by skinned muscle fibers and the isolated contractile element at dynamic-scenario and quasistatic-scenario, respectively. We calculated and indicate the area of the normalized works loops (Figure 3). Hence, there is no need to match the parameters of the hopping simulation to experimental muscle size.
The preflex work increases when comparing the step-up to the step-down perturbation, according to the dynamic-scenario analysis of skinned fibers (Figure 4A). Albeit no significant difference among perturbation states at 5% activity level (p = 0.169), a perturbation influence on preflex work is observable for 15% (χ2 = 12.61; p = 0.002) and 25% (χ2 = 14; p = 0.001) activity levels (Supplementary Table S2).
Preflex work changes significantly between activity levels. For the same kinematic profiles, the work done by skinned fibers increases if they are activated more (5%–25% activity level; p = 0.001). The work differences between the perturbation conditions increase with an increase in activity level. See the supplementary materials (Supplementary Table S3) for further details.
In the dynamic-scenario analysis, the muscle fibers’ response is a combination of two mechanical features: elasticity and viscosity. To identify their individual contributions, we minimized the parameter responsible for the viscous contribution—the stretch velocity. We performed quasistatic-scenario experiments, where muscles were stretched with the same lengthening profiles as in dynamic-scenario experiments, but at super-low velocities. Hence, with this experimental design, we expect to see only the elastic muscle fiber response. Still, even at negligible stretch velocities, we observed a similar preflex work trend between perturbation levels in quasistatic-scenario experiments and dynamic-scenario experiments (Figures 4A, B).
Surprisingly, the Hill-type muscle model predicted the amount of preflex work accurately for the dynamic-scenario experiments (Figures 4A, C) and the quasistatic-scenario experiments (Figures 4B, D). Such correct prediction is an expected outcome for quasistatic-scenario experiments but not for dynamic-scenario experiments, as the model’s dynamics differed compared to the muscle fiber dynamics (Figures 3A, C).
Work loops obtained from the dynamic-scenario analysis (Figure 3A; Supplementary Figure S4A; Supplementary Figure S5A) show that the force response of the muscle fibers is almost identical within the short-range stiffness (Rack and Westbury, 1974) regardless of the velocity profile. The force-time curves of all experimental conditions with standard deviations can be found in Supplementary Figure S6; Supplementary Figure S7 for the dynamic- and quasistatic-scenarios, respectively. Only after the short-range stiffness phase, the force and energy are affected by velocity (Figure 5). To understand the influence of velocity on the preflex work, we measure the area after the end of the short-range stiffness phase until the end of preflex, for the step-up perturbation condition (Figure 5A, inset: shaded areas). Work done in this phase is slightly higher for the faster stretches at 15% and 25% activity levels. However, the differences between the perturbation levels are not significant (15% activity: χ2 = 4.67, p = 0.097; 25% activity: χ2 = 3.56, p = 0.167; See Supplementary Table S2 for more details).
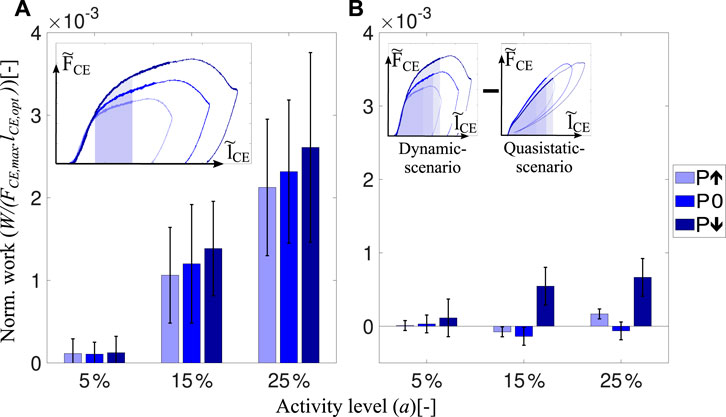
FIGURE 5. Influence of velocity adaptation on preflex work is represented. (A) shows the dissipated energies at dynamic-scenario experiments after the short-range stiffness till the end of the ‘step-up’ perturbation phase (shaded area shown in the inset). Elastic contribution is kept equal for all perturbation states. Thus, the difference in energy will be caused by the difference in velocity profiles. (B) shows the preflex work difference between the dynamic-scenario and quasistatic-scenario experiments for each perturbation level. The preflex work is shown in the insets as a shaded area and for multiple scenarios.
We compared activity levels affecting muscle work to see whether muscles’ viscous properties are tunable. Our results show that the activity level influences the amount of viscous contribution (Figure 5A) similar to the preflex work (Figure 4A). For the same kinematic profiles, a rising activity level causes a work increase by viscous characteristics of muscle fibers (15%–25% activity level; p = 0.001).
To understand the velocity-related adaptation throughout the preflex phase, we subtract the work done in the quasistatic-scenario experiments from dynamic-scenario experiments, shown as inset in Figure 5B. Surprisingly, the amount of work done by muscle fibers at dynamic-scenario and quasistatic-scenario experiments are almost identical, and we measured no significant effect of the velocity on the preflex work (Supplementary Table S4). Both comparisons between perturbations and between dynamic- and quasistatic-scenarios showed that velocity differences had no significant effect on the preflex work.
Analysis of the short-range stiffness shows no difference between perturbations but significant differences between activity levels (Figure 6A). In quasistatic-scenario experiments, we found no significant differences between perturbation levels. However, short-range stiffness was less in quasistatic-scenario stretches (Figure 6B) than in dynamic-scenario experiments (Figure 6A), and the difference between them increased with higher activities (Supplementary Table S4). Hence, short-range stiffness is increasing from quasistatic-scenario (Figure 6D) to dynamic-scenario velocities (Figure 6C). However, short-range stiffness does not change according to the difference in velocity between the perturbation levels (Figure 6C, different shades of thick blue lines). Besides, the stiffness value can be arranged by changing the activity level.
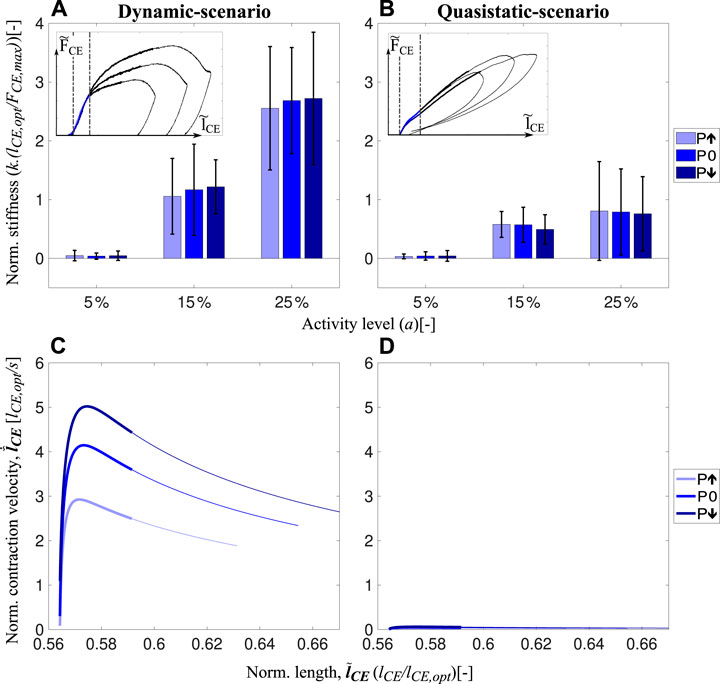
FIGURE 6. Short-range stiffness of muscle fibers during the dynamic-scenario (A). Stiffness amount during the short-range stiffness lengthening during quasistatic-scenario experiments (B) for all perturbation and activity levels are shown in the bar charts. Boundary conditions for the stiffness calculations for both speed conditions are shown as insets. In addition, velocity-length profiles during the preflex phase are presented in (C) and (D) for actual and quasistatic-scenario experiments, respectively. Thick lines show the short-range stiffness phase, and thin lines present the remaining part of the preflex phase.
4 Discussion
In this study, we presented the first in vitro experiments conducted under realistic boundary conditions and activity levels of perturbed hopping. Our aim is to understand how intrinsic mechanical properties of an individual muscle fiber result in the modulation of the force output to perturbation during locomotion. We extracted the boundary conditions from a hopping simulation for three levels of perturbations. Here, we discuss surprising outcomes that we observed from our in vitro experiments and simulations. As hypothesized, muscles modulate their force response to the stretch velocities. However, this modulation is not the main contributor to the preflex work. In addition, we observed that muscle’s intrinsic properties are tunable by changing the activity level.
4.1 Muscle response to perturbations at dynamic-scenario
During dynamic-scenario experiments, muscle fibers initially react elastically to the sudden perturbation, known as short-range stiffness (Rack and Westbury, 1974; Kirsch et al., 1994). Muscles then transition into a viscoelastic behavior (Figure 3A). In the short-range stiffness region, we found no significant changes in fiber work, despite of different perturbations changed stretch velocities (Figure 6C). We calculated fiber work starting at the beginning of the stretch, until the end of the short-range stiffness phase at 0.59
After the short-range stiffness phase, i.e., from 0.59
Two factors contribute to the increasing preflex work in our study. The first factor is the higher force when assuming the same stretch is considered for calculating the preflex work (Figure 5A, inset). For the specified area, all energetic differences between perturbations are the result of muscle fibers’ viscous behavior since stretch amounts are identical. In that case, we observed no significant differences in preflex work between perturbations. Second, higher velocities cause a larger fibers stretch in the preflex phase (Figure 3A). If the larger stretch is fully considered, differences in preflex work between the perturbation cases become significant (Figure 4A). We find a rising trend in dissipated energy with the increase of stretch velocity from step-up to step-down perturbations. Hence, muscles adjust their work response primarily due to a change of stretch caused by locomotion perturbation.
4.2 Tuning the force and energy response by activity level
Humans increase muscle activity in preparation for a step-down perturbation, as previously shown (Müller et al., 2015; Müller et al., 2012). The increased muscle activity strategy increases walking robustness (Haeufle et al., 2018). To test whether increased activity leads to higher muscle stiffness and work in this scenario, we conducted muscle fiber experiments with activity levels of 5%, 15%, and 25% for each perturbation case while keeping the kinematics identical.
The results confirm previous findings (Campbell et al., 2014) that the short-range stiffness increases with activity level (Figure 6A). As short-range stiffness is likely due to the stretch of attached cross-bridges (Getz et al., 1998; Pinniger et al., 2006), an increase in short-range stiffness can be explained by the increasing number of attached cross-bridges with increasing activity level (Metzger and Moss, 1990).
Additionally, we found that higher activity levels result in significantly higher preflex work (Figure 4A). Tomalka et al. (2021) likewise reported an increase in work with an increasing number of active cross-bridges in the eccentric phase of the ramp-like stretch-shortening cycles. An increase in preflex work with increasing activity level might be explained by an increasing number of forcibly detached cross-bridges after the short-range stiffness phase. The number of forcibly detached cross-bridges might increase (at the given stretch kinematics) as a fraction of the increasing number of attached cross-bridges with activity level (Wahr and Rall, 1997). Forced detachment of cross-bridges is expected (Weidner et al., 2022) in the range of the tested stretch velocities (3 lopt/s to 5 lopt/s; Figure 6). Additionally, viscoelastic properties of non-cross-bridge structures (e.g., titin) might contribute to energy dissipation in a velocity-dependent manner (Herzog et al., 2014; Freundt and Linke, 2019; Tomalka et al., 2021). Furthermore, with higher activity, the differences between perturbation cases become more prominent, and, for 25%, even significant (Figure 4A).
Consequently, humans and animals may tune their muscle stiffness during the short-range stiffness phase (Figure 6A) and their muscle work after the short-range stiffness phase (Figure 5A) utilizing the activity level. Thus, increased muscle stiffness and work in preparation for an expected perturbation are possible by increasing the muscle pre-activity level.
4.3 Dynamic- versus quasistatic-scenario
During the preflex phase of the quasistatic-scenario experiments, when muscles are stretched with negligible velocities, they respond with a linear force increase which is almost the same regardless of the perturbation case (Figure 3B). Comparison of dynamic-scenario and quasistatic-scenario experiments show that velocity is not only adding a viscous behavior to the response (Figure 3A, B), but also a visible short-range stiffness contribution (Figure 6). In previous isovelocity stretch experiments, the initial force response (i.e., short-range stiffness) was velocity dependent (Rack and Westbury, 1974; Pinniger et al., 2006), especially when the strain rate was varied over several orders of magnitude. For example, Pinniger et al. (2006) showed that the initial force response differs between slow (0.1 lopt/s) and fast (2 lopt/s) stretches. However, for contractions faster than 2 lopt/s they observed no significant difference in the short-range stiffness. Weidner et al. (2022) observed differences in the short-range stiffness between 0.01 lopt/s and 1 lopt/s stretches. Our results align with these previous findings: while the short-range stiffness appears to be velocity-independent within the range of velocities tested in our dynamic-scenario experiments (reached peak velocities from 3 lopt/s to 5 lopt/s; Figure 6C), the comparison to the quasistatic-scenario experiments (reached maximum peak velocity of 0.05 lopt/s, Figure 6D) revealed that the short-range stiffness actually reflects a muscle behavior that varies with large differences of velocity.
Interestingly, even though the dynamic behaviors during the preflex phase differ between quasistatic-scenario and dynamic-scenario conditions (Figures 3A, B), we observed almost equal amounts of mechanical work at quasistatic-scenario compared to dynamic-scenario stretches for each activity level (Figures 4A, B).
Possibly, myosin heads are detached forcibly from actin at high velocities during eccentric contractions. This will decrease muscle force generation (Weidner et al., 2022) observed during in situ and in vitro experiments (Griffiths et al., 1980; Krylow and Sandercock, 1997; Till et al., 2008; Fukutani et al., 2019; Tomalka et al., 2020; Weidner et al., 2022). On the other hand, during the quasistatic-scenario stretches, ultra-slow-speed stretches allow cross-bridges to bind easier and longer than during rapid contractions (Huxley, 1957; Herzog, 2018). Hence, similar forces during the preflex stretch phase result in similar amounts of energy dissipation in quasistatic-scenario and dynamic-scenario experiments.
4.4 Muscle fibers versus Hill-type muscle model
Since Hill’s empirical investigations of muscle contraction dynamics, Hill-type models have played a crucial role in biomechanics research (Hill, 1938; Rode and Siebert, 2017). These models have been improved over the years, but they are still limited in predicting muscle forces, especially during eccentric (lengthening) contractions (Till et al., 2008; Siebert et al., 2021). Surprisingly, our results show that the magnitude and trends in mechanical work predicted by the Hill-type contractile element model are similar to the work of muscle fibers for fast eccentric contractions (Figures 4A, C). This is an unexpected outcome since the force response of the Hill-type muscle model and muscle fibers differs (Figures 3A, C). We show that the main source of preflex-work modulation to perturbation height is the amount of muscle stretch rather than the viscous force adaptation.
Our quasistatic-scenario experiments and simulations proved that the force-length relation of the Hill-type muscle model could accurately estimate the length-dependent force and mechanical work response of muscle fibers for the investigated conditions (relatively short muscle fibers at low activity levels). Because the length-dependent behavior of muscle fibers is the main force contributor during preflex, the Hill-type muscle model predicts work for the larger stretch in response to the fast contraction reasonably well.
Although the Hill-type muscle model estimates work during preflex with good accuracy, it still requires improvements for better force prediction during fast contractions (Figures 3A, C). The short-range stiffness had previously been observed in other fiber experiments (Rack and Westbury, 1974; Tomalka et al., 2021; Weidner et al., 2022). We observed that the short-range stiffness was activity- and velocity-dependent (Figure 6), at least for the velocity difference between dynamic-scenario and quasistatic-scenario experiments (Figures 3A, B). However, our Hill-type muscle model cannot generate the high-stiffness response of a short-range stiffness, since short-range stiffness is not a built-in mechanical property (Haeufle et al., 2014). So far, the short-range stiffness model proposed by Cui et al. (2008) has been implemented in several musculoskeletal simulations to study the influence of short-range stiffness on the end point stiffness of the human arm in static postures (Hu et al., 2011) and postural stability while standing (De Groote et al., 2017). These simulation studies showed that including short-range stiffness in a Hill-type muscle model improves estimation of joint angles, torques and stiffness (Hu et al., 2011), as well as postural stability against external perturbations (De Groote et al., 2017). Together with our results, we expect that Hill-type muscle models that feature short-range stiffness should provide a better force estimation at and immediately after impact. Therefore, we consider short-range stiffness an essential model feature for the understanding of gait mechanics leading to stable locomotion.
The force modulation to the perturbation velocity after the short-range stiffness (Figures 3A, C) is also not accurately modeled in the Hill-type muscle model. Here, the Hill-type muscle model operates in the plateau region of the eccentric force-velocity relation (Figure 2). The model, therefore, does not show any modulation of the force due to the perturbation-related changes in fiber velocity, in contrast to the observations in the experiments (Figures 3A, C). This plateau-form of the eccentric force-length relation was introduced by van Soest and Bobbert (1993), while their results are consistent with our simulation data, they do not explain the experimental results of the present study. Possible reasons for the deviation of the experiment can be the starting length of the contraction, the sub-maximal activity level or the underlying model. However, the results of Krylow and Sandercock (1997) suggest that the starting length has no influence on the point of occurrence of the eccentric force-velocity-relation’s plateau. Regarding the sub-maximal activity level and its effects, it is known that the calcium concentration has an influence on the cross-bridge kinetics (Brenner, 1988). Nevertheless, to the best of our knowledge, there is no study that looked at the dependency of the eccentric force-velocity relation on the activity level within the contractile element only. A likely explanation for the discrepancy is simplification of the contraction by the model. For example, the Hill-type muscle model lacks the implementation of “Give” (Flitney and Hirst, 1978), which on the one hand is speed-dependent and on the other hand occurs directly after the end of the short-range stiffness (Weidner et al., 2022). The force and work responses show that the modeling of eccentric muscle behavior needs to be modified for better estimation of the dynamic response to perturbations during fast eccentric contractions. In addition, the effect of the neural reflex response after the preflex phase will have a significant effect on the post-preflex force generation (Nichols and Houk, 1976) and should also be examined in further experiments with an appropriately updated experimental setup.
4.5 Study limitations
This study aimed at analyzing how a single muscle fiber reacts to ground perturbations in real life. It is known that the temperature influences the muscle properties (e.g., Fmax, Vmax, (Ranatunga, 1984; Stephenson and Williams, 1985; Zhao and Kawai, 1994)) and thus the force response to disturbances. Therefore, temperature influences on the force response to perturbations should be investigated in future studies. We conducted single-leg hopping simulations using a Hill-type muscle model as a knee extensor muscle to generate kinematic boundary conditions for in vitro experiments. However, Hill-type muscle models have limitations discussed in previous chapters, and simulation and real-life muscle lengthening may differ. Additionally, our in vitro experimental setup allows only constant activity levels. Even though in the hopping simulations after the preflex phase activity rises, due to the setup limitations, we perform the kinematic analysis with the constant preflex activity level, which is not the case in in vivo hopping (Moritz and Farley, 2004) and locomotion (Müller et al., 2015). Thus, we only focused our analysis on the preflex phase. We assume a preflex time-span of 30 ms based on the reflex delay scaling found by More et al. (2010). Since we do not consider a full work loop, this study’s design does not directly allow us to calculate damping, i.e., the amount of energy dissipation in a full cycle. However, the velocity-dependent modulation of preflex work indicates a viscous-like response, which we identify as a damping behavior.
5 Conclusion
Previous experimental and simulation studies indicated that muscles’ preflex capability to adjust force to unexpected ground conditions is essential in stabilizing hopping and locomotion. Our study confirms these findings and shows three mechanisms: (1) muscle force adapts to the change in stretch velocity caused by a perturbation; (2) the overall fiber stretch in the preflex duration is larger for larger stretch velocities resulting in increased preflex work; (3) with increasing muscle activity short-range stiffness and muscle force increase. Mechanism (1) is the hypothesized viscous effect of the force-velocity relationship but plays a minor role compared to the mechanism (2). Together, (1) and (2) result in a beneficial and significant modulation of muscle force to perturbations and thus confirm the preflex hypothesis. Mechanism (3) allows for a simple neuronal strategy to tune the muscle properties to ground conditions and unexpected perturbations and aligns with feed-forward strategies observed in human locomotion (Müller et al., 2012).
Data availability statement
All experimental data and the Matlab/Simulink files needed to generate manuscript results and figures are available in Zenodo (doi.org/10.5281/zenodo.7774608).
Ethics statement
The experiment was conducted according to the guidelines of ARRIVE and approved according to the German animal protection law (Tierschutzgesetz §4(3), permit no. T170/18ST).
Author contributions
MA, SW, AB-S, TS, and DH conceptualized the project. FI and MA conducted computer simulations. MA and SW conducted the experiments and analyzed the data. MA and SW prepared the manuscript, and all authors revised and approved the submitted version.
Funding
This work was funded by the Deutsche Forschungsgemeinschaft (DFG, German Research Foundation)—449912641-HA 7170/3, SI 841/22-1 and BA 7275/3-1. The authors thank the International Max Planck Research School for Intelligent Systems (IMPRS-IS) for supporting FI. We acknowledge support by Open Access Publishing Fund of University of Tübingen.
Conflict of interest
The authors declare that the research was conducted in the absence of any commercial or financial relationships that could be construed as a potential conflict of interest.
Publisher’s note
All claims expressed in this article are solely those of the authors and do not necessarily represent those of their affiliated organizations, or those of the publisher, the editors and the reviewers. Any product that may be evaluated in this article, or claim that may be made by its manufacturer, is not guaranteed or endorsed by the publisher.
Supplementary material
The Supplementary Material for this article can be found online at: https://www.frontiersin.org/articles/10.3389/fbioe.2023.1150170/full#supplementary-material
References
Bayer, A., Schmitt, S., Günther, M., and Haeufle, D. (2017). The influence of biophysical muscle properties on simulating fast human arm movements. Comput. methods biomechanics Biomed. Eng. 20, 803–821. doi:10.1080/10255842.2017.1293663
Blickhan, R., Seyfarth, A., Geyer, H., Grimmer, S., Wagner, H., and Günther, M. (2007). Intelligence by mechanics. Philosophical Trans. R. Soc. A Math. Phys. Eng. Sci. 365, 199–220. doi:10.1098/rsta.2006.1911
Brenner, B. (1988). Effect of ca2+ on cross-bridge turnover kinetics in skinned single rabbit psoas fibers: Implications for regulation of muscle contraction. Proc. Natl. Acad. Sci. 85, 3265–3269. doi:10.1073/pnas.85.9.3265
Brown, I. E., and Loeb, G. E. (2000). “A reductionist approach to creating and using neuromusculoskeletal models,” in Biomechanics and neural control of posture and movement. Editors J. M. Winters,, and P. E. Crago (New York, NY: Springer), 148–163. doi:10.1007/978-1-4612-2104-3_10
Brown, N. A. T., Pandy, M. G., Kawcak, C. E., and McIlwraith, C. W. (2003). Force- and moment-generating capacities of muscles in the distal forelimb of the horse. J. Anat. 203, 101–113. doi:10.1046/j.1469-7580.2003.00206.x
Campbell, K. S., Jitandrakumar, R., and Moss, R. L. (2014). Cycling cross-bridges increase myocardial stiffness at submaximal levels of Ca2+ activation. Biophysical J. 84, 3807–3815. doi:10.1016/S0006-3495(03)75108-X
Christensen, K. B., Günther, M., Schmitt, S., and Siebert, T. (2017). Strain in shock-loaded skeletal muscle and the time scale of muscular wobbling mass dynamics. Sci. Rep. 7, 13266–13311. doi:10.1038/s41598-017-13630-7
Cui, L., Perreault, E. J., Maas, H., and Sandercock, T. G. (2008). Modeling short-range stiffness of feline lower hindlimb muscles. J. Biomechanics 41, 1945–1952. doi:10.1016/j.jbiomech.2008.03.024
Daley, M. A., and Biewener, A. A. (2006). Running over rough terrain reveals limb control for intrinsic stability. Proc. Natl. Acad. Sci. 103, 15681–15686. doi:10.1073/pnas.0601473103
Daley, M. A., Voloshina, A., and Biewener, A. A. (2009). The role of intrinsic muscle mechanics in the neuromuscular control of stable running in the Guinea fowl. J. physiology 587, 2693–2707. doi:10.1113/jphysiol.2009.171017
Darby, J., Li, B., Costen, N., Loram, I., and Hodson-Tole, E. (2013). Estimating skeletal muscle fascicle curvature from b-mode ultrasound image sequences. IEEE Trans. Biomed. Eng. 60, 1935–1945. doi:10.1109/tbme.2013.2245328
De Groote, F., Allen, J. L., and Ting, L. H. (2017). Contribution of muscle short-range stiffness to initial changes in joint kinetics and kinematics during perturbations to standing balance: A simulation study. J. Biomechanics 55, 71–77. doi:10.1016/j.jbiomech.2017.02.008
Dick, T. J. M., Biewener, A. A., and Wakeling, J. M. (2017). Comparison of human gastrocnemius forces predicted by Hill-type muscle models and estimated from ultrasound images. J. Exp. Biol. 154807, 1643–1653. jeb. doi:10.1242/jeb.154807
Flitney, F., and Hirst, D. (1978). Cross-bridge detachment and sarcomere’give’during stretch of active frog’s muscle. J. Physiology 276, 449–465. doi:10.1113/jphysiol.1978.sp012246
Freundt, J. K., and Linke, W. A. (2019). Titin as a force-generating muscle protein under regulatory control. J. Appl. physiology 126, 1474–1482. doi:10.1152/japplphysiol.00865.2018
Fukutani, A., Leonard, T., and Herzog, W. (2019). Does stretching velocity affect residual force enhancement? J. Biomechanics 89, 143–147. doi:10.1016/j.jbiomech.2019.04.033
Gerritsen, K. G., van den Bogert, A. J., Hulliger, M., and Zernicke, R. F. (1998). Intrinsic muscle properties facilitate locomotor control—A computer simulation study. Mot. control 2, 206–220. doi:10.1123/mcj.2.3.206
Getz, E. B., Cooke, R., and Lehman, S. L. (1998). Phase transition in force during ramp stretches of skeletal muscle. Biophysical J. 75, 2971–2983. doi:10.1016/s0006-3495(98)77738-0
Geyer, H., Seyfarth, A., and Blickhan, R. (2003). Positive force feedback in bouncing gaits? Proc. R. Soc. Lond. Ser. B Biol. Sci. 270, 2173–2183. doi:10.1098/rspb.2003.2454
Gilliver, S. F., Degens, H., Rittweger, J., and Jones, D. (2011). Effects of submaximal activation on the determinants of power of chemically skinned rat soleus fibres. Exp. Physiol. 96, 171–178. doi:10.1113/expphysiol.2010.054239
Gordon, J. C., Holt, N. C., Biewener, A., and Daley, M. A. (2020). Tuning of feedforward control enables stable muscle force-length dynamics after loss of autogenic proprioceptive feedback. Elife 9, e53908. doi:10.7554/elife.53908
Griffiths, P., Güth, K., Kuhn, H., and Rüegg, J. (1980). Cross bridge slippage in skinned frog muscle fibres. Biophysics Struct. Mech. 7, 107–124. doi:10.1007/bf00538402
Haeufle, D. F. B., Schmortte, B., Geyer, H., Müller, R., and Schmitt, S. (2018). The benefit of combining neuronal feedback and feed-forward control for robustness in step down perturbations of simulated human walking depends on the muscle function. Front. Comput. Neurosci. 12, 80. doi:10.3389/fncom.2018.00080
Haeufle, D., Grimmer, S., and Seyfarth, A. (2010). The role of intrinsic muscle properties for stable hopping—Stability is achieved by the force–velocity relation. Bioinspiration biomimetics 5, 016004. doi:10.1088/1748-3182/5/1/016004
Haeufle, D., Günther, M., Bayer, A., and Schmitt, S. (2014). Hill-type muscle model with serial damping and eccentric force–velocity relation. J. Biomechanics 47, 1531–1536. doi:10.1016/j.jbiomech.2014.02.009
Hatze, H. (1977). A myocybernetic control model of skeletal muscle. Biol. Cybern. 25, 103–119. doi:10.1007/BF00337268
Herzog, J. A., Leonard, T. R., Jinha, A., and Herzog, W. (2014). Titin (visco-) elasticity in skeletal muscle myofibrils. Mol. Cell. biomechanics MCB 11, 1–17.
Herzog, W. (2018). Why are muscles strong, and why do they require little energy in eccentric action? J. Sport Health Sci. 7, 255–264. doi:10.1016/j.jshs.2018.05.005
Hilber, K., and Galler, S. (1998). Improvement of the measurements on skinned muscle fibres by fixation of the fibre ends with glutaraldehyde. J. Muscle Res. Cell Motil. 19, 365–372. doi:10.1023/a:1005393519811
Hill, A. V. (1938). The heat of shortening and the dynamic constants of muscle. Proc. R. Soc. Lond. Ser. B-Biological Sci. 126, 136–195.
Hu, X., Murray, W. M., and Perreault, E. J. (2011). Muscle short-range stiffness can be used to estimate the endpoint stiffness of the human arm. J. Neurophysiology 105, 1633–1641. doi:10.1152/jn.00537.2010
Huxley, A. F. (1957). Muscle structure and theories of contraction. Prog. Biophys. Biophys. Chem. 7, 255–318. doi:10.1016/s0096-4174(18)30128-8
Izzi, F., Mo, A., Schmitt, S., Badri-Spröwitz, A., and Haeufle, D. F. B. (2023). Muscle prestimulation tunes velocity preflex in simulated perturbed hopping. Sci. Rep. 13, 4559. doi:10.1038/s41598-023-31179-6
John, C. T., Anderson, F. C., Higginson, J. S., and Delp, S. L. (2013). Stabilisation of walking by intrinsic muscle properties revealed in a three-dimensional muscle-driven simulation. Comput. methods biomechanics Biomed. Eng. 16, 451–462. doi:10.1080/10255842.2011.627560
Josephson, R. K. (1985). Mechanical power output from striated muscle during cyclic contraction. J. Exp. Biol. 114, 493–512. doi:10.1242/jeb.114.1.493
Kirsch, R., Boskov, D., and Rymer, W. (1994). Muscle stiffness during transient and continuous movements of cat muscle: Perturbation characteristics and physiological relevance. IEEE Trans. Biomed. Eng. 41, 758–770. doi:10.1109/10.310091
Kistemaker, D. A., Van Soest, A. J., and Bobbert, M. F. (2006). Is equilibrium point control feasible for fast goal-directed single-joint movements? J. Neurophysiology 95, 2898–2912. doi:10.1152/jn.00983.2005
Krylow, A. M., and Sandercock, T. G. (1997). Dynamic force responses of muscle involving eccentric contraction. J. biomechanics 30, 27–33. doi:10.1016/s0021-9290(96)00097-8
Lee, S. S., Arnold, A. S., Miara, M., Biewener, A. A., and Wakeling, J. M. (2013). Accuracy of gastrocnemius muscles forces in walking and running goats predicted by one-element and two-element Hill-type models. J. Biomechanics 46, 2288–2295. doi:10.1016/j.jbiomech.2013.06.001
Linari, M., Caremani, M., Piperio, C., Brandt, P., and Lombardi, V. (2007). Stiffness and fraction of myosin motors responsible for active force in permeabilized muscle fibers from rabbit psoas. Biophysical J. 92, 2476–2490. doi:10.1529/biophysj.106.099549
Metzger, J. M., and Moss, R. L. (1990). Calcium-sensitive cross-bridge transitions in mammalian fast and slow skeletal muscle fibers. Science 247, 1088–1090. doi:10.1126/science.2309121
More, H. L., and Donelan, J. M. (2018). Scaling of sensorimotor delays in terrestrial mammals. Proc. R. Soc. B 285, 20180613. doi:10.1098/rspb.2018.0613
More, H. L., Hutchinson, J. R., Collins, D. F., Weber, D. J., Aung, S. K. H., and Donelan, J. M. (2010). Scaling of sensorimotor control in terrestrial mammals. Proc. R. Soc. B Biol. Sci. 277, 3563–3568. doi:10.1098/rspb.2010.0898
Moritz, C. T., and Farley, C. T. (2004). Passive dynamics change leg mechanics for an unexpected surface during human hopping. J. Appl. Physiology 97, 1313–1322. doi:10.1152/japplphysiol.00393.2004
Mörl, F., Siebert, T., Schmitt, S., Blickhan, R., and Guenther, M. (2012). Electro-mechanical delay in hill-type muscle models. J. Mech. Med. Biol. 12, 1250085. doi:10.1142/s0219519412500856
Müller, R., Haeufle, D. F. B., and Blickhan, R. (2015). Preparing the leg for ground contact in running: The contribution of feed-forward and visual feedback. J. Exp. Biol. 218, 451–457. doi:10.1242/jeb.113688
Müller, R., Siebert, T., and Blickhan, R. (2012). Muscle preactivation control: Simulation of ankle joint adjustments at touchdown during running on uneven ground. J. Appl. Biomechanics 28, 718–725. doi:10.1123/jab.28.6.718
Müller, R., Tschiesche, K., and Blickhan, R. (2014). Kinetic and kinematic adjustments during perturbed walking across visible and camouflaged drops in ground level. J. Biomechanics 47, 2286–2291. doi:10.1016/j.jbiomech.2014.04.041
Müller, R., Vielemeyer, J., and Häufle, D. F. B. (2020). Negotiating ground level perturbations in walking: Visual perception and expectation of curb height modulate muscle activity. J. Biomechanics 113, 110121. doi:10.1016/j.jbiomech.2020.110121
Nichols, T. R., and Houk, J. C. (1976). Improvement in linearity and regulation of stiffness that results from actions of stretch reflex. J. Neurophysiology 39, 119–142. doi:10.1152/jn.1976.39.1.119
Nishikawa, K., Biewener, A. A., Aerts, P., Ahn, A. N., Chiel, H. J., Daley, M. A., et al. (2007). Neuromechanics: An integrative approach for understanding motor control. Integr. Comp. Biol. 47, 16–54. doi:10.1093/icb/icm024
Pinniger, G. J., Ranatunga, K. W., and Offer, G. W. (2006). Crossbridge and non-crossbridge contributions to tension in lengthening rat muscle: Force-induced reversal of the power stroke. J. Physiology 573, 627–643. doi:10.1113/jphysiol.2005.095448
Rack, P., and Westbury, D. (1974). The short range stiffness of active mammalian muscle and its effect on mechanical properties. Jourrnal Physiology 240, 331–350. doi:10.1113/jphysiol.1974.sp010613
Ranatunga, K. W. (1982). Temperature-dependence of shortening velocity and rate of isometric tension development in rat skeletal muscle. J. Physiology 329, 465–483. doi:10.1113/jphysiol.1982.sp014314
Ranatunga, K. W. (1984). The force-velocity relation of rat fast- and slow-twitch muscles examined at different temperatures. J. Physiology 351, 517–529. doi:10.1113/jphysiol.1984.sp015260
Rockenfeller, R., Günther, M., Schmitt, S., and Götz, T. (2015). Comparative sensitivity analysis of muscle activation dynamics. Comput. Math. Methods Med. 2015, 1–16. doi:10.1155/2015/585409
Rode, C., and Siebert, T. (2017). “Muscle-like actuation for locomotion,” in Bioinspired legged locomotion. Editors A. S. Maziar,, and A. Seyfarth (Butterworth-Heinemann), 565–590. doi:10.1016/B978-0-12-803766-9.00011-7
Siebert, T., Screen, H. R. C., and Rode, C. (2021). “Computational modelling of muscle, tendon, and ligaments biomechanics,” in Computational modelling of biomechanics and biotribology in the musculoskeletal system (Elsevier), 155–186.
Stephenson, D. G. (2003). Relationship between isometric force and myofibrillar MgATPase at short sarcomere length in skeletal and cardiac muscle and its relevance to the concept of activation heat. Clin. Exp. Pharmacol. Physiology 30, 570–575. doi:10.1046/j.1440-1681.2003.03881.x
Stephenson, D. G., and Williams, D. A. (1982). Effects of sarcomere length on the force-pca relation in fast- and slow-twitch skinned muscle fibres from the rat. J. Physiology 333, 637–653. doi:10.1113/jphysiol.1982.sp014473
Stephenson, D., and Williams, D. (1985). Temperature-dependent calcium sensitivity changes in skinned muscle fibres of rat and toad. J. physiology 360, 1–12. doi:10.1113/jphysiol.1985.sp015600
Stollenmaier, K., and Haeufle, D. (2019). Supplementary material describing arm26. Available at: https://elib.uni-stuttgart.de/bitstream/11682/10893/2/OptimalityPrinciples_Wochner_Datasheet1.pdf.
Till, O., Siebert, T., Rode, C., and Blickhan, R. (2008). Characterization of isovelocity extension of activated muscle: A hill-type model for eccentric contractions and a method for parameter determination. J. Theor. Biol. 225, 176–187. doi:10.1016/j.jtbi.2008.08.009
Tomalka, A., Rode, C., Schumacher, J., and Siebert, T. (2017). The active force–length relationship is invisible during extensive eccentric contractions in skinned skeletal muscle fibres. Proc. R. Soc. B Biol. Sci. 284, 20162497. doi:10.1098/rspb.2016.2497
Tomalka, A., Weidner, S., Hahn, D., Seiberl, W., and Siebert, T. (2020). Cross-bridges and sarcomeric non-cross-bridge structures contribute to increased work in stretch-shortening cycles. Front. Physiology 11, 921–1014. doi:10.3389/fphys.2020.00921
Tomalka, A., Weidner, S., Hahn, D., Seiberl, W., and Siebert, T. (2021). Power amplification increases with contraction velocity during stretch-shortening cycles of skinned muscle fibers. Front. physiology 12, 644981–645016. doi:10.3389/fphys.2021.644981
Van Der Krogt, M. M., De Graaf, W. W., Farley, C. T., Moritz, C. T., Richard Casius, L. J., and Bobbert, M. F. (2009). Robust passive dynamics of the musculoskeletal system compensate for unexpected surface changes during human hopping. J. Appl. physiology 107, 801–808. doi:10.1152/japplphysiol.91189.2008
van Soest, A. J., and Bobbert, M. F. (1993). The contribution of muscle properties in the control of explosive movements. Biol. Cybern. 69, 195–204. doi:10.1007/BF00198959
Wahr, P. A., and Rall, J. A. (1997). Role of calcium and cross bridges in determining rate of force development in frog muscle fibers. Am. J. Physiology-Cell Physiology 272, C1664–C1671. doi:10.1152/ajpcell.1997.272.5.c1664
Weidner, S., Tomalka, A., Rode, C., and Siebert, T. (2022). How velocity impacts eccentric force generation of fully activated skinned skeletal muscle fibers in long stretches. J. Appl. Physiology 133, 223–233. doi:10.1152/japplphysiol.00735.2021
Keywords: muscle dynamics, mechanical work, intrinsic properties, stiffness, damping
Citation: Araz M, Weidner S, Izzi F, Badri-Spröwitz A, Siebert T and Haeufle DFB (2023) Muscle preflex response to perturbations in locomotion: In vitro experiments and simulations with realistic boundary conditions. Front. Bioeng. Biotechnol. 11:1150170. doi: 10.3389/fbioe.2023.1150170
Received: 23 January 2023; Accepted: 21 March 2023;
Published: 27 April 2023.
Edited by:
Kamran Iqbal, University of Arkansas at Little Rock, United StatesReviewed by:
Reinhard Blickhan, Friedrich Schiller University Jena, GermanyHuub Maas, VU Amsterdam, Netherlands
Copyright © 2023 Araz, Weidner, Izzi, Badri-Spröwitz, Siebert and Haeufle. This is an open-access article distributed under the terms of the Creative Commons Attribution License (CC BY). The use, distribution or reproduction in other forums is permitted, provided the original author(s) and the copyright owner(s) are credited and that the original publication in this journal is cited, in accordance with accepted academic practice. No use, distribution or reproduction is permitted which does not comply with these terms.
*Correspondence: Matthew Araz, matthew.araz@uni-tuebingen.de
†Present address: Daniel F. B. Haeufle, Institute of Computer Engineering (ZITI), Heidelberg University, Heidelberg, Germany