Novel assay to measure chromosome instability identifies Punica granatum extract that elevates CIN and has a potential for tumor- suppressing therapies
 Nikolay V. Goncharov1,2*
  Valeria A. Kovalskaia3
  Alexander O. Romanishin4
  Nikita A. Shved1,2 Andrei S. Belousov2 Vladlena S. Tiasto2
  Valeriia S. Gulaia2
  Vidushi S. Neergheen5 Nawraj Rummun5 Mikhail Liskovykh6 Vladimir Larionov6
  Natalay Kouprina6
  Vadim V. Kumeiko1,2*
- 1A.V. Zhirmunsky National Scientific Center of Marine Biology, Russian Academy of Sciences, Vladivostok, Russia
- 2Institute of Life Sciences and Biomedicine, Far Eastern Federal University, Vladivostok, Russia
- 3Research Centre for Medical Genetics, Moscow, Russia
- 4School of Life Sciences, Immanuel Kant Baltic Federal University, Kaliningrad, Russia
- 5Biopharmaceutical Unit, Centre for Biomedical and Biomaterials Research (CBBR), University of Mauritius, Réduit, Mauritius
- 6Developmental Therapeutics Branch, National Cancer Institute, NIH, Bethesda, MD, United States
Human artificial chromosomes (HACs) have provided a useful tool to study kinetochore structure and function, gene delivery, and gene expression. The HAC propagates and segregates properly in the cells. Recently, we have developed an experimental high-throughput imaging (HTI) HAC-based assay that allows the identification of genes whose depletion leads to chromosome instability (CIN). The HAC carries a GFP transgene that facilitates quantitative measurement of CIN. The loss of HAC/GFP may be measured by flow cytometry or fluorescence scanning microscope. Therefore, CIN rate can be measured by counting the proportion of fluorescent cells. Here, the HAC/GFP-based assay has been adapted to screen anticancer compounds for possible induction or elevation of CIN. We analyzed 24 cytotoxic plant extracts. Punica granatum leaf extract (PLE) indeed sharply increases CIN rate in HT1080 fibrosarcoma cells. PLE treatment leads to cell cycle arrest, reduction of mitotic index, and the increased numbers of micronuclei (MNi) and nucleoplasmic bridges (NPBs). PLE-mediated increased CIN correlates with the induction of double-stranded breaks (DSBs). We infer that the PLE extract contains a component(s) that elevate CIN, making it a candidate for further study as a potential cancer treatment. The data also provide a proof of principle for the utility of the HAC/GFP-based system in screening for natural products and other compounds that elevate CIN in cancer cells.
Introduction
One of the most significant targets for emerging anticancer therapies is the transmission of chromosomes during cell division that involves a diverse number of regulatory elements, including components of the kinetochore complex and mitotic spindle associated proteins (Pérez de Castro and Malumbres, 2012). The disruption of these elements leads to chromosome instability (CIN), following the formation of aneuploid cells. As known, aneuploidy is a feature of most cancer cells and is often accompanied by an elevated rate of chromosome mis-segregation (Thompson et al., 2010). Gain or loss of entire chromosomes leads to large-scale changes in gene copy number and gene expression level (Kaufmann et al., 2014). Recent research data indicated that a high CIN rate in cancer cells prevents them from propagation and, thus, may be exploited therapeutically (Janssen et al., 2009; Silk et al., 2013).
In our previous publications, we developed quantitative assays for measuring CIN (Lee et al., 2013; Kim et al., 2016; Lee et al., 2016; Liskovykh et al., 2019). The assays are based on the use of a non-essential human artificial chromosome (HAC) carrying a constitutively expressed GFP transgene (HAC/GFP). This HAC propagates and segregates properly in fibrosarcoma cancer HT1080 cells. However, mitotic stability of HAC/GFP is approximately 10-fold lower than that of natural chromosomes (∼1 × 10⁻³) (Nakano et al., 2008; Iida et al., 2010), which makes the HAC a sensitive model for studying a CIN phenotype in cancer cells.
Two assays were used to rank different anticancer drugs with respect to their effects on chromosome transmission fidelity (Lee et al., 2013; Kim et al., 2016; Lee et al., 2016). Another HAC-based assay was applied for screening a siRNA library to identify unknown genes involved in CIN (Liskovykh et al., 2019). In all assays, the CIN rate is measured by flow cytometry, fluorescence microscopy, or a microplate reader. In general, these assays are based on the detection of loss of a HAC that carries a fluorescent reporter. The HACs contain a functional kinetochore and therefore are mitotically stable. However, the drugs that dysregulate proper segregation of native human chromosomes induce HAC mis-segregation which leads to the loss of a fluorescence signal. Therefore, the CIN rate can be measured by counting the proportion of fluorescent cells. Two HAC-based approaches utilize a GFP protein with a native half-life (Lee et al., 2013; Lee et al., 2016). The third HAC-based approach (Liskovykh et al., 2019) exploits expression of a modified short half-life GFP transgene (dGFP) that allows detection of CIN 72–120 h after its induction. In contrast, a standard GFP transgene significantly prolongs the experimental time up to 10–14 days and results in an accumulation of possible false-positive effects (Lee et al., 2013). The HAC/dGFP system was applied for the identification of human gene mutations in which lead to chromosome instability (Liskovykh et al., 2019) but was not applied for screening the drugs, treatment by which leads to the CIN phenotype in cancer cells.
The discovery of cancer drugs that are based on the screening of natural products continues to be an attractive approach in anticancer strategies (Neergheen-Bhujun et al., 2017). Natural biodiversity has been proven to be the prime source of bioactive molecules with a unique therapeutic spectrum, thus being the pillar of global healthcare (Kingston, 2011; Fridlender et al., 2015). Acquisition of samples from biodiversity-rich tropical forests, with emphasis on untapped endemic plants, was prioritized during the second phase of the National Cancer Institute (United States) drug screening program (Kinghorn, 1994).
In this study, we adapted the HAC/dGFP system to screen plant extracts with reported cytotoxic and cancer cell antiproliferative activities (Kiraz et al., 2016; Rummun et al., 2019; Rummun et al., 2020; Rummun et al., 2021a; Rummun et al., 2021b) for their ability to induce CIN in cancer cells. The HAC/dGFP-based assay identified Punica granatum leaf extract (PLE) which increases a CIN rate in HT1080 fibrosarcoma cells. We found that treatment of cancer cells with PLE leads to cell cycle arrest and formation of micronuclei (MNi) and nucleoplasmic bridges (NPBs). In addition, we observed that CIN mediated by PLE correlates with the induction of double-stranded breaks (DSBs). Thus, we demonstrate a potential of the HAC/dGFP-based assay for discovery of new anticancer drugs.
Materials and methods
Extracts
For the primary screening, we used a collection of extracts listed in Table 1. All the natural products were collected from Mauritius Island, exhaustively extracted, and dried as described in (Rummun et al., 2013; Rummun et al., 2019). The lyophilized powders of the extracts were dissolved in 100% DMSO to concentration 100 mg/ml. For screening, the LC50 concentrations were used (Table 1). The LC50 for PLE—a leader extract-was 190 μg/ml and was identified with the MTT assay. Extracts isolated from the wide range of plants were pre-selected, based on their explored anticancer properties (Rummun et al., 2013; Rummun et al., 2019).
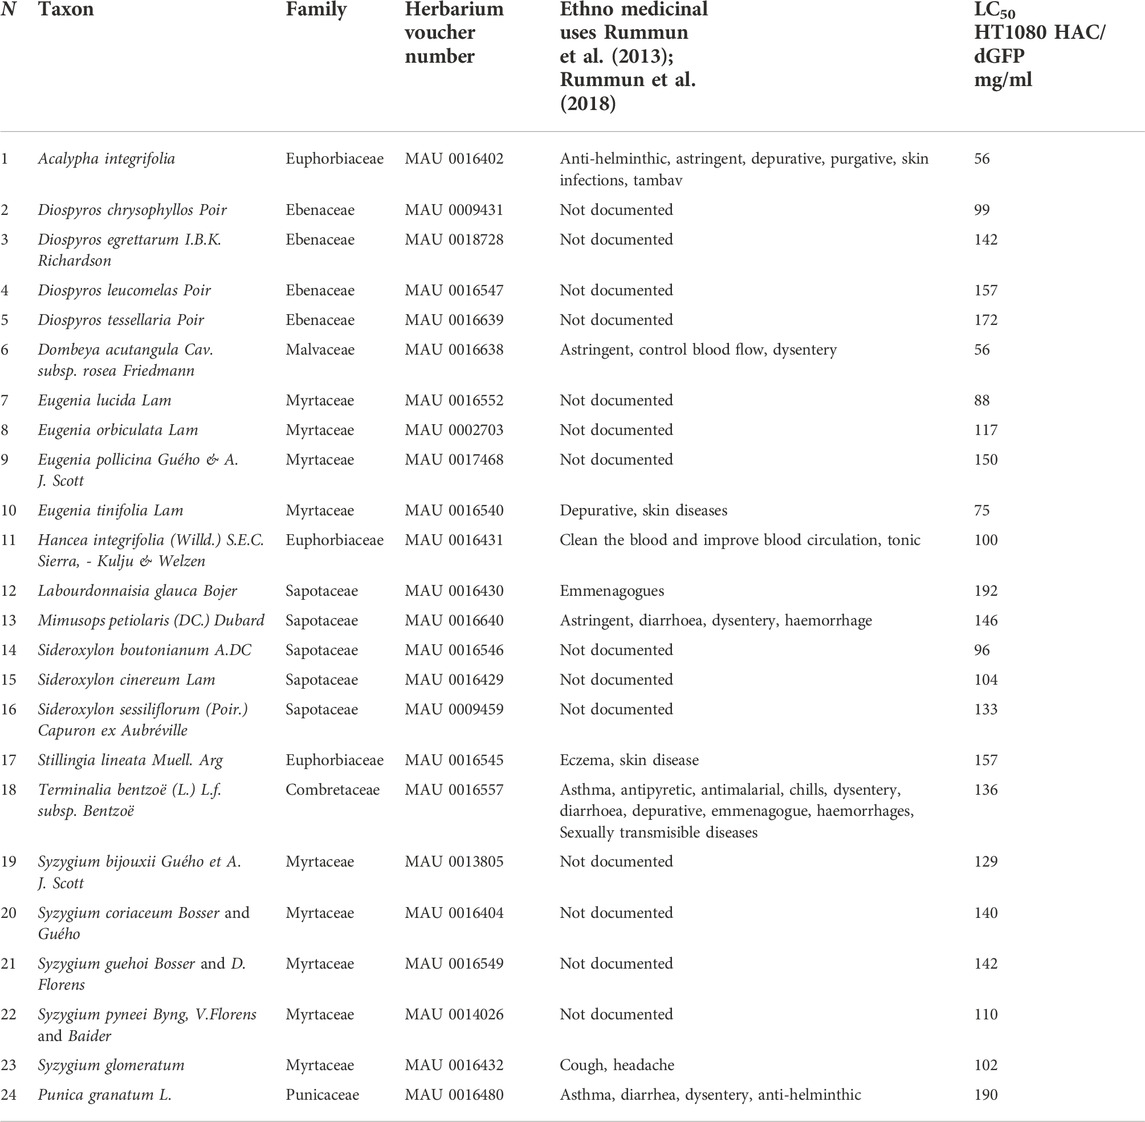
TABLE 1. Natural products and their extracts used in this study.
Cell lines and culture conditions
The following cell lines were used for all the experiments described below: the pigmented epithelium immortalized cells RPE-1 (hTERT RPE1-1) and the human fibrosarcoma cell line HT1080 (ATCC® CCL-121™). The HT1080 and RPE-1 cell lines were obtained from the American Type Culture Collection and were authenticated both morphologically and by short tandem repeat analysis. The cell lines were tested regularly to confirm the lack of mycoplasma infection with the mycoplasma detection kit PlasmoTest (InvivoGen, United States). The HT1080 and RPE-1 cells were basically maintained in Dulbecco’s Modified Eagle’s Medium (DMEM) (Gibco, United States) supplemented with 10% (v/v) fetal bovine serum (Clontech Laboratories, Inc.) at 37°C in 5% CO2 atmosphere. In order to achieve the selection for the GFP-positive cells, HT1080 cells carrying the HAC/dGFP were maintained in the presence of 10 μg/ml of Blasticidin S (Funakoshi Inc., Japan).
Hamilton microlab star liquid handling workstation
Cell seeding, adding all liquid substances such as culture medium, extract samples, staining and fixation solutions, aliquoting and distribution were performed on the Hamilton Microlab Star Liquid Handling Workstation (United States). For Hamilton Microlab Star Liquid Handling Workstation experiments, 10 mM HEPES (Sigma Aldrich, United States) was additionally added to culture media to maintain proper pH out of CO2 enriched atmosphere. The pipetting array consisted of 4 pipetting heads and used 1,000 and 50 μl compressed O-ring expansion (CO-RE) tips. All liquids were aspirated at a fixed height from the container bottom (0.5 mm) and dispensed using the jet empty setting. The aspiration and dispensation rate in a cell culture containing wells was set to 10 μl/s. Cells and samples were mixed (consisting of aspiration and dispense of 1,000 μl of liquid into the same container) 3 times prior to being transferred to the incubation plate to ensure even cell distribution and sample uniformity. Cell culture incubation was performed using the Hamilton Heater Shaker module. To reduce microbial contamination, prior to executing the protocol, a fully loaded workstation was decontaminated using an external UV light source. All the reagents were contained in 60- and 120-ml Hamilton Reagent Reservoirs covered with tinfoil (later pierced by a pipetting head).
LC50 determination using MTT assay
HT1080 cells were seeded in a 96-well plate (Eppendorf, Germany) at density of 1 × 10³ cells per well and were kept at 37°C under 5% CO2. 24 h later, the cells were treated with extracts at concentrations of 50, 100, 150, 200, and 250 μg/ml. 24 h later, the medium was discarded and replaced by 100 μl of DMEM, 10% FBS containing 5 mg/ml of MTT (3-(4, 5-Dimethylthiazol-2-yl)-2, 5-diphenyltetrazolium bromide) (Sigma, Germany). After 4 h of incubation, 100 μl of lysis buffer (4 mM HCL, 1% Np40 in isopropanol) was added and the cells were kept for 20 min on shaker. Using micro-plate reader iMark (Bio-Rad, United States), absorbance of each well was measured in 595 and 655 nm. The experiment was done in 6 replicates for each sample. GraphPad Prism software (San-Diego, United States) was used for statistical analysis. The obtained data were normalized for the percentages (a negative control data was considered as 100%) in order to calculate LC50. Linear-regression analysis was performed where R2 greater than 0.65 was considered relevant.
Calculation of human artificial chromosomes loss after extract treatment
The HAC stably propagates in human HT1080 cells, i.e., almost every cell contains one copy of the HAC. The HAC is less stable than the host chromosomes (Nakano et al., 2008). Therefore, the loss of HAC/GFP can be measured by flow cytometry or fluorescence scanning microscope. The HAC-loss is measured without selection when the cells start losing the HAC spontaneously. To measure HAC loss, we showed the ratio of GFP-negative cells after treatment with extracts. Induction of the chromosome instability due to exposure to the natural extracts was examined in human cancer HT1080 cells carrying the HAC/dGFP. For the experiment, cells were seeded and cultured with 10 μg/ml of Blasticidin S. After a day, the seeding medium was removed, then replaced by a new portion of the culture medium containing LC50 concentrations of the natural extracts (Supplementary Figure S1) and free of Blasticidin S and left for 24 h incubation. After 24 h, the extract-containing medium was replaced with a fresh medium without the extract and free of Blasticidin S. The cells were subsequently grown without blasticidin selection for 72 h, then HT1080 cells were analyzed for HAC loss by detecting the ratio of GFP-negative cells measured independently using Synergy™ HTX Multi-Mode Microplate Reader (BioTek, United States) and BD Accuri C6 (BD Biosciences, United States). As a positive control, we used the anti-mitotic, spindle-targeting compound Taxol at concentration 6 nM (Supplementary Figure S1). At this concentration Taxol induces micronuclei (MNi) formation and chromosome loss. As a negative control, the cells were treated with 0.2% DMSO. For each extract, the experiment was carried out in 3 replicates. The rate of HAC loss after cell treatment by the extract can be also calculated using a formular described in Supplementary Material.
Visualization of human artificial chromosomes loss with microplate reader and flowcytometry
For each extract, the rate of HAC/GFP loss was accurately measured independently using Synergy™ HTX Multi-Mode Microplate Reader (BioTek, United States) and BD Accuri C6 (BD Biosciences, United States) for a double check. For Synergy™ HTX Multi-Mode Microplate Reader (BioTek,United States), 1 × 10⁵ cells were seeded on a 96-well plate and depicted 24 h after extract treatment under 4х magnification in 5 × 5 fields of view. The number of GFP-positive and GFP-negative cells were counted in each field with threshold 7,000. The cell size was restricted from 5 μm up to 100 μm. For flowcytometry experiment using BD Accuri C6 (BD Biosciences, United States), 4 × 10⁵ cells per well were seeded on a 24-well plate with 500 μl of the culture medium and 10 μg/ml of Blasticidin S. Then cells were harvested by trypsin-treatment and resuspended in PBS containing 3 µM of DRUQ7. All the samples were vortexed immediately prior to flow cytometry examination using BD Accuri C6 (BD Biosciences, United States), the Fluorescence of GFP-positive cells was measured by the 488 nm laser and detected at 510 nm. The death cells were counted by DRUQ7 fluorescence excited by the 640 nm laser and detected at 722 nm. Samples were acquired in at least three separate triplicates for 30 s or 1.5 × 10⁴ events (at minimum).
Statistical analysis
The statistical significance of comparisons was determined by GraphPad Prism 6. An unpaired Student T-test and One-way Annova with multiple comparisons were used. p < 0.05 was considered significant. The data are presented in diagrams as mean, error bars correspond to 95% confidence interval.
Measurement of cell proliferation using a high content imaging system (cell IQ®)
After treatment with PLE, its effect on cell proliferation was measured. HT1080 and RPE1-1 cells were seeded in Greiner Bio-One TC-plate 24-well plates, 5,000 cells per well. The next day after attachment and cell spreading, PLE was added to the culture medium at LC50 concentrations. 0.2% DMSO was used as a negative control and 6 nM of Taxol as a positive control. At 24 h after PLE treatment, the medium was replaced with a fresh complete DMEM. During 114 h, attached cells were observed using the automated cell culture and analysis system Cell-IQ® (CM Technologies) with Nikon CFI Plan Fluorescence DL ×4 objective. Nine visual fields were analyzed in each well. The interval between observations of each visual field was 3 h. Cell counting and cell growth curves were obtained using Cell-IQ Analyzer ™ software.
Flow cytometric analysis of cell cycle using Hoechst 33342 DNA staining
HT1080 and RPE-1 cells were cultured in a 24 well-plate (Eppendorf, Germany). Cells were treated with PLE at LC50 concentration for 24 h. 0.2% of DMSO was used as a negative control (untreated cells). The flow cytometric analysis was performed 24 and 72 h after PLE treatment. To perform the flow cytometry, the cells were collected in microcentrifuge tube and fixed with 4% PFA in PBS for 10 min, then centrifuged for 10 min at 150 g and permeabilizated with 500 μl of 100% methanol on ice. Then 1 μg/ml of Hoechst 33342 solution in PBS was prepared.106 cells in 1 ml of Hoechst 33342 solution, wrapped with aluminum foil to avoid direct light, was resuspended and incubated at room temperature for 60 min. All the samples were vortexed immediately before flow cytometry examination. Fluorescence of Hoechst 33342 positive cells was measured by emission 355 nm laser with extension 448 nm. Samples were acquired in at least three separate triplicates for 30 s or 1.0 × 10⁴ events. Flow cytometry was performed using C-Flow BC (moFlo Astrios EQ) and analyzed in Kaluza, Flow Cytometry Analysis Software - Beckman Coulter. Cell cycle analysis was performed with MoFlo Estrios EQ cell sorter (Beckman Coulter, United States) and software Kaluza Analysis (v 3.1).
Mitotic index analysis with fluorescence microscopy
Mitotic index was determined for HT1080 and RPE-1 cells 24 and 72 h after PLE treatment. HT1080 and RPE-1 cells were cultured in DMEM supplemented with 10% FBS. The medium was aspirated, and the plate was washed with PBS once. Cells were fixed by 4% formaldehyde solution in PBS. 1 × 10⁵ HT1080 and RPE-1 cells per well were plated on ibidi-cell culture dishes (Ibidi, United States) and treated with PLE extract at LC50 concentration for 24 h. Cells were fixed with 3.7% formaldehyde in PBS for 10 min at room temperature, then permeabilized with 0.2% Triton X-100 in PBS for 10 min. Cells were blocked with 5% milk in TBS for 2 h at room temperature and treated with cytoskeletal β-Tubulin rabbit monoclonal antibody (Abcam, United States) in 1:1,000 dilution with 5% milk/TBS at 4°C overnight. Goat Anti-Rabbit Alexa Fluor® 568 conjugated secondary antibodies were used in 1:500 dilution with 5% milk/TBS at room temperature for 2 h. Then cells were stained with DAPI (diluted 1:15,000 in PBS) for 10 min at room temperature. Quantification was performed using the FV1200 confocal laser scanning microscopy system equipped with the objective lens (UPLSAPO ×100) (Olympus, Japan). A 405 nm LD Laser with Integrated Transmitted Light Photomultiplier Detector and 488 nm Argon Laser with High-Sensitivity Detector (GaAsP) were used. To avoid cross detection, the images were acquired sequentially at 488 nm (Argon) and 405 nm (LD). All taken Z-sections were condensed into one single plane in order to visualize all detectable microtubules and chromosomes.
Staining and quantification of γ-H2AX foci
1 × 10⁵ HT1080 and RPE-1 cells per well were plated on ibidi-cell culture dishes (Ibidi, United States) and treated with PLE extract at LC50 concentration for 24 h. As a positive control, Etoposide was used at concentration 1 μM. Cells were fixed with 3.7% formaldehyde in PBS for 10 min at room temperature, then permeabilized with 0.2% Triton X-100 in PBS for 10 min. Cells were blocked with 5% milk in TBS for 2 h at room temperature and treated with rabbit monoclonal anti-phospho γ-H2AX (Ser139) antibody (Abcam, United States) in 1:500 dilution with 5% milk/TBS at 4°C overnight. Goat Anti-Rabbit Alexa Fluor® 568 conjugated secondary antibodies were used in 1:500 dilution with 5% milk/TBS at room temperature for 2 h. Cells were stained with DAPI (diluted 1:15,000 in PBS) for 10 min at room temperature. Quantification of the γ-H2AX foci in nuclear was performed using the FV1200 confocal laser scanning microscopy system equipped with the objective lens (UPLSAPO ×100) (Olympus, Japan). A 405 nm LD Laser with Integrated Transmitted Light Photomultiplier Detector and 488 nm Argon Laser with High-Sensitivity Detector (GaAsP) were used. To avoid cross detection, the images were acquired sequentially at 488 nm (Argon) and 405 nm (LD). All taken Z-sections were condensed into one single plane in order to visualize all detectable foci.
Cytokinesis-block micronucleus assay and nucleoplasmic bridges formation
Cytokinesis-block micronucleus formation assay was performed as described earlier (Fenech 2007) with minor changes: 1 × 10⁵ HT1080 or RPE-1 cells per well were plated on ibidi-cell culture dishes (ibidi, United States) and treated with PLE extract at LC50 concentration for 24 h. Cells were fixed with 3.7% formaldehyde in PBS for 10 min at room temperature. Scoring Procedure Cells were stained using 15 μl of a DNA-specific stain, namely 40,6-diamino-2-phenylindole dihydrochloride (DAPI). About 2,000 cells were scored using the FV1200 confocal laser scanning microscopy system equipped with the objective lens (UPLSAPO ×100) (Olympus, Japan) and 405 nm LD Laser with Integrated Transmitted Light Photomultiplier Detector. The criteria for evaluation of micronucleus formation assay were: 1) cell integrity (intact nucleus and cytoplasm); 2) similar staining of nucleus and MNi; 3) nucleus and MNi are in the same plate. The frequency of cells with micronuclei (MNi) and nucleoplasmic bridges (NPBs) was determined for each analyzed subject.
Analysis of apoptosis
5 × 10⁵ HT1080 and RPE-1 cells were seeded in 24 well-plates. Next, the PLE extract at LC50 concentration was added to both cells. 24 and 72 h after PLE treatment, cells were trypsinized and diluted in DMEM. Then Flowcytometry analysis was performed using MoFlo Astrios EQ cell sorter (Beckman Coulter, United States). Comparison of early apoptotic and necrotic cells 24 and 72 h after PLE treatment was performed with propidium iodide and annexin V-FITC. Analysis of the flowcytometry data was performed using Kaluza Software v2.1 (Beckman Coulter, United States). All the samples had three technical replicates; statistical analysis was done using One-way ANOVA (Dunnet correction) via Prizm 8.0.0 (GraphPad Software, United States).
Results
Experimental system for screening anticancer drugs that elevate chromosome instability
In this study, we adapted the HAC/dGFP system (Liskovykh et al., 2019) for drug screening using Synergy™ HTX Multi-Mode Microplate Reader that is used for fluorescence detection. The HAC/dGFP system is based on the use of the alphoidtetO-HAC (Nakano et al., 2008) containing the dGFP transgene, where CIN detection can be identified by loss of fluorescence (Figure 1). The alphoidtetO-HAC propagated in the HT1080 human fibrosarcoma cells are sensitive to the drug treatment and other factors affecting chromosome transmission. The HAC/dGFP carries a new class of the GFP-fusion, i.e., a “destabilized GFP” (dGFP). The first approach that utilized a destabilized GFP was described by Sakaue-Sawano et al. (2008) and Sakaue-Sawano et al. (2013). This method is based on the expression of short FUCCI (fluorescent ubiquitination-based cell-cycle indicator) peptides CDT1 and GMNN in one reading frame with fluorescent protein coding sequences. Expression of these fusions may be visualized at the different stages of cell cycle. The HAC/dGFP expresses two fusions of GFP: GFP-fused with a 30–120 amino acid domain of CDT1, and GFP-fused with a 1–110 amino acid domain of DNA replication inhibitor (GMNN). FUCCI domains lead to proteasomal degradation of GFP proteins associated with their C-terminal sequences, and the time of active functioning of each is strictly related to the duration of different phases of cell cycle. CDT1 is expressed during the G1 period, while GEMININ is expressed during the S, G2, and M periods. Therefore, the GFP-CDT1 fusion will cause the HAC-containing cells to be green in G1 phase of the cell cycle. The GFP-GMNN fusion causes the HAC-containing cells to be green in S-G2-M phases of the cell cycle. Thus, the cells carrying the HAC/dGFP show a robust fluorescent signal throughout the cell cycle and lose the GFP signal within hours after HAC loss (Liskovykh et al., 2019).
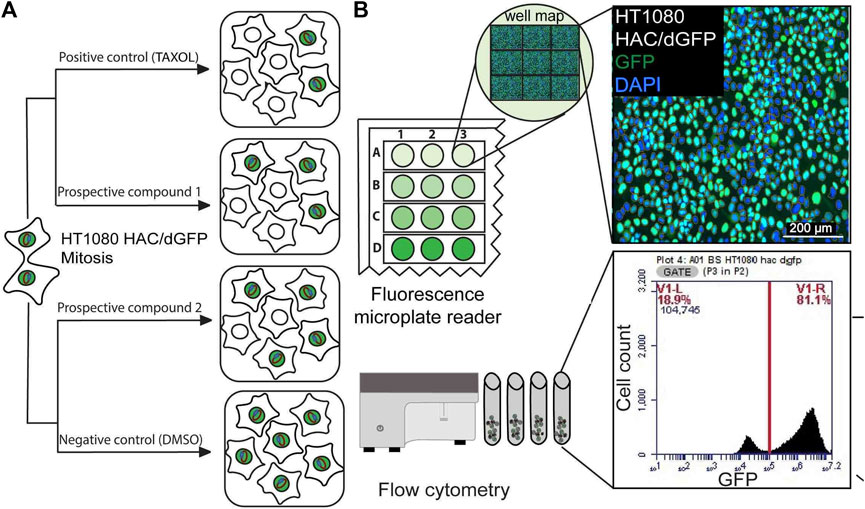
FIGURE 1. (A) A scheme of the HAC/dGFP assay. The assay is based on the use of the HAC/dGFP (the alphoidtetO-HAC containing the dGFP transgene). Cells with the HAC display green fluorescence, while cells that lack it do not. It is expected that untreated cells (“a negative control”) should show uniform green fluorescence. (B) A cell population, that has lost HAC upon treatment with the CIN-inducing drug (“a prospective compound”), loses GFP fluorescence. For the positive control, we used Taxol, a CIN-inducing microtubule destabilizing agent. The actual number and percentage of cells with the HAC/dGFP are measured by a fluorescence microplate reader and flow cytometry.
The rate of HAC loss driven by drug treatment can be measured by loss of a fluorescent signal. Cells with the HAC/dGFP display green fluorescence, while cells that lack it do not. It is expected that untreated cells (“a negative control”) should show uniform green fluorescence. A cell population that has lost HAC upon treatment with the CIN-inducing drugs (“prospective compounds”) should be highly variable in fluorescence (Figure 1A).
Our previously published screening of a siRNA library of protein kinases using HT1080 cells carrying the HAC/dGFP was performed using Laser Scanning Microscope. In this work, we detected a ratio of GFP-negative cells using a fluorescent microplate reader and flow cytometry (Figure 1B). Moreover, all the procedures from cell seeding to drug treatment and fixation were performed on 96-well plates automatically on the Microlab Star liquid handling workstation (Hamilton, United States), which ensured consistency across replicates. As a positive control, we used Taxol, a CIN-inducing microtubule destabilizing agent. As shown earlier, Taxol exhibits the highest destabilizing effect on the HAC and natural chromosomes (Lee et al., 2016). We demonstrated the capability of the HAC/dGFP system to identify substances that induce CIN over 72 h.
Screening of natural products and their extracts revealed that the P. granatum leaves extract has a significant effect on the human artificial chromosomes mis-segregation rate during mitotic divisions
For primary screening, we chose the collection of natural extracts from tropical forest plants that have been used in traditional medicine. Their cytotoxic activity was demonstrated in many cancer cell lines (Kiraz et al., 2016; Rummun et al., 2019; Rummun et al., 2020; Rummun et al., 2021a; Rummun et al., 2021b). For each extract used in this study, we determined the LC50 concentration, i.e., the conditions under which the viability of cells would be around 50%, using the MTT assay adapted for human cancer HT1080 cells carrying the HAC/dGFP (Supplementary Figure S1). All LC50 concentrations are listed in Table 1. Those concentrations were used for induction of CIN (a HAC-loss; see MATERIALS and METHODS). None of the compounds, except the P. granatum leaves extract (PLE), showed a significant effect on HAC/dGFP stability by either fluorescence microplate reader (Figures 2A,C) or flow cytometry assays (Figures 2B,D). Based on the data obtained by flow cytometry, the average ratio of GFP-negative cells after PLE treatment is 9.916 (SD ± 0.6402; 1.83-fold elevation compared to the negative control (untreated cells) and 1.4-fold decrease compared to the positive control (Taxol-treated cells). Based on the data obtained by microplate reader, the average ratio of GFP negative cells after PLE treatment is 26.28 (SD ± 1.237; 2.53-fold elevation compared to the negative control and 1.15-fold decrease compared to the positive control. To exclude the possibility of a false-positive result, we measured the accumulation of GFP-negative cells 3 days after PLE treatment. The effect of HAC/dGFP instability intensified upon two divisions 24 h after PLE treatment and reached a maximum on day 4 (Supplementary Figure S2).
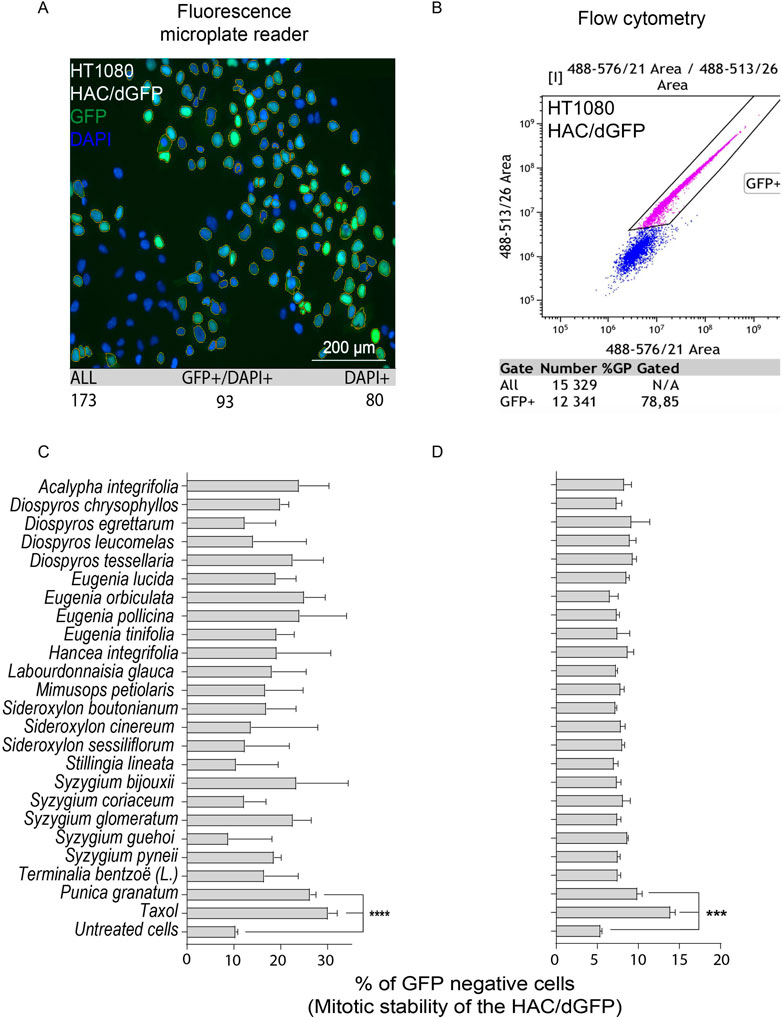
FIGURE 2. Mitotic stability of the HAC/dGFP in human cancer HT1080 cells treated with the natural extracts. Mitotic stability was measured by a fluorescent microplate reader (A,C) and flow cytometry (B,D). Among 24 extracts analyzed, the strongest effect on the HAC/dGFP stability was demonstrated by the cells treated with the Punica granatum leaves extract (PLE). Asterisks indicate statistical significance above negative control (T-test, p < 0.01).
Thus, the HAC/dGFP-based assay allowed us to rank 24 natural products and their extracts with respect to their effect on chromosome stability. The P. granatum leaves extract exhibited the highest effect on HAC/dGFP stability and, therefore, may be considered as a promising candidate for future drug development.
P. granatum leaf extract treatment leads to cell cycle arrest and reduction of mitotic index
An additional set of experiments was performed to observe other CIN-related phenotypes in PLE-treated cells that proves the ability of the HAC/dGFP-based approach to detect CIN mediated by drug treatment. To rule out the cancer cell line-specific phenotype of HT1080, the proliferation, cell cycle, and mitotic progression assays have been also performed with human retinal pigmented epithelial-1 (RPE-1) cells immortalized by the TERT1 transgene. RPE-1 cells are increasingly being used as a model to study mitosis because they represent non-transformed cells alternative to cancer cell lines, such as HT1080 or HeLa. First, we determined the LC50 concentration of PLE in RPE-1 cells (Supplementary Figure S1). According to the data from cell tracking microscopy (Cell IQ), PLE at LC50 concentration for HT1080 and RPE-1 cells inhibits cell proliferation (Figures 3A,B). We have observed that PLE treatment decreased the rate of proliferation in both RPE-1 and HT1080 cells relative to untreated cells. In RPE-1 cells, we found that proliferation rates decreased 1.22, 1.36, 1.25, 1.26, and 1.44-fold when measured 24, 48, 72, 96, and 144 h after treatment, respectively. Similarly, proliferation rates in HT1080 cells decreased 1.11, 1.51, 2.09, 2.18, and 1.98 -fold when measured 24, 48, 72, 96, and 114 h after PLE treatment.
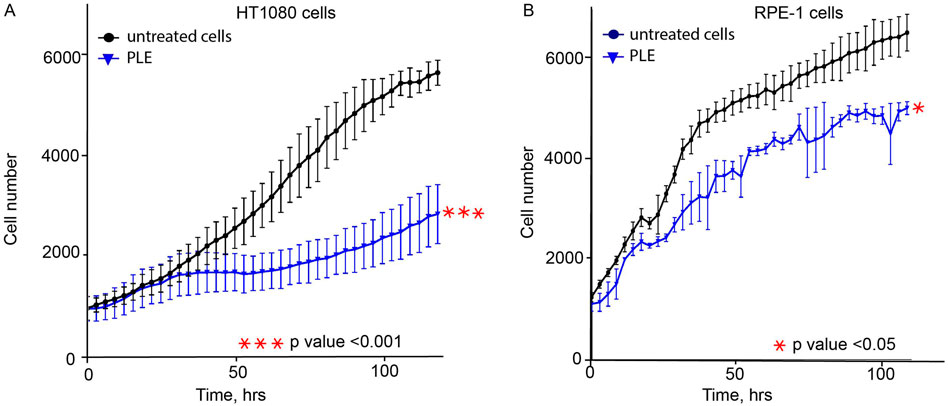
FIGURE 3. The proliferation rate of HT1080 (A) and RPE-1 (B) cells treated with PLE. Cells were treated for 24 h, then media was replaced, and cell proliferation was recorded by live imaging for 120 h. PLE—P. granatum leaves. Each cell line was compared to a negative control: HT1080 PLE-treated cells compared to HT1080 untreated cells; RPE-1 PLE-treated cells compared to RPE-1 untreated cells. The statistical analysis was performed using an unpaired Student's t-test. Asterisks indicate statistical significance (*p < 0.05, ***p < 0.001, relative to the negative control – untreated cells).
To determine possible causes of inhibition of cell proliferation, we performed a cell cycle analysis of HT1080 and RPE-1 cells 24 and 72 h after PLE treatment (Figure 4; Supplementary Table S1). Flow cytofluorometry data showed accumulation of HT1080 cells in G1 phase after 24 h. The average percentage of cells was 1.46-fold elevated compared to the negative control (Figure 4B). After 72 h, cells accumulated in G2/M, 2.72-fold elevation (Figure 4B). RPE-1 cells accumulated in G2/M phase after 24 h, 1.27-fold elevation, and after 72 h, 1.74-fold elevation (Figure 4D). Moreover RPE-1 cells accumulated in S the phase after 24 h, 1.59-fold elevation, and after 72 h, 1.73-fold elevation (Figure 4D). The fact that PLE treatment leads to stronger G1 delay in cancer HT1080 compared to RPE-1 cells may be explained by alterations in the genes involved in G1 checkpoint control that are the most frequent changes detected in cancer cells (Ahmed et al., 2022). Cell cycle delays at S and G2/M phase observed in RPE-1 cells may result from activation of the DNA damage checkpoint pathway (Gomez and Hergovich, 2016; Lezaja and Altmeyer, 2018).
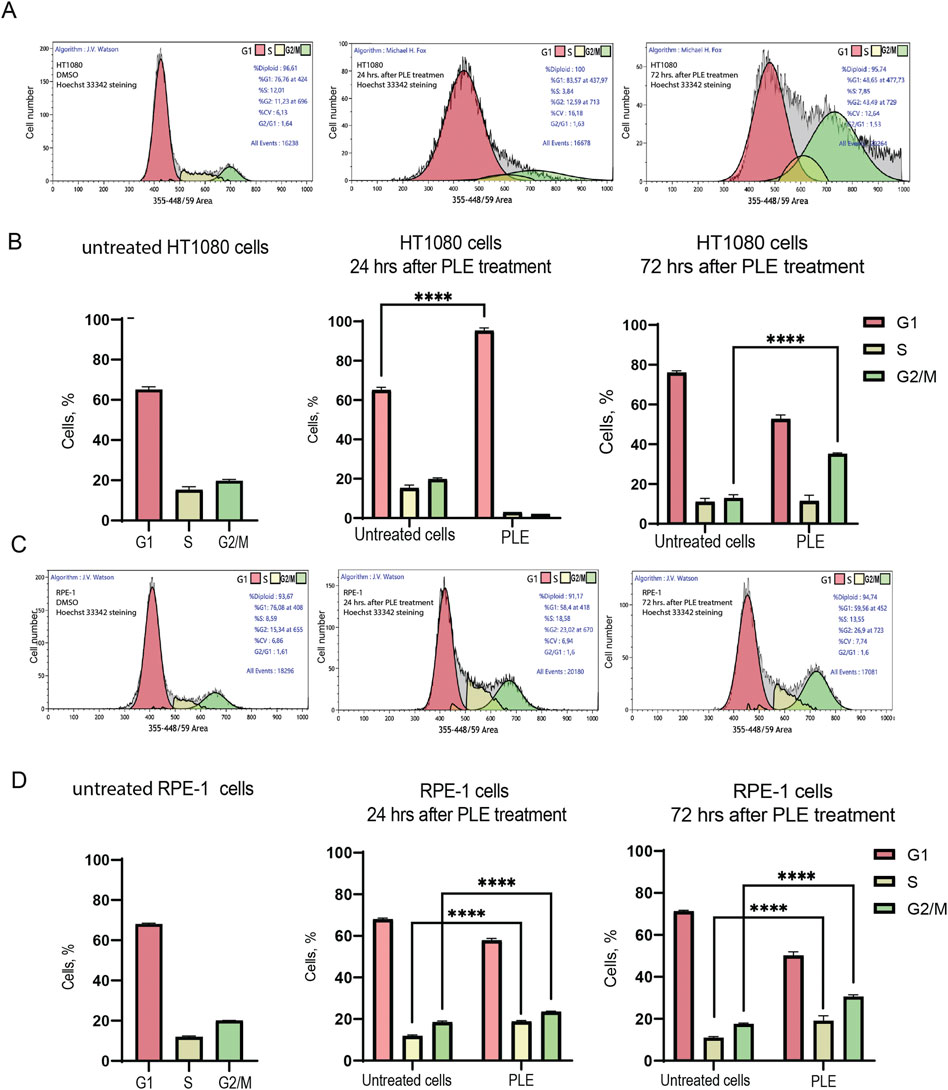
FIGURE 4. Analysis of the cell cycle after PLE treatment. (A) Flow cytometry analysis of HT1080 untreated cells 24 and 72 h after PLE treatment. (B) The percentage of cells in G1, S and G2/M phases in HT1080 cell population after 24 and 72 h. (C) Flow cytometry analysis of RPE-1 untreated cells after 24 and 72 h. (D) The percentage of cells in G1, S and G2/M phases in RPE-1 cell population after 24 and 72 h. The statistical analysis was performed using 2way ANNOVA, asterisks indicate statistical significance (****p < 0,0001, relative to the negative control—untreated cells).
The mitotic index (the ratio of the number of cells in a population undergoing mitosis to the total number of cells) analysis of RPE-1 and HT1080 cells after PLE treatment supports the cell cycle data. We observed a statistically significant decrease of the mitotic index in both RPE-1 and HT1080 cells 24 h after PLE treatment The average value of the mitotic index of HT1080 cells was 0.732,908 (SD ± 0.2587; 8.21-fold decrease) and RPE-1 cells was 0.399,191 (SD ± 0.1931; 10.91-fold decrease) (Figure 5A; Supplementary Table S2). After 72 h, the mitotic index was significantly decreased only in HT1080 cells (Figure 5B; Supplementary Table S2). The average value of the mitotic index was 3.14054 (SD ± 0.1615; 2.05-fold decrease). An apoptotic assay revealed a significant induction of early apoptosis in HT1080 cells 24 and 72 h after PLE treatment (Supplementary Figure S3). The apoptosis-dependent cell elimination perhaps caused a significant decrease in mitotic index.
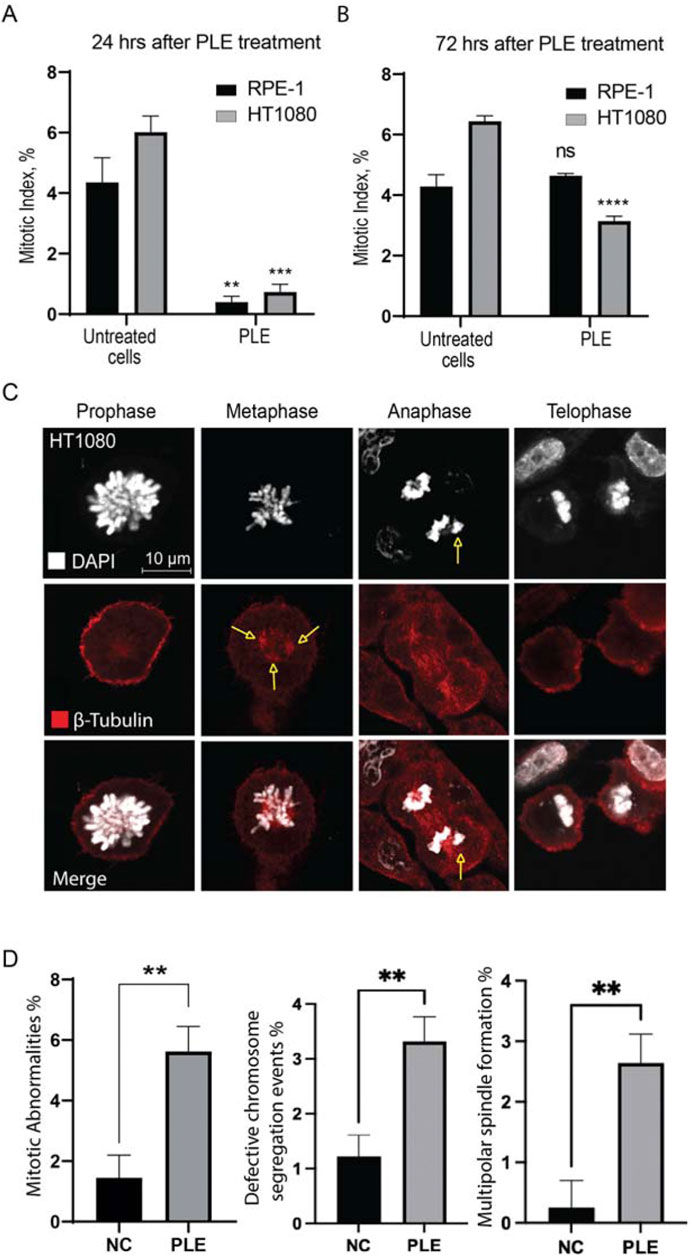
FIGURE 5. Mitotic index of HT1080 and RPE-1 cells treated with PLE. (A) The percentage of mitosis in HT1080 and RPE-1cells 24 h after PLE treatment. (B) The percentage of mitosis 72 h after PLE treatment. (C) Analysis of localization of tubulin beta at the different stages of mitosis after PLE treatment in HT1080 cells. Staining by antibodies against tubulin beta is marked in red and DAPI in white. Yellow arrows point to the observed mitotic abnormalities. (D) Proportion of observed mitotic abnormalities in HT1080 cells. Representative pictures of localization of tubulin beta at the different stages of mitosis in untreated HT1080 cells are shown in Supplementary Figure S4. Between 100 and 150 mitotic events were analyzed. Statistical analysis was performed using 2way ANNOVA, asterisks indicate statistical significance (**p < 0.01, ***p < 0.001, ****p < 0.0001 relative to the negative control—untreated cells).
Reduction of mitotic index and cell cycle arrest indicate to the presence of mitotic abnormalities. Therefore, next, we characterized in more detail the mitotic defects at the different stages of mitosis observed after PLE treatment in HT1080 cells. The cells were stained with antibodies against β-tubulin to visualize the mitotic spindles and DAPI to visualize chromatin. PLE treatment of HT1080 cells revealed a significant increase in mitotic abnormalities that included defects in chromosome alignment in anaphase and presence of multipolar spindles in metaphase (Figures 5C,D; Supplementary Table S5). To summarize, mitotic abnormalities observed after PLE treatment can lead to destabilization of chromosomes, aneuploidy, chromosome damage, and micronucleus formation.
P. granatum leaf extract treatment leads to micronucleus formation
An micronucleus formation assay (MNi) has been extensively used to evaluate chromosome instability (Kirsch-Volders et al., 1997). To investigate whether PLE treatment leads to instability of the natural chromosomes, we performed an MNi assay in HT1080 and RPE-1 cells. Concentration of the PLE used in this experiment is presented in Table 1. Our analysis revealed a statistically significant elevation of MNi formation in both cells treated with PLE versus untreated (DMSO-treated negative control cells) (Figure 6A, Supplementary Figure S5). Data in Figure 6B are expressed in terms of percentages of the cells with MNi observed over the total number of binucleated cells analyzed and in terms of fold induction comparing treated versus untreated samples (Supplementary Table S3). Elevated frequencies of binucleated cells with MNi were observed in both HT1080 and RPE-1 cells. The percentage of MNi formation upon PLE treatment in HT1080 cells was 13.3 (SD ± 3.3; 5.3-fold elevation) and in RPE-1 cells 8.8 (SD ± 0.58; 8.5-fold elevation) (Figure 6B).
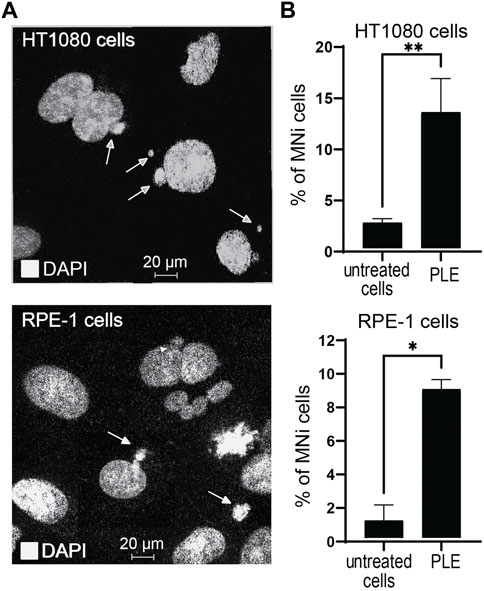
FIGURE 6. Micronuclei (MNi) formation 24 h after PLE treatment of HT1080 and RPE-1cells. (A) Examples of (MNi) formation in HT1080 and RPE-1 cells. White arrows point to the MNi. (B) The percentage of MNi after PLE treatment compared to untreated cells. Error bars correspond to a standard deviation (SD) of four replicates. Statistical analysis was performed using one-way ANNOVA, asterisks indicate statistical significance (*p < 0.05, **p < 0.01, relative to the negative control—untreated cells).
To summarize, MNi analysis confirmed that PLE has a significant effect on the accuracy of mitotic transmission of the natural chromosomes. The elevated frequencies of binucleated cells with MNi support our assumption that the PLE extract has the potential to be used as a CIN inducing drug.
P. granatum leaf extract treatment induces formation of nucleoplasmic bridges
Nucleoplasmic bridges are a sensitive measure of chromosome damage leading to chromosome instability. Therefore, we determined formation of NPBs after PLE treatment. Concentration of the PLE extract used in this experiment is presented in Table 1. Our analysis revealed a statistically significant elevation of NPBs formation in HT1080 and RPE-1 cells treated with PLE versus untreated cells (Figure 7; Supplementary Figure S5). Data in Figure 7B are expressed in terms of percentages of the cells with NPBs observed over the total number of binucleated cells analyzed and in terms of fold induction comparing treated versus untreated samples. The percentage of NPBs formation in HT1080 cells was 27% (SD ± 5.7; 2.8-fold elevation). The percentage of NPBs formation in RPE-1 cells was 14% (SD ± 3.7; 1.75-fold elevation) (Supplementary Table S4).
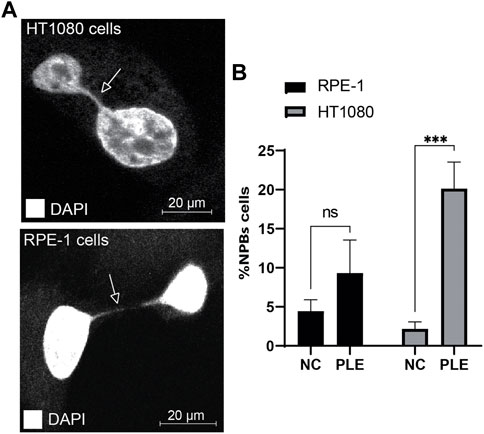
FIGURE 7. Accumulation of NPBs in HT1080 and RPE-1 cells treated with PLE. (A) Representative pictures of NPBs in HT1080 and RPE-1 cells after PLE treatment. (B) The percentage of NPBs in HT1080 and RPE-1 cells. Error bars correspond to a standard deviation (SD) of four replicates. Statistical analysis was performed using 2way ANNOVA, asterisks indicate statistical significance (*p < 0.005, ***p < 0.0005, relative to the negative control—untreated cells).
Thus, the elevated frequencies of binucleated cells with MNi and NPBs (measures of genome damage and chromosomal instability) observed after PLE treatment strongly support the utility of the HAC/dGFP-based assay for screening new drugs.
P. granatum leaf extract treatment leads to an increased number of double-stranded breaks
The cell cycle delay in G2 phase as well as reduction of mitosis, MNi and NPBs formation indicate possible DNA damage in the PLE-treated cells. Therefore, to investigate further the mechanism(s) by which treatment with PLE leads to chromosome instability, we stained HT1080 and RPE-1cells with an antibody against phosphorylated histone γH2AX, a common marker for DNA damage response (Mah et al., 2010), to detect formation of DNA double-stranded breaks (DSBs). The number of DSBs were expressed in terms of the number of γH2AX foci per nucleus and in terms of fold induction comparing treated versus untreated samples. Concentration of PLE used in this experiment is presented in Table 1. A statistically significant increase of γH2AX foci in interphase of the PLE-treated cells was observed in both HT1080 and RPE-1 cells (Figure 8; Supplementary Figure S5). The number of foci per cell in RPE-1 cells was 28 (SD ± 3.1; 4.3-fold elevation). In HT1080 cells, the number of foci was even higher and was equal to 72 (SD ± 2.6; 6.25-fold elevation) (Supplementary Table S6). Thus, in RPE-1 as well as in HT080 cells, chromosome instability after PLE treatment is accompanied by induction of DSBs.
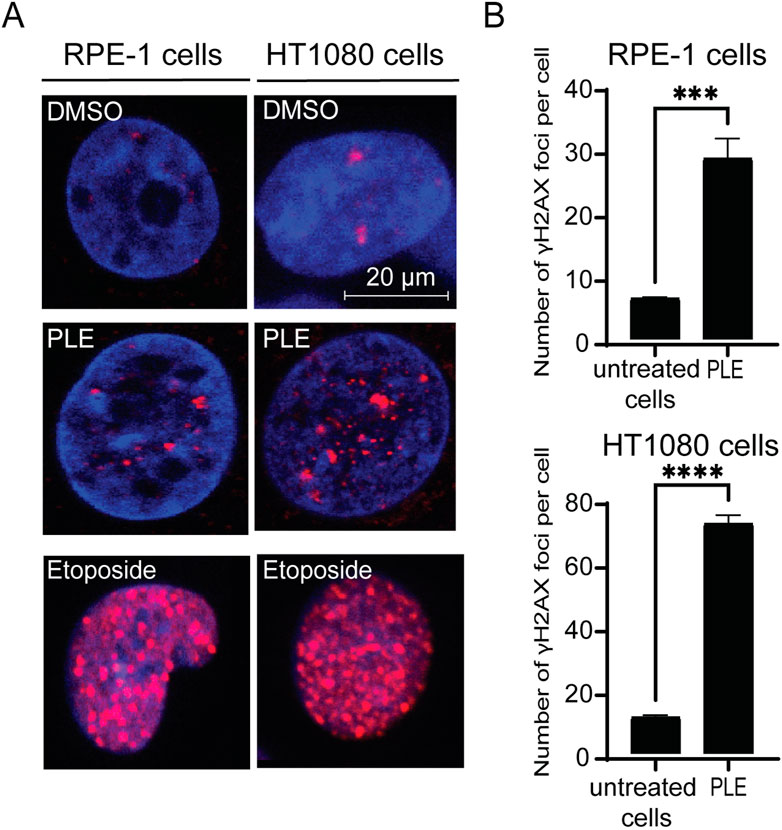
FIGURE 8. Accumulation of γH2AX foci in HT1080 and RPE-1 cells treated with PLE. (A) γH2AX immunostaining of HT1080 cells before and after treatment with PLE. (B) The percentage of γH2AX foci in HT1080 and RPE-1 cells. As a positive control, we used Etoposide – a drug commonly used for cancer therapy. Etoposide is an inhibitor of topoisomerase II that forms DSBs (Tassanee Lerksuthirat et all., 2020). Error bars correspond to a standard deviation (SD) of four replicates. Statistical analysis was performed using 2way ANNOVA, asterisks indicate statistical significance (***p < 0.001, ****p < 0.0001, relative to the negative control—untreated cells).
To summarize, PLE treatment mediates cell cycle delay in G2/M phase and leads to reduction of mitosis, increased MNi, NPBs and γH2AX foci formation, indicating that P. granatum leaf extract contains some substances that elevate CIN. These data indicate a high potential of P. granatum extract as a source of anticancer compounds.
Discussion
A human artificial chromosomes/dGFP-based system for identifying novel chromosome instability inducing compounds
A wide range of methods is applicable for measuring chromosome instability (CIN). The rate of chromosome mis-segregation may be quantified by coupling clonal cell analysis with karyotyping or fluorescence in situ hybridization (FISH) (Kirsch-Volders et al., 1997; Bakker et al., 2015; Thompson and McManus, 2015). The most widely used method is the micronuclei formation assay (Kirsch-Volders et al., 1997), which allows to extrapolate the frequency of MNi formation to the rate of chromosome loss. It is worth noting that an MNi assay does not measure the fraction of drug-arrested cells that undergo mitosis and form viable aneuploid cells. Till now a karyotype analysis and a micronuclei assay remain commonly used to study CIN and CIN induction by anticancer drugs and environmental agents.
Recently the HAC-based technology has been developed for drugs screening to manipulate the CIN phenotype in cancer cells (Lee et al., 2013; Kim et al., 2016; Lee et al., 2016). There are several advantages of the HAC-based assays compared to karyotype and MNi methods. Firstly, the HAC-based assays are significantly faster and less labor-intensive. Secondly, microplate reader, as well as flow cytometry, can rapidly and simultaneously analyze thousands of cells compared to other methods. Finally, the HACs contain a functional centromere that provides their efficient and proper transfer through mitosis. At the same time the HACs have a relatively small size that varies from 1 to 10 Mb. For example, the alphoidtetO-HAC is approximately 5 Mb in size (Kouprina et al., 2012) that results in its spontaneous loss (per cell division) roughly 10-fold higher than that of native chromosomes (Nakano et al., 2008; Lee et al., 2013), making the alphoidtetO-HAC-based assay very sensitive for measuring CIN. Together, these HAC features allow detection of even small differences between the rates of chromosome loss induced by the chemical compounds affecting chromosome stability (Lee et al., 2016). This is important because an accurate assessment of CIN is crucial to select the drugs with the highest effect on chromosome transmission.
In this study, the HAC/dGFP-based system, previously developed for screening different siRNA libraries to identify the genes involved in CIN, was adapted to screen and identify anticancer drugs that selectively affect chromosome segregation. We believe that our HAC-based assay will become the method of choice to find new anticancer drugs that induce tumor cells death through elevation of their chromosomal instability.
P. granatum leaves extract elevates chromosome instability in cancer cells
It is well established that endemic plant secondary metabolites have pluripharmacologic properties inclusive of antiproliferative activities, as corroborated by several in vitro and in vivo studies (Musial et al., 2020; Vafadar et al., 2020). Betulinic acid, a triterpene, is exploited for its antiproliferative activity against a broad spectrum of cancer cell types with a limited adverse effect on non-malignant cells (Przystupski et al., 2019). Earlier works by Neergheen et al. (Neergheen et al., 2006; Neergheen et al., 2007; Neergheen et al., 2011), Soobrattee et al. (2008), Ramhit et al. (2018), Mahomoodally et al. (2019), and Rummun et al. (Rummun et al., 2019; Rummun et al., 2020; Rummun et al., 2021a; Rummun et al., 2021b) have reported the in vitro antiproliferative effect of the plants used in this study (Table 1). Though the examples of the natural products, which anticancer properties were highly rated and medicinally exploited, are abundant in the literature (Freiburghaus et al., 1996; Costa-Lotufo et al., 2005; Cai et al., 2006; Fouche et al., 2008; Kamatou et al., 2008; Ochwang'i et al., 2014) an intensive search for the potent antitumor agents still remains.
In this study, we demonstrated for the first time the direct CIN induction by the pomegranate leaves extract. Pomegranate (P. granatum) has been used for centuries in the traditional medicine of different countries as a source of diverse bioactive compounds with a proven intriguing pharmacological potential (Modaeinama et al., 2015). The P. granatum extracts show the difference in phenolic profiling and antioxidant capacity in flowers, seeds, leaves, and peels (Fellah et al., 2018). The P. granatum leaves extract contains gallic acid, ellagic acid, gallocatechin, delphinidin, cyanidin, pelargonidin, and sitosterol, which are not only powerful antioxidants but were suggested to be attractive sources for discovery of anticancer compounds (Supplementary Table S7) (Nawwar et al., 1994; Lei et al., 2003). Extensive research over the past few years has revealed that the extracts derived from various organs of the pomegranate plant have the direct antineoplastic potential (Khwairakpam et al., 2018). It was detected that the pomegranate flower extract (PFE) stimulates apoptosis and antiproliferative activity of U266 and B16f10 cells (Kiraz et al., 2016; Sharifiyan et al., 2020). The pomegranate peel extract (PPE) significantly reduces viability of numerous cancer cell lines even at the lowest concentration with no or less visible toxicity in normal cells. It was also detected that PPE is responsible for arrest of melanoma cells in G2/M phase and G1 delay of colon carcinoma cells (Modaeinama et al., 2015). Intriguingly, pomegranate peel dietary intake reduces total chromosomal aberrations and aberrant metaphase frequencies of barium-treated rats (Elwej et al., 2016). MTT assay showed the cytotoxicity and antiproliferation effect of the pomegranate seed oil in esophageal, breast, and ovarian cancer cell lines (Shirode et al., 2014; Seidi et al., 2016; Zare et al., 2021).
While many previous studies have shown an antioxidant and tumor-suppressive effect of extracts from the peel, seeds, and steam, in the current study we observed the ability of P. granatum leaves extract (PLE) to elevate chromosome instability. This is in agreement with some studies where it was shown a potential tumor suppressive property of PLE. More specifically, PLE inhibits cell proliferation in the non-small cell lung carcinoma cell line and affects H1299 cell survival by arresting cell cycle progression in G2/M phase in a dose-dependent manner and inducing apoptosis (Li et al., 2016). In other studies, it was shown that PLE contains abundant polyphenols, mainly gallotannins, ellagitannins, and ellagic acid (Sreekumar et al., 2014; Alberto Coronado-Reyes et al., 2021), that was found to interfere with proliferation, cell cycle progression, and apoptosis in vitro and in vivo (Kiraz et al., 2016; Tibullo et al., 2016; Sharifiyan et al., 2020).
While our data strongly support inhibition of cell proliferation (Figure 3) and cell cycle arrest (Figure 4), none of the previous studies has shown the dynamic progression of cell cycle after PLE treatment. Our data demonstrated that recovery from PLE treatment results in disruption of cell cycle progression such as G2/M arrest (Figure 4). The G2/M checkpoint allows to evaluate whether the processes at the previous phases of cell cycle have been properly completed. The G2/M checkpoint is basically influenced by incorrect DNA replication and damage (Wenzel and Singh, 2018). DNA damage induction is a common strategy for cancer chemotherapy. Many DNA damage-inducing drugs utilize DSBs formation, such as etoposide, teniposide, doxorubicin, daunorubicin, idarubicin, and mitoxantrone. In this study, we used Etoposide as a positive control because, as known, it affects DSBs (Figure 8). We observed the comparable effect with PLE and Etoposide treatment that allows to assume that one of the PLE metabolites causes CIN through DNA damage.
As known, DNA damage induces a high level of transient protein-associated breaks in the genome of treated cells. The potential lethality of DSBs rises dramatically when replication machinery or helicases attempt to work on the damaged DNA template. This disrupts the cleavage complex and converts transient single- or double-strand breaks into the permanent double-stranded leisure which is no longer held together by proteinaceous bridges. These breaks may become the targets for recombination, sister chromatid exchange, generation of large insertions and deletions, and ultimately the production of chromosomal aberrations.
Another study demonstrated cell cycle arrest in G2/M after treatment with the pomegranate extract (PE) from fruit skins (Shirode et al., 2014). The authors performed a DNA microarray analysis that revealed that PE downregulates the genes associated with mitosis, chromosome organization, RNA processing, DNA replication, and DNA repair, and upregulates the genes involved in regulation of apoptosis and cell proliferation. Both microarray and quantitative RT-PCR indicated that PE downregulates the genes involved in DNA double strand break repair by homologous recombination (HR), such as MRE11, RAD50, NBS1, RAD51, BRCA1, BRCA2, and BRCC3. Downregulation of HR genes correlates with the increased level of their predicted microRNAs (miRNAs), miR-183 (predicted target RAD50), and miR-24 (predicted target BRCA1), suggesting that PE may regulate miRNAs involved in DNA repair processes. Further, PE treatment increases the frequency of DSBs. All these observations suggest that PE downregulates HR which sensitizes the cells to DSBs, growth inhibition, and apoptosis (Shirode et al., 2014). These data support the conclusion that the P. granatum leave extract induces CIN through DSBs formation. However, the mechanism underlying CIN formation after PLE treatment must be studied by utilizing pure components of the extract.
Our data revealed a significant increase in mitotic abnormalities in PLE-treated cancer cells that included defects in chromosome alignment and multipolar spindle formation (Figure 5). Failure in these processes leads to chromosome mis-segregation that results in abnormal numbers of chromosomes, known as aneuploidy. Identification a specific compound of PLE will allow us to investigate the mechanism(s) by which treatment by this compound results in mitotic abnormalities.
To summarize, the HAC/dGFP-based assay used in this study can be utilized for a further thorough analysis of the purified P. granatum metabolites, including ellagic acid, gallic acid, gallocatechin, delphinidin, cyanidin, pelargonidin, and sitosterol to pick up the individual substance responsible for MNi and NPBs formation and DSBs. Out of a wide range of the methods applied to measure CIN, the HAC/dGFP system allows to measure CIN quantitatively and may serve as an effective biotechnological tool for high-throughput screening of new candidate drugs inducing a CIN level over the survival threshold for cancer cells.
In Memoriam
In loving memory of Dr. Alexander Kagansky who passed away on 21 December 2020.
Data availability statement
The raw data supporting the conclusion of this article will be made available by the authors, without undue reservation.
Author contributions
NG and VK designed the experiments; NG, VK, NS, AB, VG performed the experiments; NG performed data analysis and interpretation; AR perform statistical analysis; VT, VN contributed with discussions; NK, VL, VK critical revision of the article; VK contributed with project administration and funding acquisition; NG, NK wrote the paper; VK contributed with project supervision.
Funding
This study was financially supported by the Ministry of Science and Higher Education of the Russian Federation project no. 0657-2020-0004.
Acknowledgments
We would like to acknowledge the Global Young Academy for the North South Interdisciplinary grant awarded to Kagansky and Neergheen. We thank the director and staff of Alteo Group, Médine Sugar Estate, and Mauritius National Park Conservation Services for permission to collect endemic plant samples and the Mauritius Herbarium for plant identification.
Conflict of interest
The authors declare that the research was conducted in the absence of any commercial or financial relationships that could be construed as a potential conflict of interest.
Publisher’s note
All claims expressed in this article are solely those of the authors and do not necessarily represent those of their affiliated organizations, or those of the publisher, the editors and the reviewers. Any product that may be evaluated in this article, or claim that may be made by its manufacturer, is not guaranteed or endorsed by the publisher.
Supplementary material
The Supplementary Material for this article can be found online at: https://www.frontiersin.org/articles/10.3389/fbioe.2022.989932/full#supplementary-material
References
Ahmed, M. B., A Alghamdi, A. A., Islam, S. U., Ahsan, H., and Lee, Y. S. (2022). The complex roles of DNA repair pathways, inhibitors, hyperthermia, and contact inhibition in cell cycle halts. Mini Rev. Med. Chem. [Epub ahead of print] 22. doi:10.2174/1389557522666220826141837
Alberto Coronado-Reyes, J., CortÉS-Penagos, C., and González-Hernández, J. (2021). Chemical composition and great applications to the fruit of the pomegranate (Punica granatum): a review. Food Sci. Technol. 42. doi:10.1590/fst.29420
Bakker, B., van den Bos, H., Lansdorp, P. M., and Foijer, F. (2015). How to count chromosomes in a cell: An overview of current and novel technologies. Bioessays 37 (5), 570–577. doi:10.1002/bies.201400218
Cai, Y. Z., Mei, S., Jie, X., Luo, Q., and Corke, H. (2006). Structure-radical scavenging activity relationships of phenolic compounds from traditional Chinese medicinal plants. Life Sci. 78 (25), 2872–2888. doi:10.1016/j.lfs.2005.11.004
Costa-Lotufo, L. V., Khan, M. T., Ather, A., Wilke, D. V., Jimenez, P. C., Pessoa, C., et al. (2005). Studies of the anticancer potential of plants used in Bangladeshi folk medicine. J. Ethnopharmacol. 99 (1), 21–30. doi:10.1016/j.jep.2005.01.041
Elwej, A., Ghorbel, I., Marrekchi, R., Boudawara, O., Jamoussi, K., Boudawara, T., et al. (2016). Improvement of kidney redox states contributes to the beneficial effects of dietary pomegranate peel against barium chloride-induced nephrotoxicity in adult rats. Arch. Physiol. Biochem. 122 (3), 130–140. doi:10.3109/13813455.2016.1150298
Fellah, B., Bannour, M., Rocchetti, G., Lucini, L., and Ferchichi, A. (2018). Phenolic profiling and antioxidant capacity in flowers, leaves and peels of Tunisian cultivars of Punica granatum L. J. Food Sci. Technol. 55 (9), 3606–3615. doi:10.1007/s13197-018-3286-8
Fouche, G., Cragg, G. M., Pillay, P., Kolesnikova, N., Maharaj, V. J., and Senabe, J. (2008). In vitro anticancer screening of South African plants. J. Ethnopharmacol. 119 (3), 455–461. doi:10.1016/j.jep.2008.07.005
Freiburghaus, F., Kaminsky, R., Nkunya, M. H., and Brun, R. (1996). Evaluation of African medicinal plants for their in vitro trypanocidal activity. J. Ethnopharmacol. 55 (1), 1–11. doi:10.1016/s0378-8741(96)01463-8
Fridlender, M., Kapulnik, Y., and Koltai, H. (2015). Plant derived substances with anti-cancer activity: from folklore to practice. Front. Plant Sci. 6, 799. doi:10.3389/fpls.2015.00799
Gomez, V., and Hergovich, A. (2016). “Cell-cycle control and DNA-damage signaling in mammals,” in Chapter 14 - cell-cycle control and DNA-damage signaling in mammals, genome stability (Academic Press), 227–242. doi:10.1016/B978-0-12-803309-8.00014-8
Iida, Y., Kim, J. H., Kazuki, Y., Hoshiya, H., Takiguchi, M., Hayashi, M., et al. (2010). Human artificial chromosome with a conditional centromere for gene delivery and gene expression. DNA Res. 17 (5), 293–301. doi:10.1093/dnares/dsq020
Janssen, A., Kops, G. J., and Medema, R. H. (2009). Elevating the frequency of chromosome mis-segregation as a strategy to kill tumor cells. Proc. Natl. Acad. Sci. U. S. A. 106 (45), 19108–19113. doi:10.1073/pnas.0904343106
Kamatou, G. P. P., Van Zyl, R. L., Davids, H., Van Heerden, F. R., Lourens, A. C. U., and Viljoen, A. M. (2008). Antimalarial and anticancer activities of selected South African Salvia species and isolated compounds from S. radula. South Afr. J. Bot. 74 (2), 238–243. doi:10.1016/j.sajb.2007.08.001
Kaufmann, W. K., Carson, C. C., Omolo, B., Filgo, A. J., Sambade, M. J., Simpson, D. A., et al. (2014). Mechanisms of chromosomal instability in melanoma. Environ. Mol. Mutagen. 55 (6), 457–471. doi:10.1002/em.21859
Khwairakpam, A. D., Bordoloi, D., Thakur, K. K., Monisha, J., Arfuso, F., Sethi, G., et al. (2018). Possible use of Punica granatum (Pomegranate) in cancer therapy. Pharmacol. Res. 133, 53–64. doi:10.1016/j.phrs.2018.04.021
Kim, J. H., Lee, H. S., Lee, N. C., Goncharov, N. V., Kumeiko, V., Masumoto, H., et al. (2016). Development of a novel HAC-based "gain of signal" quantitative assay for measuring chromosome instability (CIN) in cancer cells. Oncotarget 7 (12), 14841–14856. doi:10.18632/oncotarget.7854
Kinghorn, A. D. (1994). “CHAPTER 4 - the discovery of drugs from higher plants,” in Discovery of novel natural products with therapeutic potential. Editor V. P. Gullo (Boston: Newnes), 81–108.
Kingston, D. G. I. (2011). Modern natural products drug discovery and its relevance to biodiversity conservation. J. Nat. Prod. (Gorakhpur). 74 (3), 496–511. doi:10.1021/np100550t
Kiraz, Y., Neergheen-Bhujun, V. S., Rummun, N., and Baran, Y. (2016). Apoptotic effects of non-edible parts of Punica granatum on human multiple myeloma cells. Tumor Biol. 37 (2), 1803–1815. doi:10.1007/s13277-015-3962-5
Kirsch-Volders, M., Elhajouji, A., Cundari, E., and Van Hummelen, P. (1997). The in vitro micronucleus test: a multi-endpoint assay to detect simultaneously mitotic delay, apoptosis, chromosome breakage, chromosome loss and non-disjunction. Mutat. Res. Genetic Toxicol. Environ. Mutagen. 392 (1-2), 19–30. doi:10.1016/s0165-1218(97)00042-6
Kouprina, N., Samoshkin, A., Erliandri, I., Nakano, M., Lee, H. S., Fu, H., et al. (2012). Organization of synthetic alphoid DNA array in human artificial chromosome (HAC) with a conditional centromere. ACS Synth. Biol. 1 (12), 590–601. doi:10.1021/sb3000436
Lee, H. S., Lee, N. C., Grimes, B. R., Samoshkin, A., Kononenko, A. V., Bansal, R., et al. (2013). A new assay for measuring chromosome instability (CIN) and identification of drugs that elevate CIN in cancer cells. BMC Cancer 13, 252. doi:10.1186/1471-2407-13-252
Lee, H. S., Lee, N. C. O., Kouprina, N., Kagansky, A., Bates, S., Trepel, J. B., et al. (2016). Effects of anticancer drugs on chromosome instability and new clinical implications for tumor-suppressing therapies. Cancer Res. 76 (4), 902–911. doi:10.1158/0008-5472.CAN-15-1617
Lei, F., Xing, D.-M., Xiang, L., Zhao, Y.-N., Wang, W., Zhang, L.-J., et al. (2003). Pharmacokinetic study of ellagic acid in rat after oral administration of pomegranate leaf extract. J. Chromatogr. B 796 (1), 189–194. doi:10.1016/S1570-0232(03)00610-X
Lezaja, A., and Altmeyer, M. (2018). Inherited DNA lesions determine G1 duration in the next cell cycle. Cell Cycle 17, 24–32. doi:10.1080/15384101.2017.1383578
Li, Y., Yang, F., Zheng, W., Hu, M., Wang, J., Ma, S., et al. (2016). Punica granatum (pomegranate) leaves extract induces apoptosis through mitochondrial intrinsic pathway and inhibits migration and invasion in non-small cell lung cancer in vitro. Biomed. Pharmacother. 80, 227–235. doi:10.1016/j.biopha.2016.03.023
Liskovykh, M., Goncharov, N. V., Petrov, N., Aksenova, V., Pegoraro, G., Ozbun, L. L., et al. (2019). A novel assay to screen siRNA libraries identifies protein kinases required for chromosome transmission. Genome Res. 29 (10), 1719–1732. doi:10.1101/gr.254276.119
Mah, L. J., El-Osta, A., and Karagiannis, T. C. (2010). γH2AX: a sensitive molecular marker of DNA damage and repair. Leukemia 24 (4), 679–686. doi:10.1038/leu.2010.6
Mahomoodally, F., Aumeeruddy-Elalfi, Z., Venugopala, K. N., and Hosenally, M. (2019). Antiglycation, comparative antioxidant potential, phenolic content and yield variation of essential oils from 19 exotic and endemic medicinal plants. Saudi J. Biol. Sci. 26 (7), 1779–1788. doi:10.1016/j.sjbs.2018.05.002
Modaeinama, S., Abasi, M., Abbasi, M. M., and Jahanban-Esfahlan, R. (2015). Anti tumoral properties of Punica granatum (pomegranate) peel extract on different human cancer cells. Asian Pac. J. Cancer Prev. 16 (14), 5697–5701. doi:10.7314/apjcp.2015.16.14.5697
Musial, C., Kuban-Jankowska, A., and Gorska-Ponikowska, M. (2020). Beneficial properties of green tea catechins. Int. J. Mol. Sci. 21 (5), 1744. doi:10.3390/ijms21051744
Nakano, M., Cardinale, S., Noskov, V. N., Gassmann, R., Vagnarelli, P., Kandels-Lewis, S., et al. (2008). Inactivation of a human kinetochore by specific targeting of chromatin modifiers. Dev. Cell 14 (4), 507–522. doi:10.1016/j.devcel.2008.02.001
Nawwar, M. A. M., Hussein, S. A. M., and Merfort, I. (1994). Leaf phenolics of Punica granatum. Phytochemistry 37 (4), 1175–1177. doi:10.1016/S0031-9422(00)89552-7
Neergheen, V. S., Soobrattee, M. A., Bahorun, T., and Aruoma, O. I. (2006). Characterization of the phenolic constituents in Mauritian endemic plants as determinants of their antioxidant activities in vitro. J. Plant Physiol. 163 (8), 787–799. doi:10.1016/j.jplph.2005.09.009
Neergheen, V. S., Bahorun, T., Jen, L.-S., and Aruoma, O. I. (2007). Bioefficacy of Mauritian endemic medicinal plants: Assessment of their phenolic contents and antioxidant potential. Pharm. Biol. 45 (1), 9–17. doi:10.1080/13880200601026242
Neergheen, V. S., Bahorun, T., and Aruoma, O. I. (2011). In vitro anti-proliferative and apoptotic screening of Mauritian endemic plants. Univ. Maurit. Res. J. 17, 240–255.
Neergheen-Bhujun, V., Awan, A. T., Baran, Y., Bunnefeld, N., Chan, K., Dela Cruz, T. E., et al. (2017). Biodiversity, drug discovery, and the future of global health: Introducing the biodiversity to biomedicine consortium, a call to action. J. Glob. Health 7 (2), 020304. doi:10.7189/jogh.07.020304
Ochwang'i, D. O., Kimwele, C. N., Oduma, J. A., Gathumbi, P. K., Mbaria, J. M., and Kiama, S. G. (2014). Medicinal plants used in treatment and management of cancer in Kakamega County, Kenya. J. Ethnopharmacol. 151 (3), 1040–1055. doi:10.1016/j.jep.2013.11.051
Pérez de Castro, I., and Malumbres, M. (2012). Mitotic stress and chromosomal instability in cancer: The case for TPX2. Genes Cancer 3 (11-12), 721–730. doi:10.1177/1947601912473306
Przystupski, D., Niemczura, M. J., Górska, A., Supplitt, S., Kotowski, K., Wawryka, P., et al. (2019). In search of panacea-review of recent studies concerning nature-derived anticancer agents. Nutrients 11 (6), 1426. doi:10.3390/nu11061426
Ramhit, P., Ragoo, L., Bahorun, T., and Neergheen-Bhujun, V. S. (2018). Multi-targeted effects of untapped resources from the Mauritian endemic flora. South Afr. J. Bot. 115, 208–216. doi:10.1016/j.sajb.2018.01.020
Rummun, N., Somanah, J., Ramsaha, S., Bahorun, T., and Neergheen-Bhujun, V. S. (2013). Bioactivity of nonedible parts of Punica granatum L.: A potential source of functional ingredients. Int. J. Food Sci. 2013, 1–12. doi:10.1155/2013/602312
Rummun, N., Neergheen-Bhujun, V. S., Pynee, K. B., Baider, C., and Bahorun, T. (2018). The role of endemic plants in Mauritian traditional medicine – Potential therapeutic benefits or placebo effect?. J. Ethnopharmacol. 213, 111–117. doi:10.1016/j.jep.2017.10.006
Rummun, N., Hughes, R. E., Beesoo, R., Li, W. W., Aldulaimi, O., Macleod, K. G., et al. (2019). Mauritian endemic medicinal plant extracts induce G2/M phase cell cycle arrest and growth inhibition of oesophageal squamous cell carcinoma in vitro. Acta Naturae 11 (1), 81–90. doi:10.32607/20758251-2019-11-1-81-90
Rummun, N., Rondeau, P., Bourdon, E., Pires, E., McCullagh, J., Claridge, T. D. W., et al. (2020). Terminalia bentzoë, a mascarene endemic plant, inhibits human hepatocellular carcinoma cells growth in vitro via G0/G1 phase cell cycle arrest. Pharm. (Basel) 13 (10), 303. doi:10.3390/ph13100303
Rummun, N., Pires, E., McCullagh, J., Claridge, T. W. D., Bahorun, T., Li, W.-W., et al. (2021a). Methyl gallate – rich fraction of Syzygium coriaceum leaf extract induced cancer cell cytotoxicity via oxidative stress. South Afr. J. Bot. 137, 149–158. doi:10.1016/j.sajb.2020.10.014
Rummun, N., Serag, A., Rondeau, P., Ramsaha, S., Bourdon, E., Bahorun, T., et al. (2021b). Antiproliferative activity of syzygium coriaceum, an endemic plant of Mauritius, with its UPLC-MS metabolite fingerprint: A mechanistic study. PLOS ONE 16 (6), e0252276. doi:10.1371/journal.pone.0252276
Sakaue-Sawano, A., Ohtawa, K., Hama, H., Kawano, M., Ogawa, M., and Miyawaki, A. (2008). Tracing the silhouette of individual cells in S/G2/M phases with fluorescence. Chem. Biol. 15 (12), 1243–1248. doi:10.1016/j.chembiol.2008.10.015
Sakaue-Sawano, A., Hoshida, T., Yo, M., Takahashi, R., Ohtawa, K., Arai, T., et al. (2013). Visualizing developmentally programmed endoreplication in mammals using ubiquitin oscillators. Development 140 (22), 4624–4632. doi:10.1242/dev.099226
Seidi, K., Jahanban-Esfahlan, R., Abasi, M., and Abbasi, M. M. (2016). Anti tumoral properties of Punica granatum (pomegranate) seed extract in different human cancer cells. Asian Pac. J. Cancer Prev. 17 (3), 1119–1122. doi:10.7314/apjcp.2016.17.3.1119
Sharifiyan, F., Mirjalili, S. A., Fazilati, M., Poorazizi, E., and Habibollahi, S. (2020). Cytotoxic effect of hydro-alcoholic extract of pomegranate (Punica granatum L.) flowers and isolated ursolic acid on B16f10 melanoma cells. J. Med. Plants 19 (74), 177–191. doi:10.29252/jmp.19.74.177
Shirode, A. B., Kovvuru, P., Chittur, S. V., Henning, S. M., Heber, D., and Reliene, R. (2014). Antiproliferative effects of pomegranate extract in MCF-7 breast cancer cells are associated with reduced DNA repair gene expression and induction of double strand breaks. Mol. Carcinog. 53 (6), 458–470. doi:10.1002/mc.21995
Silk, A. D., Zasadil, L. M., Holland, A. J., Vitre, B., Cleveland, D. W., and Weaver, B. A. (2013). Chromosome missegregation rate predicts whether aneuploidy will promote or suppress tumors. Proc. Natl. Acad. Sci. U. S. A. 110 (44), E4134–E4141. doi:10.1073/pnas.1317042110
Soobrattee, M. A., Bahorun, T., Neergheen, V. S., Googoolye, K., and Aruoma, O. I. (2008). Assessment of the content of phenolics and antioxidant actions of the Rubiaceae, Ebenaceae, Celastraceae, Erythroxylaceae and Sterculaceae families of Mauritian endemic plants. Toxicol. Vitro 22 (1), 45–56. doi:10.1016/j.tiv.2007.07.012
Sreekumar, S., Sithul, H., Muraleedharan, P., Azeez, J. M., and Sreeharshan, S. (2014). Pomegranate fruit as a rich source of biologically active compounds. BioMed Res. Int. 2014, 686921–687012. doi:10.1155/2014/686921
Thompson, L. L., and McManus, K. J. (2015). A novel multiplexed, image-based approach to detect phenotypes that underlie chromosome instability in human cells. PLOS ONE 10 (4), e0123200. doi:10.1371/journal.pone.0123200
Thompson, S. L., Bakhoum, S. F., and Compton, D. A. (2010). Mechanisms of chromosomal instability. Curr. Biol. 20 (6), R285–R295. doi:10.1016/j.cub.2010.01.034
Tibullo, D., Caporarello, N., Giallongo, C., Anfuso, C. D., Genovese, C., Arlotta, C., et al. (2016). Antiproliferative and antiangiogenic effects of Punica granatum juice (PGJ) in multiple myeloma (MM). Nutrients 8 (10), 611. doi:10.3390/nu8100611
Vafadar, A., Shabaninejad, Z., Movahedpour, A., Fallahi, F., Taghavipour, M., Ghasemi, Y., et al. (2020). Quercetin and cancer: new insights into its therapeutic effects on ovarian cancer cells. Cell Biosci. 10 (1), 32. doi:10.1186/s13578-020-00397-0
Wenzel, E. S., and Singh, A. T. K. (2018). Cell-cycle checkpoints and aneuploidy on the path to cancer. Vivo 32 (1), 1–5. doi:10.21873/invivo.11197
Keywords: chromosome instability, CIN, human artificial chromosome, HAC, Punica granatum leave extract, double-stranded breaks, micronuclei, natural products
Citation: Goncharov NV, Kovalskaia VA, Romanishin AO, Shved NA, Belousov AS, Tiasto VS, Gulaia VS, Neergheen VS, Rummun N, Liskovykh M, Larionov V, Kouprina N and Kumeiko VV (2022) Novel assay to measure chromosome instability identifies Punica granatum extract that elevates CIN and has a potential for tumor- suppressing therapies. Front. Bioeng. Biotechnol. 10:989932. doi: 10.3389/fbioe.2022.989932
Received: 09 July 2022; Accepted: 22 November 2022;
Published: 19 December 2022.
Edited by:
Hirshi Masumoto, Nagasaki University, JapanReviewed by:
Stephanie Stransky, Albert Einstein College of Medicine, United StatesAyumu Yamamoto, Shizuoka University, Japan
Copyright © 2022 Goncharov, Kovalskaia, Romanishin, Shved, Belousov, Tiasto, Gulaia, Neergheen, Rummun, Liskovykh, Larionov, Kouprina and Kumeiko. This is an open-access article distributed under the terms of the Creative Commons Attribution License (CC BY). The use, distribution or reproduction in other forums is permitted, provided the original author(s) and the copyright owner(s) are credited and that the original publication in this journal is cited, in accordance with accepted academic practice. No use, distribution or reproduction is permitted which does not comply with these terms.
*Correspondence: Nikolay V. Goncharov, goncharovnv.gn@gmai.com; Vadim V. Kumeiko, vkumeiko@yandex.ru