Proteomic Responses of Dark-Adapted Euglena gracilis and Bleached Mutant Against Light Stimuli
 Zhenfan Chen
 Zixi Chen
 Jiayi Zhu1
  Jiayi He
 Qiong Liu
 Anping Lei
 Jiangxin Wang
- 1Shenzhen Key Laboratory of Marine Bioresource and Eco-Environmental Science, Shenzhen Engineering Laboratory for Marine Algal Biotechnology, Guangdong Provincial Key Laboratory for Plant Epigenetics, College of Life Sciences and Oceanography, Shenzhen University, Shenzhen, China
- 2Key Laboratory of Optoelectronic Devices and Systems of Ministry of Education and Guangdong Province, College of Optoelectronic Engineering, Shenzhen University, Shenzhen, China
- 3College of Food Engineering and Biotechnology, Hanshan Normal University, Chaozhou, China
- 4Shenzhen-Hong Kong Institute of Brain Science, Shenzhen, China
Euglena gracilis (E. gracilis) has secondary endosymbiotic chloroplasts derived from ancient green algae. Its chloroplasts are easily lost under numerous conditions to become permanently bleached mutants. Green cells adapted in the dark contain undeveloped proplastids and they will develop into mature chloroplasts after 3 days of light exposure. Thus, E. gracilis is an ideal model species for a chloroplast development study. Previous studies about chloroplast development in E. gracilis focused on morphology and physiology, whereas few studies have addressed the regulatory processes induced by light in the proteome. In this study, the whole-genome proteome of dark-adapted E. gracilis (WT) and permanently ofloxacin-bleached mutant (B2) was compared under the light exposure after 0, 12, and 72 h. The results showed that the photosynthesis-related proteins were up-regulated over time in both WT and B2. The B2 strain, with losing functional chloroplasts, seemed to possess a complete photosynthetic function system. Both WT and B2 exhibited significant light responses with similar alternation patterns, suggesting the sensitive responses to light in proteomic levels. The main metabolic activities for the utilization of carbon and energy in WT were up-regulated, while the proteins with calcium ion binding, cell cycle, and non-photosynthetic carbon fixation were down-regulated in B2. This study confirmed light-induced chloroplast development in WT from dark, and also for the first time investigates the light responses of a bleached mutant B2, providing more information about the unknown functions of residual plastids in Euglena bleached mutants.
Introduction
Euglena gracilis (E. gracilis) a unicellular green eukaryotic microalga, belonging to the group of euglenids (Excavata), is widely distributed in aquatic environments. E. gracilis cells are rich in nutrients with many high-value products, such as paramylon, methionine, vitamins, and fatty acids and has become a new kind of popular product in the market (Mokrosnop, 2018; Gissibl et al., 2019; Kottuparambil et al., 2019). Euglenids exhibit diverse modes of nutrition, including autotrophy, heterotrophy, and mixotrophy with both animal and plant characteristics (Torihara and Kishimoto, 2015).
It is worth mentioning that the chloroplasts of E. gracilis are embedded by three membranes as the result of secondary endosymbiosis. The ancestor of E. gracilis is known as a heterotrophic animal species and captures green algae resulting in the acquisition of photosynthetic ability by secondary endosymbiosis. E. gracilis nuclear genome contains not only genes of green algal origin but also chloroplasts that are identical to chloroplasts found in some green algae (Maruyama et al., 2011; Markunas and Triemer, 2016). However, the chloroplasts in E. gracilis seem to be gratuitous for survival. For example, many treatments such as mutagens, heat, and pressure could bleach E. gracilis, and permanently lose most, if not all, of their chloroplast genomes but with few impacts on their heterotrophic growth (Heizmann et al., 1976; Osafune and Schiff, 1983). Moreover, the bleached mutants can be induced by the aminoglycosides treatment, such as ofloxacin or streptomycin (Shibata et al., 1954; Tamaki et al., 2020; Tomečková et al., 2020). In our previous study, five bleached mutants of E. gracilis treated with ofloxacin were obtained and 12 residual plastid genes of the total chloroplast genome were investigated in both WT and bleached mutants. One of the bleached mutants named B2 lost the ability to accumulate chlorophyll, which was due to many genes of chloroplasts being undetected at the genomic and transcriptional levels, such as psbE and psbK (Qin et al., 2020).
In the dark, E. gracilis plastids become poorly developed without green pigments and can be recovered into photosynthetically capable chloroplasts after light exposure restoration for 3 days (Stern et al., 1964). This process has been well studied since the 1960s. For example, Stern et al. (1964) have detected the pigment biosynthesis in qualitative and quantitative numbers during the development of chloroplast, and Epstein and Schiff (1961) have captured the process images from proplastids to develop into mature chloroplasts by electron and fluorescence microscopy in 72 h. The development of E. gracilis chloroplasts is a process tightly time regulated by light exposure. Euglena has a reduced content of chloroplast genes for photosynthetic and non-photosynthetic activities relative to the land plants. The chloroplast genome of E. gracilis was the first chloroplast genome completely sequenced (Hallick et al., 1993), including 55 known genes for components of the chloroplast 70S ribosomes, tRNAs, and translation factors; 27 genes for components of the thylakoid membranes, the chloroplast ATP synthase complex, or the CO2-fixing enzyme RUBISCO; five ORFs identified by similarity to other chloroplast ORFs; and 10 other ORFs of unknown function. E. gracilis nuclei encode and regulate more than 90% of proteins in chloroplasts such as light-harvesting complex proteins (Koziol and Durnford, 2008). The critical time points of chloroplast development are on the initiated time in 12 h and the stable time in 72 h for the poorly organelle development in the dark to mature functional chloroplasts after light exposure. The chlorophyll synthesis of E. gracilis is light-induced and exhibits a 12 h lag period for the rapid synthesis of the photosystem I (PSI) reaction centers, while roughly an 18–24 h lag period is recorded for the trigger of photosystem II (PSII) reaction centers (Stern et al., 1964; Yi et al., 1985), and the synthesis rate of chloroplast related-proteins is almost stable after 72 h of light exposure (Monroy et al., 1987).
The chloroplast development and nucleus-encoded protein synthesis induced by light are controlled at the translational level rather than transcript level (Schwartzbach, 2017), however, few reports focus on the development of chloroplast of E. gracilis by proteome, probably due to a lack of a high-quality assembled genome. In this study, we employed the long-term dark-adapted WT and an Ofloxacin permanently bleached mutant of E. gracilis B2 for a comparative proteomic study. Both WT and B2 have continuously been cultured in the dark for six months. To investigate the proteome differences of the development of E. gracilis chloroplast, both WT and B2 cells were compared under the light exposure at the following critical time points of 0, 12, and 72 h. We found that both E. gracilis WT and B2 strains exhibited light response and light regulation at the protein level. The proteins related to photosynthesis were up-regulated over time in both WT and B2. Although the random deletion of the plastid genome in B2 prevented its chlorophyll synthesis, proteomic data showed that it may have a complete function of the photosynthetic system. The main metabolic activities for the utilization of carbon and energy in WT were up-regulated, while the proteins with calcium ion binding, cell cycle, and non-photosynthetic carbon fixation were down-regulated in B2. The study provided a new understanding of E. gracilis chloroplast development during the re-greening process and compared the similarity and differences between WT and B2 at the proteome level.
Materials and Methods
Growth Conditions and Sampling
The E. gracilis Z strain (WT) and E. gracilis Oflaxocin bleached mutant strain (B2) were grown in EM medium with 1% ethanol under dark, which, for preparation,was inoculated into the refresh medium every 10 days for approximately 7 months. The WT was purchased from CCAP (Culture Collection of Algae and Protozoa, United Kingdom), and the acquisition of B2 has followed the protocol as described in Qin et al. (2020). For the light treatments, both WT and B2 cells were exposed to a light intensity of approximately 50 μmol photons·m−2·s−1 in an illuminating incubator at 25°C without shaking. The initial density of the cell was 1×10⁶ cell/ml from dark cultures in a 250 ml conical flask containing 100 ml, and total cells were collected by centrifugation at 500 g for 5 min at 0, 12, and 72 h after light exposure with three duplicates, respectively. The samples were stored at −80°C for protein extraction.
Fluorescence Imaging
To detect E. gracilis chloroplast development, the images were viewed and captured using a Leica DMI 3000 B inverted fluorescence microscope epi-fluorescence microscope. The blue argon laser (488 nm) was chosen as the exciting light and the auto-fluorescence emitted light of chloroplasts was collected between 660 and 731 nm.
Protein Extraction and Digestion
Protein extraction was performed as described previously (Coman et al., 2016). Briefly, the frozen samples were thawed and approximately 400 μl of pre-cooled acetone, under −40°C, was added for precipitation for 4 h. Then, the pellet of each sample was collected by centrifugation at 6,000 g at 4°C for 10 min, and 300 μl of 80% acetone was added to rinse the pellet with a centrifuge at 6,000 g for 10 min. After repeating this step twice, 100 μl of HEPES-SDC (Sigma, United States) was added to dissolve the protein and ultrasonication was performed on ice for 2 min. Finally, the supernatant was collected after centrifugation at 6,000 g for 10 min. For digestion, each sample was added with pre-cooled acetone at a 5-fold volume, shaken on ice for 30 min and the proteins were precipitated at −20°C for 4 h. The supernatant was removed carefully after centrifugation at 6,000 g at 4°C for 10 min, 200 μl of pre-cooled 80% acetone was added and the pellet was collected after centrifugation at 6,000 g. Then, 100 μl of 100 mM HEPES-SDC (Sigma, United States) was added to dissolve protein and ultrasonication was performed on ice for 30 s. The dissolved protein was digested by trypsin (2 μg, Promega, United States) for 2–4 h at 42°C.
Tandem Mass Tag Labeling and nanoLCMS/MS Analysis
The digested samples were added with 15 μl of TMT (Thermo Scientific, United States) and incubated at room temperature for 1 h, then added with 2 μl of 5% hydroxylamine and incubated again at room temperature for 15 min. The collected fractions were SDC cleanup with 2% trifluoroacetic acid (TFA, Sigma, United States) and peptide desalting with desalting buffer work solution Acetonitrile (ACN, ANPEL Laboratory Technologies, China). The samples were performed in XBridge BEH C18 XP Column (Waters, United States).
For nanoLCMS/MS analysis, 1 μg of total peptides for each sample were conducted on a nano-UPLC (EASYnLC1200) coupled to a Q Exactive HFX Orbitrap instrument (Thermo Fisher Scientific). A reversed-phase column (100 μm ID ×15 cm, Reprosil-Pur 120 C18-AQ, 1.9 μm, Dr. Math) was used. Mobile phases A were H2O with 0.1% formic acid (FA, Sigma, United States), 2% ACN, and phase B were 80% ACN, 0.1% FA. The samples were separated with a gradient of 90 min at a flow rate of 300 nL/min in gradient A, while gradient B: 2–5% for 2 min, 5–22% for 68 min, 22–45% for 16 min, 45–95% for 2 min, 95% for 2 min. Finally, data-dependent acquisition (DDA) was performed in profile and positive mode with an Orbitrap analyzer.
Proteomic Data Analysis
After data quality control, protein sequences were searched against their species-level UniProt FASTA databases (UniProt-Euglenophyceae-107469-2021-03), and the proteomics data have been deposited to the ProteomeXchange Consortium with the dataset identifier PXD030414. Time-series analysis was conducted using the maSigPro package (v1.54) (Conesa and Nueda, 2018). Differentially expressed proteins (DEPs) among groups were filtered with 1) more than one unique peptide, 2) foldchange more than 1.5 or less than 0.67, and 3) p-value less than 0.05. COG (Cluster of Orthologous Groups of proteins) annotations were obtained by eggNOG (v5.0.0) and eggNOG-mapper (v2) using the protein sequences (Huerta-Cepas et al., 2019; Cantalapiedra et al., 2021). GO (gene ontology) annotations were extracted from the UniProt database (20210419). KEGG (Kyoto Encyclopedia of Genes and Genomes) annotations were obtained by BlastKOALA and GhostKOALA (Kanehisa et al., 2016), while the annotation was used only if the result was the same in at least two databases. GO and KEGG enrichment was conducted using clusterProfiler (v3.10.1) with the enricher function. Venn plots were generated using Venny (v2.1) (Yu et al., 2012; Oliveros, 2016). All the other figures were generated in R (v3.5.3) using pheatmap (v1.0.12) and ggplot2 (v3.2.1) packages.
Results
The Development of E. gracilis Chloroplasts
As shown in Figure 1, the color of WT that grew in the conical flask turns white to green when exposed to light from 0 to 72 h and no color changes were observed in B2 culture bottles after 72 h of light exposure. The phenomena is also consistent with the light images under microscopy. Moreover, the red fluorescence intensity of chloroplasts of WT was significantly associated with exposure time, while no fluorescence is visible for the bleached mutant cells. The red fluorescence intensity was enhanced over time in WT compared to B2. Results indicated that the chloroplast functional integrity is affiliated with light exposure, showing a time-dependent pattern, and B2 lost the ability to accumulate chlorophyll.
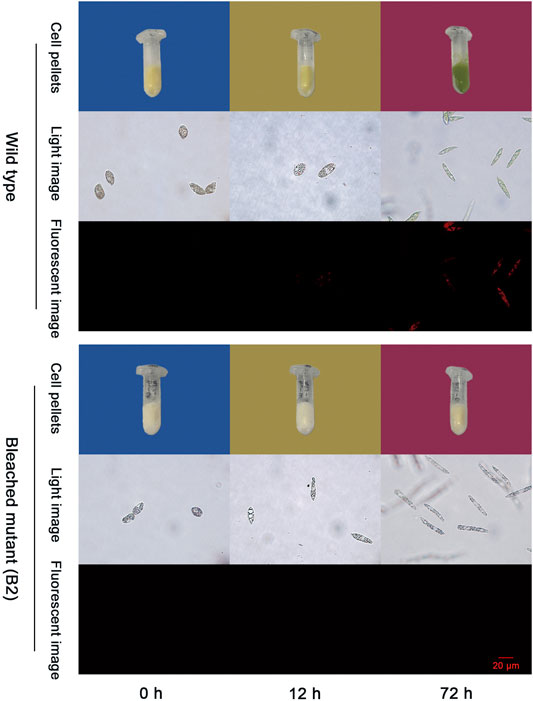
FIGURE 1. Photos of chloroplast development in wild type (WT) and bleached mutant (B2) of E. gracilis after light exposure restoration. Two groups (WT and B2) that included cell pellets images and microscopy images from visible light and fluorescent light were shown at the time point of 0, 12, and 72 h, respectively.
The Overview of Proteomics Data
In this dataset, a total of 1,572 matched peptides were obtained after removing decoy and potential polypeptides. The principle component analysis (PCA) plot showed the similarity among the samples. The difference between WT at 0 h and WT at 12 h was smaller, as well as in B2. However, at 72 h, their higher divergence was shown in the intra-group and the inter-group (Figure 2). The distribution of protein score values was shown in Supplementary Figure S1.
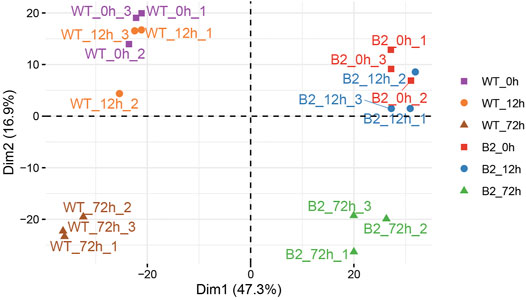
FIGURE 2. Principle component analysis (PCA) plot of proteomic samples in WT and B2. In the score plot, samples were distinguished by different shapes and colors of symbol.
The Differential Proteins Indicated by Time Serial in WT and B2
To find significant protein translation profile differences between experimental groups in time course, trend analysis was conducted to the proteomics data using the maSigPro package. 988 differentially expressed peptides were screened out and classified into 9 clusters (Supplementary Figure S2), while all the non-significant peptides were classified to cluster 10. Proteins changed in WT and B2 after light re-greening was analyzed and clustered by their expression patterns in time series as shown in Figure 3. In WT, the up-regulated protein groups were largely enriched on clusters 1-3, while clusters 3-9 were down-regulated. Cluster 1 in WT-72 h was significantly up-regulated. The GO annotation of cluster1 showed that the enriched proteins were involved in photosynthesis of light-harvesting, plastid, chloroplast thylakoid membrane (an integral component of membrane), iron ion binding, chloroplast, and proton-transporting ATP synthase activity, etc. (Figure 4A). The KEGG modules or pathways of cluster1 were mostly relative to photosynthesis, such as antenna proteins, metabolic pathways, carbon fixation in photosynthetic organisms, and biosynthesis of cofactors (Figure 4B). However, cluster 10 was down-regulated in the WT at 72 h in general, and they were structural constituents of the ribosome, translation, and its pathway relevant to the ribosome (Figures 4A,B). In B2, the up-regulated proteins in 0, 12, and 72 h were in clusters 8-9, 6-7, and 4-5 respectively, while down-regulation was found in clusters 1, 2, and 3. By comparing WT with B2, clusters 1-3 were up-regulated and clusters 4-9 were down-regulated in WT and opposite results were found in B2. The GO annotation of clusters 2-5 included ATPase activity, ATP binding, cytoplasm, mRNA processing, etc., and their KEGG was mostly enriched in pathways of the cell cycle in these clusters. The GO annotation of clusters 6-9 was relative to the proteins of GTP binding, glycolytic process, mitochondrial inner membrane, NADP binding, tricarboxylic acid (TCA) cycle, and carbohydrate metabolic process, etc. (Figure 4A). Their KEGG pathways were enriched in those for energy flow, for example, biosynthesis of secondary metabolites, fatty acid metabolism, and glycolysis, etc (Figure 4B). It was apparent from these results that the E. gracilis chloroplast development was associated with the time point of light exposure and it was different with the bleached mutant, which lacked several key genes for chloroplast functions.
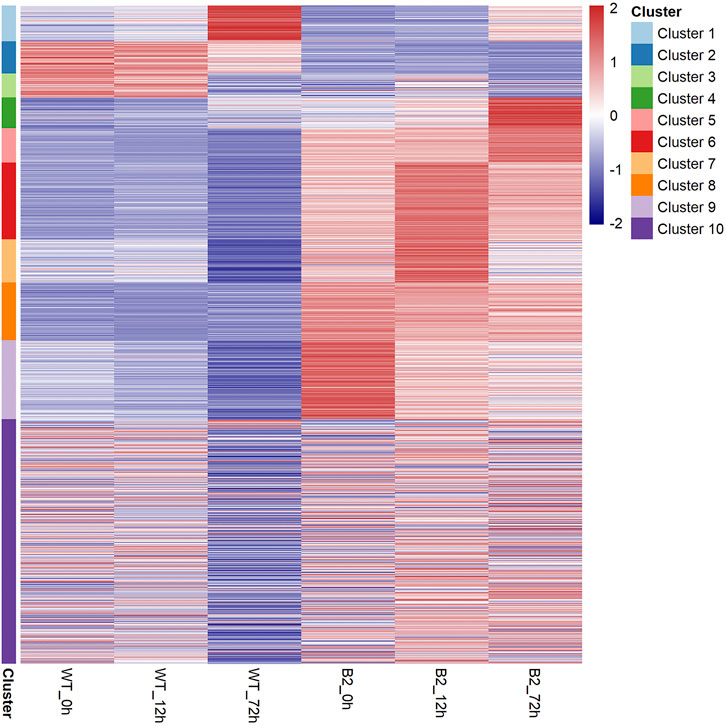
FIGURE 3. Heatmap of protein profile in WT and B2. All the proteins can be clustered as 10 groups based on their distribution similarity.
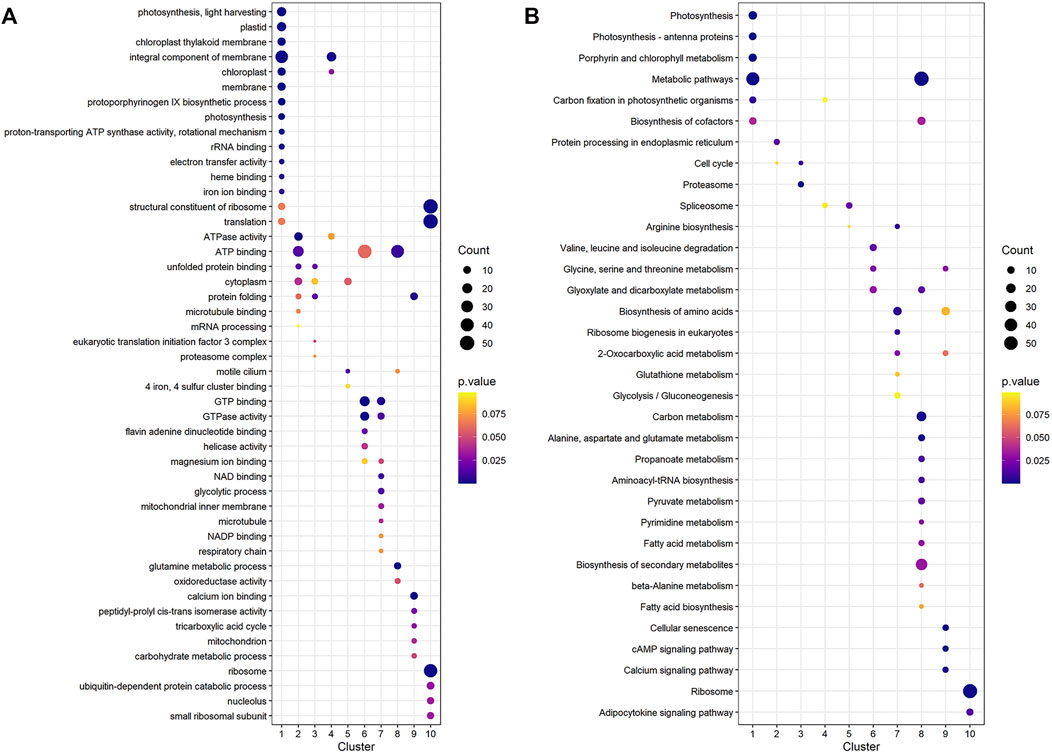
FIGURE 4. GO annotation and KEGG pathways profile of the differential protein clusters in WT and B2. (A) The GO annotation of the differential proteins in cluster. (B) KEGG pathways profile of the differential proteins in cluster. The axis of abscissa was the groups’ name and the ordinate represented the GO annotation or KEGG pathways. The size of bubbles was calculated by the number of matched proteins. p-value was shown on the left color bar.
The Differentially Expressed Proteins Among Groups
Differentially expressed proteins among samples were identified by t-test and filtered with 1) more than one unique peptide, 2) foldchange more than 1.5 or less than 0.67, and 3) p-value less than .05. The number of total-significant DEPs in WT and B2 was progressively higher with the time of light exposure, and it can be found that DEPs between 0 and 12 h for both WT and B2 were fewer than other groups, which agreed with the PCA result (Table 1). Those differential proteins were annotated to 26 orthologous COG groups (Supplementary Table S1). Thus, the groups that exhibited much more DEPs were further analyzed, including the GO annotation and KEGG pathways.
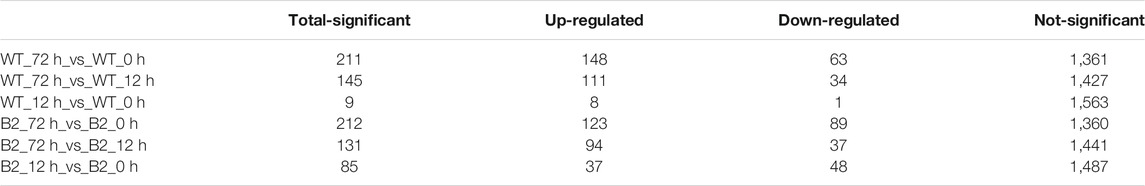
TABLE 1. Time course of differential expressed proteins in WT and B2.
The Up- and Down-Regulated GO Terms Responding to Light Treatments
The GO annotation of DEPs can be divided into three main parts in the proteome, in terms of biological process (BP), cellular component (CC), and molecular function (MF) (Figure 5). There was no DEP between 0 and 12 h for the WT, while lots of DEPs were enriched on the ontology of the BP, CC, and MF relative to photosynthesis, chloroplast, and membrane after light exposure for 72 h. Interestingly, the MF proteins of calcium ion binding were most significantly differentially expressed among 0, 12, and 72 h in B2, and the catalog of calcium ion binding also was the differential part compared to WT after light exposure for 12 h. Surprisingly, the white color phenotype B2 cells with no chloroplast development harbored a large number of proteins related to chloroplast and photosynthesis revealed in this study. When compared WT with B2 by inter-group at 72 h, only the photosynthesis of light-harvesting was a differential GO term, suggesting that 12 h was a critical time point for preparing a large amount of chlorophyll accumulation (Figure 5). Besides, the GO items of calcium ion binding were down-regulated within 0 vs. 12 h of B2, while the structural constituent of ribosome and translation were up-regulated (Table 2 and Figure 6). The GO annotation about the genes of photosynthesis, chloroplast, an integral component of membrane, proton-transporting ATP synthase activity was up-regulated in the sample of WT and B2 at the time point of 72 vs 0 h and 72 vs 12 h with higher GeneRatio (the percentage of total DEPs mapped with relevant genes in the given GO term) scores respectively, and those genes were also up-regulated in the compared samples between WT and B2 at the time point of 0, 12, 72 h, respectively (Figure 6).
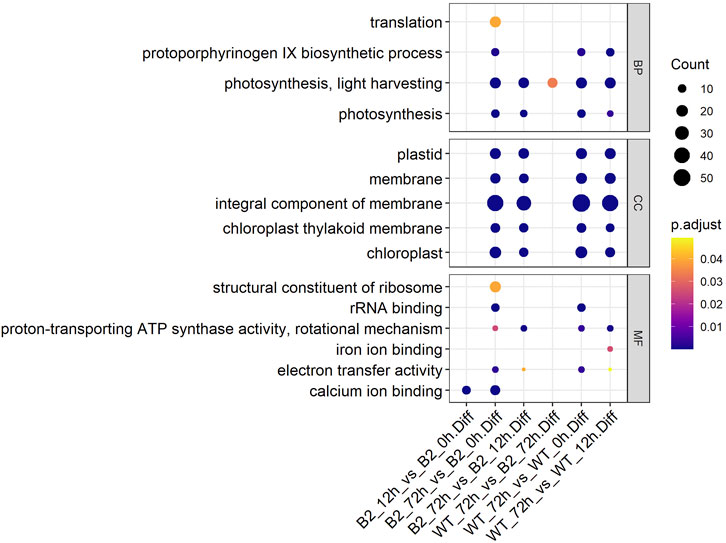
FIGURE 5. GO items in biological process (BP), cellular component (CC), and molecular function (MF) categories for the differential genes. The axis of abscissa was the groups’ name and the ordinate represented the GO annotation. The size of bubbles was calculated by the number of matched proteins. p-value was shown on the left color bar.
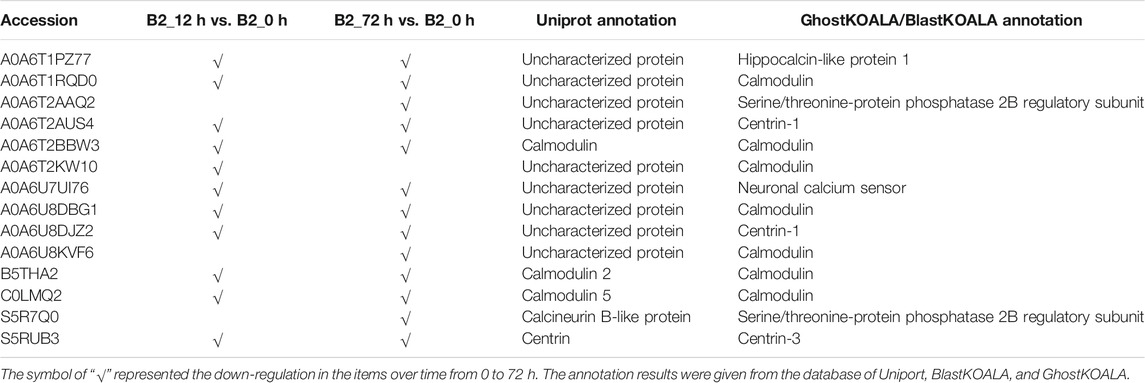
TABLE 2. The down-regulated proteins of calcium ion binding in B2.
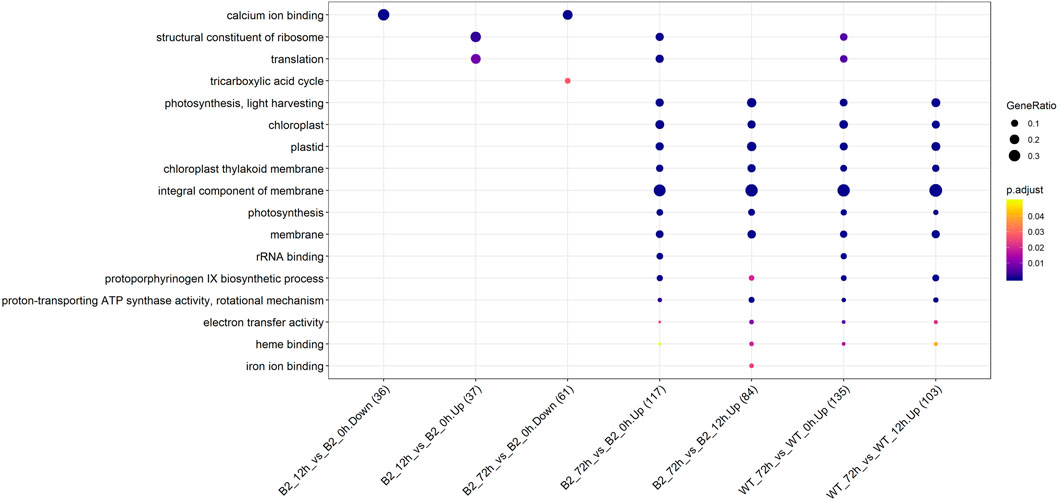
FIGURE 6. Up/down-regulated GO categories for WT and B2 during the chloroplast development. The number of matched proteins was in parentheses. The size of bubbles represented the GeneRatio of mapping GO. p-value was shown on the left color bar.
The up-regulated and down-regulated proteins revealed by KEGG responding to light treatments.
The KEGG enrichment was performed to elucidate the affected pathways from poorly-developed chloroplasts to well-developed chloroplasts in WT cells and un-explored pathways in B2. Large amounts of proteins would be expected in the contribution to the physiological development of E. gracilis chloroplast. In WT, the proteins for carbon fixation in photosynthetic organisms were up-regulated, indicating that photosynthesis was increased with the development of the chloroplast (Figure 7 and Table 3). In B2 cells, the proteins involved in lots of signaling pathways, such as calcium signaling pathway and cAMP signaling pathway, etc. that related to the tricarboxylic acid cycle (TCA cycle), cell cycle, and non-photosynthetic carbon fixation, were down-regulated at the time point of 72 vs. 0 h (Figure 7; Tables 2, 4). For photosynthesis, the key components in the pathway are the photosystem I, photosystem II, cytochrome b6/f complex, photosynthetic electron transport, and F-type ATPase (Figure 8). At the time point of WT 72 h vs. 0 h, the proteins associated with the genes of PsaA and PsaC involved in photosystem I were up-regulated, and there were many up-regulated proteins in the photosystem II, mapping with genes of psbA, psbD, psbB, psbE, psbF, and psbO. The proteins mapped with genes of cytochrome b6/f complex (petB and petA) and a couple of proteins expressed by the genes of F-type ATPase (β, α, and ɛ) also were up-regulated. Interestingly, the proteins of photosynthesis in B2 have virtually identical regulation patterns with the WT during light exposure. By comparing the WT and B2 group after 72 h of light exposure, most of the differentially expressed proteins were not enriched in the photosynthesis pathway, however, the related proteins associated with the genes of PsaC in photosystem I and ɛ F-type ATPase were up-regulated, while β F-type ATPase was down-regulated.
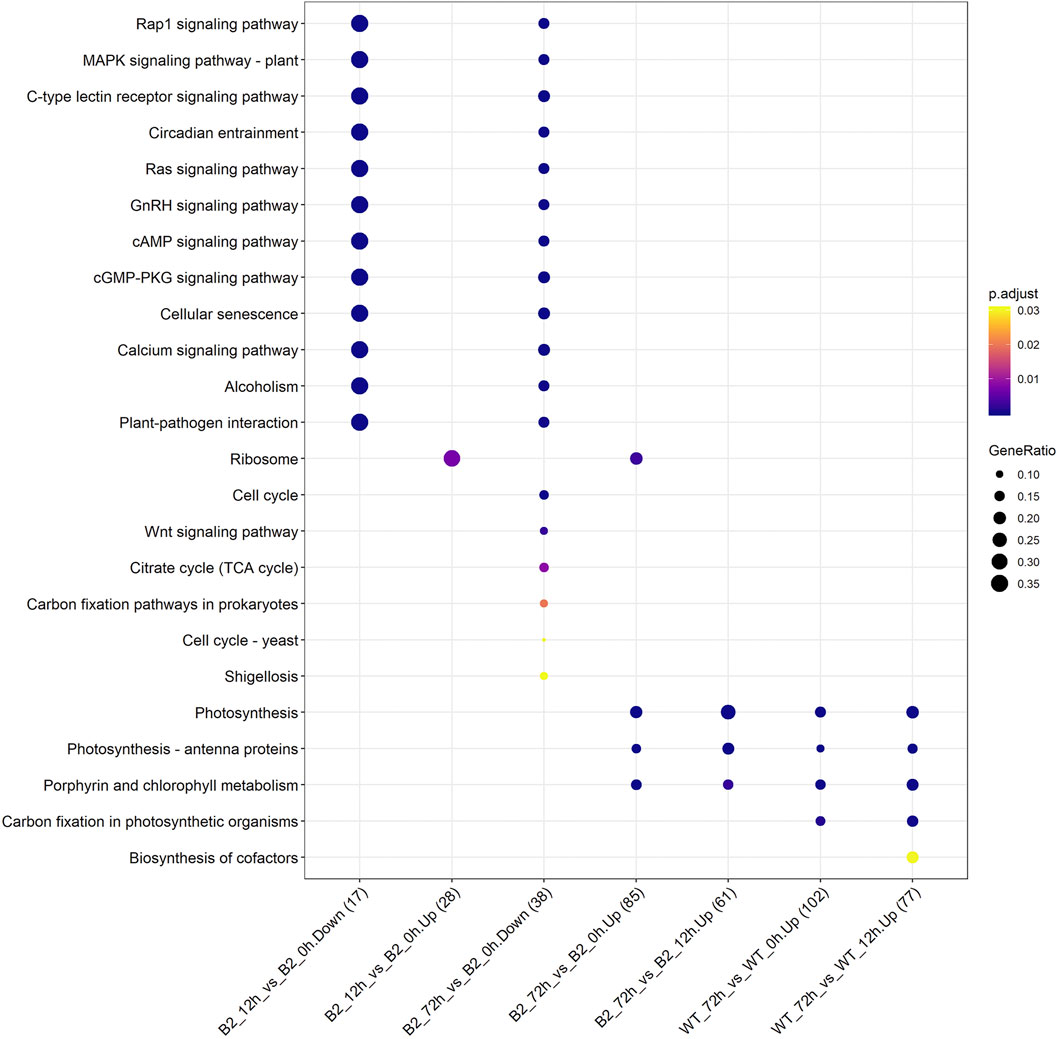
FIGURE 7. Up/down-regulated KEGG pathways for WT and B2 during chloroplast development. The number of matched proteins was in parentheses. The size of bubbles represented the GeneRatio of mapping KEGG pathways. p-value was shown on the left color bar.
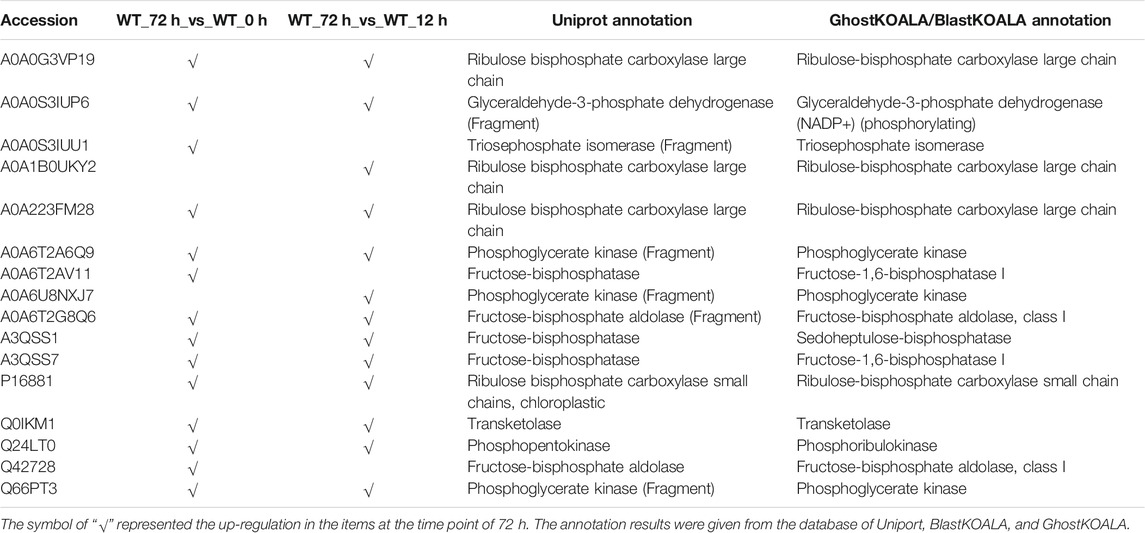
TABLE 3. The up-regulated proteins of carbon fixation in WT.
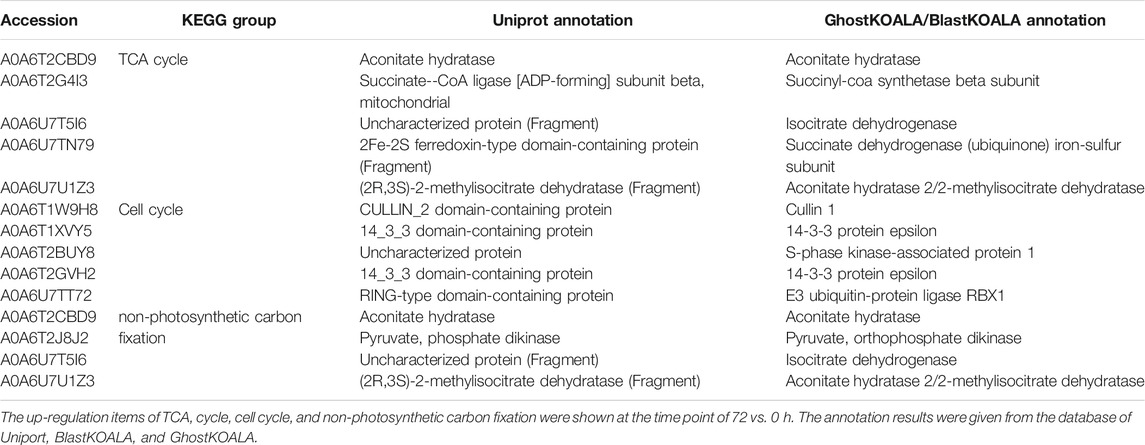
TABLE 4. The down-regulated proteins in B2 at the time point of 72 vs. 0 h.
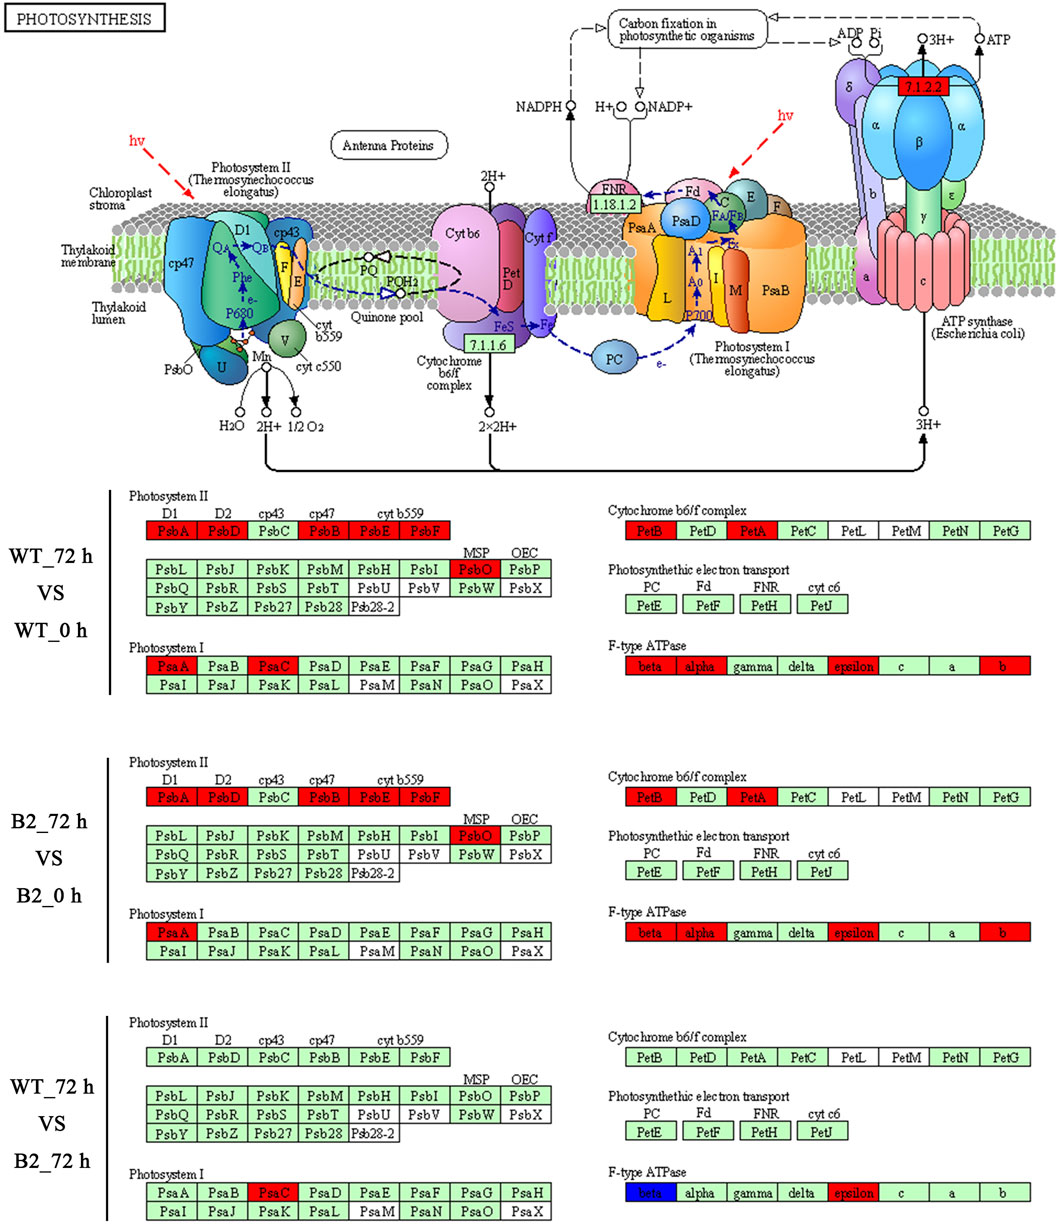
FIGURE 8. Comparison of WT and B2 in the photosynthesis KEGG pathway map after light exposure restoration. The map of the KEGG photosynthesis pathway is capable of the website on http://www.kegg.jp/pathway/map00195. The green boxes indicate the genes of encoded proteins. The red boxes indicate the genes of encoded proteins that are up-regulated, while the blue boxes are down-regulated.
Discussion
E. gracilis is one of the most widely studied model species for chloroplast development, due to the easy loss and secondary endosymbiosis of chloroplasts by the ancestor of Euglena and green algae (Zakryś et al., 2017). The process of the acquisition of foreign chloroplast for E. gracilis integrates the new organelle into a cell, as well as the new genes into nuclear genomes, which were gifted with new coding proteins and metabolic pathways. In recent decades, much research has been conducted related to the E. gracilis chloroplast. For example, in 1993 the chloroplast genome of E. gracilis was entirely sequenced and the size of the plastid genome was 143 kbp and encoded 97 proteins and genes (Hallick et al., 1993). Novák Vanclová et al. (2020) revealed metabolic quirks and a colorful history of the secondary plastid of E. gracilis by proteome. However, the chloroplast is dispensable for E. gracilis and is easily abandoned under various abiotic conditions such as antibiotics, heat, ultraviolet light, and so on (Gibor and Granick, 1962). The green E. gracilis cells, that grow in the dark for an estimated two weeks, can be turned temporarily colorless (Qin et al., 2020). It seems that the existence of chloroplasts in E. gracilis cells are wasteful in the absence of light and light is the crucial regulating factor for their chloroplast development. The development of chloroplast in E. gracilis was regulated at the translational level rather than the transcriptional level (Schwartzbach, 2017). Thus, the present study aimed to explore the relationship between E. gracilis chloroplast development and light treatment from the dark by proteome, using both dark-adapted WT and B2 cells.
WT E. gracilis cells respond to light and exhibit light regulation with a complex and complicated process (Schwartzbach and Shigeoka, 2017). In general, dark-adapted WT chloroplasts exist as an estimated ten small proplastids, lacking internal membranes and containing some prolamellar bodies, and can be recovered after light exposure (Ahn et al., 2018). The time point of 72 h is enough for proplastids to turn into mature functional chloroplasts, changing from white cells to green cells (Figure 1). This can also be proven by the two-dimensional gel electrophoresis for the detection of chloroplast pigment proteins by time serial in E. gracilis (Monroy et al., 1987). It is obvious that the proteins related to photosynthesis and light-harvesting protein groups finally can be up-regulated in WT after light exposure (Figure 4). Though many investigations were carried out in WT to study the chloroplast development under light exposure, there is no report about the bleached mutants in this case. The most well-known example of colorless euglenid is E. longa, a species very close relative to E. gracilis. It lost most of the photosynthetic genes with dormant plastids (Gockel and Hachtel, 2000). B2 still has residual chloroplasts and absences many genes in plastid genomes but not all of them (Qin et al., 2020). Those residual plastids can be observed under transmission electron microscopy (Kivic and Vesk, 1974). As the first study, we found that B2 also had a similar response to light, but the level of the differential expression was relatively lower than WT (Figure 5). This can explain why B2 still had the light-regulated properties in this study.
The light-induced chloroplast development was time-dependent. In WT, there existed a 12 h lag period for the activation of the photosynthesis system resulting in no significant difference between the WT 0 h and WT 12 h. In previous studies, the chlorophyll accumulation exhibited a 12 h lag period by photo induction of LHCP (light harvesting chlorophyll a/b binding protein of photosystem) II accumulation (Schwartzbach et al., 1976; Bouet et al., 1986; Weiss et al., 1988). We found that the number of DEPs was increased and the changed proteins are mainly related to cell metabolisms, such as ATP binding, GTPase activity, tricarboxylic acid cycle, pyruvate metabolism, carbon metabolism, etc. after a time point of 12 h (Figures 3, 4). Perhaps, since the enzyme activity of the photosynthetic system was disrupted by the functional insufficiency of the residual chloroplast, the B2 cells can act with light exposure but are not prepared for chlorophyll accumulation. In addition, the down-regulation of some proteins (ATP binding, unfolded protein binding, and protein folding) or other unknown functional proteins involved in chlorophyll accumulation may lead to different responses for light exposure over time in B2 (cluster 2 and 3 in Figure 4A). Thus, a significantly lower or different light-responsive proteome could be expected in B2 compared to WT.
However, the loss of many chloroplast genes in B2 (Qin et al., 2020) seemed to not affect the integrity of the encoded proteins in the photosynthesis systems. The results of the KEGG photosynthesis pathway for photosynthetic electron transport (including PSI, PSII, cytochrome b6f (Cytb6f), and ATP synthase), showed the proteins relevant to their expressed genes and pathways (Figures 6, 7; Table 3). The CO2 was fixated in PS I by providing the negative redox, while molecular oxygen and H+ were produced in PSII by oxidizing water. The Cytb6f complex afforded a pathway for plastoquinone and plastocyanin, which allowed the electrons to be a shuttle between the PSI and PSII. At the same time, ATP synthase was driven by the proton gradient (Bohne et al., 2016). All components of the functional genome of chloroplast guarantee the photosynthetic system’s proper function. By comparing WT to B2 at 72 h, it was common that the proteins associated with the gene of PsaC in PSI was up-regulated (Figure 8). Although the gene of PsaC responded positively with light re-greening both in WT and B2, the synthesis rate of relevant protein was high to WT rather than B2. The cells of WT underwent much more cell division rapidly than B2 in the same growth condition, due to the incomplete chloroplast genome of B2 (Qin et al., 2020). The F-type ATPase was assembled by five globular proteins, including α, β, γ, δ and ɛ as a whole (Yagi et al., 2007). It was difficult to clearly explain the relationship between one part of the globular protein and its physiological role. In Qin et al. (2020) study, 50 chloroplast-relevant genes were examined for B2 (OflB2 in the reference article) by PCR, and 37 involved genes were lost, but all of them were detected in WT. This indicated that B2 only retained parts of the chloroplast genome. Indeed, the results of chloroplast genes’ annotation by proteome showed that all the proteins related to photosynthesis identified in WT were also detected in B2, but those proteins in WT were significantly up-regulated compared to B2 (Figure 6). It was implied that the functional genes of chloroplast in B2 were still maintained and properly functioned at the protein level. However, the relevant genome of chloroplast for B2 was lost randomly (Qin et al., 2020). That was potentially attributed to the different detection methods between the genome level and proteome level. Further studies will be required to elucidate this phenomenon.
The major metabolic activities related to chloroplast development in E. gracilis were those required for the use of carbon and energy to ensure proliferation. In previous studies, E. gracilis has been perceived as a more diverse metabolic pathway for using carbon. For example, the C2 compounds of the glyoxylate pathway have three fates, including the regulation of the TCA cycle and the formation of serine via glycine and formate (Hasan et al., 2019), and the C5 pathway of aminolevulinate synthesis and amino acid metabolism also have been reported in recent years (Vanclová et al., 2019), etc. Euglena can utilize those organic compounds to synthesize and store carbohydrate paramylum in the dark, whereas most of them would be degraded induced by light. The degradation of paramylum will produce inhibitors and uncouples that block the chloroplast development of E. gracilis (Fong and Schiff, 1977; Klein et al., 1972). As we know, the chloroplast genomes encode many important proteins of photosynthesis needed for CO2 fixation. All of these proteins or pathways were light-regulated and involved in the metabolic activities to the positive feedback for the photosynthesis abilities of E. gracilis. Thus, with the increased degradation effect of respiration inhibitors, the capacity of CO2 fixation was enhanced by more chlorophyll synthesis in the light. Besides, the proteins or pathways involved in calcium ion binding, cell cycle, and non-photosynthetic carbon fixation were down-regulated in B2 (Tables 2, 4). That might be the reason for the incomplete development of chloroplast in B2. By comparing WT and B2, the speed of cell division, the biomass, and the cell motility in WT were more effective than that of B2 during the light exposure (Qin et al., 2020). Calcium-binding protein regulates plenty of different targeting proteins and plays an important role in the plants’ signaling pathway (Pirayesh et al., 2021). These proteins can regulate the flagellar moving pattern and motility through the calcium ion signaling pathway (Watanabe and Iseki, 2005). The down-regulation of calcium ion proteins may result in insensitive photo-movement responses for B2, which showed the difference to WT as observed in the study (Figure 5). Chloroplast division occurs simultaneously with nuclear division and requires high levels of pigment and protein synthesis to maintain the photosynthetic capacity of newly divided chloroplasts. The down-regulation of cell cycle proteins or pathways could be the photo-induced cell cycle arrest. Cell cycle progressions are required for photo-induced commitments (Hagiwara et al., 2001). The non-photosynthetic carbon fixation is putative in the study. Many proteins assigned to aconitate hydratase, pyruvate, phosphate dikinase, and isocitrate dehydrogenase were down-regulated. Those proteins are involved in carbon metabolism. The most executive function of chloroplast is carbon fixation and offers triose phosphates to the biosynthesis of amino acids, carbohydrates, and fatty acids (Kamikawa et al., 2017; Hasan et al., 2019). Further studies will be required to verify the complicated mechanism of non-photosynthetic carbon fixation in Euglena.
Data Availability Statement
The datasets presented in this study can be found in online repositories. The mass spectrometry proteomics data have been deposited to the ProteomeXchange Consortium via the PRIDE partner repository with the dataset identifier PXD030414.
Author Contributions
ZFC and JW conceived and designed the experiments. ZFC conducted the experiments. JH and JZ helped to perform the experiments. ZXC processed the data; ZFC wrote the manuscript. AL, JW, QL, and HZ offered help to this project and/or revised the manuscript. All authors read and approved the final manuscript.
Conflicts of Interest
The authors declare that the research was conducted in the absence of any commercial or financial relationships that could be construed as a potential conflict of interest.
Publisher’s Note
All claims expressed in this article are solely those of the authors and do not necessarily represent those of their affiliated organizations, or those of the publisher, the editors and the reviewers. Any product that may be evaluated in this article, or claim that may be made by its manufacturer, is not guaranteed or endorsed by the publisher.
Acknowledgments
We thank the Instrument Analysis Center of Shenzhen University for assistance with the inverted microscope analysis. This work was partially supported by the National Key R and D Program of China (2018YFA0902500; 2020YFA0908703; 2021YFA0910800) and the National Natural Science Foundation of China (41876188).
Supplementary Material
The Supplementary Material for this article can be found online at: https://www.frontiersin.org/articles/10.3389/fbioe.2022.843414/full#supplementary-material
References
Ahn, S. Y., Basra, I., Liu, K., and Sahota, P. (2018). The Effect of Darkness on Chloroplast Length of Euglena Gracilis over Time. The Expedition 8, 1–19.
Bohne, A.-V., Schwenkert, S., Grimm, B., and Nickelsen, J. (2016). Roles of Tetratricopeptide Repeat Proteins in Biogenesis of the Photosynthetic Apparatus. Int. Rev. Cell Mol. Biol. 324, 187–227. doi:10.1016/bs.ircmb.2016.01.005
Bouet, C., Schantz, R., Dubertret, G., Pineau, B., and Ledoigt, G. (1986). Translational Regulation of Protein Synthesis during Light-Induced Chloroplast Development in Euglena. Planta 167, 511–520. doi:10.1007/bf00391227
Cantalapiedra, C. P., Hernández-Plaza, A., Letunic, I., Bork, P., and Huerta-Cepas, J. (2021). eggNOG-Mapper V2: Functional Annotation, Orthology Assignments, and Domain Prediction at the Metagenomic Scale. Mol. Biol. Evol. 38, 5825–5829. doi:10.1093/molbev/msab293
Coman, C., Solari, F. A., Hentschel, A., Sickmann, A., Zahedi, R. P., and Ahrends, R. (2016). Simultaneous Metabolite, Protein, Lipid Extraction (SIMPLEX): A Combinatorial Multimolecular Omics Approach for Systems Biology. Mol. Cell Proteomics 15, 1435–1466. doi:10.1074/mcp.m115.053702
Conesa, A., and Nueda, M. (2018). MaSigPro: Significant Gene Expression Profile Differences in Time Course Gene Expression Data. R package version 1.54.0. Available at: http://bioinfo.cipf.es/.
Epstein, H. T., and Schiff, J. A. (1961). Studies of Chloroplast Development in Euglena. 4. Electron and Fluorescence Microscopy of the Proplastid and its Development into a Mature Chloroplast. J. Protozool. 8, 427–432. doi:10.1111/j.1550-7408.1961.tb01238.x
Fong, F., and Schiff, J. (1977). Mitochondrial Respiration and Chloroplast Development in Euglena-Gracilis Var Bacillaris. Plant Physiol. 59, 92.
Gibor, A., and Granick, S. (1962). The Plastid System of Normal and BleachedEuglena Gracilis*. J. Protozool. 9, 327–334. doi:10.1111/j.1550-7408.1962.tb02628.x
Gissibl, A., Sun, A., Care, A., Nevalainen, H., and Sunna, A. (2019). Bioproducts from Euglena Gracilis: Synthesis and Applications. Front. Bioeng. Biotechnol. 7, 108. doi:10.3389/fbioe.2019.00108
Gockel, G., and Hachtel, W. (2000). Complete Gene Map of the Plastid Genome of the Nonphotosynthetic Euglenoid Flagellate Astasia Longa. Protist 151, 347–351. doi:10.1078/s1434-4610(04)70033-4
Hagiwara, S.-y., Takahashi, M., Yamagishi, A., Zhang, Y., and Goto, K. (2001). Novel Findings Regarding Photoinduced Commitments of G1-, S- and G2-phase Cells to Cell-Cycle Transitions in Darkness and Dark-Induced G1-, S- and G2-phase Arrests in Euglena. Photochem. Photobiol. 74, 726–733. doi:10.1562/0031-8655(2001)074<0726:nfrpco>2.0.co;2
Hallick, R. B., Hong, L., Drager, R. G., Favreau, M. R., Monfort, A., Orsat, B., et al. (1993). Complete Sequence of Euglena gracilis chloroplast DNA. Nucl. Acids Res. 21, 3537–3544. doi:10.1093/nar/21.15.3537
Hasan, M. T., Sun, A., Khatiwada, B., McQuade, L., Mirzaei, M., Te'o, J., et al. (2019). Comparative Proteomics Investigation of central Carbon Metabolism in Euglena Gracilis Grown under Predominantly Phototrophic, Mixotrophic and Heterotrophic Cultivations. Algal Res. 43, 101638. doi:10.1016/j.algal.2019.101638
Heizmann, P., Salvador, G. F., and Nigon, V. (1976). Occurrence of Plastidial rRNAs and Plastidial Structures in Bleached Mutants of Euglena Gracilis. Exp. Cell Res. 99, 253–260. doi:10.1016/0014-4827(76)90581-4
Huerta-Cepas, J., Szklarczyk, D., Heller, D., Hernández-Plaza, A., Forslund, S. K., Cook, H., et al. (2019). eggNOG 5.0: a Hierarchical, Functionally and Phylogenetically Annotated Orthology Resource Based on 5090 Organisms and 2502 Viruses. Nucleic Acids Res. 47, D309–D314. doi:10.1093/nar/gky1085
Kamikawa, R., Moog, D., Zauner, S., Tanifuji, G., Ishida, K.-I., Miyashita, H., et al. (2017). A Non-photosynthetic Diatom Reveals Early Steps of Reductive Evolution in Plastids. Mol. Biol. Evol. 34, 2355–2366. doi:10.1093/molbev/msx172
Kanehisa, M., Sato, Y., and Morishima, K. (2016). BlastKOALA and GhostKOALA: KEGG Tools for Functional Characterization of Genome and Metagenome Sequences. J. Mol. Biol. 428, 726–731. doi:10.1016/j.jmb.2015.11.006
Kivic, P. A., and Vesk, M. (1974). An Electron Microscope Search for Plastids in Bleached Euglena Gracilis and in Astasia Longa. Can. J. Bot. 52, 695–699. doi:10.1139/b74-089
Klein, S., Schiff, J. A., and Holowinsky, A. W. (1972). Events Surrounding the Early Development of Euglena Chloroplasts. Developmental Biol. 28, 253–273. doi:10.1016/0012-1606(72)90142-x
Kottuparambil, S., Thankamony, R. L., and Agusti, S. (2019). Euglena as a Potential Natural Source of Value-Added Metabolites. A Review. Algal Res. 37, 154–159. doi:10.1016/j.algal.2018.11.024
Koziol, A. G., and Durnford, D. G. (2008). Euglena Light-Harvesting Complexes Are Encoded by Multifarious Polyprotein mRNAs that Evolve in Concert. Mol. Biol. Evol. 25, 92–100. doi:10.1093/molbev/msm232
Markunas, C. M., and Triemer, R. E. (2016). Evolutionary History of the Enzymes Involved in the Calvin-Benson Cycle in Euglenids. J. Eukaryot. Microbiol. 63, 326–339. doi:10.1111/jeu.12282
Maruyama, S., Suzaki, T., Weber, A. P., Archibald, J. M., and Nozaki, H. (2011). Eukaryote-to-eukaryote Gene Transfer Gives Rise to Genome Mosaicism in Euglenids. BMC Evol. Biol. 11, 105–111. doi:10.1186/1471-2148-11-105
Mokrosnop, V. M. (2018). Production of Storage Polysaccharide Paramylon in Microalga Euglena Gracilis Klebs (Euglena, Euglenophyceae). Inter. J. Algae 20, 153–166. doi:10.1615/interjalgae.v20.i2.40
Monroy, A. F., McCarthy, S. A., and Schwartzbach, S. D. (1987). Evidence for Translational Regulation of Chloroplast and Mitochondrial Biogenesis in Euglena. Plant Sci. 51, 61–76. doi:10.1016/0168-9452(87)90221-4
Novák Vanclová, A. M. G., Zoltner, M., Kelly, S., Soukal, P., Záhonová, K., Füssy, Z., et al. (2020). Metabolic Quirks and the Colourful History of the Euglena Gracilis Secondary Plastid. New Phytol. 225, 1578–1592. doi:10.1111/nph.16237
Oliveros, J. (2016). Venny. An Interactive Tool for Comparing Lists with Venn’s Diagrams. 2007–2015. Available at: https://bioinfogp.cnb.csic.es/tools/venny/index.html.
Osafune, T., and Schiff, J. A. (1983). W10BSmL, a Mutant of Euglena Gracilis Var. Bacillaris Lacking Plastids. Exp. Cell Res. 148, 530–535. doi:10.1016/0014-4827(83)90176-3
Pirayesh, N., Giridhar, M., Ben Khedher, A., Vothknecht, U. C., and Chigri, F. (2021). Organellar Calcium Signaling in Plants: An Update. Biochim. Biophys. Acta Mol. Cell Res 1868, 118948. doi:10.1016/j.bbamcr.2021.118948
Qin, H., Guo, Q., Liu, C., Li, F., Zhang, H., Chu, Z., et al. (2020). Occurrence and Light Response of Residual Plastid Genes in a Euglena Gracilis Bleached Mutant Strain OflB2. J. Ocean. Limnol. 38, 1858–1866. doi:10.1007/s00343-019-9159-9
Schwartzbach, S. D. (2017). “Photo and Nutritional Regulation of Euglena Organelle Development,” in Euglena: Biochemistry, Cell and Molecular Biology. Editors S. D. Schwartzbach, and S. Shigeoka (Switzerland: Springer), 159–182. doi:10.1007/978-3-319-54910-1_9
Schwartzbach, S. D., Schiff, J. A., and Klein, S. (1976). Biosynthetic Events Required for Lag Elimination in Chlorophyll Synthesis in Euglena. Planta 131, 1–9. doi:10.1007/bf00387337
Schwartzbach, S. D., and Shigeoka, S. (2017). Euglena: Biochemistry, Cell and Molecular Biology. Switzerland: Springer.
Shibata, K., Benson, A. A., and Calvin, M. (1954). The Absorption Spectra of Suspensions of Living Micro-organisms. Biochim. Biophys. Acta 15, 461–470. doi:10.1016/0006-3002(54)90002-5
Stern, A. I., Schiff, J. A., and Epstein, H. T. (1964). Studies of Chloroplast Development in Euglena. V. Pigment Biosynthesis, Photosynthetic Oxygen Evolution and Carbon Dioxide Fixation during Chloroplast Development. Plant Physiol. 39, 220–226. doi:10.1104/pp.39.2.220
Tamaki, S., Tanno, Y., Kato, S., Ozasa, K., Wakazaki, M., Sato, M., et al. (2020). Carotenoid Accumulation in the Eyespot Apparatus Required for Phototaxis Is Independent of Chloroplast Development in Euglena Gracilis. Plant Sci. 298, 110564. doi:10.1016/j.plantsci.2020.110564
Tomečková, L., Tomčala, A., Oborník, M., and Hampl, V. (2020). The Lipid Composition of Euglena Gracilis Middle Plastid Membrane Resembles that of Primary Plastid Envelopes. Plant Physiol. 184, 2052–2063.
Torihara, K., and Kishimoto, N. (2015). Evaluation of Growth Characteristics of Euglena Gracilis for Microalgal Biomass Production Using Wastewater. J. Wat. Envir. Tech. 13, 195–205. doi:10.2965/jwet.2015.195
Vanclová, A. M. N., Zoltner, M., Kelly, S., Soukal, P., Záhonová, K., Füssy, Z., et al. (2019). Proteome of the Secondary Plastid of Euglena Gracilis Reveals Metabolic Quirks and Colourful History. bioRxiv, 573709.
Watanabe, M., and Iseki, M. (2005). “Discovery and Characterization of Photoactivated Adenylyl Cyclase (PAC), a Novel Blue-Light Receptor Flavoprotein, from Euglena Gracilis,” in Handbook of Photosensory Receptors (Hoboken, NJ: Wiley Online Library), 447–460. doi:10.1002/352760510x.ch22
Weiss, C., Houlné, G., Schantz, M.-L., and Schantz, R. (1988). Photoregulation of the Synthesis of Chloroplast Membrane Proteins in Euglena Gracilis. J. Plant Physiol. 133, 521–528. doi:10.1016/s0176-1617(88)80001-4
Yagi, H., Kajiwara, N., Tanaka, H., Tsukihara, T., Kato-Yamada, Y., Yoshida, M., et al. (2007). Structures of the Thermophilic F1-ATPase Subunit Suggesting ATP-Regulated Arm Motion of its C-Terminal Domain in F1. Proc. Natl. Acad. Sci. 104, 11233–11238. doi:10.1073/pnas.0701045104
Yi, L. S. H., Gilbert, C. W., and Buetow, D. E. (1985). Temporal Appearance of Chlorophyll-Protein Complexes and the N,N -Dicyclohexylcarbodiimide-Binding Coupling Factor0?Subunit III in Forming Thylakoid Membranes of Euglena Gracilis. J. Plant Physiol. 118, 7–21. doi:10.1016/s0176-1617(85)80160-7
Yu, G., Wang, L.-G., Han, Y., and He, Q.-Y. (2012). ClusterProfiler: an R Package for Comparing Biological Themes Among Gene Clusters. OMICS: A J. Integr. Biol. 16, 284–287. doi:10.1089/omi.2011.0118
Keywords: Euglena gracilis, proteome, chloroplast development, bleached strain, light exposure restoration
Citation: Chen Z, Chen Z, Zhu J, He J, Liu Q, Zhu H, Lei A and Wang J (2022) Proteomic Responses of Dark-Adapted Euglena gracilis and Bleached Mutant Against Light Stimuli. Front. Bioeng. Biotechnol. 10:843414. doi: 10.3389/fbioe.2022.843414
Received: 25 December 2021; Accepted: 25 January 2022;
Published: 03 March 2022.
Edited by:
Fantao Kong, Dalian University of Technology, ChinaReviewed by:
Fengzheng Gao, Wageningen University and Research, NetherlandsHongli Cui, Shanxi Agricultural University, China
Copyright © 2022 Chen, Chen, Zhu, He, Liu, Zhu, Lei and Wang. This is an open-access article distributed under the terms of the Creative Commons Attribution License (CC BY). The use, distribution or reproduction in other forums is permitted, provided the original author(s) and the copyright owner(s) are credited and that the original publication in this journal is cited, in accordance with accepted academic practice. No use, distribution or reproduction is permitted which does not comply with these terms.
*Correspondence: Jiangxin Wang, jxwang@szu.edu.cn