Preliminary Study for Inspecting Moisture Content, Dry Matter Content, and Firmness Parameters of Two Date Cultivars Using an NIR Hyperspectral Imaging System
 Ayman Ibrahim1*
  Abdulrahman Alghannam2 Ayman Eissa3 Ferenc Firtha4
  Timea Kaszab4
  Zoltan Kovacs4 Lajos Helyes5
- 1Agricultural Engineering Research Institute (AEnRI), Agricultural Research Center (ARC), Giza, Egypt
- 2Department of Agricultural Systems Engineering, College of Agricultural and Food Sciences, King Faisal University, Al-Hassa, Saudi Arabia
- 3Department of Agricultural Engineering, Faculty of Agriculture, Menoufia University, Shebin El Koum, Egypt
- 4Department of Measurements and Process Control, Institute of Food Science and Technology, Hungarian University of Agriculture and Life Sciences, Budapest, Hungary
- 5Horticultural institute, Hungarian University of Agriculture and Life Sciences, Gödöllő, Hungary
The assessment and assurance of the quality attributes of dates is a key factor in increasing the competitiveness and consumer acceptance of this fruit. The increasing demand for date fruits requires a rapid and automated method for monitoring and analyzing the quality attributes of date fruits to replace the conventional methods used by inspection which limits the production and involves human errors. Moisture content (MC), dry matter content (DMC), and firmness (F) are three important quality attributes for two date cultivars (Khalas and Sukkari) that have been inspected using the hyperspectral imaging (HSI) technique based on the reflectance mode. Images of intact date fruits at the maturity stage Tamr were obtained within the wavelength range of 950–1750 nm. Monitoring and assessment of MC, DMC, and F [first maximum rupture force (MF, N)] were performed using a partial least squares regression model. Accurate prediction models were attained. The results highlight that the coefficients of determination (R2Prediction) are estimated to be 0.91 and 0.89 for MC, DMC, and F (N) with the lowest values of the standard error of prediction (SEP) equal to 0.82, 0.81 (%), and 4.12 (N), respectively, and the residual predictive deviation (RPD) values were 3.65, 3.69, and 3.42 for MC, DMC, and F (N), respectively. The results obtained from this preliminary study indicate the great potential of applying HSI for the assessment of physical, chemical, and sensory quality attributes of date fruits overall in the five maturity stages.
Introduction
In general, fruit quality is considered a basic requirement for consumers seeking good appearance, acceptable firmness, a nutritional value, and fruits freedom from external and internal defects and injuries. The date fruit is one of the most important fruits with a high nutritional value, which occupies a prominent position on the world fruit map. According to FAO (2019), Egypt, the Kingdom of Saudi Arabia, and Iran are the leading date-producing and exporting countries. Globally, date palm production covers an area of nearly 1.09 million ha with a total production of about 8.53 million tons. However, the world date production was valued at about US$ 8.4 billion, with global trade amounting to about US$ 1.2 billion, providing a major source of export revenues as well as livelihoods and income for millions of rural smallholders FAO (2018). The ripening of date fruits is classified into five maturity stages (Hababouk, Kimri, Khalal, Rutab, and Tamr). However, the quality inspection tasks during the harvest and post-harvest operations are based on physical properties such as color, moisture content, and firmness Kader and Awad (2009); Gross et al. (2016). The ripening of dates in all maturity stages relies on color as one of the most important quality attributes of dates, in addition to the levels of moisture and sugar content Farahnaky and Afshari-Jouybari (2010). In this regard, Singh et al. (2012) and Rahman and Al-Farsi (2005) cited that date fruits are consumed as fresh fruits at the Khalal and Rutab maturity stages, while it is consumed mainly in the dry form in the Tamr maturity stage when dates are firm, have a lower moisture content, and are sweeter. Furthermore, Singh et al. (2013), classified dates available on the market into three different categories: hardresilient, soft-springy, and firm-adhesive. These categories are based on physicochemical properties determined using instrumented texture profile analysis (TPA) testing. Ghnimi et al. (2017) announced that date fruits at full maturity (Tamr stage) are mainly composed of sugars (60–80%), moisture (10–30%), dietary fiber (5–12%), phenolic compounds (up to 4%), and other minor elementals based on a fresh weight basis. The textural properties of the most popular eight Saudi date cultivars at the Tamr maturity stage were measured by Alhamdan et al. (2016). It was found that the hardness values were 65.60, 186.59, 38.04, 68.72, 140.31, 394.65, 55.97, and 79.45 N in light of differences in the moisture content values of 6.92, 11.24, 8.96, 7.75, 12.56, 7.93, 11.71, and 11.32% for Barhi, Khudari, Khlas, Serrie, Sukkari, Suffri, Saqie, and NubotSaif, respectively. Also, Alhamdan et al. (2015) mentioned that the Barhi date cultivar was firm, with a high average hardness value attribute of 119.48 N.
The problem addressed by such a manuscript is concentrated around the conventional methods that are used to inspect the quality of the date fruits and their inability to meet quality requirements. Ordinarily, the traditional methods of quality checking for the date fruits are done manually, mechanically, or automatically based on their external quality attributes such as size, color, and detection of external blemishes. Contrarily, the inspection of internal quality attributes such as total solids, total soluble solid content, acidity, antioxidants, proteins, and other chemical parameters involves using an array of laboratory instruments based on destructive methods, with high accuracy and highly qualified technicians. Despite these requirements of accuracy, it became clear that the traditional methods of quality and safety inspection usually involves a visual inspection as well as, mechanical and chemical tests. This approach results in many disadvantages, such as being slow, inaccurate, suffering from a scarcity of well-trained and experienced labor, weariness, and the tests are destructive, expensive, and provide inconsistent quality. This description of traditional destructive methods for the quality and safety assessment was confirmed by Pullanagari and Li (2021); Caporaso et al. (2018); Escribano et al. (2017); Syahrir et al. (2009); Zheng et al. (2006). All these disadvantages of the conventional methods have a negative impact on the export market and on competitiveness in addition to being unable to meet the consumer expectations. There is also a real and urgent desire to obtain precise and fast, nondestructive, and cost-effective methods to meet increasing year-round demand in providing markets with fresh high-quality fruits.
In this regard, ElMasry et al. (2007); Lu and Ariana (2002) pointed out that the huge advancements in the digital technology has had a substantial positive impact on the quality of agricultural products as it proved its ability to sort fruits and vegetables based on physical, chemical, and sensory characteristics. This can guarantee various quality levels and thus helping to gain consumer confidence and satisfaction and enhances competitiveness. In recent years, many automatic vision systems have spread globally for sorting and grading fruits based on the visible light band, which characterizes fruits according to external quality attributes like color, size, and freeness of external defects. However, the visible light band cannot be used to inspect internal quality parameters. The priority in the fruit quality field is always focused on enhancing the quality of the final product through conducting a precise quality inspection to extract standard and homogeneous quality attributes. One of the most important of these quality attributes that have recently gained interest is the dry matter content (DMC) of the fruit. This is defined as the ratio of dry/fresh weight of the fruit or the sum of soluble (sugar) and insoluble (starch) carbohydrates, proteins, minerals, cell walls, organic acids, fibers, etc., which accumulate in the fruit during maturity development [Suni et al. (2000)]. DMC, moisture content, total soluble solid content (TSS), firmness, and acidity are even more important internal quality attributes and yet they cannot be determined by vision systems based on the visible light band. Therefore, near-infrared spectroscopy (NIRS) is widely used for nondestructive internal quality attribute assessment like soluble solids, dry matter, acidity, total soluble solids (TSSs), and firmness of various fruits such as cherries, grapes, lime, star fruits, tomatoes, dates, mangoes, and apples [Lu (2001); Escribano et al. (2017); Fairuz Omar, (2013); Huang et al. (2018); Kim et al. (2013); Tavakolian et al. (2013); Cortés et al. (2016); Jha et al. (2014); Nagle et al. (2010); Jha and Garg, (2010); Yande et al. (2008); Alhamdan and Atia (2017)]. However, some studies have indicated that the NIR technique has some flaws due to nonlinearity between the spectral signals and the value of each quality attribute. At the same time, NIRS is unable to measure and capture the internal constituent gradients inside the fruit. This leads to inconsistency and conflict between the predicted and measured quality attributes. Furthermore, the NIRS estimates are unable to determine the information about the spatial distribution of quality parameters which are necessary for a more accurate quality analysis [Ariana et al. (2006); Gowen et al. (2007); ElMasry et al. (2012); Chandrasekaran et al. (2019)].
Therefore, there is a focus on using a hyperspectral imaging (HSI) technique, which combines conventional two-dimensional digital images with spectroscopy to detect spatial and spectral features in different electromagnetic spectrum regions such as ultraviolet and infrared bands [Lorente et al. (2012)]. Moreover, Qin et al. (2013); Pullanagari and Li (2021) confirmed that the HSI technique can obtain both spatial and spectral information from an object simultaneously, thus making it a useful nondestructive method to evaluate single objects like fruits, vegetables, or grains. This hyperspectral fingerprint (spatial and spectral information) acquired using HSI reflects the physical and chemical properties of the regions of interest in the image [Ariana et al. (2006); Gowen et al. (2007); ElMasry et al. (2012); Mahesh et al. (2008); Ravikanth et al. (2015)]. HSI studies proved their feasibility in terms of spatial mapping with spectral responses of inspection quality attributes in fruits and vegetables. Here, the running and measuring processes of the HSI technique are carried out by monitoring and storing the data in different modes of reflectance, transmittance, and interactance for analyzing food quality [Gowen et al. (2007); Lorente et al. (2012); ElMasry et al. (2012); Qin et al. (2013)]. These measurements are: the quantities of moisture content, TSS, soluble solid content (SSC), and firmness in the case of fresh okra fruits [Xuan et al. (2021)], nectarines [Huang et al. (2021)], tomatoes [Liu et al. (2015)], strawberries [ElMasry et al. (2007)], apples [Crichton et al. (2018); Noh et al. (2007)], blueberries [Leiva-Valenzuela et al. (2013)], plums [Li et al. (2018)], sweet cherries [Pullanagari and Li (2021)], bananas [Rajkumar et al. (2012)], pears [Li et al. (2016)], nectarines [Munera et al. (2018); Munera et al. (2017)], mangoes [Jödicke et al. (2020); Pu and Sun (2015)], and peaches [Lu and Peng (2006); Zhu et al. (2016)].
Despite the great importance of date fruits, there is scarceness of studies on monitoring and evaluating date fruit quality using a hyperspectral imaging technique. There is only one study exploring the verification of the potential of hyperspectral imaging techniques to detect the fungal contamination of edible date fruits [Teena et al. (2014)]. The main objective of this article is to explore the potential of hyperspectral imaging in the reflectance mode to predict and measure the moisture content, dry matter content, and firmness of some date cultivars as a primary step in identifying and recording the spectral fingerprint of different date cultivars throughout all ripening stages to predict all quality properties (physical, chemical, and sensory).
Materials and Methods
Samples
Fresh date samples from two different date fruit cultivars (Khalas and Sukkari) were obtained from a local market in Riyadh, Saudi Arabia, each at the fully mature stage (Tamr). For each cultivar, 100 samples were randomly collected during the 2020 season. Samples were selected based on good appearance and were freedom from defects and injuries. After collecting the appropriate and optimal samples, they were transported by air freight to the Department of Measurements and Process Control, Faculty of Food Science, Szent István University, Budapest, Hungary. Samples were stored under refrigerated conditions at an air temperature of 4°C until analysis. Before starting image acquisition of date samples using a hyperspectral imaging camera, the date samples from each cultivar were numbered from 1 to 100 and then physically characterized in terms of length, width, and thickness using a digital vernier caliper (accuracy ±0.01 mm). The mass of each individual sample was measured using a sensitive balance (accuracy ±0.01 g).
Hyperspectral Imaging System
Hyperspectral data were obtained using a HeadWall push broom system (HeadWall Photonics Inc., Fitchburg, MA, United States), with a Canon NIR Lens, an F/2.0 (fast), and a focal lens (FL25 mm) attached, and the lighting system contains two halogen bulb illumination sources with a rating of 2 × 150 W. This power was big enough to gain a proper signal of camera sensitivity, the objective setup, and the slit size of the spectrograph. An optimal illumination geometry of 45/0 (incident angle/observation angle) was applied for ellipsoid objects. Also, a special algorithm (normalization) was used to eliminate the noise of the nonhomogeneous illumination stemming from the uneven surface of the 3D object. A hyperspectral camera was in the spectral range of 900–1700 nm, with a 320 × 256 pixel resolution InGaAs sensor matrix, 14-bit A/D conversion, an 800 nm/156 band = 5.13 nm/px spectral resolution, a 132*100 mm (a 424*320 px length*width) image size, a 100 mm/320 px = 312 µm/px spatial resolution, a 45/0 illumination geometry, and Argus calibration and controlling software [Firtha (2010)]. The stable setup, the proper calibration method, and pixel-noise handling provided the same result for a flat surface as a conventional spectrophotometer. The huge amount of spectral data (1,1 GB) was preprocessed and reduced by the CuBrowser algorithm [Firtha (2010)]. Around a 4′000 px size of the region of interest (ROI) rectangle areas was selected manually on a hypercube inside the date samples, as shown in (Figure 1).
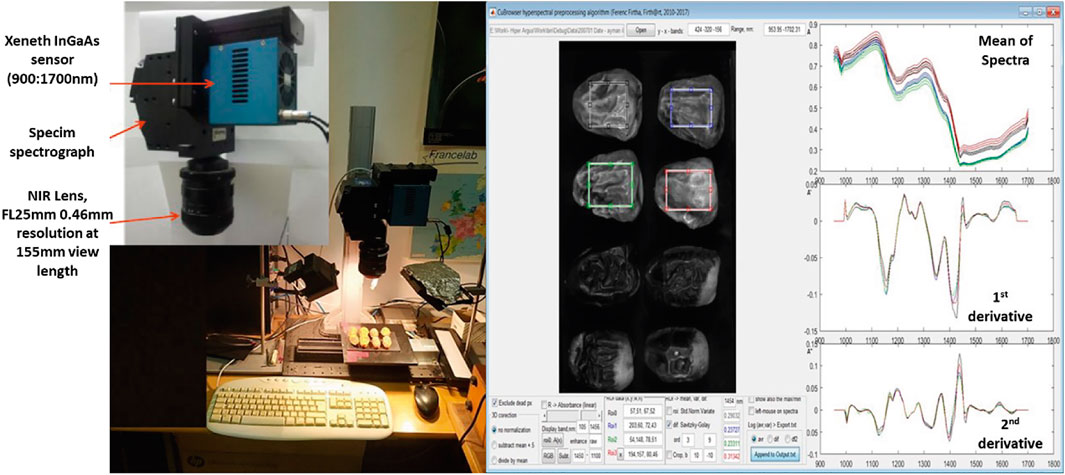
FIGURE 1. Hyperspectral acquisition system and analysis of spectra of ROI for date samples.
The spectra of ROI pixels were normalized by dividing by their average intensity to overcome inhomogeneous illumination and surface irregularity. The spatial information was used only in this normalization method, which resulted in the average spectrum of ROI having less variance. In the case of uneven surfaces, the proper normalization method of hyperspectral data can provide a much better signal-to-noise ratio than that obtainable with the conventional spectrophotometer method. The raw average spectra and their first and second derivatives were also checked. Numerical differentiation was performed using the Savitzky-Golay algorithm (length: 9 px, order: 3) to eliminate the effects of spectral noise. These derivatives may help to enhance determination efficiency. In this manner, the average spectra of the raw data were considered as the criteria for discrimination between quality attributes for both Khalas and Sukkari date fruit cultivars.
Reference Measurement Methods
Reference quality parameters of date fruit samples were analyzed after hyperspectral image acquisition. The date flesh firmness (F) was measured using the TPA test, which was carried out using a texture analyzer instrument TA-XTPlus (Stable Micro Systems, Surrey, UK), equipped with a 5 mm diameter stainless-steel cylinder. The pre-test speed was 1 mm s−1, while the test speed during the compression test was 1 mm s−1, and the post-test speed was 10 mm s−1. The maximum force deformation (expressed in N) was taken as the date fruit firmness and registered on two opposite points in each sample case with a 200 pps (points per second) acquisition data rate. The following parameters were taken into account to explain the firmness of date fruit samples and were determined using an algorithm fracture TPA: the first force peak (first maximum force of rupture in N) and the distance at the first force peak in mm, while the calculated parameters were the gradient (from origo to the first force peak in Nmm−1) and the work parameter, which is the area under the force-deformation curve up to the first force peak, defined as the force that acts on an object to cause a displacement (Nmm), as shown in (Figure 2), as described by Szczesniak and Hall (1975); Tanaka (1975) in the application of TPA for solid foods.
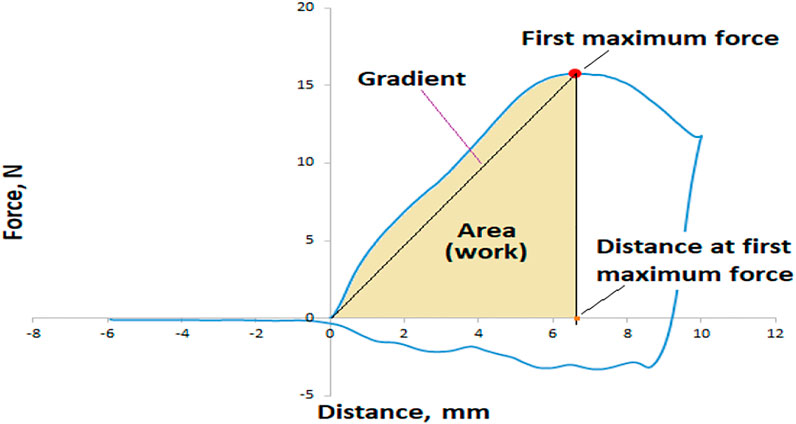
FIGURE 2. Typical force-deformation curve for date fruit texture analysis.
Moisture content (MC, %) and dry matter content (DMC, %) were measured for each sample scanned by hyperspectral imaging. Approximately 5 g of the flesh date sample was used. Samples were oven-dried at 105 ± 1°C until the reached a constant mass was obtained according to AOAC (2005). The MC, %, and DMC, %, of the date fruit of each sample were determined in triplicate. A completely randomized design of the experiment was performed. The treatments were randomized to minimize the effects of variation between the two date cultivars. A set of quality attributes was selected for this study, such as size represented by the three dimensions [length (L, mm), width (W, mm), thickness (T, mm), mass (g), MC %, DMC %, the first maximum force of rupture (MF, N), and work (W, Nmm)]. The data were processed for the frequency procedure and an independent t-test for groups using the Statistical Package for Social Science (SPSS) software version 20 (Stat Soft, Inc., Chicago, IL, United States ), and a probability value of p ≤ 0.05 was considered to show a statistically significant difference among mean values Gardner and Tremblay (2006).
Analyzing Hyperspectral Data
Hyperspectral reflectance coefficients measured at wavelengths ranging from 900 to 1700 nm were used to develop a prediction model to predict moisture content, dry matter content, and the firmness for date fruits by using the partial least squares regression (PLSR) method. The PLSR process is a qualified method for multivariate regression, that showed great success when applied in spectroscopic studies Nguyen et al. (2006); Viscarra Rossel (2008), Pullanagari and Li (2021). Regression models were performed using software called Unscrambler version 10.3 (CAMO Software AS., Oslo, Norway) to correlate the hyperspectral reflectance data with all quality attributes (moisture content, dry matter content, and firmness) and to provide multivariate calibration. The spectra of all date fruits that underwent hyperspectral scanning were divided into 60% for calibration and 40% for validation, with sets randomly separated. The optimum number of principal components (PCs) was decided based on the little amount of the mean square error of cross-validation for each quality attribute. The accuracy and validity of the calibration and prediction models for moisture content, dry matter content, and firmness quality attributes of date fruits were assessed based on the lowest root-mean-square error of calibration (RMSEC), cross-validation (RMSECV), or prediction (RMSEP), square error of prediction (SEP), and the highest coefficient of determination of calibration and prediction (R2prediction) through the relevance among both measured and predicted values for each quality attribute. Furthermore, residual predictive deviation (RPD), defined as the percentage among the standard deviations of the reference data and RMSEP, was also used to evaluate the performance of the final prediction model and the bias (b) (average of differences), which is a good indicator of similarity between the calibration and validation sets [Williams (1987); Williams and Sobering (1996); Westad and Martens (2000); Naes et al. (2002); Nicolai et al. (2007); Viscarra Rossel (2008)]. These indicators are formulated as follows:
Here,
Results and Discussions
Date Cultivars Characterization
The characterization based on the external quality of the two different date cultivars Khalas and Sukkari revealed clear differences, as shown in (Figure 3A). The majority of the measured physical parameters showed a clear variability within the two date cultivars, for example, the mean and standard deviation of length, width, and thickness were 36.88 ± 2.70, 20.94 ± 1.81, 20.26 ± 1.92 and 32.63 ± 3.47, 23.07 ± 2.54, 24.04 ± 3.9 mm for Khalas and Sukkari, respectively.
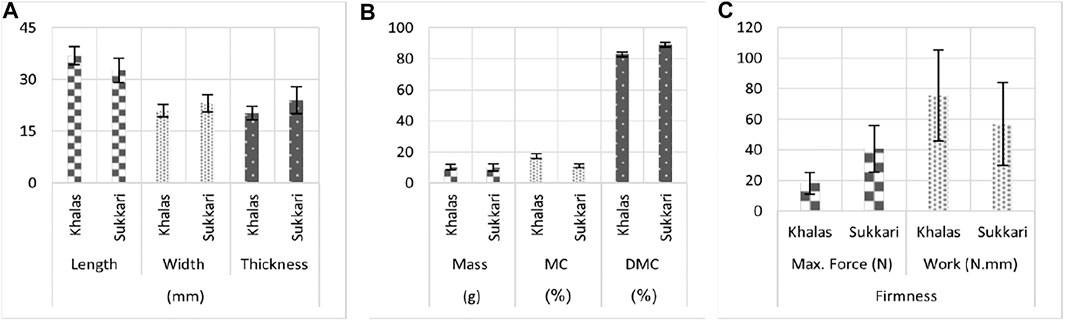
FIGURE 3. Mean and standard deviation of length, width, and thickness (A); mass, MC, and DMC (B); and firmness attribute (C) of Khalas and Sukkari cultivars.
Also, Figure 3B shows that Khalas date fruits are moister (17.6 ± 1.58%) compared to the Sukkari cultivar (11.03 ± 1.43%), which showed significant differences (p < 0.05) (Table 1). This indicates that Sukkari fruits were harder than the other cultivar. Contrary, the mass parameter did not show any significance within cultivars. The percentage of the DMC property in the Sukkari cultivar date fruits recorded the highest values (88.97 ± 1.43%) as compared to the fruits of the Khalas cultivar (82.84 ± 1.58%). The results of the inspection of firmness for texture of the two different date cultivars are illustrated in Figure 3C and the statistics are found in Table 1. Employing the same approach, the date fruits of the Sukkari cultivar recorded the highest values of the maximum force by mean (40.54 ± 15.19 N) versus 17.94 ± 7.22 N for the dates of the Khalas cultivar. The measures of the DMC and firmness properties obtained for both cultivars showed statistical differences, as mentioned in Table 1. Therefore, the texture of the samples of the Sukkari cultivar was firmer, and this is due to the highest values of DMC and the lowest values of moisture content.
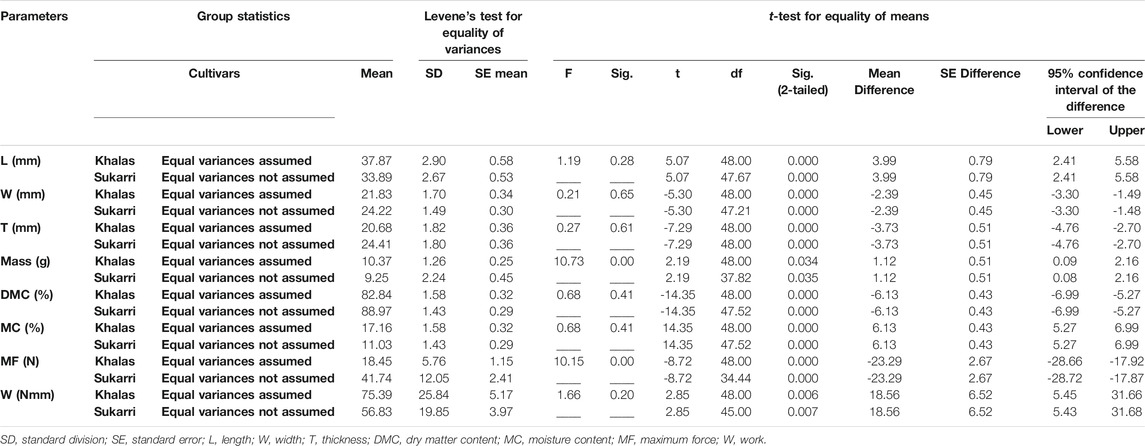
TABLE 1. Independent t-test for groups of some physical quality parameters of Khalas and Sukkari date cultivars.
Hyperspectral Analysis
The original spectra in the reflectance mode of all date fruit samples for Khalas and Sukkari cultivars within the spectral range of 950–1700 nm are depicted in Figure 4A. This amount of spectral reflection curves indicates the presence of differences over the hyperspectral imaging range. As is known, the presence of water in the fruit generally leads to a rise in the values of absorption. Hence, the fruits with a higher moisture content have lower values in the reflectance over the applied spectral range. The avereage original spectra recorded for Khalas and Sukkari date fruit samples are shown in Figure 4B. A comparative evaluation of these spectra indicates that they are quite similar.
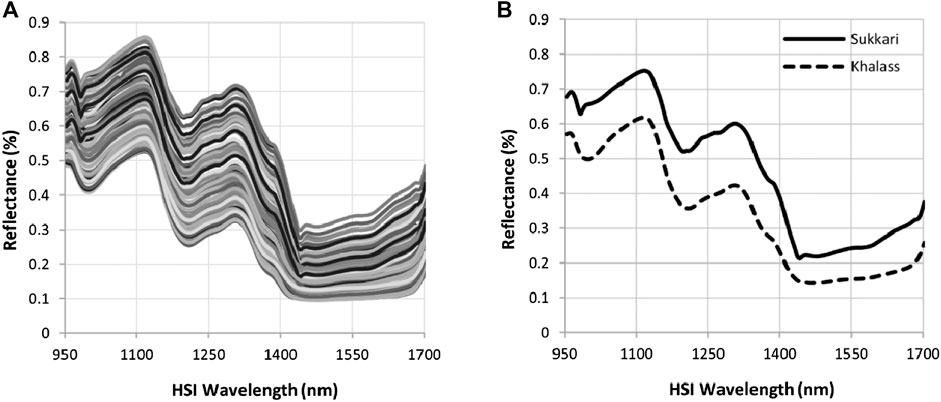
FIGURE 4. Hyperspectral behavior of date varieties. (A) Original hyperspectral wavelength and (B) mean of the hyperspectral wavelength of Khalas and Sukkari dates cultivars.
A considerable difference over the applied spectral range is observed, with reflectance values being higher for the Sukkari cultivar date samples and lower for the Khalas cultivar date samples. This in turn reflects the higher absorbance [log (1/R)] values for the Khalas cultivar date samples and lower absorbance values for the Sukkari cultivar date samples, which means that the Khalas cultivar has a higher number of absorbing bonds. This is evident in Figure 4B, which demonstrates the variation in the average of reflectance spectra for Khalas and Sukkari cultivars which have a similar spectral pattern characterized by having three absorption shoulders focused around 970, 1,110, and 1,300 nm. This confirms the significant differences between the quality characteristics of Khalas and Sukkari cultivars obtained using the reference methods. Therefore, it is critical to recognize the hyperspectral changes associated with physicochemical quality attributes. In the hyperspectral range, the first light shoulder feature was around 970 nm, which is associated with the water absorption shoulder feature due to the second overtone of the O–H stretching [Büning-Pfaue (2003); Lu and Peng (2006); Nicolai et al. (2007); Pullanagari and Li (2021)], which in this hyperspectral region was clearer and more powerful in the Khalas cultivar (Figure 4B). Also, Williams and Norris (2001) confirmed that the spectral shoulder feature around 971 nm is related to strong water absorption, which considers a powerful component in fresh fruits and can be indirectly associated with fruit textural characteristics. Also, Fairuz Omar, (2013) mentioned that the peak around 970 nm is also related to the vibration of the C–H bond present in sugars. However, there was a clear shoulder feature around 1,100 nm, which correlated with the sugar content and hence the ripening stage. These hyperspectral shoulder features corresponded to –H and –OH functional groups, which are related to carbohydrates and water bonds [Osborne et al. (1993); Cordenunsi and Lajolo (1995); Walsh et al. (2004); Rungpichayapichet et al. (2016); Pullanagari and Li (2021)]. Also, this finding agrees with suggestions that most of the relevant information on the SSC concentration is available in the absorption region of the first overtone (800–1,100 nm) and second overtone (1,300–1,600 nm) of water. Kaur (2020) observed that water does not contain sugars, and has the highest peak intensity followed in order by lower peak intensities for the low to high sucrose concentration samples. Also, this result is in agreement with the literature predicting sugars [Bázár et al. (2015)], salts [Gowen et al. (2015)], and honey adulteration detection [Bázár et al. (2016)]. Finally, the decrease observed in the intensity of the reflectance at the spectral peak of 1,300 nm indicates the high absorbance of the water bonds, which was probably due to the effect of O–H groups in water at 1,300 nm. Additionally, in Figure 4B, the other three valleys were related to the strong water absorbance bands occurring at 980, 1,200, and 1,450 nm in the date fruits. This result agreed with Zhu et al. (2017) and Magwaza et al. (2012).
The calibration models for the moisture content (MC), dry matter content (DMC), and firmness (F) of the two date cultivars were implemented by applying partial least squares regression (PLS) using the average spectra of 100 samples of dates. 60% of the total samples were used to create calibration models (calibration set) utilizing the whole spectral range from 950 to 1700 nm, and 40% of the average spectra of samples were used in the validation set. The optimum number of PCs was selected based on the lowest value of RMSECV for each quality attribute. Here, the error recorded the highest values at the beginning and gradually decreased with the increase of the number of PCs in each quality attribute calibration and validation model until its lowest value, when it matched with the best number of PCs. Accordingly, the optimal number of PCs to predict each of MC, DMC, and F (MF and W) was 4, 4, 5, and 4, respectively, as shown in Table 2.
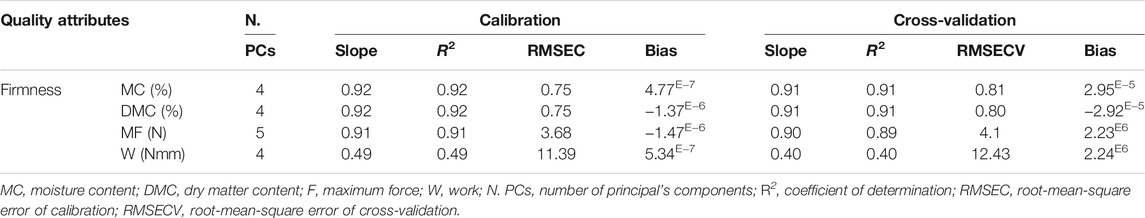
TABLE 2. Calibration and cross-validation models for predicting MC, DMC, and firmness in date samples.
Furthermore, Table 2 shows that the PLS calibration and cross-validation models were extremely accurate for predicting MC and DMC with the same coefficients of determination (R2) of 0.92 and 0.91 for calibration and cross-validation sets, respectively. This accuracy was achieved at the lowest values of RMSEC and RMSECV equal to 0.75 and 0.80% for calibration and cross-validation sets, respectively. However, the accuracy of the calibration and cross-validation models for predicting the firmness attribute varied as there were two criteria for judging the value of firmness (F), which is the first maximum force of rupture (MF) and the work (W). Here, MF (N) achieved the best accuracy of calibration and cross-validation models for the firmness characteristic of date fruits with an R2 value of 0.91 and 0.89 for calibration and cross-validation sets, these were accompanied by the lowest error rates of RMSEC and RMSECV of 3.68 and 4.1 N, respectively. This is due to the apparent difference in the first maximum force (MF, N) at which the rupture phenomenon occurs as shown in (Figure 5), which confirms the difference in the texture between the two date cultivars. Furthermore, the amount of DMC and MC is a major reason for the strength of the prediction model and the discrimination between the two types.
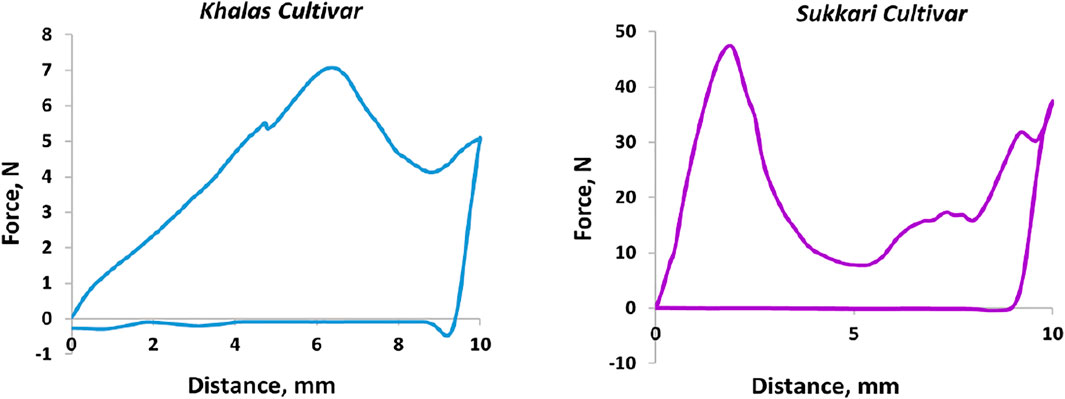
FIGURE 5. Variation in the force behavior curve among Khalas and Sukkari cultivars.
However, the work (W, Nmm) criterion for judging the firmness attribute of the dates achieved a lower accuracy for the calibration and cross-validation models. This may be due to the different values of the area under the stress–strain curve at the samples lower in the first maximum force of rupture. This gave results for the measuring values of the work parameter larger for the samples with less firmness compared to the samples with more firmness, which achieved the highest value of the first maximum force at which the rupture phenomenon occurred. This phenomenon can be explained by the elasticity of the cell walls and the moisture content in the cells. As the Sukkari cultivar had a lower moisture content the flesh of its fruit was harder and could have cracked from the effect of the penetration measure head. The Khalas cultivar was juicier due to the higher moisture content, which increased the elasticity of the cells. This finding was in line with an investigation for a study of the variation in the carrot texture under different storage conditions [Kaszab et al. (2009)]. Here, this study showed that there was a very definite reduction in the force/deformation ratio with the decrease of the moisture content of carrots. However, the work ratio considerably increased along with decreasing moisture content during storage. Also, this finding is in correspondence with a study to evaluate the rheological and textural characteristics of black and golden date pastes by Razavi and Karazhiyan (2012), which found that as hardness increases, the total positive area (work) decreases. Here, the value of hardness in the black date pastes was 231.16 ± 22.21 more than those in golden date pastes (210.83 ± 7.57). At the same time, the value of total positive area (work) of black date pastes (5,799.29 ± 593.26) was less than the value of the golden date pastes (6,372.84 ± 350.17).
Figure 6 depicts the relation between measured values by destructive methods and the corresponding predicted values by the nondestructive method (HSI) for MC, DMC, and firmness [first maximum force (MF) of rupture]. Moreover, Table 3 shows that the prediction model was very accurate for predicting MC and DMC with the same prediction R2Prediction of 0.91, with SEPs values of 0.82 and 0.81%, respectively. These results are consistent with successful investigations that focused on both moisture content and dry matter such as in Alhamdan and Atia (2017) and ElMasry et al. (2007), predicting an MC, of 0.94 with an RMSECV of 1.90% and 0.90 with an SEP of 3.874 for date fruits and strawberries, respectively.
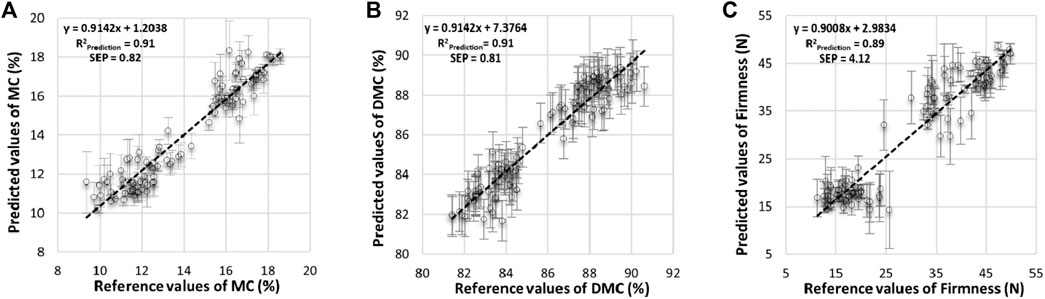
FIGURE 6. Scatter diagrams of reference vs predicted values for MC, DMC, and firmness (F) accompanied by standard deviation as error bars of predicted values.

TABLE 3. PLS prediction models for verification of MC (%), DMC (%), and F (MF, N) in date samples.
Also, this finding is in line with a comparative study that used hand-held near-infrared spectrophotometers within the spectral range from 600 to 1,000 nm for dry matter assessment of apples, kiwifruits, and summer fruits. Here, the finding of this study delivered a good prediction model where the values of coefficient of prediction (r2) with RMSEP were 0.89 (0.57), 0.92 (0.62), and 0.93 (0.61) for apples, kiwifruits, and summer fruits, respectively [Kaur et al. (2017)]. Also, this result agreed with the results of determination of the DM content of kiwifruit pulp using Fourier-transform near-infrared (FT-NIR) spectroscopy in the NIR range between 1,063 and 1800 nm, where it demonstrated that it was possible to produce excellent PLS regression models for the determination of DM in kiwifruit pulp R2p, RMSEP, and bias = 91.54, 0.29%, and 0.03, respectively [Kaur (2020)]. Using the same approach, Onsawai and Sirisomboon (2015) achieved R2 and RMSECV (0.90 and 3.58%, respectively) for the prediction dry matter content of the pulp durian. Also, Tavakolian et al. (2013) achieved a good correlation between the FT-NIR spectra and the DMC of date fruits with a determination coefficient (R2) of 0.94. Also, Clark et al. (2003) got a goodness prediction model where Rp2 and RMSEP were 0.88 and 1.8% between predicted and actual DMCs of Hass’ avocado, respectively. Similarly, the firmness represented in the first maximum force of rupture (MF, N) was predicted with R2Prediction of 0.89 and an SEP of 4.12 N resulting from the validation sets. This result is compatible with Zhu et al. (2016), who predicted the firmness attribute of peach pulp as it achieved a correlation coefficient of 0.85 and a residual predictive deviation of 1.74. Also, Leiva-Valenzuela et al. (2013) and Cen et al. (2011) obtained an identical predictive coefficient (R2) of 0.87 to predict the blueberry firmness using the HSI technique. Also, Tavakolian et al. (2013) achieved a good correlation between the FT-NIR spectra within spectral range between 833 and 2,500 nm and the firmness of date fruit with a determination coefficient (R2) of 0.84 and an SECV of 0.76 N. It is obvious from the values of the coefficient of determination (R2Prediction, 0.91, 0.91, and 0.89) of prediction that the MC, DMC, and F (MF, N) attributes of date fruits that they can be used for most applications, similarly to as mentioned by Williams (2003) about the values of coefficient of determination of prediction. The fact that the value of R2, is between 0.50 and 0.65 indicates that discrimination between high and low values of the measured attribute can be made and can be used for screening and approximate calibration if it ranges from 0.66 to 0.81. Furthermore, if the value was between 0.82 and 0.90, it could be used for most applications, and a value higher than 0.91 is considered to be excellent. However, the second indicator of residual predictive deviation (RPD) used to judge the reliability of prediction models used for date fruit quality attributes [MC, DMC, and F (MF, N)] shows recorded values of 3.65, 3.69, and 3.42 for MC, DMC, and F (MF, N), respectively. Therefore, the hyperspectral imaging technique based on the reference mode has great potency to predict and estimate all MC, DMC, and F (MF, N) attributes for date fruits. This is due to the levels of RPD values corresponding with Saeys et al. (2005), who mentioned that an RPD value of less than 1.5 means very poor predictions and the values ranging from 1.5 to 2.0 indicate that predictions can be used for screening purposes. However, an RPD value lying between 2.0 and 2.5 is suitable for approximate quantitative predictions, an RPD value between 2.5 and 3.0 points out a good model, and the values higher than 3.0 indicate that the prediction performance is considered excellent. It is obvious for the three attributes under study that the validation tests gave nearly similar results to the calibration set, indicating the good performance of the predicting models. From the above, it became clear that the results indicate the feasibility of using the hyperspectral imaging technique for detecting the quality attributes of date fruits. Apart from these properties, it may also be used to monitor and estimate all the other physical, chemical, and sensory properties of date fruits.
Conclusions
This research presents a preliminary study as a new approach in the field of quality detection of date fruits that uses a hyperspectral imaging technique based on the reflectance mode as a nondestructive and label-free method for estimating some quality attributes such as moisture content, dry matter content, and firmness. The quality detection of two date cultivars using monitoring and the estimation of the three quality attributes, MC, DMC, and F (MF, N), using a successful PLS regression analysis resulted in a powerful prediction model and was classified as a fitting model for most applications. The resulting coefficients of prediction determination (R2Prediction) were 0.91 and 0.89 for MC, DMC, and F (MF, N), respectively, with the lowest values of SEP of 0.82, 0.81 (%), and 4.12 (N) for MC, DMC, and F (MF, N) over all the captured wavelengths, respectively. These results confirm that the preliminary study for using the NIR hyperspectral imaging technique to monitor and estimate some quality attributes of date fruits, thus especially to assess all MC, DMC, and F (MF, N), was successful. Nevertheless, this technique should be tested more in other date cultivars and on larger samples of fruits in different maturity stages before being disseminated and circulated in the practical form to the quality control systems in the date palm sector. Moreover, this successful preliminary study is considered the first step for a series of investigations to use the hyperspectral imaging technique to inspect the quality of the five maturity stages of date fruits starting from Hababouk, Kimri, Khalal, Rutab, and Tamr. This is to record the spectral fingerprint of the different maturity stages of the fruits of the date and compare it with the physical, chemical, and sensory quality characteristics and to achieve the best prediction model capable of identifying the most important quality characteristics of dates.
Data Availability Statement
The original contributions presented in the study are included in the article/supplementary material, and further inquiries can be directed to the corresponding author.
Author Contributions
AI: conceptualization, investigation, methodology, formal analysis, data curation, software, roles/writing—original draft, validation, writing—review and editing. FF, TK, and ZK: resources, methodology, formal analysis, roles/writing—original draft, final review. AA and AE: data curation, roles/writing—original draft, final review. LH: project administration, supervision.
Funding
The Ministry of Innovation and Technology within the framework of the Thematic Excellence Program 2020, the Institutional Excellence Sub-Program (TKP2020-IKA-12).
Conflict of Interest
The authors declare that the research was conducted in the absence of any commercial or financial relationships that could be construed as a potential conflict of interest.
Publisher’s Note
All claims expressed in this article are solely those of the authors and do not necessarily represent those of their affiliated organizations or those of the publisher, the editors, and the reviewers. Any product that may be evaluated in this article or claim that may be made by its manufacturer is not guaranteed or endorsed by the publisher.
Acknowledgments
The authors would like to thank the Agricultural Engineering Research Institute (AEnRI), the Agricultural Research Center (ARC), Egypt, for their support and assistance to the corresponding author. Special thanks also go to the Ministry of Innovation and Technology within the framework of the Thematic Excellence Program 2020, Institutional Excellence Sub-Program (TKP2020-IKA-12), in the topic of water-related research studies of Hungarian University of Agriculture and Life Sciences for the support of this work.
References
Alhamdan, A., Abdelkarim, D., and Atia, A. (2016). Textural properties of date pastes as influenced by date cultivar. IMPACT: IJRANSS 4 (5), 99–106.
Alhamdan, A., Bakri, H., Alkahtani, H., Abdelkarim, D., and Younis, M. (2015). Cryogenic freezing of fresh date fruits for quality preservation during frozen storage. J. Saudi Soc. Agric. Sci. 17 (1), 9–16.
Alhamdan, A. M., and Atia, A. (2017). Non-destructive method to predict Barhi dates quality at different stages of maturity utilising near-infrared (NIR) spectroscopy. Int. J. Food Prop. 20 (S3), S2950–S2959. doi:10.1080/10942912.2017.1387794
AOAC (2005). Official Method of Analysis of the Association of Analytical Chemists. 18th Edition. Washington DC: AOAC.Determination of Moisture, Ash, Protein and Fat
Ariana, D. P., Lu, R., and Guyer, D. E. (2006). Near-infrared hyperspectral reflectance imaging for detection of bruises on pickling cucumbers. Comput. Elect. Agric. 53, 60–70. doi:10.1016/j.compag.2006.04.001
Bázár, G., Kovacs, Z., Tanaka, M., Furukawa, A., Nagai, A., Osawa, M., et al. (2015). Water revealed as molecular mirror when measuring low concentrations of sugar with near infrared light. Analytica Chim. Acta 896, 52–62. doi:10.1016/j.aca.2015.09.014
Bázár, G., Romvári, R., Szabó, A., Somogyi, T., Éles, V., and Tsenkova, R. (2016). NIR detection of honey adulteration reveals differences in water spectral pattern. Food Chem. 194, 873–880. doi:10.1016/j.foodchem.2015.08.092
Büning-Pfaue, H. (2003). Analysis of water in food by near infrared spectroscopy. Food Chem. 82, 107–115. doi:10.1016/s0308-8146(02)00583-6
Caporaso, N., Whitworth, M. B., Grebby, S., and Fisk, I. D. (2018). Rapid prediction of single green coffee bean moisture and lipid content by hyperspectral imaging. J. Food Eng. 227, 18–29. doi:10.1016/j.jfoodeng.2018.01.009
Cen, H., Lu, R., Mendoza, F. A., and Ariana, D. P. (2011). Peach maturity/quality assessment using hyperspectral imaging-based spatially resolved technique. Sensing Agric. Food Qual. Saf. III, 80270L. Proc. SPIE 8027. doi:10.1117/12.883573
Chandrasekaran, I., Panigrahi, S. S., Ravikanth, L., and Singh, C. B. (2019). Potential of Near-Infrared (NIR) Spectroscopy and Hyperspectral Imaging for Quality and Safety Assessment of Fruits: an Overview. Food Anal. Methods 12, 2438–2458. doi:10.1007/s12161-019-01609-1
Clark, C. J., McGlone, V. A., Requejo, C., White, A., and Woolf, A. B. (2003). Dry matter determination in 'Hass' avocado by NIR spectroscopy. Postharvest Biol. Tech. 29 (3), 301–308. doi:10.1016/s0925-5214(03)00046-2
Cordenunsi, B. R., and Lajolo, F. M. (1995). Starch Breakdown during Banana Ripening: Sucrose Synthase and Sucrose Phosphate Synthase. J. Agric. Food Chem. 43 (2), 347–351. doi:10.1021/jf00050a016
Cortés, V., Ortiz, C., Aleixos, N., Blasco, J., Cubero, S., and Talens, P. (2016). A new internal quality index for mango and its prediction by external visible and near-infrared reflection spectroscopy. Postharvest Biol. Tech. 118, 148–158. doi:10.1016/j.postharvbio.2016.04.011
Crichton, S., Shrestha, L., Hurlbert, A., and Sturm, B. (2018). Use of hyperspectral imaging for the prediction of moisture content and chromaticity of raw and pretreated apple slices during convection drying. Drying Tech. 36 (7), 804–816. doi:10.1080/07373937.2017.1356847
ElMasry, G., Kamruzzaman, M., Sun, D.-W., and Allen, P. (2012). Principles and applications of hyperspectral imaging in quality evaluation of agro-food products: a review. Crit. Rev. Food Sci. Nutr. 52 (11), 999–1023. doi:10.1080/10408398.2010.543495
ElMasry, G., Wang, N., ElSayed, A., and Ngadi, M. (2007). Hyperspectral imaging for nondestructive determination of some quality attributes for strawberry. J. Food Eng. 81 (1), 98–107. doi:10.1016/j.jfoodeng.2006.10.016
Escribano, S., Biasi, W. V., Lerud, R., Slaughter, D. C., and Mitcham, E. J. (2017). Non-destructive prediction of soluble solids and dry matter content using NIR spectroscopy and its relationship with sensory quality in sweet cherries. Postharvest Biol. Tech. 128, 112–120. doi:10.1016/j.postharvbio.2017.01.016
Fairuz Omar, A. (2013). Spectroscopic profiling of soluble solids content and acidity of intact grape, lime, and star fruit. Sensor Rev. 33 (3), 238–245. doi:10.1108/02602281311324690
FAO (2019). Conference 41st Session Side Event Promoting dates as Extraordinary fruits for Economic. Rome: environmental and social development.
FAO (2018). World food and agriculture – statistical pocketbook. Rome: environmental and social development, 254. Licence: CC BY-NC-SA 3.0 IGO.
Farahnaky, A., and Afshari-Jouybari, H. (2010). Physiochemical changes in Mazafati date fruits incubated in hot acetic acid for accelerated ripening to prevent diseases and decay. Sci. Hortic. 127 (3), 313–317.
Firtha, F. (2010). Argus hyperspectral acquisition software. ftp://fizika2.kee.hu/ffirtha/ArgusCuBrowser.pdf.
Gardner, R. C., and Tremblay, P. F. (2006). Essential of data analysis: Statistics and computer applications. London: university of western Ontario, 224–308.
Ghnimi, S., Umer, S., Karim, A., and Kamal-Eldin, A. (2017). Date fruit ( Phoenix dactylifera L.): An underutilized food seeking industrial valorization. NFS J. 6, 1–10. doi:10.1016/j.nfs.2016.12.001
Gowen, A. A., Marini, F., Tsuchisaka, Y., De Luca, S., Bevilacqua, M., O’Donnell, C., et al. (2015). On the feasibility of near infrared spectroscopy to detect contaminants in water using single salt solutions as model systems. Talanta 131, 609–618. doi:10.1016/j.talanta.2014.08.049
Gowen, A., Odonnell, C., Cullen, P., Downey, G., and Frias, J. (2007). Hyperspectral imaging - an emerging process analytical tool for food quality and safety control. Trends Food Sci. Tech. 18 (12), 590–598. doi:10.1016/j.tifs.2007.06.001
Gross, K. C., Chien, Y. W., and Mikal, S. (2016). “The commercial storage of fruits, vegetables, and florist and nursery stocks,” in Agriculture Handbook (Washington, DC: U.S. Department of Agriculture), 66.
H. K. Noh, H. K., Y. Peng, Y., and R. Lu, R. (2007). Integration of hyperspectral reflectance and fluorescence imaging for assessing apple maturity. Trans. ASABE. 50 (3), 963–971. doi:10.13031/2013.23119
Huang, F.-H., Liu, Y.-H., Sun, X., and Yang, H. (2021). Quality inspection of nectarine based on hyperspectral imaging technology. Syst. Sci. Control. Eng. 9 (1), 350–357. doi:10.1080/21642583.2021.1907260
Huang, Y., Lu, R., Xu, Y., and Chen, K. (2018). Prediction of tomato firmness using spatially-resolved spectroscopy. Postharvest Biol. Tech. 140, 18–26. doi:10.1016/j.postharvbio.2018.02.008
Jha, S. N., and Garg, R. (2010). Non-destructive prediction of quality of intact apple using near infrared spectroscopy. J. Food Sci. Technol. 47, 207–213. doi:10.1007/s13197-010-0033-1
Jha, S. N., Narsaiah, K., Jaiswal, P., Bhardwaj, R., Gupta, M., Kumar, R., et al. (2014). Nondestructive prediction of maturity of mango using near infrared spectroscopy. J. Food Eng. 124, 152–157. doi:10.1016/j.jfoodeng.2013.10.012
Jödicke, K., Zirkler, R., Eckhard, T., Hofacker, W., and Jödicke, B. (2020). High End Quality Measuring in Mango Drying through Multi-Spectral Imaging Systems. ChemEngineering 4 (1), 1–8. doi:10.3390/chemengineering4010008
Kader, A. A., and Awad, A. H. (2009). Harvesting and Postharvest Handling of Dates. ICARDA Aleppo, 1–15.
Kaszab, T., Firtha, F., and Fekete, A. (2009). “Variation in Carrot Texture under Different Storage Conditions,” in CIGR Section VI International Symposium on Food Processing (Potsdam, Germany: Monitoring Technology in Bioprocesses and Food Quality Management).
Kaur, H. (2020). Investigating Aquaphotomics for Fruit Quality Assessment. A thesis of Doctor of Philosophy in Electronics Engineering. New Zealand: The University of Waikato.
Kaur, H., Künnemeyer, R., and McGlone, A. (2017). Comparison of hand-held near infrared spectrophotometers for fruit dry matter assessment. J. Near Infrared Spectrosc. 25 (4), 267–277. doi:10.1177/0967033517725530
Kim, G., Kim, D.-Y., Kim, G. H., and Cho, B.-K. (2013). Applications of discrete wavelet analysis for predicting internal quality of cherry tomatoes using VIS/NIR spectroscopy. J. Biosyst. Eng. 38 (1), 48–54. doi:10.5307/jbe.2013.38.1.048
Leiva-Valenzuela, G. A., Lu, R., and Aguilera, J. M. (2013). Prediction of firmness and soluble solids content of blueberries using hyperspectral reflectance imaging. J. Food Eng. 115 (1), 91–98. doi:10.1016/j.jfoodeng.2012.10.001
Li, B., Cobo-Medina, M., Lecourt, J., Harrison, N., Harrison, R. J., and Cross, J. V. (2018). Application of hyperspectral imaging for nondestructive measurement of plum quality attributes. Postharvest Biol. Tech. 141, 8–15. doi:10.1016/j.postharvbio.2018.03.008
Li, B., Hou, B., Zhang, D., Zhou, Y., Zhao, M., Hong, R., et al. (2016). Pears characteristics (soluble solids content and firmness prediction, varieties) testing methods based on visible-near infrared hyperspectral imaging. Optik 127 (5), 2624–2630. doi:10.1016/j.ijleo.2015.11.193
Liu, C., Liu, W., Chen, W., Yang, J., and Zheng, L. (2015). Feasibility in multispectral imaging for predicting the content of bioactive compounds in intact tomato fruit. Food Chem. 173, 482–488. doi:10.1016/j.foodchem.2014.10.052
Lorente, D., Aleixos, N., Gómez-Sanchis, J., Cubero, S., García-Navarrete, O. L., and Blasco, J. (2012). Recent advances and applications of hyperspectral imaging for fruit and vegetable quality assessment. Food Bioproc. Technol 5, 1121–1142. doi:10.1007/s11947-011-0725-1
Lu, R., and Ariana, D. (2002). A near-infrared sensing technique for measuring internal quality of apple fruit. Appl. Eng. Agric. 18 (5), 585–590. doi:10.13031/2013.10146
Lu, R., and Peng, Y. (2006). Hyperspectral scattering for assessing peach fruit firmness. Biosyst. Eng. 93 (2), 161–171. doi:10.1016/j.biosystemseng.2005.11.004
Lu, R. (2001). Predicting firmness and sugar content of sweet cherries using near–infrared diffuse reflectance spectroscopy. Trans. ASAE. 44 (5), 1265–1271. doi:10.13031/2013.6421
Magwaza, L. S., Opara, U. L., Nieuwoudt, H., Cronje, P. J. R., Saeys, W., and Nicolaï, B. (2012). NIR Spectroscopy Applications for Internal and External Quality Analysis of Citrus Fruit-A Review. Food Bioproc. Technol 5, 425–444. doi:10.1007/s11947-011-0697-1
Mahesh, S., Manickavasagan, A., Jayas, D. S., Paliwal, J., and White, N. D. G. (2008). Feasibility of near-infrared hyperspectral imaging to differentiate Canadian wheat classes. Biosyst. Eng. 101 (1), 50–57. doi:10.1016/j.biosystemseng.2008.05.017
Munera, S., Amigo, J. M., Aleixos, N., Talens, P., Cubero, S., and Blasco, J. (2018). Potential of VIS-NIR hyperspectral imaging and chemometric methods to identify similar cultivars of nectarine. Food Control 86, 1–10. doi:10.1016/j.foodcont.2017.10.037
Munera, S., Amigo, J. M., Blasco, J., Cubero, S., Talens, P., and Aleixos, N. (2017). Ripeness monitoring of two cultivars of nectarine using VIS-NIR hyperspectral reflectance imaging. J. Food Eng. 214, 29–39. doi:10.1016/j.jfoodeng.2017.06.031
Naes, T., Isaksson, T., Fearn, T., and Davies, T. (2002). A User-friendly guide to multivariate calibration and classification. Chichester, UK: NIR Publications, 420.
Nagle, M., Mahayothee, B., Rungpichayapichet, P., Janjai, S., and Müller, J. (2010). Effect of irrigation on near-infrared (NIR) based prediction of mango maturity. Scientia Horticulturae 125 (4), 771–774. doi:10.1016/j.scienta.2010.04.044
Nguyen, H. T., Kim, J. H., Nguyen, A. T., Nguyen, L. T., Shin, J. C., and Lee, B.-W. (2006). Using canopy reflectance and partial least squares regression to calculate within-field statistical variation in crop growth and nitrogen status of rice. Precision Agric. 7, 249–264. doi:10.1007/s11119-006-9010-0
Nicolaï, B. M., Beullens, K., Bobelyn, E., Peirs, A., Saeys, W., Theron, K. I., et al. (2007). Nondestructive measurement of fruit and vegetable quality by means of NIR spectroscopy: A review. Postharvest Biol. Tech. 46 (2), 99–118. doi:10.1016/j.postharvbio.2007.06.024
Onsawai, P., and Sirisomboon, P. (2015). Determination of dry matter and soluble solids of durian pulp using diffuse reflectance near infrared spectroscopy. J. Near Infrared Spectrosc. 23 (3), 167–179. doi:10.1255/jnirs.1158
Osborne, B. G., Fearn, T., and Hindle, P. H. (1993). Practical NIR Spectroscopy with Applications in Food and Beverage Analysis. 2nd ed. Burnt Mill, Harlow, Essex, England, UK: Longman Group, 123–132.
Pu, Y.-Y., and Sun, D.-W. (2015). Vis-NIR hyperspectral imaging in visualizing moisture distribution of mango slices during microwave-vacuum drying. Food Chem. 188, 271–278. doi:10.1016/j.foodchem.2015.04.120
Pullanagari, R. R., and Li, M. (2021). Uncertainty assessment for firmness and total soluble solids of sweet cherries using hyperspectral imaging and multivariate statistics. J. Food Eng. 289, 110177. doi:10.1016/j.jfoodeng.2020.110177
Qin, J., Chao, K., Kim, M. S., Lu, R., and Burks, T. F. (2013). Hyperspectral and multispectral imaging for evaluating food safety and quality. J. Food Eng. 118 (2), 157–171. doi:10.1016/j.jfoodeng.2013.04.001
Rahman, M. S., and Al-Farsi, S. A. (2005). Instrumental texture profile analysis (TPA) of date flesh as a function of moisture content. J. Food Eng. 66 (4), 505–511. doi:10.1016/j.jfoodeng.2004.04.022
Rajkumar, P., Wang, N., EImasry, G., Raghavan, G. S. V., and Gariepy, Y. (2012). Studies on banana fruit quality and maturity stages using hyperspectral imaging. J. Food Eng. 108 (1), 194–200. doi:10.1016/j.jfoodeng.2011.05.002
Ravikanth, L., Singh, C. B., Jayas, D. S., and White, N. D. G. (2015). Classification of contaminants from wheat using near-infrared hyperspectral imaging. Biosyst. Eng. 135, 73–86. doi:10.1016/j.biosystemseng.2015.04.007
Razavi, S. M. A., and Karazhiyan, H. (2012). Rheological and Textural Characteristics of Date Paste. Int. J. Food Properties 15 (2), 281–291. doi:10.1080/10942912.2010.483615
Rungpichayapichet, P., Mahayothee, B., Nagle, M., Khuwijitjaru, P., and Müller, J. (2016). Robust NIRS models for non-destructive prediction of postharvest fruit ripeness and quality in mango. Postharvest Biol. Tech. 111, 31–40. doi:10.1016/j.postharvbio.2015.07.006
Saeys, W., Mouazen, A. M., and Ramon, H. (2005). Potential for onsite and online analysis of pig manure using visible and near infrared reflectance spectroscopy. Biosyst. Eng. 91 (4), 393–402. doi:10.1016/j.biosystemseng.2005.05.001
Singh, V., Guizani, N., Al-Alawi, A., Claereboudt, M., and Rahman, M. S. (2013). Instrumental texture profile analysis (TPA) of date fruits as a function of its physico-chemical properties. Ind. Crops Prod. 50, 866–873. doi:10.1016/j.indcrop.2013.08.039
Singh, V., Guizani, N., Essa, M. M., Hakkim, F. L., and Rahman, M. S. (2012). Comparative analysis of total phenolics, flavonoid content and antioxidant profile of different date varieties (Phoenix dactylifera L.) from Sultanate of Oman. Int. Food Res. J. 19 (3), 1063–1070.
Suni, M., Nyman, M., Eriksson, N.-A., Bjork, L., and Bjorck, I. (2000). Carbohydrate composition and content of organic acids in fresh and stored apples. J. Sci. Food Agric. 80, 1538–1544. doi:10.1002/1097-0010(200008)80:10<1538:aid-jsfa678>3.0.co;2-a
Syahrir, W. M., Suryanti, A., and Connsynn, C. (2009). Color grading in tomato maturity estimator using image processing technique. Proc. 2nd IEEE Int. Conf. Comp. Sci. Inf. Tech., 276–280. doi:10.1109/iccsit.2009.5234497
Szczesniak, A. S., and Hall, B. J. (1975). Application of the General Foods Texturometer to specific food products. J. Texture Stud. 6, 117–138. doi:10.1111/j.1745-4603.1975.tb01121.x
Tanaka, M. (1975). General Foods Texturometer application to food texture research in Japan. J. Texture Stud. 6, 101–116. doi:10.1111/j.1745-4603.1975.tb01120.x
Tavakolian, M. S. S., Silaghi, F. A., Fabbri, A., Molari, G., Giunchi, A., and Guarnieri, A. (2013). Differentiation of post harvest date fruit varieties non-destructively using FT-NIR spectroscopy. Int. J. Food Sci. Technol. 48, 1282–1288. doi:10.1111/ijfs.12088
Teena, M. A., Manickavasagan, A., Ravikanth, L., and Jayas, D. S. (2014). Near infrared (NIR) hyperspectral imaging to classify fungal infected date fruits. J. Stored Prod. Res. 59, 306–313. doi:10.1016/j.jspr.2014.09.005
Viscarra Rossel, R. A. (2008). ParLeS: Software for chemometric analysis of spectroscopic data. Chemometrics Intell. Lab. Syst. 90 (1), 72–83. doi:10.1016/j.chemolab.2007.06.006
Walsh, K. B., Golic, M., and Greensill, C. V. (2004). Sorting of Fruit Using near Infrared Spectroscopy: Application to a Range of Fruit and Vegetables for Soluble Solids and Dry Matter Content. J. Near Infrared Spectrosc. 12 (3), 141–148. doi:10.1255/jnirs.419
Westad, F., and Martens, H. (2000). Variable selection in near infrared spectroscopy based on significance testing in partial least squares regression. J. Near Infrared Spectrosc. 8 (2), 117–124. doi:10.1255/jnirs.271
Williams, P. C., and Norris, K. (2001). “Variables affecting near-infrared spectroscopic analysis,” in Near-infrared Technology in the Agricultural and Food Industries. Editors P. Williams, and K. H. Norris. second ed. (St Paul: The American Associtation of Cereal Chemists), 171–189.
Williams, P. C., and Sobering, D. C. (1996). How do we do it: A brief summary of the methods we use in developing near infrared calibrations. A. M. C. Davies, and P. C. Williams (Eds.), In Near infrared spectroscopy: The future waves (pp. 185–188). Chichester, UK: NIR Publications.
Williams, P. C. (1987). “Variables affecting near-infrared reflectance spectroscopic analysis,” in Near-infrared technology in the agricultural and food industries. Editors P. Williams, and K. Norris (St. Paul, MN: American Association of Cereal Chemists), 143–166.
Williams, P. (2003). “Near-infrared technology—Getting the best out of light,” in PDK Grain (Canada: Nanaimo).
Xuan, G., Gao, C., Shao, Y., Wang, X., Wang, Y., and Wang, K. (2021). Maturity determination at harvest and spatial assessment of moisture content in okra using Vis-NIR hyperspectral imaging. Postharvest Biol. Tech. 180, 111597. doi:10.1016/j.postharvbio.2021.111597
Yande, L., Xingmiao, C., and Aiguo, O. (2008). Nondestructive determination of pear internal quality indices by visible and near-infrared spectrometry. Lwt-food SCI. TECHNOL. 41 (9), 1720–1725.
Zheng, C., Sun, D.-W., and Zheng, L. (2006). Recent developments and applications of image features for food quality evaluation and inspection - a review. Trends Food Sci. Tech. 17 (12), 642–655. doi:10.1016/j.tifs.2006.06.005
Zhu, H., Chu, B., Fan, Y., Tao, X., Yin, W., and He, Y. (2017). Hyperspectral imaging for predicting the internal quality of kiwifruits based on variable selection algorithms and chemometric models. Sci. Rep. 7, 7845. doi:10.1038/s41598-017-08509-6
Keywords: date fruits, quality, hyperspectral imaging, texture, partial least squares regression
Citation: Ibrahim A, Alghannam A, Eissa A, Firtha F, Kaszab T, Kovacs Z and Helyes L (2021) Preliminary Study for Inspecting Moisture Content, Dry Matter Content, and Firmness Parameters of Two Date Cultivars Using an NIR Hyperspectral Imaging System. Front. Bioeng. Biotechnol. 9:720630. doi: 10.3389/fbioe.2021.720630
Received: 04 June 2021; Accepted: 13 August 2021;
Published: 21 October 2021.
Edited by:
Eduardo Jacob-Lopes, Federal University of Santa Maria, BrazilReviewed by:
Chao-Hui Feng, Kitami Institute of Technology, JapanPau Loke Show, University of Nottingham Malaysia Campus, Malaysia
Copyright © 2021 Ibrahim, Alghannam, Eissa, Firtha, Kaszab, Kovacs and Helyes. This is an open-access article distributed under the terms of the Creative Commons Attribution License (CC BY). The use, distribution or reproduction in other forums is permitted, provided the original author(s) and the copyright owner(s) are credited and that the original publication in this journal is cited, in accordance with accepted academic practice. No use, distribution or reproduction is permitted which does not comply with these terms.
*Correspondence: Ayman Ibrahim, aymanelgizawee@gmail.com