A Novel Framework for the Identification of Reference DNA Methylation Libraries for Reference-Based Deconvolution of Cellular Mixtures
 Shelby Bell-Glenn1
  Jeffrey A. Thompson
 Lucas A. Salas
 Devin C. Koestler
- 1Department of Biostatistics and Data Science, University of Kansas Medical Center, Kansas City, KS, United States
- 2Department of Epidemiology, Geisel School of Medicine, Dartmouth College, Hanover, NH, United States
Reference-based deconvolution methods use reference libraries of cell-specific DNA methylation (DNAm) measurements as a means toward deconvoluting cell proportions in heterogeneous biospecimens (e.g., whole-blood). As the accuracy of such methods depends highly on the CpG loci comprising the reference library, recent research efforts have focused on the selection of libraries to optimize deconvolution accuracy. While existing approaches for library selection work extremely well, the best performing approaches require a training data set consisting of both DNAm profiles over a heterogeneous cell population and gold-standard measurements of cell composition (e.g., flow cytometry) in the same samples. Here, we present a framework for reference library selection without a training dataset (RESET) and benchmark it against the Legacy method (minfi:pickCompProbes), where libraries are constructed based on a pre-specified number of cell-specific differentially methylated loci (DML). RESET uses a modified version of the Dispersion Separability Criteria (DSC) for comparing different libraries and has four main steps: 1) identify a candidate set of cell-specific DMLs, 2) randomly sample DMLs from the candidate set, 3) compute the Modified DSC of the selected DMLs, and 4) update the selection probabilities of DMLs based on their contribution to the Modified DSC. Steps 2–4 are repeated many times and the library with the largest Modified DSC is selected for subsequent reference-based deconvolution. We evaluated RESET using several publicly available datasets consisting of whole-blood DNAm measurements with corresponding measurements of cell composition. We computed the RMSE and R2 between the predicted cell proportions and their measured values. RESET outperformed the Legacy approach in selecting libraries that improve the accuracy of deconvolution estimates. Additionally, reference libraries constructed using RESET resulted in cellular composition estimates that explained more variation in DNAm as compared to the Legacy approach when evaluated in the context of epigenome-wide association studies (EWAS) of several publicly available data sets. This finding has implications for the statistical power of EWAS. RESET combats potential challenges associated with existing approaches for reference library assembly and thus, may serve as a viable strategy for library construction in the absence of a training data set.
Introduction
Epigenome-wide association studies (EWAS) explore epigenetic variation, specifically in DNA methylation (DNAm). These studies provide insight into how environmental factors can influence disease, as well as indirectly inform potential novel therapeutics to treat human diseases (Rakyan et al., 2011; Michels et al., 2013; Flanagan, 2015). A well-recognized challenge in the statistical analysis and interpretation of EWAS, particularly EWAS that involve DNAm profiling of heterogeneous tissue types (e.g., whole blood, peripheral blood mononuclear cells, etc.), arises from the cell specificity of DNA methylation. It has been well documented that DNAm analyses of heterogeneous cell populations are prone to a decreased statistical power for detecting CpG-specific methylation effects or, worse, confounding and misleading results (Reinius et al., 2012; Jaffe and Irizarry, 2014; Liang and Cookson, 2014; Houseman et al., 2015). One obvious way to deal with the potential for confounding due to cellular heterogeneity is to adjust downstream statistical models for cellular composition (e.g., by adding terms to statistical models that reflect the proportion of each cell type within the heterogeneous sample used for methylation profiling). When available, cell composition is measured using complete blood cell counts (CBC) with differential or flow cytometry in the same biospecimens used for DNA methylation profiling (Houseman et al., 2015). However, these measurements are not routinely collected for most EWAS due to added cost to the study and technical limitations of these approaches (e.g., both CBC and flow cytometry require fresh samples and are not feasible for stored specimens).
To address these issues, methods for DNAm-based cell mixture deconvolution (CMD) have been developed. CMD relies on the assumption that methylation signatures for a heterogeneous sample can be thought of as a weighted mixture of the unique methylation signature of each cell type making up the sample (Houseman et al., 2012; Newman et al., 2015; Houseman et al., 2016; Koestler et al., 2016; Teschendorff et al., 2017; Titus et al., 2017; Decamps et al., 2020; Scherer et al., 2020). Thus, CMD makes use of the cell-specificity of DNAm to estimate the cell proportions in samples with heterogeneous cell composition. CMD includes both reference-free and reference-based approaches. Reference-free deconvolution obtains cell type-specific proportions when DNAm profiles in purified cell types are not available (Houseman et al., 2016; Decamps et al., 2020; Scherer et al., 2020). While broadly applicable across a range of different tissue types, a major limitation of reference-free deconvolution methods is that they are incapable of resolving the specific identity of the individual cell types for which deconvolution estimates are obtained. For this reason and because the identities of individual cell types are often of interest themselves (Koestler et al., 2017; Wiencke et al., 2017; Grieshober et al., 2018; Grieshober et al., 2021), reference-based deconvolution methods are often preferred over reference-free approaches when cell-specific methylation signatures are available for the cell types expected to be present in the tissue source being used for DNAm assessment. Reference-based methods use reference signatures of DNAm for the underlying cell types that make up a sample (reference libraries) (Houseman et al., 2012; Newman et al., 2015; Koestler et al., 2016; Teschendorff et al., 2017). Several reference-based methods for deconvoluting DNAm data have been proposed in recent years, including support vector regression (CIBERSORT), robust partial correlation (EpiDish), and constrained projection/quadratic programming (Houseman et al., 2012; Newman et al., 2015; Teschendorff et al., 2017). While the specific statistical method used for CMD has some impact on the accuracy of cell proportion estimates, the major factor underlying the performance of these methods is the reference library, or collection of cell-specific differentially methylated loci (DML), used as the basis for deconvolution (Koestler et al., 2016; Teschendorff et al., 2017; Titus et al., 2017). Reference libraries that result in accurate deconvolution estimates are comprised of cell-specific methylation biomarkers that exhibit distinct patterns of methylation across cell types.
To date, there have been several approaches for constructing reference libraries for DNAm-based CMD. The first approach assembles libraries using the
Motivated by the shortcomings of these existing approaches, we propose an algorithm for reference library selection without a training dataset (RESET) that does not require users to choose the size of the reference library in advance, nor does it require a training data set like IDOL. Our approach is further driven by the desire to save researchers time and money; since a training data set does not need to be acquired or updated every time the reference signature for a new cell type becomes available. Further, choosing a reference library size in advance is an arbitrary decision that does not guarantee the quality of a library. RESET is similar in principle to IDOL but utilizes a modified version of the Dispersion Separability Criteria (DSC) as a metric for evaluating and ranking potential reference libraries for reference-based deconvolution. The Cancer Genome Atlas originally developed the DSC for detecting batch effects as a measure of the between vs. within batch dispersion (Akbani et al., 2020). We hypothesize that higher values of this metric correspond to better discrimination across cell types and, as a consequence, better prediction performance when used for reference-based deconvolution. In what follows, we first describe our Modified DSC metric and the proposed RESET framework for identifying reference libraries. We benchmark the performance of RESET compared to the Legacy method using three publicly available data sets across a range of different parameter settings. Next, we explore the impact that different libraries have on the operating characteristics of EWAS, using both simulations and data applications involving two publicly available data sets. We finish with a discussion of our findings, limitations of our study, and opportunities for future work.
Materials and Methods
In what follows, we describe the materials and methods used in this research. Figure 1 provides a workflow that summarizes the data sets used and analyses that were performed.
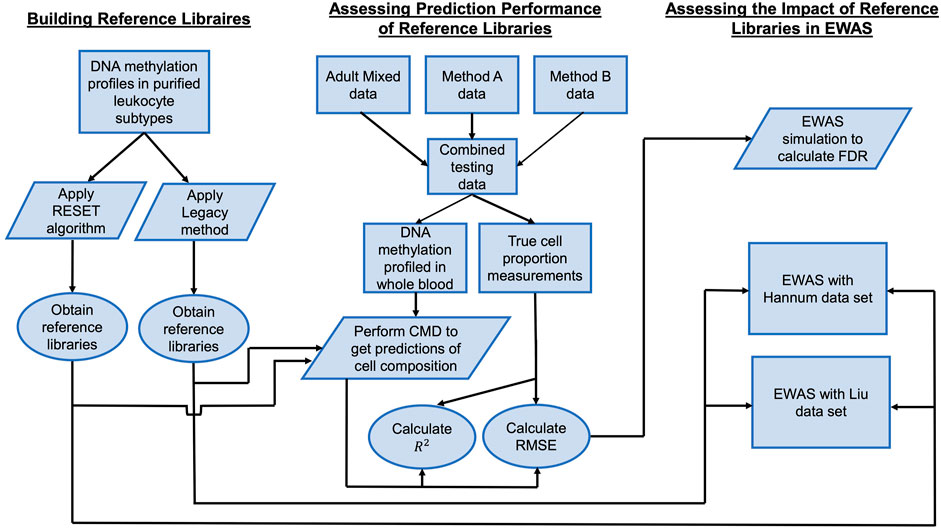
FIGURE 1. Analytical workflow. A workflow for describing the data sets used and analyses that were performed.
Cell Mixture Deconvolution
Before we introduce our proposed method, we first provide a brief description of cell mixture deconvolution. Let
where
subject to the above-mentioned constraints on
CMD is made possible by leveraging the unique methylation signature of each cell type, which is reflected in the columns of M. However, as previously described, the accuracy of cell proportion estimates,
Modified Dispersion Separability Criteria
To be able to perform CMD with high accuracy when the true cell proportions are not known, we need a metric that identifies
where
To address such challenges, we propose a metric for assembling reference libraries for CMD that involves a slight modification of the DSC. We define the Modified DSC as follows:
where
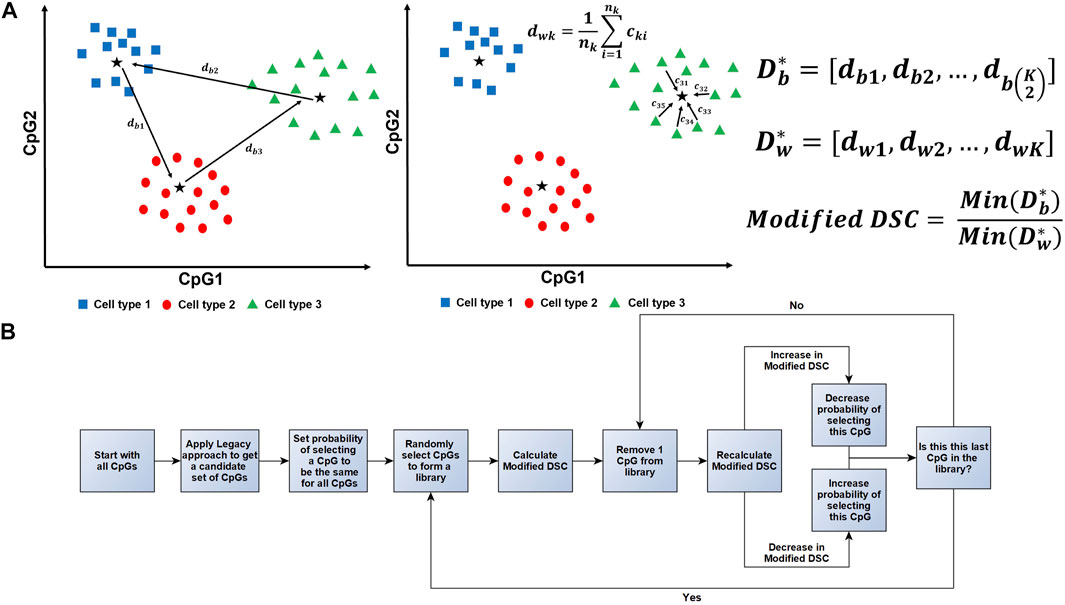
FIGURE 2. Illustration of the Modified DSC Calculation and Workflow. (A) A conceptual illustration of how the Modified DSC is calculated assuming three different cell types and two CpGs. (A, Left)
Algorithm for RESET Utilizing the Modified DSC Metric
The below algorithm was taken from Koestler et al. (2016) and adjusted to utilize the Modified DSC when a training data set is not available (Koestler et al., 2016). A further illustration of this algorithm can be found in Figure 2B.
Step 0: Assembling a candidate reference library:
a. Fit a series of two-sample t-tests to the J CpGs to compare mean methylation (beta-values) between each cell type against the mean beta-values across the remaining K-1 cell types.
b. Identify
c. Create a set of CpGs, Q, identified in (b). Specifically, Q is comprised of P = LK DMLs and makes up the candidate search space for the subsequent steps.
It should be noted that the choice of L is completely arbitrary, and trade-offs must be made depending on how large L is chosen to be. Large values of L broaden the search space for possible cell-specific DMLs, but also increase the computational burden in downstream steps. Small values of L correspond to less computational burden but risk excluding viable cell-specific DMLs.
Step 1: Random assembly of reference libraries:
a. At iteration
b. Let
Note that
Step 2: Calculation of the Modified DSC using the randomly assembled library:
a. Using the random library
Step 3: Assessing the contribution of each CpG to the Modified DSC using leave-one-out procedure:
a. Each of the
b. Step 2 is repeated for each reduced library
In subsequent iterations, we seek to retain CpGs whose inclusion in the reference library results in large values of the Modified DSC. Calculating
Step 4: Updating selection probabilities:
a. For each of the
Thus, the greater the contribution CpG j has on the value of the Modified DSC, the more influence it has on the probability of being selected in future iterations. More specifically, if removing CpG j from
b. After the probabilities for the
Step 5: Continue iteration: Using the updated probabilities,
Datasets
We now describe the DNA methylation array data sets used for this research. For more information about how the data was preprocessed and what measures were taken to ensure quality control, we refer readers to Koestler et al. (2016).
Cell Mixture Reconstruction Experiment
Purified cells taken from normal human subjects were purchased from AllCells LLC (Emeryville, CA). Namely, granulocytes, monocytes, CD4T, CD8T, natural killer, and B cells. DNA was extracted from the purified blood leukocyte subtypes, dsDNA was quantified, and then DNA extracted from purified leukocyte subtypes were mixed in preplanned proportions to reconstruct two different sets with n = 6 samples in each. One set of samples was reconstructed to contain similar proportions of the purified leukocyte subtypes. In contrast, the other was reconstructed to resemble the proportions in normal human adults’ peripheral blood. We will refer to these data sets as MethodA and MethodB, respectively. These DNA samples were bisulfite modified, and epigenome-wide DNA methylation assessment was done using the Illumina HumanMethylation450 array platform (Koestler et al., 2016). These data are publicly available in the Gene Expression Omnibus (GEO) repository (GEO Accession ID: GSE77797).
Adult Whole Blood Samples
Another n = 6 whole blood (WB) samples were taken from healthy adult donors. Immune cell profiling data for these samples, gathered from flow cytometry, were procured from AlCells LLC. We will refer to this data set as AdultMixed. This data set followed the same protocol as above and was assayed using the Illumina HumanMethylation450 array platform (Koestler et al., 2016). These data are publicly available (GEO Accession ID: GSE77797).
Reference DNA Methylomes for Isolated Leukocyte Subtypes
A publicly available dataset (GEO Accession ID: GSE35069) was used to identify cell-type-specific DMLs and for the construction of reference libraries for CMD. This data set is comprised of epigenome-wide DNA methylation profiles in purified leukocyte subtypes (the same six leukocytes described above) in n = 6 healthy non-diseased subjects. We will refer to this data set as the Reference data set. Further details about this data set can be found elsewhere (Reinius et al., 2012).
Additional DNA Methylation Data Sets
We also used two large publicly available blood-derived DNA methylation data sets (GEO Accession IDs: GSE42861 and GSE40279). Together, these two data sets are comprised of whole-blood DNA methylation data on more than 1,200 adult subjects. The purpose of these data sets was to better understand the implications of the method/technique used for assembling reference libraries for CMD in terms of an EWAS. The Liu dataset (GEO Accession ID: GSE42861) consists of blood-derived DNA methylation data on 689 human subjects, of which n = 354 were rheumatoid arthritis cases, and n = 335 were non-diseased control patients (Liu et al., 2013). The Hannum data set (GEO Accession ID: GSE40279) consists of blood-derived DNA methylation on 656 non-diseased patients (Hannum et al., 2013). Epigenome-wide DNA methylation assessment was done using the Illumina HumanMethylation450 array platform for both data sets.
Application and Assessment of the Modified DSC Metric
Proof-Of-Principle Example to Illustrate the Modified DSC Metric
To examine our hypothesis that larger values of the Modified DSC reflect libraries that better discriminate cell types, we conducted a proof-of-principle simulation study where we simulated data under different circumstances and calculated the Modified DSC. We simulated 100 features for three different cell types with six samples of each cell type. We allowed the percentage of features that exhibit a difference across the cell types to vary between 0% and 100%. We further allowed for the magnitude of the difference in the mean feature values to vary between 1 and 10 for each cell type. Let
Training the Algorithm
To examine the performance of RESET, we conducted an analysis of several publicly available data sets and benchmarked the accuracy of deconvolution estimates obtained using RESET against the Legacy approach. To do this, we first applied our approach using the Reference data set to identify “optimal” reference libraries for deconvoluting WB mixtures. As previously described, the reference data set is comprised of DNA methylation profiles for granulocytes, monocytes, CD4T, CD8T, natural killer, and B cells in n = 6 subjects. To get a candidate list of CpGs, we first applied the Legacy approach to the broader reference data set. We specified L to be 50, giving us the top 50 hyper and hypomethylated CpGs for each cell type for a total of 1800 CpGs (
Validation of the Identified Reference Libraries
To validate RESET, we applied CMD to three independent testing sets (MethodA, MethodB, AdultMixed) using the libraries identified using the RESET algorithm. These data sets were selected since the underlying leukocyte fractions are known for each sample. Figure 4A illustrates the differing cell-type proportions across the three testing data sets.
To assess the performance of our method and the Legacy approach, we first estimated the proportion of variation of the known mixture fractions explained by the cell type predictions (
Simulation Study Comparing the FDR
To explore the implications of prediction error in cell proportion estimates for EWAS, we conducted a simulation study in which the false discovery rate (FDR) was calculated for cell composition adjusted EWAS, where cell composition estimates were based on differing methods/approaches for library selection. We implemented a study design that is common to many EWAS, in which the goal is to identify differently methylated CpGs between two groups of samples (
For this simulation study, we assumed that the methylation beta-value for CpG j for sample i, that is
Here,
To check how cell proportion prediction errors estimated using the RESET and Legacy libraries affect the FDR of hypothesis tests (
Data Application and Implications for EWAS
We finally used the Liu and Hannum data sets described above to understand the implications of the Legacy approach and the RESET algorithm on cell type prediction for EWAS (Hannum et al., 2013; Liu et al., 2013). Specifically, an analysis of these blood-derived DNA methylation data sets was done to see which method performed better in explaining variation in DNA methylation. To do this, we started by using CMD for estimating cell proportions in the two data sets using the reference libraries identified using the RESET method, as well as the libraries identified using the Legacy approach. For each data set, linear regression models were fit to the J total CpGs independently, modeling beta-values as the response against the predicted cell proportions. Using the fitted models, we found the proportion of variation in methylation explained by the cell mixture proportion estimates using both methodologies (
Results
Proof-Of-Principle Example to Illustrate the Modified DSC Metric
To rationalize the use of the Modified DSC as a metric for identifying sets of CpGs which discriminate well between cell types, we simulated cell-specific methylation data with varying degrees of differences and calculated the Modified DSC. Recall that we allowed the percentage of features that exhibit a difference across the cell types to vary as well as allowing the magnitude of the difference in mean methylation to vary across cell types. Each of these differences gave us a new cell-specific methylation data set. We hypothesized that higher values of the Modified DSC result in reference libraries that better discriminate the cell types. Figure 3A shows the results for the 210 different simulated data sets. As the number of features/CpGs that exhibit a difference between cell types increases, and the magnitude of this difference increases, the value of the Modified DSC gets larger. The minimum Modified DSC value of 0.580 occurred when 0% of the 100 features were simulated to exhibit a difference across the three cell types. The maximum DSC value of 15.252 occurred when 90% of the 100 features were simulated to exhibit a difference across the cell types with a magnitude of 10, the largest possible magnitude difference considered in our simulation study. To further demonstrate the utility of the Modified DSC for building reference libraries for cell mixture deconvolution, we looked at heat maps of the simulated data and plots of the first two principal components (PCs) calculated from a principal components analysis (PCA) of the simulated data at various degrees of differences. Figure 3B depicts the data that were simulated to exhibit no difference in feature/CpG values across the three cell types. Not surprisingly, the heat map shows no discernible difference between cell signatures. Further, no discernable clustering samples by cell type are evident in the plot of PC1 by PC2. The value of the Modified DSC for this data set is 0.580. Figure 3C depicts the data set where 50% of the features/CpGs were simulated to exhibit a magnitude difference of 5 between the three cell types. The heat map shows some differences in the signatures across cell types, and the plot of PC1 by PC2 shows a clear separation of samples by cell type. The value of the Modified DSC for this data is 5.443. Finally, Figure 3D depicts the data that were simulated to exhibit a difference in 100% of the features/CpGs, with that difference being 10. The heatmap shows clear cell-type-specific signatures, and the plot of PC1 by PC2 shows even more separation in the clusters of cell types (take note of the scale of the x- and y-axis in the PC-plots between Figures 3C,D).
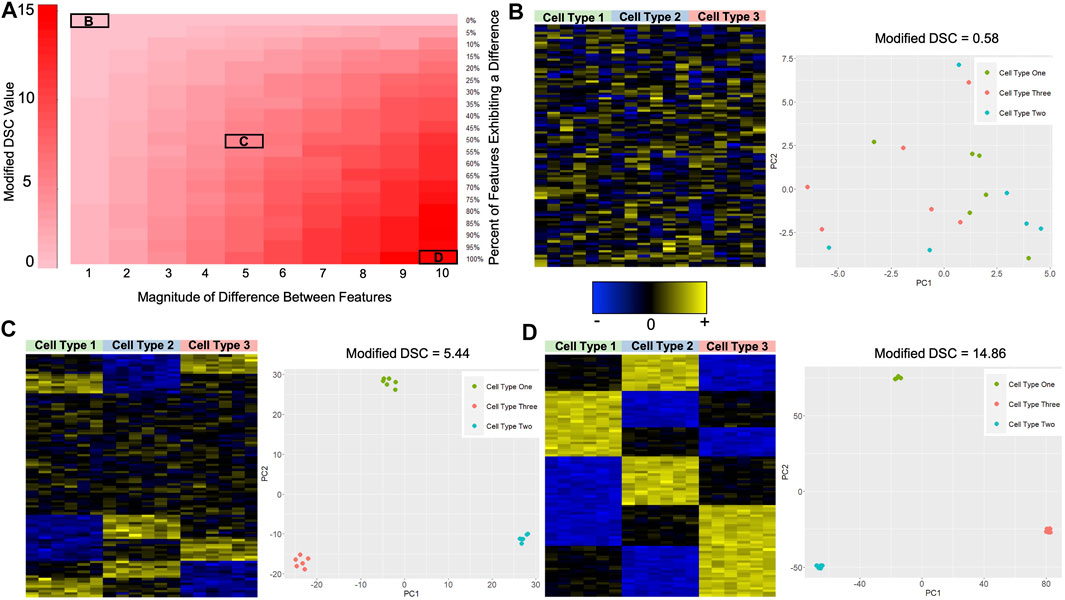
FIGURE 3. Proof-of-Principle Illustration of the Modified DSC Metric. (A) Heat map showing the value of the Modified DSC under the different data scenarios as described in section 2.5.1. The y-axis shows the percent of features that were simulated to exhibit a difference in the mean feature(s) value across cell types, and the x-axis reflects the magnitude of the difference between the mean feature(s) values across cell types. Darker red indicates higher values of the Modified DSC. (B) Heat map and PCA plot for the simulated data where no features exhibited a difference in the mean feature(s) values across cell types. The value of the modified DSC for this simulated data is also provided. (C) Heat map and PCA plot for the simulated data where 50% of the features exhibited a difference in mean feature(s) values across cell types with a magnitude of 5 (i.e.,
Validation of the Optimal Reference Libraries
As mentioned previously, to validate the reference libraries identified by RESET, we examined CMD prediction performance by calculating
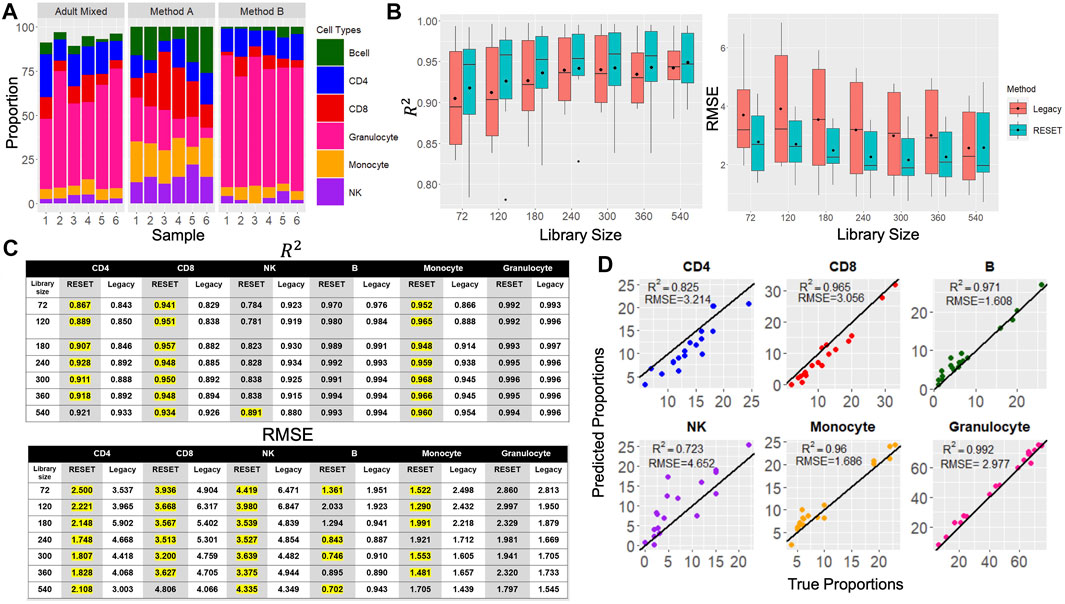
FIGURE 4. Results from RESET and Legacy Approach. (A) True cell-type proportions for the three independent data sets used to generate predictions for the RESET and Legacy approaches. Each data set is comprised of six samples and the same six leucocyte subtypes. (B) Box plots showing the
Prediction performance for RESET and the Legacy method was evaluated for several different library sizes (
Cell-type-specific
In addition to comparing the
When the reference library size was chosen randomly, RESET identified a library with 54 CpGs. That is, the library size that resulted in the largest value of the Modified DSC was comprised of 54 loci. The prediction performance was evaluated using the same three previous testing data sets. Even with so few CpGs, this library still had an average
Simulation Study Comparing FDR
The validation results showed that the libraries identified by RESET were overall only marginally better than those identified by the Legacy approach; however, prediction performance is often not an end in itself but rather a means to an end. Specifically, the cell proportion estimates identified from these libraries are often used for cell-type adjustment in downstream statistical analysis. As such, we performed a simulation to explore the consequences of prediction error in cell proportion estimates for EWAS (Figure 5A, top two plots). We conducted a simulation study where methylation beta values were simulated for two groups, 1,000 CpGs, and assuming both moderate and large within-group sample size (n = 100, 500, respectively). Additionally, the cellular composition varied across groups while the cell types were simulated to have no difference between groups. When adjustments for cell composition were made using the true simulated cell proportions, the FDR was controlled at 5% as expected. When no adjustments for cell composition were made, there was large inflation in the FDR, which increased as a function of increasing cell composition dissimilarity between groups. When n1 = n2 = 100, the FDR was controlled at 5% when adjustments for cell composition were made using both RESET and the Legacy approach. However, when n1 = n2 = 500, there was slight inflation in the FDR using the Legacy approach while it remained controlled at 5% when using RESET. Additionally, the bottom two plots of Figure 5A show the difference in FDR from the Legacy approach and our approach. RESET, on average, resulted in fewer false positives compared to the Legacy approach across the different simulation conditions.
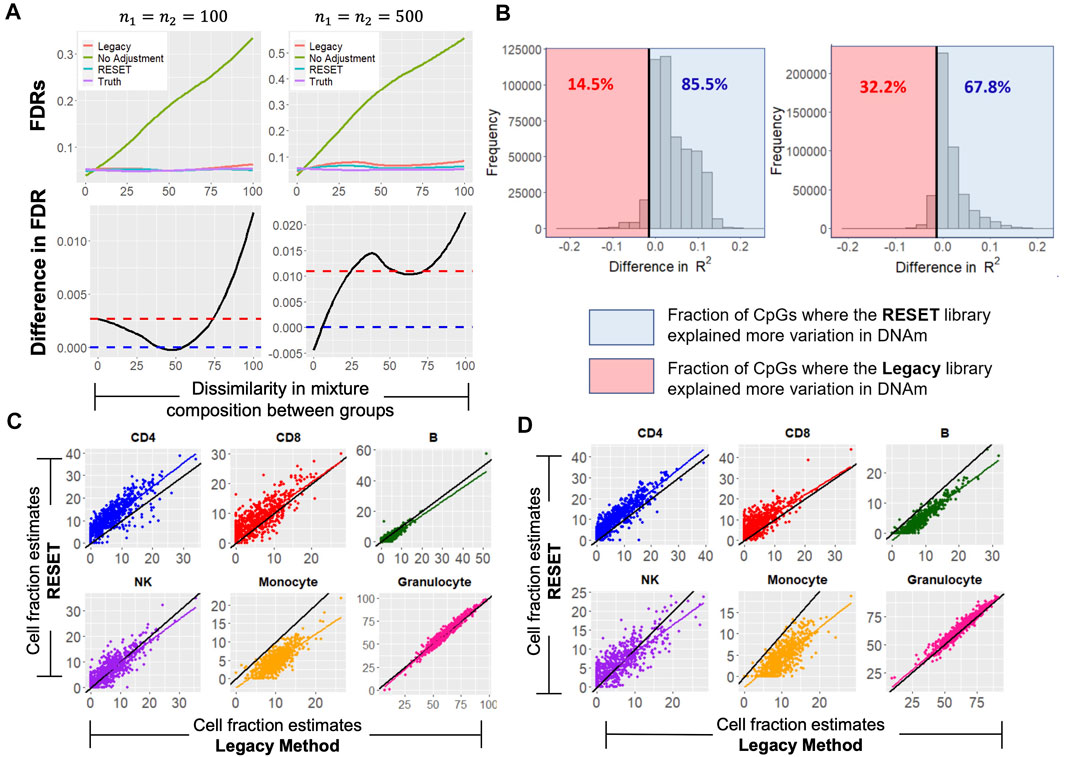
FIGURE 5. FDR Simulation Results and Data Application Results for the DML Reference Library of Size 120. (A) Results from the FDR simulation to explore implications of prediction error in cell proportion estimates for EWAS as described in section 2.5.4. The top panel shows the estimates of the FDR for the two-group comparison of methylation as a function of the dissimilarity in the distribution of cell-type composition between the two groups. The FDRs were estimated under four methods/approaches for cell composition adjustment. The bottom panel shows the difference in FDR estimates when cell type estimation was undertaken using the Legacy library versus the RESET library. Points that lie above the blue dotted line signify that the Legacy library resulted in more false-positive results as compared to the RESET. The red dotted line shows the mean difference in FDR between the Legacy library and the RESET library. A loess smoother was used to generate these curves. (B) Distribution of the difference in
Data Application and Implications for EWAS
In addition to using the above simulation study, we also made use of two publicly available data sets to better understand the consequences of the approach used for reference library construction in the context of EWAS. All fixed reference libraries that were previously identified were applied to the Lui and Hannum data sets (Hannum et al., 2013; Liu et al., 2013) to see which libraries led to a better explanation in the variation in DNA methylation (
Discussion
This manuscript described and evaluated an iterative algorithm for assembling libraries for reference-based deconvolution in the absence of a training dataset. The motivation for this research is three-fold. First, the performance of reference-based deconvolution depends heavily on the reference library used as the basis of deconvolution (Koestler et al., 2016; Teschendorff et al., 2017; Titus et al., 2017). Second, in the absence of a training data set, current approaches require users to make arbitrary decisions about the number of DMLs and the library size even though performance is sensitive to these decisions (Houseman et al., 2012; Koestler et al., 2016). Third, emergence and interest in new cell types means that not only will reference libraries need to be updated but training data sets also. If DNAm along with measured cell-type proportions for these new cell types are not available, then IDOL is not possible (Koestler et al., 2016).
Recall that RESET builds DNAm reference libraries by utilizing the Modified DSC. This metric increases in value as clusters of cell-type-specific DNAm data get farther apart from one another and makes it a useful metric for evaluating the quality of a reference library. RESET works by randomly selecting a reference library from a candidate list of CpGs, calculating the Modified DSC, and then iteratively updating the probability of selecting a CpG in future iterations depending on its contribution to the modified DSC. The library which yields the largest value of the Modified DSC after many iterations is the reference library used for deconvolution. As previously described, while the Legacy approach has been previously shown to outperform the ANOVA-based method for library construction (Koestler et al., 2016), its primary shortcoming is that the user needs to prespecify both the total library size and the number of cell-specific DMLs to include in the library. As shown here (Figure 3) and previously (Koestler et al., 2016), the accuracy of corresponding deconvolution estimates is sensitive to these selections, with the
While our results showed a modest improvement in the average
While our method resulted in improved accuracy of reference-based deconvolution estimates, lower FDR, and more variability in CpG-specific methylation explained in the context of EWAS adjusted for cell composition, RESET, and this study are not without limitations. The data sets used to build the reference libraries and benchmark the performance of our approach against the Legacy method only consisted of relative fractions of the six major leukocyte components of whole blood (e.g., CD4T, CD8T, B cells, NK cells, monocytes, and granulocytes), despite there being a myriad of other cell types and specific states of cells present in whole blood. In DNA methylation data, the main source of variability between isolated cell types is captured in the first two dimensions of the data. The Legacy approach exploits this fact using a fixed number of differentially methylated sites (usually 100 per cell-type) to capture that variability. However, as the cell lineages diverge, cell specialization drifts the epigenetic marks in a smaller proportion of CpGs. This translates into cell states/subtypes that are challenging to discern using surface/nuclear markers or even functional essays. As such, these states/subtypes fall closer to each other, rendering the assumption of a fixed number of sites untenable. Our algorithm makes no such assumption, and we hypothesize that our method will further outperform the Legacy approach in these situations. Additionally, while five independent data sets were used to evaluate and benchmark the performance of RESET, we note that data sets containing both DNA methylation data and gold-standard measurements of cell composition (e.g., flow cytometry) in the same set of samples are relatively rare, limiting the number of viable data sets to use in our comparisons. Further, only seven different fixed reference library sizes were considered in our evaluation (
This research was motivated by the need for accounting for cellular landscape when DNA methylation is analyzed in heterogeneous tissue, and further, by the need to remove requirements and arbitrary decisions other methods need in order to build reference libraries for the purpose of reference-based cell mixture deconvolution. Future work includes improving the accuracy of cell proportion estimates in the absence of a training data set by considering different distance metrics, building reference libraries for tissue types, and extending this algorithm to explore performance in samples with more than six cell types. The utilization of RESET will allow researchers to save money and remove arbitrary decisions in the reference library selection process while maintaining accuracy. RESET introduces a new way of thinking for the future of reference library selection in the absence of a training data set and is a useful approach for library construction for EWAS.
Data Availability Statement
The R scripts for the analyses presented here are available on GitHub at https://github.com/ShelbyBellGlenn/RESET_Code. The data sets used are all publicly available through GEO.
Author Contributions
SB-G. conceived the statistical framework for selecting reference libraries for reference-based cell mixture deconvolution, performed the statistical analyses to evaluate and assess the proposed framework, and participated in the drafting and review of the manuscript. JT and LS helped direct the statistical analyses, contributed to the interpretation of study findings, and assisted in manuscript writing and development. DK helped to conceive the statistical framework the statistical framework for selecting reference libraries for reference-based cell mixture deconvolution, provided R code for some of the statistical analyses, provided guidance and direction in the evaluation and assessment of the method, and assisted in manuscript writing and development.
Funding
Research reported was supported by: the National Cancer Institute (NCI) Cancer Center Support Grant P30 CA168524; the Kansas IDeA Network of Biomedical Research Excellence Bioinformatics Core, supported by the National Institute of General Medical Science award P20 GM103418; the Kansas Institute for Precision Medicine COBRE, supported by the National Institute of General Medical Science award P20 GM130423. LS. was supported by CDMRP/Department of Defense (W81XWH-20-1-0778) and NIGMS (P20GM104416-09/8299).
Conflict of Interest
The authors declare that the research was conducted in the absence of any commercial or financial relationships that could be construed as a potential conflict of interest.
Publisher’s Note
All claims expressed in this article are solely those of the authors and do not necessarily represent those of their affiliated organizations, or those of the publisher, the editors and the reviewers. Any product that may be evaluated in this article, or claim that may be made by its manufacturer, is not guaranteed or endorsed by the publisher.
Acknowledgments
In addition, we would like to extend our gratitude to members of the Statistical Omics Working Group in the Department of Biostatistics and Data Science at the University of Kansas Medical Center for their constructive feedback on this manuscript. In particular, a special thanks to: Alexander Alsup, Lisa Neums, Shachi Patel, Qing Xia, Whitney Shae, Bo Zhang, Samuel Boyd, Emily Nissen, Jonah Amponsah, Dr. Prabhakar Chalise, Dr. Jinxiang Hu, Dr. Lynn Chollet-Hinton, Dr. Nanda Yellapu, Dr. Dong Pei, and Dr. Mihaela Sardiu.
Supplementary Material
The Supplementary Material for this article can be found online at: https://www.frontiersin.org/articles/10.3389/fbinf.2022.835591/full#supplementary-material
Abbreviations
CMD, Cell Mixture Deconvolution; DML, Differentially Methylated Loci; DNAm, DNA methylation; DSC, Dispersion Separability Criterion; FDR, False Discovery Rate; EWAS, Epigenome Wide Association Studies; RESET, Reference Library Selection without a Training Dataset; RMSE, Root Mean Squared Error.
References
Akbani, R., Bradley, N. Z., Broom, M., John, N., Weinstein Tod, D., Casasent James, M., et al. (2020). Allen T. Chang. TCGA Batch Effects Viewer. Available at: https://bioinformatics.mdanderson.org/public-software/tcga-batch-effects/.
Aryee, M. J., Jaffe, A. E., Corrada-Bravo, H., Ladd-Acosta, C., Feinberg, A. P., Hansen, K. D., et al. (2014). Minfi: a Flexible and Comprehensive Bioconductor Package for the Analysis of Infinium DNA Methylation Microarrays. Bioinformatics 30 (10), 1363–1369. doi:10.1093/bioinformatics/btu049
Decamps, C., Privé, F., Bacher, R., Jost, D., Waguet, A., et al. (2020). Guidelines for Cell-type Heterogeneity Quantification Based on a Comparative Analysis of Reference-free DNA Methylation Deconvolution Software. BMC Bioinformatics 21 (1), 16. doi:10.1186/s12859-019-3307-2
Dy, J. G. C. E. B. (2004). Feature Selection for Unsupervised Learning. J. machine Learn. Res. 5, 845–899.
Flanagan, J. M. (2015). Epigenome-wide Association Studies (EWAS): Past, Present, and Future. Methods Mol. Biol. 1238, 51–63. doi:10.1007/978-1-4939-1804-1_3
Grieshober, L., Graw, S., Barnett, M. J., Goodman, G. E., Chen, C., Koestler, D. C., et al. (2021). Pre-diagnosis Neutrophil-To-Lymphocyte Ratio and Mortality in Individuals Who Develop Lung Cancer. Cancer Causes Control 32 (11), 1227–1236. doi:10.1007/s10552-021-01469-3
Grieshober, L., Graw, S., Barnett, M. J., Thornquist, M. D., Goodman, G. E., Chen, C., et al. (2018). Methylation-derived Neutrophil-To-Lymphocyte Ratio and Lung Cancer Risk in Heavy Smokers. Cancer Prev. Res. (Phila) 11 (11), 727–734. doi:10.1158/1940-6207.CAPR-18-0111
Hannum, G., Guinney, J., Zhao, L., Zhang, L., Hughes, G., Sadda, S., et al. (2013). Genome-wide Methylation Profiles Reveal Quantitative Views of Human Aging Rates. Mol. Cel 49 (2), 359–367. doi:10.1016/j.molcel.2012.10.016
Houseman, E. A., Accomando, W. P., Koestler, D. C., Christensen, B. C., Marsit, C. J., Nelson, H. H., et al. (2012). DNA Methylation Arrays as Surrogate Measures of Cell Mixture Distribution. BMC Bioinformatics 13, 86. doi:10.1186/1471-2105-13-86
Houseman, E. A., Kile, M. L., Christiani, D. C., Ince, T. A., Kelsey, K. T., and Marsit, C. J. (2016). Reference-free Deconvolution of DNA Methylation Data and Mediation by Cell Composition Effects. BMC Bioinformatics 17, 259. doi:10.1186/s12859-016-1140-4
Houseman, E. A., Kim, S., Kelsey, K. T., and Wiencke, J. K. (2015). DNA Methylation in Whole Blood: Uses and Challenges. Curr. Environ. Health Rep. 2 (2), 145–154. doi:10.1007/s40572-015-0050-3
Jaffe, A. E., and Irizarry, R. A. (2014). Accounting for Cellular Heterogeneity Is Critical in Epigenome-wide Association Studies. Genome Biol. 15 (2), R31. p. R31. doi:10.1186/gb-2014-15-2-r31
Koestler, D. C., Jones, M. J., Usset, J., Christensen, B. C., Butler, R. A., Kobor, M. S., et al. (2016). Improving Cell Mixture Deconvolution by Identifying Optimal DNA Methylation Libraries (IDOL). BMC Bioinformatics 17, 120. doi:10.1186/s12859-016-0943-7
Koestler, D. C., Usset, J., Christensen, B. C., Marsit, C. J., Karagas, M. R., Kelsey, K. T., et al. (2017). DNA Methylation-Derived Neutrophil-To-Lymphocyte Ratio: An Epigenetic Tool to Explore Cancer Inflammation and Outcomes. Cancer Epidemiol. Biomarkers Prev. 26 (3), 328–338. doi:10.1158/1055-9965.EPI-16-0461
Liang, L., and Cookson, W. O. (2014). Grasping Nettles: Cellular Heterogeneity and Other Confounders in Epigenome-wide Association Studies. Hum. Mol. Genet. 23, R83–R88. (R1): p. R83-8. doi:10.1093/hmg/ddu284
Liu, Y., Aryee, M. J., Padyukov, L., Fallin, M. D., Hesselberg, E., Runarsson, A., et al. (2013). Epigenome-wide Association Data Implicate DNA Methylation as an Intermediary of Genetic Risk in Rheumatoid Arthritis. Nat. Biotechnol. 31 (2), 142–147. doi:10.1038/nbt.2487
Michels, K. B., Binder, A. M., Dedeurwaerder, S., Epstein, C. B., Greally, J. M., Gut, I., et al. (2013). Recommendations for the Design and Analysis of Epigenome-wide Association Studies. Nat. Methods 10 (10), 949–955. doi:10.1038/nmeth.2632
Mirkes, E. M., Allohibi, J., and Gorban, A. (2020). Fractional Norms and Quasinorms Do Not Help to Overcome the Curse of Dimensionality. Entropy (Basel) 22. Basel22(10). doi:10.3390/e22101105
Newman, A. M., Liu, C. L., Green, M. R., Gentles, A. J., Feng, W., Xu, Y., et al. (2015). Robust Enumeration of Cell Subsets from Tissue Expression Profiles. Nat. Methods 12 (5), 453–457. doi:10.1038/nmeth.3337
Rakyan, V. K., Down, T. A., Balding, D. J., and Beck, S. (2011). Epigenome-wide Association Studies for Common Human Diseases. Nat. Rev. Genet. 12 (8), 529–541. doi:10.1038/nrg3000
Reinius, L. E., Acevedo, N., Joerink, M., Pershagen, G., Dahlén, S. E., Greco, D., et al. (2012). Differential DNA Methylation in Purified Human Blood Cells: Implications for Cell Lineage and Studies on Disease Susceptibility. PLoS One 7, e41361. p. e41361. doi:10.1371/journal.pone.0041361
Salas, L. A., Koestler, D. C., Butler, R. A., Hansen, H. M., Wiencke, J. K., Kelsey, K. T., et al. (2018). An Optimized Library for Reference-Based Deconvolution of Whole-Blood Biospecimens Assayed Using the Illumina HumanMethylationEPIC BeadArray. Genome Biol. 19 (1), 64. doi:10.1186/s13059-018-1448-7
Sarkar, S., and Ghosh, A. K. (2020). On Perfect Clustering of High Dimension, Low Sample Size Data. IEEE Trans. Pattern Anal. Mach Intell. 42 (9), 2257–2272. doi:10.1109/TPAMI.2019.2912599
Scherer, M., Nazarov, P. V., Toth, R., Sahay, S., Kaoma, T., Maurer, V., et al. (2020). Reference-free Deconvolution, Visualization and Interpretation of Complex DNA Methylation Data Using DecompPipeline, MeDeCom and FactorViz. Nat. Protoc. 15 (10), 3240–3263. doi:10.1038/s41596-020-0369-6
Teschendorff, A. E., Breeze, C. E., Zheng, S. C., and Beck, S. (2017). A Comparison of Reference-Based Algorithms for Correcting Cell-type Heterogeneity in Epigenome-wide Association Studies. BMC Bioinformatics 18 (1), 105. doi:10.1186/s12859-017-1511-5
Titus, A. J., Gallimore, R. M., Salas, L. A., and Christensen, B. C. (2017). Cell-type Deconvolution from DNA Methylation: a Review of Recent Applications. Hum. Mol. Genet. 26, R216. (R2): p. R216-R224. doi:10.1093/hmg/ddx275
Keywords: reference-based deconvolution, IDOL, cell heterogeneity, cell proportion estimation, DNA methylation, EWAS
Citation: Bell-Glenn S, Thompson JA, Salas LA and Koestler DC (2022) A Novel Framework for the Identification of Reference DNA Methylation Libraries for Reference-Based Deconvolution of Cellular Mixtures. Front. Bioinform. 2:835591. doi: 10.3389/fbinf.2022.835591
Received: 14 December 2021; Accepted: 15 February 2022;
Published: 21 March 2022.
Edited by:
Christine Nardini, National Research Council (CNR), ItalyReviewed by:
Jin-Xing Liu, Qufu Normal University, ChinaYongchun Zuo, Inner Mongolia University, China
Copyright © 2022 Bell-Glenn, Thompson, Salas and Koestler. This is an open-access article distributed under the terms of the Creative Commons Attribution License (CC BY). The use, distribution or reproduction in other forums is permitted, provided the original author(s) and the copyright owner(s) are credited and that the original publication in this journal is cited, in accordance with accepted academic practice. No use, distribution or reproduction is permitted which does not comply with these terms.
*Correspondence: Devin C. Koestler, dkoestler@kumc.edu