EW[OIII] as an Orientation Indicator for Quasars: Implications for the Torus
 Susanna Bisogni
 Alessandro Marconi
 Guido Risaliti2,3
 - 1Harvard-Smithsonian Center for Astrophysics, Cambridge, MA, United States
- 2Osservatorio Astrofisico di Arcetri, INAF, Florence, Italy
- 3Dipartimento di Fisica e Astronomia, Università degli Studi di Firenze, Florence, Italy
- 4Centre for Extragalactic Astronomy, Department of Physics, Durham University, Durham, United Kingdom
We present an analysis of the average spectral properties of 12,000 SDSS quasars as a function of accretion disc inclination, as measured from the equivalent width of the [OIII] 5007Å line. The use of this indicator on a large sample of quasars from the SDSS DR7 has proven the presence of orientation effects on the features of UV/optical spectra, confirming the presence of outflows in the NLR gas and that the geometry of the BLR is disc-like. Relying on the goodness of this indicator, we are now using it to investigate other bands/components of AGN. Specifically, the study of the UV/optical/IR SED of the same sample provides information on the obscuring “torus.” The SED shows a decrease of the IR fraction moving from face-on to edge-on sources, in agreement with models where the torus is co-axial with the accretion disc. Moreover, the fact we are able to observe the broad emission lines also in sources in an edge-on position, suggests that the torus is rather clumpy than smooth as in the Unified Model. The behavior of the SED as a function of EW[OIII] is in agreement with the predictions of the clumpy torus models as well.
1. Introduction
The fact we are not able to spatially resolve the inner regions of Active Galactic Nuclei (AGN), combined with their axisymmetric geometry (Antonucci and Miller, 1985; Antonucci, 1993), can make it difficult to interpret their emissions. The Unified Model predicts the orientation to be one of the main drivers of the diversification in quasars spectra. For this reason, an indicator of the inclination of the source with respect the line of sight of the observer is essential to get further in studying these objects.
Despite several quasars properties have been found to provide information on the inclination of the inner nucleus (Wills and Browne, 1986; Wills and Brotherton, 1995; Boroson, 2011; Decarli et al., 2011; Van Gorkom et al., 2015), we still lack an univocal measurement of this quantity. This problem is even harder when dealing with not-jetted objects, the most among quasars (>90%, Padovani, 2011), for which we can not rely on the presence of the strongly collimated radio-jets, directed perpendicularly to the accretion disc.
In order to give a more accurate description of the components surrounding the central engine and to understand where are the boundaries between one and another, we need to know which components are being intercepted by our line of sight.
Assuming that some of these inner components are characterized by a spherical geometry can often simplify the scenario, while at the same time misleading us. We use the emission lines coming from the Broad Line Region (BLR) to give an estimate of the mass of the central Super Massive Black Hole (SMBH), but in doing that we do not take properly into consideration the geometry of the BLR, i.e., we use an average virial factor f to account for the uknown in the geometry and kinematics of the emitting region and we overlook the effects of orientation on the emission lines (Jarvis and McLure, 2006; Shen, 2013). These measurements can then be used in turn to examine the relations between the SMBH and their host galaxies—one of the few tools available to understand the connection between structures on such different spatial scales—their uncertainties affecting these studies (e.g., Shen and Kelly, 2010). If the BLR is characterized by a non-spherical geometry we are sistematically underestimating the BH masses in all the sources in which the velocity we intercept, i.e., the line width we measure, is only a fraction of the intrinsic velocity of the emitting gas orbiting around the SMBH. The inclination of the source with respect to the line of sight is therefore crucial to both the understanding of how the nuclei work and how they affect the formation and evolution of galaxies in the Universe. In this proceeding we show recent results on the optical spectra and we present a preliminary result on the Spectral Energy Distribution of quasars, that we obtained using the EW[OIII] as an orientation indicator.
2. Orientation Effects on Emission Features
2.1. Optical Spectra
Based on the properties of the [OIII] 5007Å line—negligibly contaminated by non-AGN processes and coming from the Narrow Line Region (NLR), whose dimensions ensure the isotropy of the emissions (Mulchaey et al., 1994; Heckman et al., 2004)—and on the strong anisotropy of the continuum emitted by the optically-thick/geometrically-thin accretion disc (Shakura and Sunyaev, 1973), we proposed the equivalent width (EW) of the [OIII] line, the ratio between the two luminosities, as an indicator of quasars orientation (Risaliti et al., 2011; Bisogni et al., 2017).
In Risaliti et al. (2011) we examined the distribution of the observed EW[OIII] in a large sample of quasars from the SDSS DR5 (~6, 000) and verified the presence of an orientation effect: the distribution shows a power law tail at the high EW[OIII] values that can not be ascribable to the intrinsic differences in the NLR among different objects, i.e., the intrinsic EW[OIII] distribution, the one we would observe if all the sources were seen in a face-on position. The observed EW[OIII] distribution is a convolution of the intrinsic properties of the NLR emissions in the different objects, such as the ionising continuum and the covering factor of the clouds, and the effects due to their inclination angle.
In Bisogni et al. (2017) we selected a larger sample of objects from the SDSS DR7 (~12,000), this time with the aim of looking for evidences of orientation effects in the optical spectra. We split our sample in six bins of EW[OIII], each one corresponding to an inclination angle range. Within each bin, the spectra were stacked in order to produce a master spectrum. We then analysed both the broad and the narrow emission lines as a function of EW[OIII], i.e., of the inclination angle, finding orientation effects on both of them. Figure 1 shows the presence of orientation effects on the broad component of Hβ: the width of the broad line, either represented by the line dispersion σ, the Full Width Half Maximum (FWHM) or the Inter-Percentile Velocity width (IPV), increases steadily when we move from low to high EW[OIII]. We found the same result for the other broad lines examined (Hα and MgII, see Bisogni et al., 2017 for more details). This behavior is what is expected if the BLR geometry is disc-like and we are moving from sources in a face-on position to sources in an edge-on position.
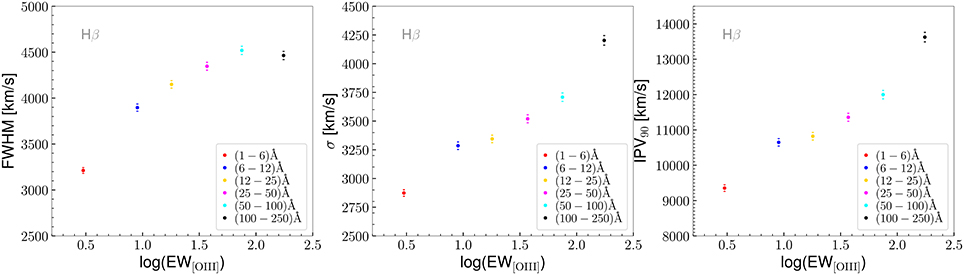
Figure 1. Full Width Half Maximum, Inter-Percentile Velocity width and dispersion σ as a function of the EW[OIII] for the Hβ line. All these quantities, describing the rotational velocity of the gas orbiting around the central SMBH, increase moving from low to high EW[OIII] as expected if the BLR is disc-shaped and we are moving from face-on to edge-on positions.
As for the narrow emission lines, we examined the [OIII] λ5007Å, the most prominent among them in the optical spectrum. This line is known to be contaminated by emissions coming from non-virialized gas, i.e., not orbiting around the central SMBH, but outflowing perpendicularly to the accretion disc (Heckman et al., 1984; Boroson, 2005). If the EW[OIII] is a good indicator of the inclination of the source, we should see the blue component of the line, emitted by outflowing gas, decreasing both in intensity and in velocity shift with respect to the nominal wavelength of the emission moving to high EW[OIII] values. Going from face-on to edge-on position in fact we are not intercepting anymore the outflow perpendicular to the accretion disc. This behavior is found in the [OIII] line profile (Figure 2).
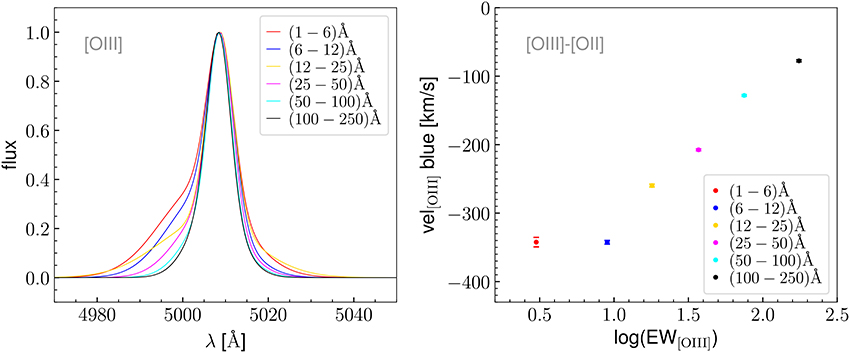
Figure 2. Left: [OIII] 5007Å line profile as a function of EW[OIII]. The blue component of the line decreases moving from low to high EW[OIII]. Right: velocity shift of the blue component of the [OIII] line with respect to the velocity of the [OII] λ3727 line, accounting for the systemic velocity of the host galaxy. The shift is decreasing (in modulus) when moving from low to high EW[OIII]. Both the trends are expected if we are moving from face-on to edge-on positions, where the outflow velocity component of the gas is not intercepted anymore by the line of sight.
We want to stress that within each EW[OIII] bin, therefore within each inclination angle range, the population of quasars is characterized by different SMBH masses, luminosities and accretion rates. These properties are considered among the main drivers of the variance in quasars spectra (Zamanov and Marziani, 2002; Marziani et al., 2003; Shen and Ho, 2014). In our study however, as it is designed, even if the effects produced by these properties are present, they are diluited in the stacked representative spectra. As a confirmation that the orientation, even if not the only driver, plays a major role in the variance of quasars spectra, we found a clear trend of the Eigenvector 1, i.e., the anticorrelation between the FeII and [OIII] emissions intensity that Boroson and Green (1992) identify as the main responsible for quasars spectral variance, with the EW[OIII]. Specifically, when we move from low to high EW[OIII], i.e., from low to high inclination angles, we see the [OIII] intensity increasing, while FeII emission becomes less and less intense. This can be explained in terms of orientation: the BLR shares the same anisotropy of the accretion disc and therefore the intensity of its emissions, in this case FeII, is decreased by a factor cosθ, i.e., decreases when moving to edge-on sources. On the other hand the [OIII] line appears as more evident in edge on positions because the luminosity of the continuum emitted by the accretion disc is decreased by the factor cos θ.
2.2. Infrared Emissions
The observed EW[OIII] distribution has implications for the obscuring component as well.
The torus is depicted in the Unified Model as a smooth and toroidal structure that can reach ~1–10 pc in size (Burtscher et al., 2013). If this is true then, there is a maximum inclination angle beyond which we are not able anymore to intercept the emissions coming from the very inner components, such as the continuum emitted by the accretion disc and the broad lines emitted by the BLR. In this case, however, the observed EW[OIII] distribution would drop when the line of sight is starting to intercept the torus. This is not what we observe: the power law keeps going very steadily to the highest EW[OIII] values. Moreover, we are intercepting broad emission lines in positions corresponding to high inclination angles. Both these facts are not compatible with the torus being a smooth structure and rather suggest a clumpy structure.
To test the indicator and exploit its potential, we are now interested in investigating the infrared emissions.
We then collect photometric data for the same sample in the UV, optical and IR band to study the Spectral Energy Distributions (SED) of the sources.
3. Sample and Data Analysis
For the sample of ~12,000 objects we selected from the SDSS DR7 the following photometric data are available:
- Far Ultra Violet and Near Ultra Violet bands from Galaxy Evolution Explorer (GALEX) DR5 (Bianchi et al., 2011).
- ugriz SDSS photometric data from Shen et al. (2011).
- The J, H, and K bands from the Two Micron All-Sky Survey (2MASS) (Skrutskie et al., 2006).
- The 3.4, 4.6, 12, and 22μm photometric data from the Wide-field Infrared urvey Explorer (WISE) (Wright et al., 2010).
We first correct all the magnitudes for Galactic extinction using the maps from the Schlegel et al. (1998). Then, for each EW[OIII] bin, we use the same approach as for the optical spectroscopic data: we rest-frame the data according to the sources redshift and then we perform a stacking of the interpolated SED in order to produce a master SED, on which we can examine the effects produced by the orientation. Before stacking them, we normalize each SED by dividing for the value of νLν at λ = 15μm, a reference wavelength in the mid-infrared spectral range, the band in which the torus emits. In doing that, we are normalizing the individual SED for the intrinsic differences of the torus and of other components in the different objects, such as the size and covering factor of the obscuring region, its distance from the central engine and the properties of the ionising continuum, whose emission is being reprocessed by the torus. This makes us able to compare the average behavior of the obscuring structure at different inclinations with respect to the line of sight of the observer. The final SED are shown in Figure 3.
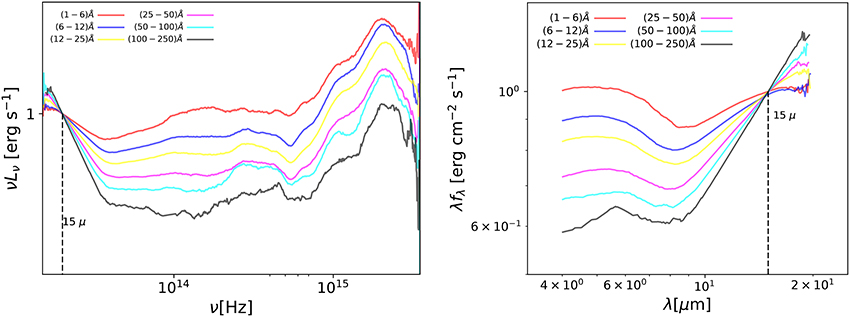
Figure 3. Left: Spectral Energy Distributions for the six EW[OIII] bins, corresponding to different inclination angle ranges. The master SED for a EW[OIII] bin was realized as follows: the photometric data for each source from the GALEX, SDSS, 2MASS and WISE surveys were corrected for Galactic reddening, rest-framed, interpolated on a common grid and normalized to the νLν value corresponding to the reference wavelength (15μm); for every channel in the grid we then selected the median value. Right: Total flux for the six EW[OIII] bins in the spectral range in which the emission coming from the torus is predominant. SED corresponding to low EW[OIII] values are characterized by a shallower decrease in the emission at the shorter IR wavelengths with respect to the longer ones, while in the case of high EW[OIII] the decrease is steeper. This behavior is in agreement with the clumpy torus models (see text for details).
4. Results and Discussion: Implications for the Obscuring Torus
In the optical stacks corresponding to the highest inclination angles (high EW[OIII]) we are able to detect emissions from the BLR. This evidence implies three possible scenarios: the absence of the torus, a torus that is mis-aligned with respect the plane of the accretion disc (and of the BLR) and a clumpy torus. The first scenario is ruled out by the fact that the IR emission is clearly visible in the SED of the sample (Figure 3). As for the second one, we see the IR emission in the stacked SED decreasing progressively as a function of the indicator, defined through the anisotropic properties of the emission coming from the accretion disc itself. If torus and accretion disc were not co-axial, we would not see such an orderly behavior.
The only scenario we are left with is therefore a clumpy torus, leading to a differention between type 1 and type 2 AGN due only to the photon escaping probability (Elitzur, 2008). Due to the selection we performed (i.e., we selected blue objects, and verified that the continuum in our stacked optical spectra was not experiencing any reddening, see Bisogni et al., 2017), when we are looking at sources with a high EW[OIII], i.e., with a high inclination angle, we are dealing with type 1 sources in which the BLR is intercepted through the dusty clouds of the torus.
We can compare our results with the clumpy models in literature (Nenkova et al., 2008a,b) that examine the infrared emission of the torus as a function of the inclination angle with respect to the observer. If the torus is a clumpy structure, what we expect is that the IR emission at shorter wavelengths decreases progressively more than the ones at longer wavelengths when we are reaching edge-on position, due to the combination of an increasing number of clouds intercepted by the line of sight and of a higher absorption at the shorter than at the longer wavelengths (Nenkova et al., 2008b).
The behavior of the stacked SED as a function of EW[OIII] confirms this scenario. At low EW[OIII] (low inclination angle) we are able to intercept the IR emissions coming from the inner clouds of the torus, that are directly illuminated by the ionizing continuum, while at high EW[OIII] (high inclination angle) the IR emission coming from the inner clouds is shielded and we can detect it only after it is absorbed by the clouds in the outskirts of the torus. This produces the decrease in the flux at the shorter wavelengths, that becomes progressively more important for stacks corresponding to higher inclinations.
As a final verification that our results are not biased by any characteristics of the sample, we made the following checks:
(1) Since our sample contains non-jetted as well as jetted quasars, the most extreme among them (blazars) could contaminate the part of the SED pertaining to the torus emission. We verified that the sub-sample composed by non-jetted quasars only gives the same result as the complete sample.
(2) Approximately 50% of the objects in our sample has a redshift z > 0.47. This is the critical value beyond which the normalization flux at 15 μm is retrieved through an extrapolation rather than an interpolation of the SED. We verified that the analysis on the z > 0.47 and z > 0.47 sub-samples does not give different results. The only differences in the z > 0.47 (z > 0.47) sub-sample we recognize with respect to the complete sample SED are: a lower (higher) luminosity in Big Blue Bump (accretion disc), due to the fact that our sample is on average more luminous at higher redshifts, and a higher (lower) emission in the optical/NIR band, due to a higher contribution from the host galaxy for sources at lower redshift. We conclude that the extrapolation of the 15 μm flux in z > 0.47 sources does not affect our results.
5. Conclusions
In this proceeding we summarize the results of the analysis on the optical spectra and we present the preliminary results of the analysis on the infrared emission of 12, 000 sources of the SDSS DR7 as a function of the EW[OIII], a new orientation indicator. We find that:
- the BLR shares the same geometry of the accretion disc; we are intercepting the intrinsic velocity of the orbiting gas only when we are looking at sources in edge-on positions. If not properly taken into account, the orientation effects affecting the broad emissions lead to an underestimation of the SMBH virial masses in every position but the edge-on ones.
- the presence of outflowing gas in the NLR is clearly seen in the profile of the [OIII] λ5007Å as a function of the inclination angle. The blue component decreases both in intensity and in the shift with respect to the reference wavelength moving from face-on to edge-on positions.
- the preliminary analysis of the SED reveals a stronger decrease in the IR emission corresponding to the shorter wavelengths with respect to the longer ones when moving from low to high EW[OIII] values, as expected in the theoretical models for clumpy tori when moving from low to high inclination angles.
Further analysis is needed in order to investigate properly the emission coming from the torus. Starting from these first results, we are in the process of performing a SED fitting for each source in the sample with AGNfitter (Calistro Rivera et al., 2016). We will then be able to repeat the analysis on the representative SED, this time having also information on the single components contributing to the total emission.
We will also investigate the sources in our sample for which multiple observations are available (e.g., Stripe82, new BOSS spectra) in order to look for evidences of changing look behaviors as a function of the EW[OIII]. If our interpretation of the data implying a clumpy structure for the torus is correct, we expect to see some of the sources that were included in our sample as Type 1 AGN changing to Type 2 objects at a different epoch. This behavior is expected more frequently for sources with a high EW[OIII], where the orientation effect is dominant, but it is not excluded even for sources with low EW[OIII] values.
Author Contributions
All the authors contributed to the work and approved it for publication.
Funding
Support for this work was provided by the National Aeronautics and Space Administration through Chandra Award Number AR7-18013 X issued by the Chandra X-ray Observatory Center, which is operated by the Smithsonian Astrophysical Observatory for and on behalf of the National Aeronautics Space Administration under contract NAS8-03060 (10.13039/100000104). EL is supported by a European Union COFUND/Durham Junior Research Fellowship (under EU grant agreement no. 609412).
Conflict of Interest Statement
The authors declare that the research was conducted in the absence of any commercial or financial relationships that could be construed as a potential conflict of interest.
References
Antonucci, R. (1993). Unified models for active galactic nuclei and quasars. Annu. Rev. Astron. Astrophys. 31, 473–521. doi: 10.1146/annurev.aa.31.090193.002353
Antonucci, R. R. J., and Miller, J. S. (1985). Spectropolarimetry and the nature of NGC 1068. Astrophys. J. 297, 621–632. doi: 10.1086/163559
Bianchi, L., Efremova, B., Herald, J., Girardi, L., Zabot, A., Marigo, P., et al. (2011). VizieR online data catalog: hot white dwarfs in GALEX-DR5 (Bianchi+, 2011). VizieR Online Data Catalog 335, 161–169. doi: 10.1007/s10509-010-0581-x
Bisogni, S., Marconi, A., and Risaliti, G. (2017). Orientation effects on spectral emission features of quasars. Month. Notices R. Astron. Soc. 464, 385–397. doi: 10.1093/mnras/stw2324
Boroson, T. (2005). Blueshifted [OIII] emission: indications of a dynamic narrow-line region. Astron. J. 130, 381–386. doi: 10.1086/431722
Boroson, T. A. (2011). A new orientation indicator for radio-quiet quasars. Astrophys. J. Lett. 735:L14. doi: 10.1088/2041-8205/735/1/L14
Boroson, T. A., and Green, R. F. (1992). The emission-line properties of low-redshift quasi-stellar objects. Astrophys. J. Suppl. 80, 109–135. doi: 10.1086/191661
Burtscher, L., Meisenheimer, K., Tristram, K. R. W., Jaffe, W., Hönig, S. F., Davies, R. I., et al. (2013). A diversity of dusty AGN tori. Data release for the VLTI/MIDI AGN Large Program and first results for 23 galaxies. Astron. Astrophys. 558:A149. doi: 10.1051/0004-6361/201321890
Calistro Rivera, G., Lusso, E., Hennawi, J. F., and Hogg, D. W. (2016). AGNfitter: a bayesian MCMC approach to fitting spectral energy distributions of AGNs. Astrophys. J. 833:98. doi: 10.3847/1538-4357/833/1/98
Decarli, R., Dotti, M., and Treves, A. (2011). Geometry and inclination of the broad-line region in blazars. Month. Notices R. Astron. Soc. 413, 39–46. doi: 10.1111/j.1365-2966.2010.18102.x
Elitzur, M. (2008). The toroidal obscuration of active galactic nuclei. Astrophysics 52, 274–288. doi: 10.1016/j.newar.2008.06.010
Heckman, T. M., Kauffmann, G., Brinchmann, J., Charlot, S., Tremonti, C., and White, S. D. M. (2004). Present-Day Growth of Black Holes and Bulges: The Sloan Digital Sky Survey Perspective. Astrophys. J. 613, 109–118. doi: 10.1086/422872
Heckman, T. M., Miley, G. K., and Green, R. F. (1984). The kinematics of the narrow-line region in active galaxies and quasars. III - Correlations with the broad-line region and radio emission. Astrophys. J. 281, 525–534. doi: 10.1086/162125
Jarvis, M. J., and McLure, R. J. (2006). Orientation dependency of broad-line widths in quasars and consequences for black hole mass estimation. Month. Notices R. Astron. Soc. 369, 182–188. doi: 10.1111/j.1365-2966.2006.10295.x
Marziani, P., Zamanov, R. K., Sulentic, J. W., and Calvani, M. (2003). Searching for the physical drivers of eigenvector 1: influence of black hole mass and Eddington ratio. Month. Notices R. Astron. Soc. 345, 1133–1144. doi: 10.1046/j.1365-2966.2003.07033.x
Mulchaey, J. S., Koratkar, A., Ward, M. J., Wilson, A. S., Whittle, M., Antonucci, R. R. J., et al. (1994). Multiwavelength tests of the dusty torus model for Seyfert galaxies. Astrophys. J. 436, 586–598. doi: 10.1086/174933
Nenkova, M., Sirocky, M. M., Ivezić, Ž., and Elitzur, M. (2008a). AGN Dusty Tori. I. Handling of Clumpy Media. Astrophys. J. 685, 147–159. doi: 10.1086/590482
Nenkova, M., Sirocky, M. M., Nikutta, R., Ivezić, Ž., and Elitzur, M. (2008b). AGN dusty tori. II. Observational implications of clumpiness. Astrophys. J. 685, 160–180. doi: 10.1086/590483
Padovani, P. (2011). The microjansky and nanojansky radio sky: source population and multiwavelength properties. Month. Notices R. Astron. Soc. 411, 1547–1561. doi: 10.1111/j.1365-2966.2010.17789.x
Risaliti, G., Salvati, M., and Marconi, A. (2011). [OIII] equivalent width and orientation effects in quasars. Month. Notices R. Astron. Soc. 411, 2223–2229. doi: 10.1111/j.1365-2966.2010.17843.x
Schlegel, D. J., Finkbeiner, D. P., and Davis, M. (1998). Maps of dust infrared emission for use in estimation of reddening and cosmic microwave background radiation foregrounds. Astrophys. J. 500, 525–553. doi: 10.1086/305772
Shakura, N. I., and Sunyaev, R. A. (1973). Black holes in binary systems. Observational appearance. Astron. Astrophys. 24, 337–355.
Shen, Y. (2013). The mass of quasars. Bull. Astron. Soc. India 41, 61–115. Available online at: http://cdsads.u-strasbg.fr/abs/2013BASI…41…61S
Shen, Y., and Ho, L. C. (2014). The diversity of quasars unified by accretion and orientation. Nature, 513, 210–213. doi: 10.1038/nature13712
Shen, Y., and Kelly, B. C. (2010). The impact of the uncertainty in single-epoch virial black hole mass estimates on the observed evolution of the black hole-bulge scaling relations. Astrophys. J. 713, 41–45. doi: 10.1088/0004-637X/713/1/41
Shen, Y., Richards, G. T., Strauss, M. A., Hall, P. B., Schneider, D. P., Snedden, S., et al. (2011). A catalog of quasar properties from sloan digital sky survey data release 7. Astrophys. J. Suppl. 194:45. doi: 10.1088/0067-0049/194/2/45
Skrutskie, M. F., Cutri, R. M., Stiening, R., Weinberg, M. D., Schneider, S., Carpenter, J. M., et al. (2006). The two micron all sky survey (2MASS). Astron. J. 131, 1163–1183. doi: 10.1086/498708
Van Gorkom, K. J., Wardle, J. F. C., Rauch, A. P., and Gobeille, D. B. (2015). Comparing different indicators of quasar orientation. Month. Notices R. Astron. Soc. 450, 4240–4247. doi: 10.1093/mnras/stv912
Wills, B. J., and Brotherton, M. S. (1995). An improved measure of quasar orientation. Astrophys. J. Lett. 448:L81. doi: 10.1086/309614
Wills, B. J., and Browne, I. W. A. (1986). Relativistic beaming and quasar emission lines. Astrophys. J. 302, 56–63. doi: 10.1086/163973
Wright, E. L., Eisenhardt, P. R. M., Mainzer, A. K., Ressler, M. E., Cutri, R. M., Jarrett, T., et al. (2010). The wide-field infrared survey explorer (WISE): mission description and initial on-orbit performance. Astron. J. 140, 1868–1881. doi: 10.1088/0004-6256/140/6/1868
Keywords: galaxies: active, galaxies: nuclei, galaxies: Seyfert, quasars: emission lines, quasars: general
Citation: Bisogni S, Marconi A, Risaliti G and Lusso E (2017) EW[OIII] as an Orientation Indicator for Quasars: Implications for the Torus. Front. Astron. Space Sci. 4:48. doi: 10.3389/fspas.2017.00048
Received: 25 September 2017; Accepted: 06 November 2017;
Published: 21 November 2017.
Edited by:
Paola Marziani, Osservatorio Astronomico di Padova (INAF), ItalyReviewed by:
Víctor Manuel Patiño Álvarez, National Institute of Astrophysics, Optics and Electronics, MexicoLuka C. Popovic, Belgrade Astronomical Observatory, Serbia
Copyright © 2017 Bisogni, Marconi, Risaliti and Lusso. This is an open-access article distributed under the terms of the Creative Commons Attribution License (CC BY). The use, distribution or reproduction in other forums is permitted, provided the original author(s) or licensor are credited and that the original publication in this journal is cited, in accordance with accepted academic practice. No use, distribution or reproduction is permitted which does not comply with these terms.
*Correspondence: Susanna Bisogni, susanna.bisogni@cfa.harvard.edu