 Amanda O. Marabesi
 Savithri U. Nambeesan
 Marc W. van Iersel
 Jason T. Lessl
 Timothy W. Coolong1*
- 1Department of Horticulture, University of Georgia, Athens, GA, United States
- 2Agricultural and Environmental Services Lab, University of Georgia, Athens, GA, United States
Industrial hemp (Cannabis sativa L.) has demonstrated promise for phytoremediation due to an extensive root system, large biomass, and ability to survive under relatively high levels of heavy metals. However, little research has been conducted to determine the impact of heavy metal uptake in hemp grown for medicinal use. This study evaluated the potential for cadmium (Cd) uptake and its impact on growth, physiological responses, and transcript expression of metal transporter genes in a hemp variety grown for flower production. The cultivar ‘Purple Tiger’ was exposed to 0, 2.5, 10, and 25 mg·L-1 Cd in a greenhouse hydroponic study in two independent experiments. Plants exposed to 25 mg·L-1 Cd displayed stunted plant growth characteristics, reduced photochemical efficiency, and premature senescence suggesting Cd toxicity. At the two lower concentrations of Cd (2.5 and 10 mg·L-1 Cd), plant height, biomass, and photochemical efficiency were not affected, with chlorophyll content index (CCI) being slightly lower at 10 mg·L-1 Cd, compared to 2.5 mg·L-1 Cd. There were no consistent differences between the two experiments in total cannabidiol (CDB) and tetrahydrocannabinol (THC) concentrations in flower tissues at 2.5 and 10 mg·L-1 Cd, compared to the control treatment. Root tissue accumulated the highest amount of Cd compared to other tissues for all the Cd treatments, suggesting preferential root sequestration of this heavy metal in hemp. Transcript abundance analysis of heavy metal-associated (HMA) transporter genes suggested that all seven members of this gene family are expressed in hemp, albeit with higher expression in the roots than in the leaves. In roots, CsHMA3 was up-regulated at 45 and 68 d after treatment (DAT), and CsHMA1, CsHMA4, and CsHMA5 were upregulated only under long term Cd stress at 68 DAT, at 10 mg·L-1 Cd. Results suggest that expression of multiple HMA transporter genes in the root tissue may be upregulated in hemp exposed to 10 mg·L-1 Cd in a nutrient solution. These transporters could be involved in Cd uptake in the roots via regulating its transport and sequestration, and xylem loading for long distance transport of Cd to shoot, leaf, and flower tissues.
1 Introduction
Hemp (Cannabis sativa L.) has been cultivated for centuries for feed, fiber, and medicinal purposes (Ranalli, 1999). In the United States (U.S.), production has been largely prohibited until the passage of the 2018 Agriculture Improvement Act (Farm Bill), which allowed for legal cultivation of industrial hemp [US Department of Agriculture, 2019]. Industrial hemp is defined as C. sativa with a total delta-9 tetrahydrocannabinol (THC) concentration of less than 0.3% on a dry-weight basis. C. sativa plants with delta-9 THC concentrations above 0.3% are classified as marijuana and are federally prohibited in the U.S. Tetrahydrocannabinol and cannabidiol (CBD) are two of the more than 100 cannabinoids found in C. sativa plants, many of which have therapeutic uses such as the treatment of anxiety and seizures (ElSohly and Gul, 2014; National Academies of Sciences, Engineering, and Medicine, 2017; US Department of Agriculture, 2019). Although legalized by the U.S. federal government, there are significant regulations for industrial hemp production that must be followed to stay in compliance with federal law. Further, processors often impose strict quality control standards for their products as they may be consumed as dietary supplements. Heavy metal accumulation in hemp biomass is an area of concern for processors and many have attempted to implement standards regarding maximum allowable levels of metals.
Previously, human exposure to cadmium (Cd), has been associated with smoking contaminated tobacco (Nicotiana tabacum L.), particularly counterfeit cigarettes sold in developing markets (Akesson & Chaney, 2019). Cadmium accumulation in smokable plants, such as tobacco and hemp, is concerning for human health due to the harmful effects of Cd inhalation, which has been associated with renal tubular dysfunction, osteomalacia, lung disease, and it is classified as a Group 1 carcinogen (Gauvin et al., 2018; Akesson & Chaney, 2019; Ismael et al., 2019). Nonetheless, consumers are less likely to perceive the harms of C. sativa smoke to the same extent as those caused by smoking tobacco (Gauvin et al., 2018). Cadmium is a naturally occurring element and is found in trace amounts in the environment, including soil. Cadmium may be introduced to agricultural soils via contaminated manure and biosolids, phosphate fertilizers, mine waste, atmospheric deposition from smelter emissions, and industrial waste (Chaney, 2010; Sebastian et al., 2019).
Studies have documented the ability of hemp to survive on soils with relatively high levels of heavy metals, including Cd, copper (Cu), nickel (Ni), lead (Pb), zinc (Zn), mercury (Hg), and chromium (Cr) (Linger et al., 2002; Citterio et al., 2003; Angelova et al., 2004; Linger et al., 2005; Shi & Cai, 2009; Shi & Cai, 2010; Shi et al., 2012; Ahmad et al., 2015; Galic et al., 2019; Husain et al., 2019). Furthermore, hemp has been suggested to have the potential to remove Cd from contaminated soils for phytoremediation purposes. Hemp shares some traits with species of plants that can establish themselves in otherwise phytotoxic environments, such as an extensive and deep root system, efficient translocation of contaminants to the shoots, rapid life cycle, and high biomass production (Citterio et al., 2003; Nesler & Furini, 2012).
Numerous plant species have developed mechanisms to cope with exposure to high levels of heavy metals (Eutropio et al., 2016). The first step in Cd accumulation in plants is the uptake of Cd ions by the roots. The rhizosphere is critical in this process as it can provide an appropriate environment for the existence of bioavailable forms of metals, in terms of pH, redox potential, and presence of microorganisms (Chaney, 2010; Lux et al., 2011; Ismael et al., 2019; Sebastian et al., 2019). Subsequently, metal ions may enter roots through protein transporters and travel via apoplastic or symplastic pathways. Once in root cells, metal cations may be chelated with phytochelatins, metallothioneins, organic acids, and amino acids and stored in the vacuoles in a chelated form, while also being loaded into the xylem where they are translocated to the shoots and leaves. Cadmium accumulation in hemp has been reported to be greater in roots when compared to other tissues, though translocation of Cd to aboveground portions of plants is still significant (Citterio et al., 2003; Linger et al., 2005; Shi & Cai, 2009; Shi et al., 2012; Ahmad et al., 2015; Galic et al., 2019).
Metal transporters mediate Cd movement within the plant. These proteins primarily transport divalent cations such as Cu, Zn, calcium (Ca), magnesium (Mg), and iron (Fe), which are essential nutrients for plants. When Cd is present in the soil solution, it competes with these essential nutrients for transport, and may be colloquially referred to as an “opportunistic hitchhiker” (Shah et al., 2019). Several transport protein families are involved in the uptake and movement of heavy metals in plants (Lux et al., 2011; Ismael et al., 2019; Sebastian et al., 2019). Transporting ATPases such as heavy metal ATPase 2 (AtHMA2) and heavy metal ATPase 4 (AtHMA4) have been reported to play an important role on Cd uptake and translocation in Arabidopsis thaliana (L.) Heynh (Wong & Cobbett, 2009), while AtHMA3 (Morel et al., 2009; Ismael et al., 2019) and its orthologues OsHMA3 in Oriza sativa L. are involved in vacuolar loading of Cd (Miyadate et al., 2011; Ismael et al., 2019).
Prior research has largely focused on the survival and accumulation of Cd in fiber hemp varieties grown for phytoremediation purposes. However, much of the hemp intended for human consumption is specifically grown for floral production, which is utilized for cannabinoid extraction or directly for smoking. Therefore, there is interest in determining the potential for Cd contamination in flower tissue. There is a lack of research-based information on heavy metal accumulation in hemp grown for the medicinal market and the relationship between Cd stress and hemp growth and development (Ahmad et al., 2015; Yin et al., 2022). In this study we evaluated the potential for Cd accumulation and its impact on growth and physiological responses related to photochemical efficiency and chlorophyll content, and transcript abundance of metal transporter genes in an industrial hemp variety grown specifically for flower (cannabinoid) production.
2 Materials and methods
2.1 Experimental setting
Two independent greenhouse experiments utilizing a deep-water culture hydroponic system were conducted from Dec. 2020 through Mar. 2021 and Feb. 2021 through May 2021. Industrial hemp ‘Purple Tiger’, developed for flower production (The Hemp Mine, Fair Play, SC, USA), was propagated via rooted cuttings. This cultivar was chosen due to its long photoperiod requirements for vegetative growth (≥ 17 h) and ability to accumulate CBD in the flower tissue. Cuttings were taken from female plants in the active vegetative growth phase containing three nodes each. Cuttings were dipped in a commercial rooting gel (0.31% indole butyric acid; CLONEX, Growth Technology Ltd., Somerset, UK) and placed into engineered foam cubes (3.33 cm L x 2.54 cm W x 3.81 cm D; Oasis Grower Solutions, Kent, OH, USA) for rooting. Foam cubes were placed in plastic trays located on a heat mat set at 24°C under a mist system, which applied water approximately four-times daily for 3 min each. Cuttings were maintained for approximately 3 weeks, after which they were transferred to 37.9 L plastic containers (Rubbermaid Inc. Wooster, OH, USA) filled with 28 L of well water. Water was analyzed for nutrient concentrations prior to the experiment (Supplemental Table 1). A nutrient solution was added to the plastic containers using a complete hydroponic fertilizer (5N-4.8P-21.6K, Peters Professional Hydroponic Special; ICL, St. Louis, MO, USA) and calcium nitrate (14N-0P-0K,17Ca; Calcium + Micros, General Hydroponics, Santa Rosa, CA, USA) dissolved in the well water (Supplemental Table 1).
Four rooted cuttings were placed into plastic netted containers (4.7 cm W x 5.1 cm D) spaced equidistant (24.3 cm apart) through the lid of the plastic tub for a given treatment. There were four replicates for every given treatment. Welded wire mesh frames were attached to each lid to support plants. Plants were grown for 4 weeks in the base nutrient solution (Supplemental Table 1). A 15.2 cm aquarium air stone attached to an air pump (Active Aqua; Hydrofarm, Petaluma, CA, USA) was added to each plastic container to aerate the solution throughout the experiment. Container volume was maintained by adding well water every 2 d. Four weeks after transplant, nutrient solutions were replaced completely and Cd treatments added using 3CdSO4·8H2O, to achieve 0, 2.5, 10 and 25 mg·L-1 Cd. Cadmium concentrations were chosen based on the results of Huang et al. (2019), who evaluated hemp exposure to Cd in a hydroponic system. Nutrient solutions were maintained to a constant volume by adding water every 2 d and were completely replaced every 2 weeks for the next 10 weeks, except for the 25 mg·L-1 Cd tubs, which were harvested after 6 weeks of Cd exposure due to plant senescence caused by Cd toxicity. Electrical conductivity (EC) and pH of the solutions were measured at the start and mid-point of each 2-week period. Solution pH was adjusted to 5.5 when necessary (pH down; General Hydroponics, Santa Rosa, CA, USA). Supplemental light (104 µmol·m-²·s-1) was used to provide 18/6 light/dark hours for 6 weeks of vegetative growth after planting. Supplemental lights were turned off to allow for flower induction for the remaining 8 weeks of production. Nutrient solutions were sampled at the beginning and end of each 2-week cycle using 20 mL scintillation vials (HDPE; Thermo-Fisher Scientific, Waltham, MS, USA), and stored at -4°C until analysis.
Temperature and relative humidity (RH) of the greenhouse were monitored at canopy height hourly (VP4; Meter Group Inc., Pullman WA, USA) and averaged 19.4 ± 3.6°C and 66% ± 14.0 RH, and 22.1 ± 4.9°C and 63.8 ± 17.8% RH for experiments 1 and 2, respectively. Photosynthetic active radiation was also monitored hourly throughout the experiment (QSO-S; Meter Group Inc.) and the average daily light integral (DLI) was 30.9 ± 18.4 mol·m-2·d-1 in the first experiment and 47.8 ± 19.7 mol·m-2·d-1in the second experiment.
2.2 Mineral analysis
Samples of the hydroponic solutions were filtered using a 0.45 µM PTFE membrane and acidified using 2% high purity nitric acid (HNO3) prior to analysis. At harvest [68 d after Cd treatments, (DAT)], root, stem, leaf, and flower material were collected for metal analysis. Samples were taken prior to air drying whole plants for plant biomass quantification. For each replicate, sub-samples were taken from 3 plants per replicate and combined into a composite sample. In total, four replicates per treatment were used for determination of mineral composition. For roots, approximately 50 g of fresh material was collected from each replicate and triple washed with deionized water prior to drying. For leaves, ten of the youngest fully expanded leaves were collected from the top one-third of each plant (main stem and lateral branches) and rinsed with deionized water. Stem samples of approximately 50 g were collected from the bottom two-thirds of the main stem from each replicate. Approximately 20 g of fresh flower material was sampled from each replicate from the main stem and top one-third of plants.
Plant tissue samples were placed in a forced air oven to set at 55°C for 72 h until a constant weight was achieved. Dried plant material was then ground in a Wiley mill (Thomas Scientific, Swedesboro, NJ, USA) and passed through a 20-mesh screen. The samples were digested following EPA Method 3052 (USEPA Method 3052, 1995) as follows: 0.5 g samples were weighed and placed in fluorocarbon polymer microwave vessels. Then 10 mL of concentrated nitric acid was added to each vessel and sealed, placed in a microwave digester (Mars 6 Microwave; CEM Corp., Matthews, NC, USA), and heated to 200°C for 30 minutes. Digests (solutions) were then transferred quantitatively into volumetric flasks and brought to 100 mL volume with deionized water prior to analysis.
Nutrient solutions and plant tissue digestions were analyzed for multiple elements (P, K, S, Ca, Mg, Fe, Mn, Al, B, Cu, Zn, Ni, and Cd) following EPA Method 200.8 (Creed et al., 1994) by Inductively Coupled Plasma - Optical Emission Spectroscopy (Spectro Arcos FHS16; Spectro Amertek USA, Wilmington, MA, USA). The instrument detection limit for Cd was 0.005 mg·L-1. Calibration standards utilized in this analysis were from a certified source (Inorganic Ventures, Christiansburg, VA, lot number: N2-MEB667614). Independent laboratory performance checks were also run with acceptable deviations for recoveries set at 100 ± 5.0%.
2.3 Plant biomass and photosynthetic measurements
Plant height and leaf, flower, stem, and root biomass were determined at harvest. Whole plant samples (three per replicate) were air dried at ambient temperatures inside the greenhouse for 2 weeks and then separated into roots, stems, and combined flower and leaf biomass. To adjust for any remaining moisture content, subsamples were taken from the air-dried materials and further dried in a forced air oven set at 55°C for 48 hours until a constant weight was achieved. The dry weights of the whole plant samples were then normalized based on subsample moisture content.
The maximum quantum yield of photosystem II (Fv/Fm) was measured during darkness with a fluorometer (Mini-Pam; Walz Company, Effeltrich, Germany) and chlorophyll content index (CCI) was measured at mid-morning with a handheld meter (MC-100; Apogee Instruments, Logan, UT, USA) at 14 and 45 DAT. Measurements were taken on three plants per replicate, on the youngest fully mature leaf on each of the plants.
2.4 Cannabinoid analysis
Approximately 25 g of fresh flower tissue obtained from inflorescences located on the top one-third of the plants were sampled from each of the four replicates during week 8 of flowering (68 DAT) and dried separately from other samples for cannabinoid analysis. Four replicates per treatment were used for determination of cannabinoids. Flower material was spread evenly on a perforated baking sheet and dried to approximately 15% moisture content in a walk-in cooler with a temperature set point of 13°C and 55% relative humidity for 14 d. Relative humidity was maintained using a dehumidifier. After 14 d, flower material was hand trimmed to remove leaves and sealed in a metalized resealable food bag (Uline, Braselton, GA) and stored at -4°C for cannabinoid analysis.
The acidic and neutral (decarboxylated) forms of the cannabinoids, THC and CBD, were determined in dried flower material according to the method of Storm et al. (2020) by a commercial laboratory using high performance liquid chromatography and a diode array detector set to 230 nm (SJ Labs & Analytics, Macon, GA). In brief, a 200 mg sample of homogenized dried flower material was extracted with 20 mL of methanol in a 50 mL centrifuge tube. Tubes were vortexed for 10 min, centrifuged at 5000 rpm for 5 min and a 50 µL aliquot of supernatant diluted with 950 µL of methanol and filtered through a 0.45 µm regenerated cellulose syringe filter (4mm Captiva; Agilent, Santa Clara, CA, USA). Analysis was done using high performance liquid chromatography (1220 Infinity II LC; Agilent) with a variable wavelength diode array detector (Agilent). Ten µL of the methanol extract was injected into a 3.0 x 50 mm, 2.7 µm column liquid chromatography column (Infinity Lab Poroshell 120 EC-C18; Agilent). The flow rate was 1.0 mL·min-1 for the run. Eluents were A) 0.1% aqueous formic acid B) 0.1% formic acid in methanol. A gradient run was programmed as follows: 40% A and 60% B for 1 min, 40% to 23% A and 60% to 77% B for the next 7 min, then 5% A and 95% B for 2 min. Total cannabinoid concentrations were calculated by the following formula: total cannabinoid = neutral + (acidic form x 0.877). Percentage dry matter for all samples was recorded and results reported on a dry weight basis.
2.5 Identification of heavy metal transporter and cannabinoid biosynthesis genes
In order to identify heavy metal transporters in C. sativa, orthologue sequences from Arabidopsis P1B-type ATPase gene family containing eight genes were used (Supplemental Table 2). Arabidopsis HMA protein sequences from National Center for Biotechnology Information (NCBI) were used to perform blast analysis using blastp function in NCBI against C. sativa. Reciprocal blast from C. sativa were performed to confirm the identity of the protein. Seven transporter genes were retrieved in C. sativa. All the accession numbers for protein sequences have been provided (Figure 1). Two cannabinoid synthase genes sequences, TETRAHYDROCANNABINOLIC ACID SYNTHASE (XM_030625046.1) and CANNABIDIOLIC ACID SYNTHASE (XM_030624886.1), were retrieved from NCBI from accession numbers reported previously (Husain et al., 2019). Further, two C. sativa reference genes sequences, ELONGATION FACTOR 1 ALPHA/HBS1-LIKE PROTEIN (XM_030654944.1) and UBIQUITIN-PROTEIN LIGASE/UBIQUITIN DOMAIN-CONTAINING PROTEIN DSK2B (XM_030630092.1), were used to normalize the data and ensure validity of results. These reference genes were found to be stable for quantitative RT-PCR in Cannabis sativa L. (Guo et al., 2018). The accession numbers provided in this study were used to retrieve more updated sequences from the C. sativa Updated Annotation Release 100 with the accession numbers provided above.
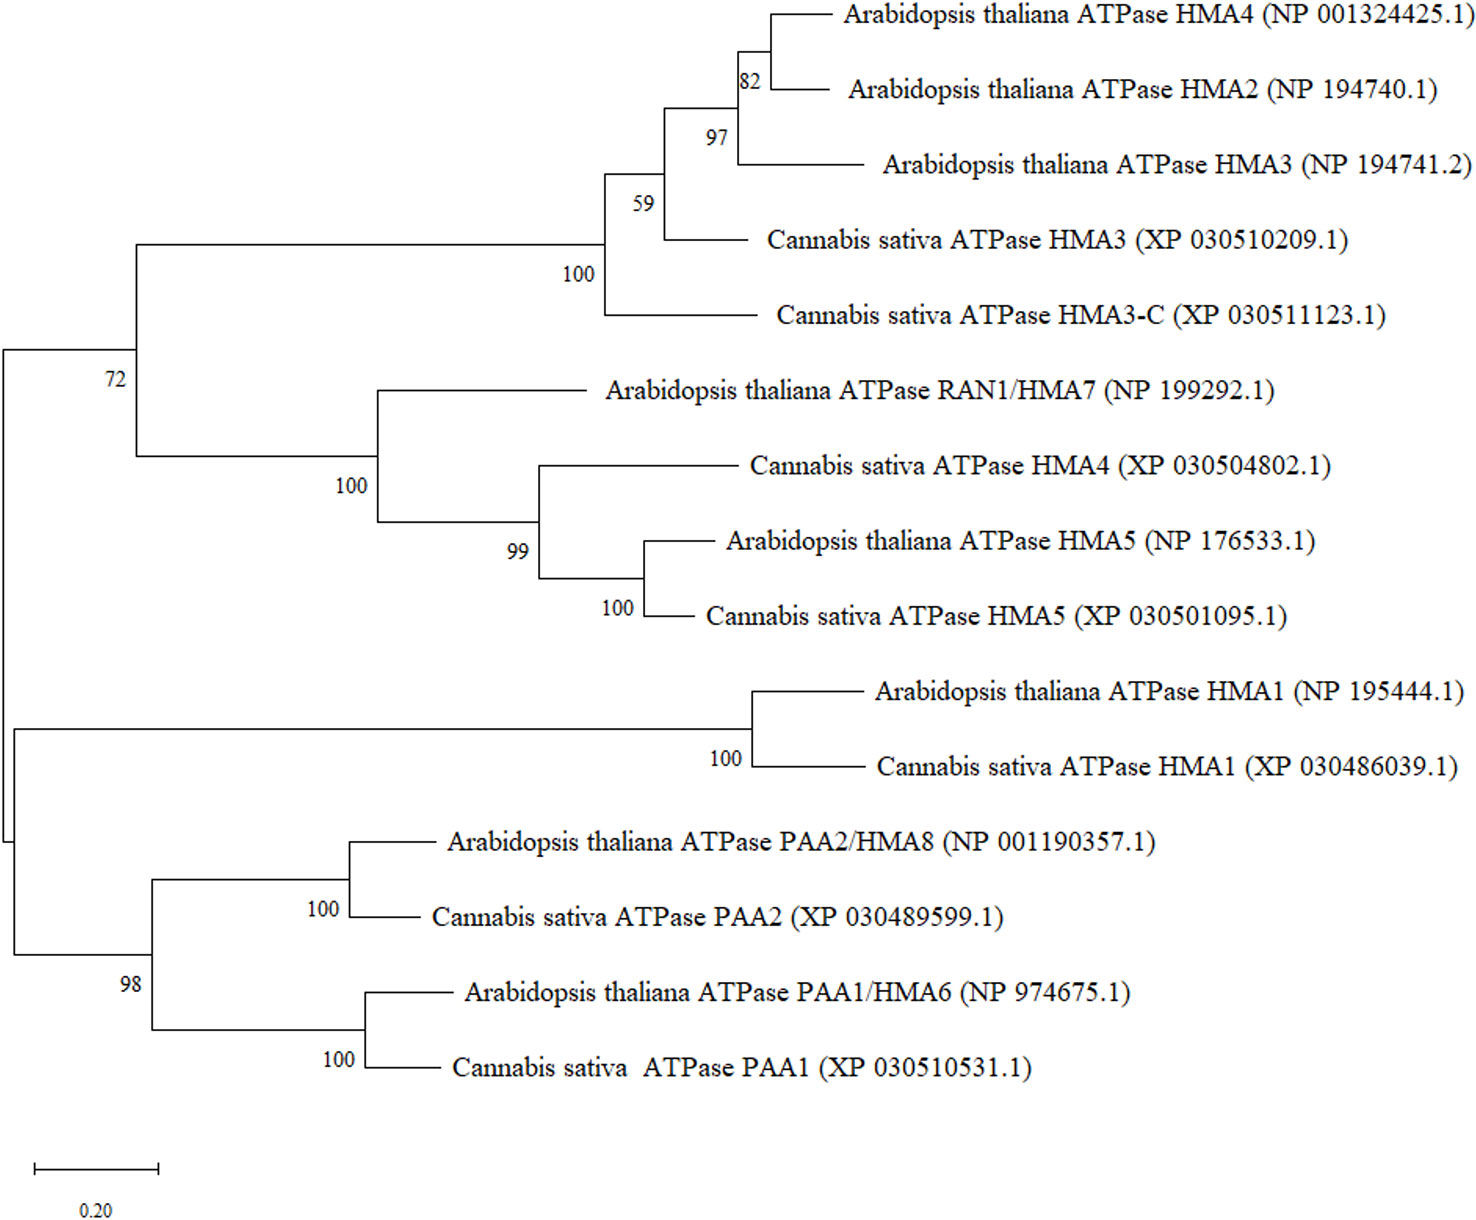
Figure 1 Maximum Likelihood (ML) phylogenetic tree of hemp (Cannabis sativa L.) heavy metal ATPases and their closest orthologues in A. thaliana.
2.6 Gene expression analysis
The transcript expression of seven heavy metal transporter genes and two cannabinoid biosynthetic genes identified from C. sativa were assessed in root, leaf, and flower tissues at different physiological time points: 2 DAT (vegetative stage), 45 DAT (4 weeks of flowering stage), and 68 DAT (8 weeks of flowering stage). Due to similar trends in plant responses between the two experiments, plant material from experiment 1 was analyzed for gene expression. Approximately 15 g of root, leaf, and flower tissue were collected at 2, 45, and 68 DAT at mid-morning, flash frozen in liquid nitrogen, and stored at –80°C until RNA extraction. Since the plant was at the juvenile stage at 2 DAT, one whole plant per replicate was harvested. For the remaining time points, sub-samples of roots, flowers, and young fully expanded leaves (from the top one-third of each plant) were collected from three plants per replicate and combined. Four replicates per treatment were used for gene expression analysis. For extraction, frozen plant tissues were ground into a fine powder by hand using a mortar and pestle and liquid nitrogen. Total RNA was extracted from 100 mg samples following TRIzol® methodology for leaf tissue and utilizing an E.Z.N.A.® Plant RNA Kit (Omega Bio-Tek, Norcross, GA, USA) for root and flower tissues, following the manufacturers’ recommendation. RNA concentration, 260/280 absorbance ratios, and quality were assessed utilizing Nanodrop (Nanodrop 8000 Spectrophotometer, Thermo Fisher Scientific) and agarose gel electrophoresis.
Following RNA extraction, DNAse treatment was performed at 37°C for 34 minutes in a thermocycler (Mastercycler® X50s Eppendorf SE, Hamburg, Germany). Subsequently, cDNA was synthesized using ImPromII Reverse Transcriptase (Mayorga-Gómez and Nambeesan, 2020). Quantitative RT-PCR reactions were performed in a 96-well plate using PowerUP SYBR Green PCR Master Mix (Applied Biosystems, Foster City, CA, USA), diluted cDNA, and 0.2 μM concentration of forward (Fw) and reverse (Rv) primers using AriaMx Real-time PCR System (Agilent, Santa Clara, CA, USA). Reaction conditions were as follows: 2 min at 50°C, 5 min at 95°C, 40 amplification cycles of 30 s at 95°C followed by 1 min at 60°C, and one final cycle for dissociation curve analysis of 1 min at 95°C followed by 30 s at 55°C followed by 30 s at 95°C. Each reaction was performed at least in triplicates and PCR reaction efficiency was determined by LinRegPCR (v. 11.0). Primers were designed manually by importing sequences into MEGA software (v. 11.0, Tamura et al., 2021) and primer quality was verified using the OligoAnalyzer tool (Integrated DNA Technologies, Coralville, IA, USA). Primer sequences and accession numbers for the genes analyzed can be found in Supplemental Table 2.
2.7 Phylogenetic analyses
Protein sequences of all the HMA genes in A. thaliana and C. sativa were used to construct a phylogenetic tree using MEGA software (v. 11.0, Tamura et al., 2021). The evolutionary history was inferred by using the Maximum Likelihood method and JTT matrix-based model. The tree with the highest log likelihood (-11628.46) was used for the construction of the tree. Multiple-sequence alignment was performed with MUSCLE. Phylogeny clusters reliability was tested with 1000 replicates (bootstrap analysis). Closest orthologue sequences were selected by blastp (query cover > 80% and identity > 60%) in the NCBI database.
2.8 Statistical and correlational analysis
Experiments followed a complete randomized block design. Statistical analysis was conducted using JMP© Pro 15 (SAS, Cary NC, USA). Data were subjected to a one-way ANOVA procedure with Tukey’s honest significant difference (HSD) test (P<0.05) conducted for mean separation when appropriate. Tissue Cd concentrations were log-transformed to ensure equal variance prior to statistical analysis. Non-transformed data are presented. Correlations between Cd concentrations and gene transcript abundance in roots were determined using Spearman correlations using JMP© Pro 15 and p-values were adjusted using the false discovery rate (FDR) method. Heatmaps were created using RStudio (v. 2022.07.0) after transforming the data using Log2 (fold-change + 0.001), where 0.001 was added to account for the genes that showed no expression.
3 Results and discussion
3.1 Plant growth and yield
Plants exposed to 0 and 2.5 mg·L-1 Cd grew similarly and displayed no visual symptoms of Cd toxicity throughout the experiment (Figures 2A, E). Plants exposed to 10 mg·L-1 Cd exhibited visual symptoms of Cd toxicity within 2 d of exposure (2 DAT), such as leaf curling and mild chlorosis, however symptoms decreased as plants continued to grow (Figure 2B). Plants exposed to the highest level of Cd (25 mg·L-1) exhibited Cd toxicity symptoms within 2 d of exposure (Figure 2C). However, unlike plants exposed to 10 mg·L-1 Cd, symptoms in plants exposed to 25 mg·L-1 Cd continued to worsen over time, with leaves and roots eventually becoming necrotic (Figures 2C–E). Plants exposed to 0, 2.5, and 10 mg·L-1 Cd were harvested at week 8 of flowering (68 DAT); however, plants exposed to 25 mg·L-1 Cd senesced prematurely and were harvested prior to flowering (45 DAT).
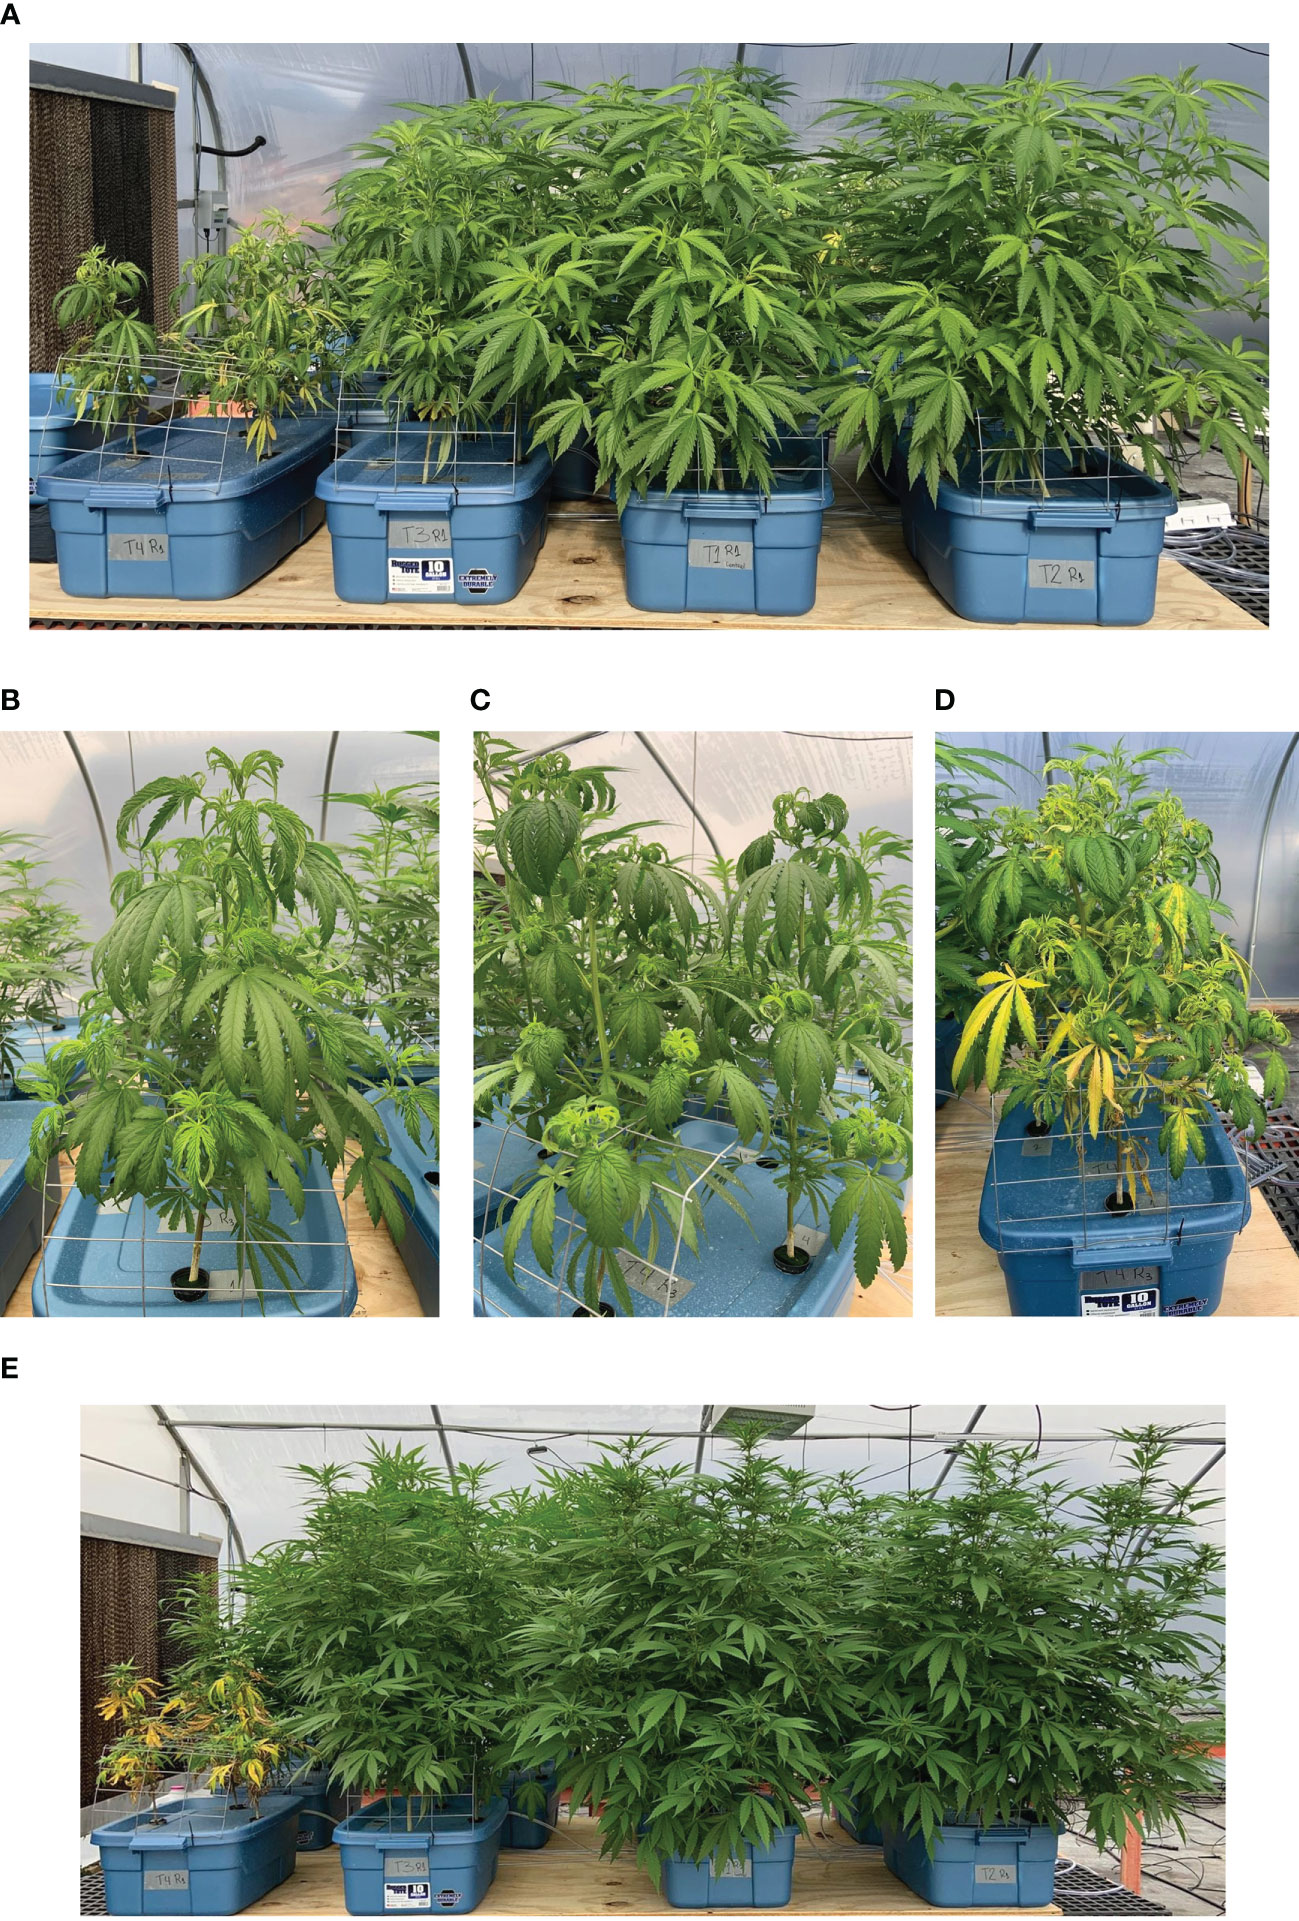
Figure 2 Hemp (Cannabis sativa L.) ‘Purple Tiger’ grown hydroponically. From left to right: plants under 25, 10, 0, and 2.5 mg·L-1 Cd exposed to treatments for 11 d (A). Plants exposed to 10 and 25 mg·L-1 Cd for 2 d [(B, C), respectively]. Plants exposed to 25 mg·L-1 Cd for 11 d (D). From left to right: plants under 25, 10, 0, and 2.5 mg·L-1 Cd exposed to treatments for 30 d (E).
3.2 Plant biomass
Shoot height and dry weight of stems, roots, and flower + leaves (classified as ‘biomass’ in industry standards) responded similarly to Cd exposure. Therefore, data from the two experiments were pooled. Shoot height was not affected by Cd for plants exposed to 0, 2.5, and 10 mg·L-1 Cd; however, shoot height was reduced in plants exposed to 25 mg·L-1 Cd (Figure 3A). Dry weight of stems, roots, and flowers + leaves were also greater in the 0, 2.5, and 10 mg·L-1 Cd treatments compared to 25 mg·L-1 Cd (Figure 3B). Compared to the 2.5 mg·L-1 Cd treatment, the 10 mg·L-1 Cd treatment displayed numerically lower stem biomass, however it was not significantly different from 0 mg·L-1 Cd treatment. Root dry weight was lower in the 25 mg·L-1 Cd treatment compared to all other treatments. There were no differences in flower and leaf biomass between the 0, 2.5, and 10 mg·L-1 Cd treatments, while plants grown with 25 mg·L-1 Cd began to senesce prior to full flower development resulting in low production of flower + leaf biomass. Stems, root, and flower + leaf biomass were reduced in the 25 mg·L-1 Cd treatment to a greater extent than shoot height, which is congruent with prior results suggesting that plant biomass is a more appropriate reference for analyzing Cd toxicity than shoot growth (Shi & Cai, 2009; Shi et al., 2012). Current results agree with prior studies, suggesting that diminished biomass is a common indicator of Cd toxicity in hemp plants and that Cd toxicity symptoms include leaf chlorosis, leaf curling, and growth inhibition (Linger et al., 2005; Shi & Cai, 2009; Shi et al., 2012; Luyckx et al., 2021). Although plants exposed to 10 mg·L-1 Cd visually displayed less branching and thinner stems compared to 0 and 2.5 mg·L-1 Cd treatments (personal observation), this was not reflected in the overall root, and flower + leaf biomass. These data also suggest that hemp ‘Purple Tiger’ can tolerate exposure to 10 mg·L-1 Cd without alterations in plant biomass.
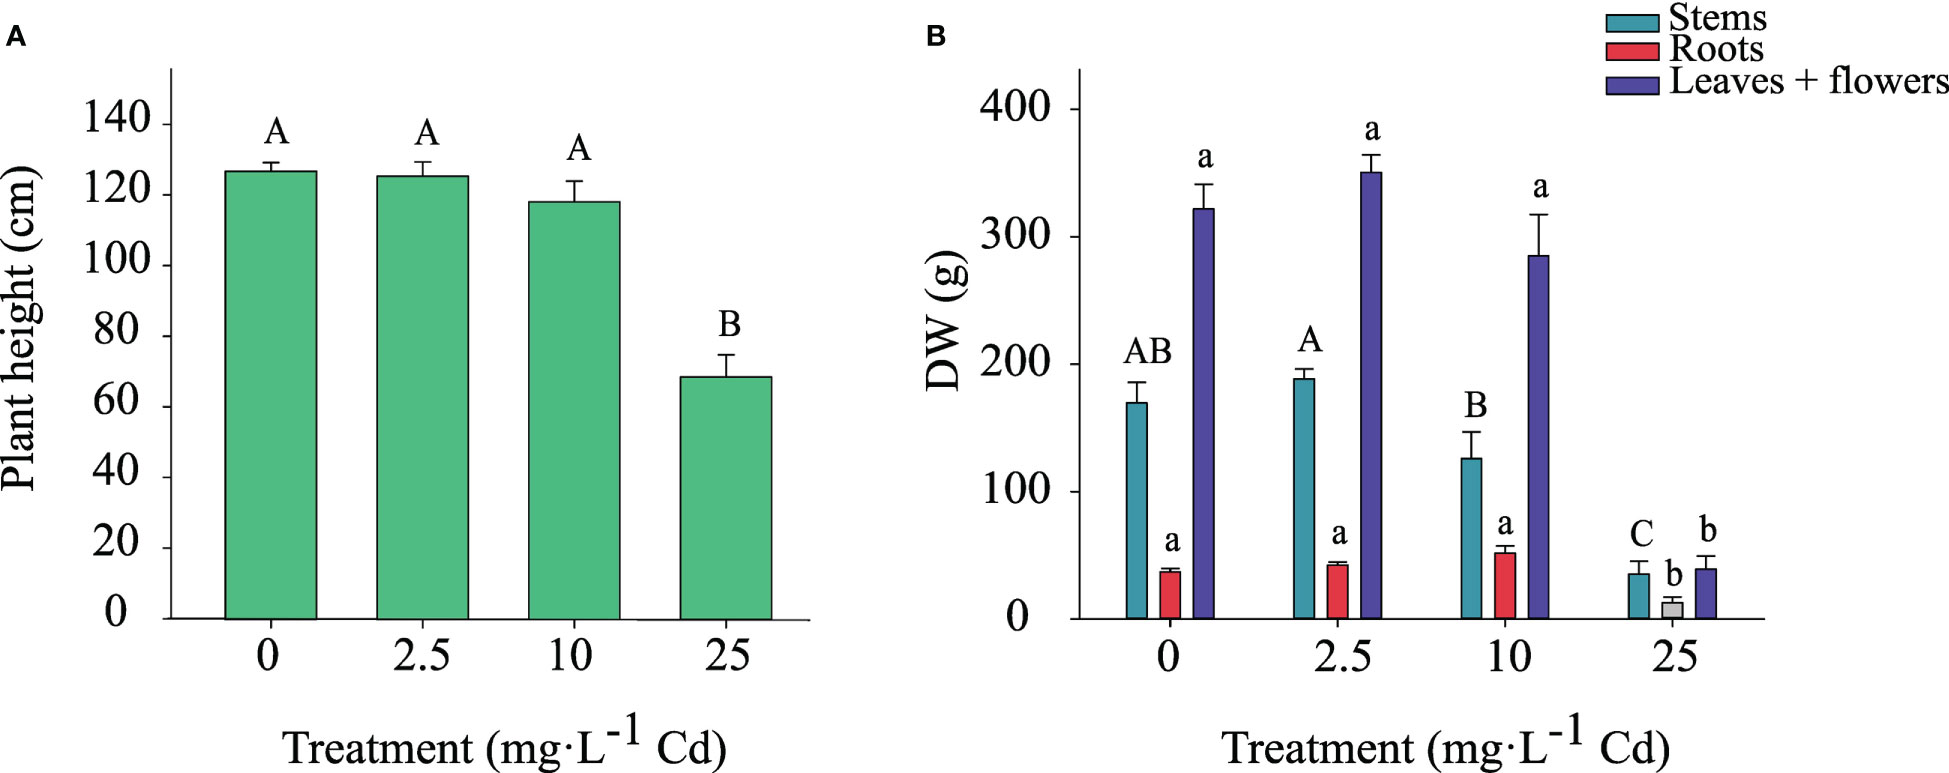
Figure 3 Shoot height ± SE at harvest (A). Dry weight of stems, roots, and flowers + leaves at harvest ± SE (B). Bars associated with the same letter(s) are not significantly different at P ≤ 0.05 according to Tukey’s HSD all pairwise comparison test.
3.3 Cadmium concentration in plant tissues
Analysis of Cd in nutrient solutions at the beginning and end of each 14-d cycle indicates that Cd treatments were applied at intended levels and that Cd was not completely depleted during the growing cycle (Table 1). With increasing concentrations of Cd in the nutrient solution, plant uptake of Cd increased, particularly during the first 28 d of Cd exposure. However, after 28 d of exposure, Cd uptake declined in the 25 mg·L-1 Cd treatment. This was concurrent with a decline in plant health. In the 10 mg·L-1 Cd treatment, Cd uptake rate increased between 28 and 56 d of exposure but declined after 56 d of exposure. These data suggest a continued uptake of Cd during plant growth and development phase including flowering. However, considering that plants exhibited growth during this entire period, increased uptake may be due to increase in plant biomass.
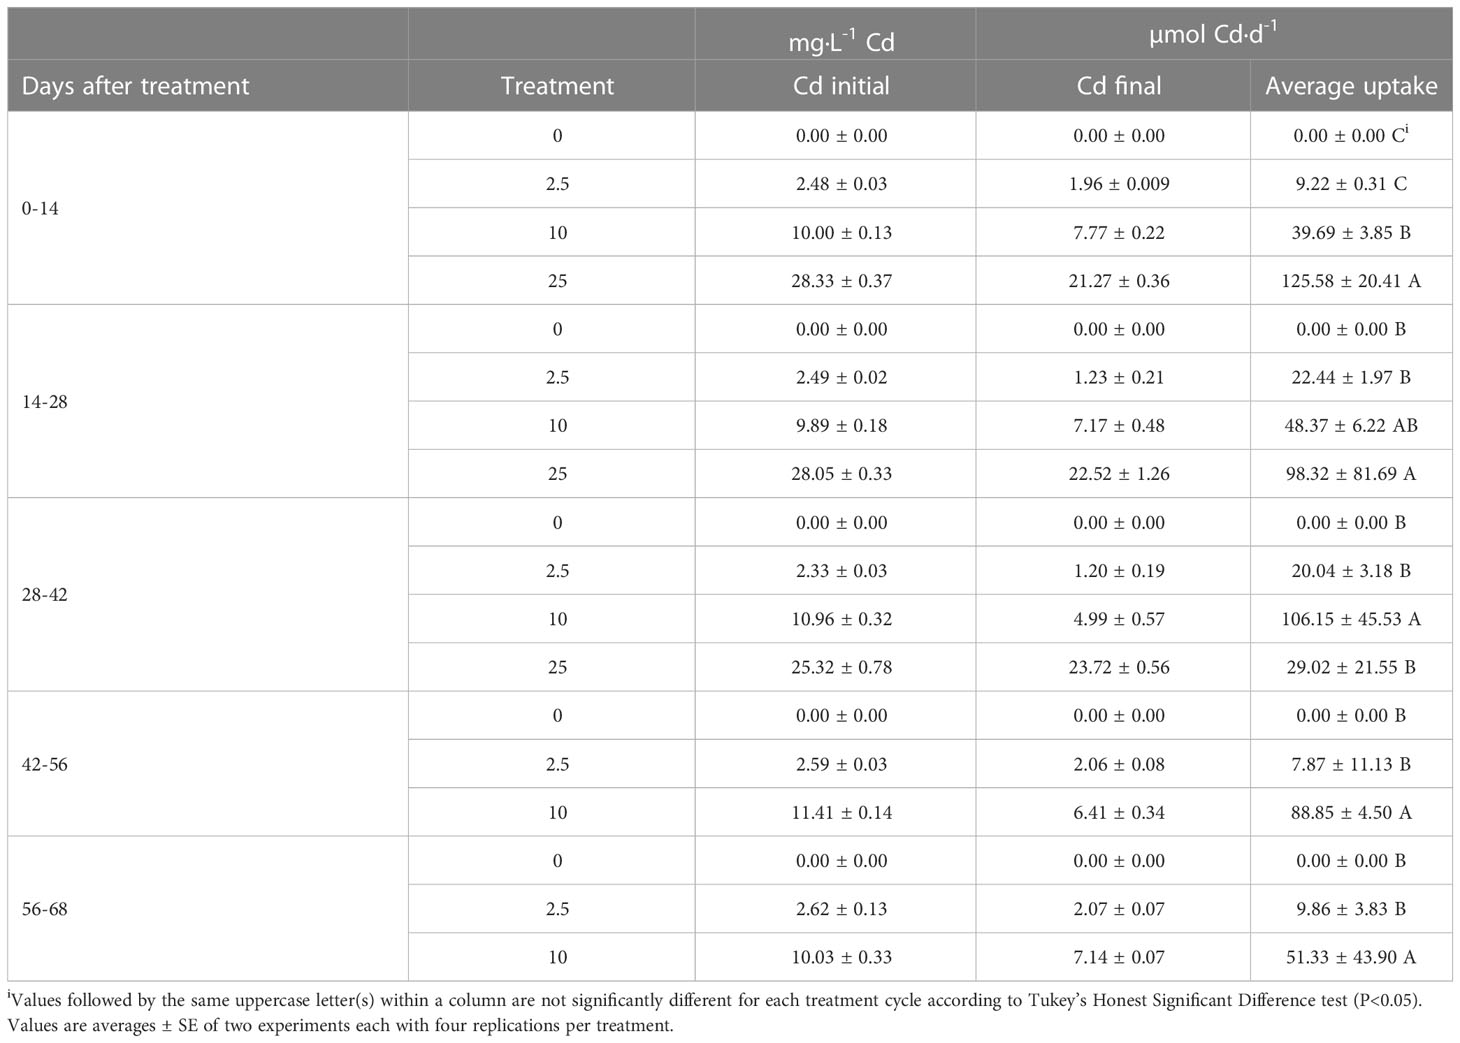
Table 1 Mean concentrations of cadmium (Cd) in nutrient solutions measured at the beginning and end of each 14-d cycle and daily uptake.
There was a significant Cd by experiment interaction for Cd concentrations in plant tissue; therefore, Cd accumulation data are presented separately for each experiment. Although Cd concentrations in the different tissues were generally higher in experiment 1, overall Cd accumulation trends were similar in both experiments (Table 2). Cadmium concentrations were greatest in root tissue, ranging from 2.5 to 12,663 mg·kg-1 in the 0 and 25 mg·L-1 Cd treatments, respectively. With increasing Cd concentrations in the solution, there was an increase in Cd concentration in root tissue in all Cd treatments compared to the control treatment. Cadmium concentration in the roots was approximately 150-times greater than in the leaves for the 2.5 mg·L-1 Cd treatment, indicating that hemp preferentially sequesters Cd in roots, as reported in previous studies (Citterio et al., 2003; Angelova et al., 2004; Linger et al., 2005; Shi & Cai, 2009; Shi et al., 2012; Luyckx et al., 2021).
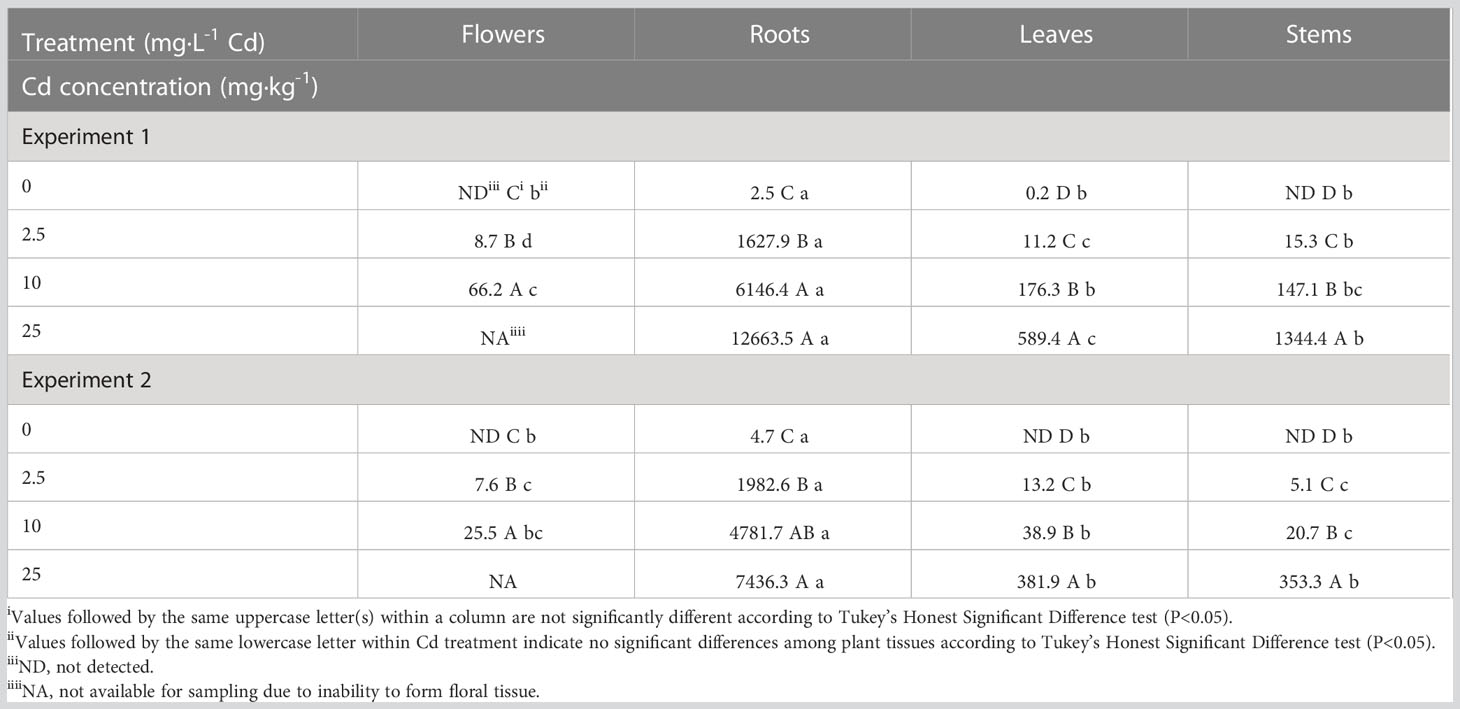
Table 2 Average cadmium (Cd) concentration in hemp (Cannabis sativa L.) ‘Purple Tiger’ plant tissue on a dry weight (dw) basis.
The 10 mg·L-1 Cd treatment had higher Cd concentrations in leaf, flower, and stem tissues compared to 0 and 2.5 mg·L-1 Cd treatments. These results suggest that hemp plants subjected to 10 mg·L-1 Cd treatment tolerated increased Cd concentrations in multiple tissues without significant alterations in plant biomass. Plants in the 25 mg·L-1 Cd treatment exhibited the highest Cd concentrations in leaf and stem tissues in both experiments. Plants exposed to 25 mg·L-1 Cd senesced before full flower development was completed; therefore, Cd concentration was not measured in floral tissue in this treatment.
Previously Cd concentrations in stems were reported to be greater than leaves in hemp fiber cultivars (Angelova et al., 2004; Luyckx et al., 2021). In the present study, Cd distribution within flower, leaf, and stem tissues was inconsistent between the two experiments, suggesting that environmental conditions may impact metal concentrations in different plant tissues. Average air temperatures were increased slightly in experiment 2 (22.1 °C) compared to experiment 1 (19.4°C). However, the average DLI increased from 30.9 mol·m-2·d-1 in experiment 1 to 47.8 mol·m-2·d-1 in experiment 2 due to increasing day length and light intensities during the second experiment. While the role of light intensities on Cd accumulation has not been thoroughly evaluated, there is evidence that light spectrum can influence transcript abundance of the metal transporter gene HMA3, affecting Cd tolerance in cucumber (Guo et al., 2022). Further, Cannabis growth and morphology has been documented to respond positively to increasing DLI, which may have resulted in differences in Cd concentrations in the two experiments (Rodriguez-Morrison et al., 2021; Moher et al., 2022)
The cultivar used in current study was selected for cannabinoid production, suggesting that genetics may also affect metal accumulation in plant tissues. Although most previous work has focused on root and stem tissues, a study conducted in metal-contaminated soil reported significant high concentrations of Cd in hemp flowers compared to other plant tissue Angelova et al. (2004).
Our results also suggest that when exposed to significant levels of plant available Cd, such as is the case in a hydroponic production system, Cd can accumulate in floral material in plants with a typical morphology (Figure 2). Current limits for Cd in hemp flower range from 0.2 to 0.82 μg/g (California Code of Regulations, 2018; The Maryland Medical Cannabis Commission, 2020; Washington State Liquor and Cannabis Board, 2021). Our data indicate that concentration of Cd in plants exposed to 2.5 mg·L-1 Cd was approximately 40 times higher than the legal limit for Cd in hemp flower in several states in the U.S.
3.4 Photochemical efficiency
Because there was no significant interaction between Cd treatments and experiments, Fv/Fm data were pooled. There was no impact of Cd on Fv/Fm in plants growing under 0, 2.5, and 10 mg·L-1 Cd treatments at 14 or 45 DAT. At 14 and 45 DAT, Cd levels of 25 mg·L-1 Cd reduced Fv/Fm to 0.78 and 0.62 respectively, indicating that photosystem II of these plants was damaged in response to the high Cd concentrations (Figure 4). Reductions in Fv/Fm indicate photoinhibition damage or other damage to photosystem II in response to environmental stresses (Maxwell and Johnson, 2000).
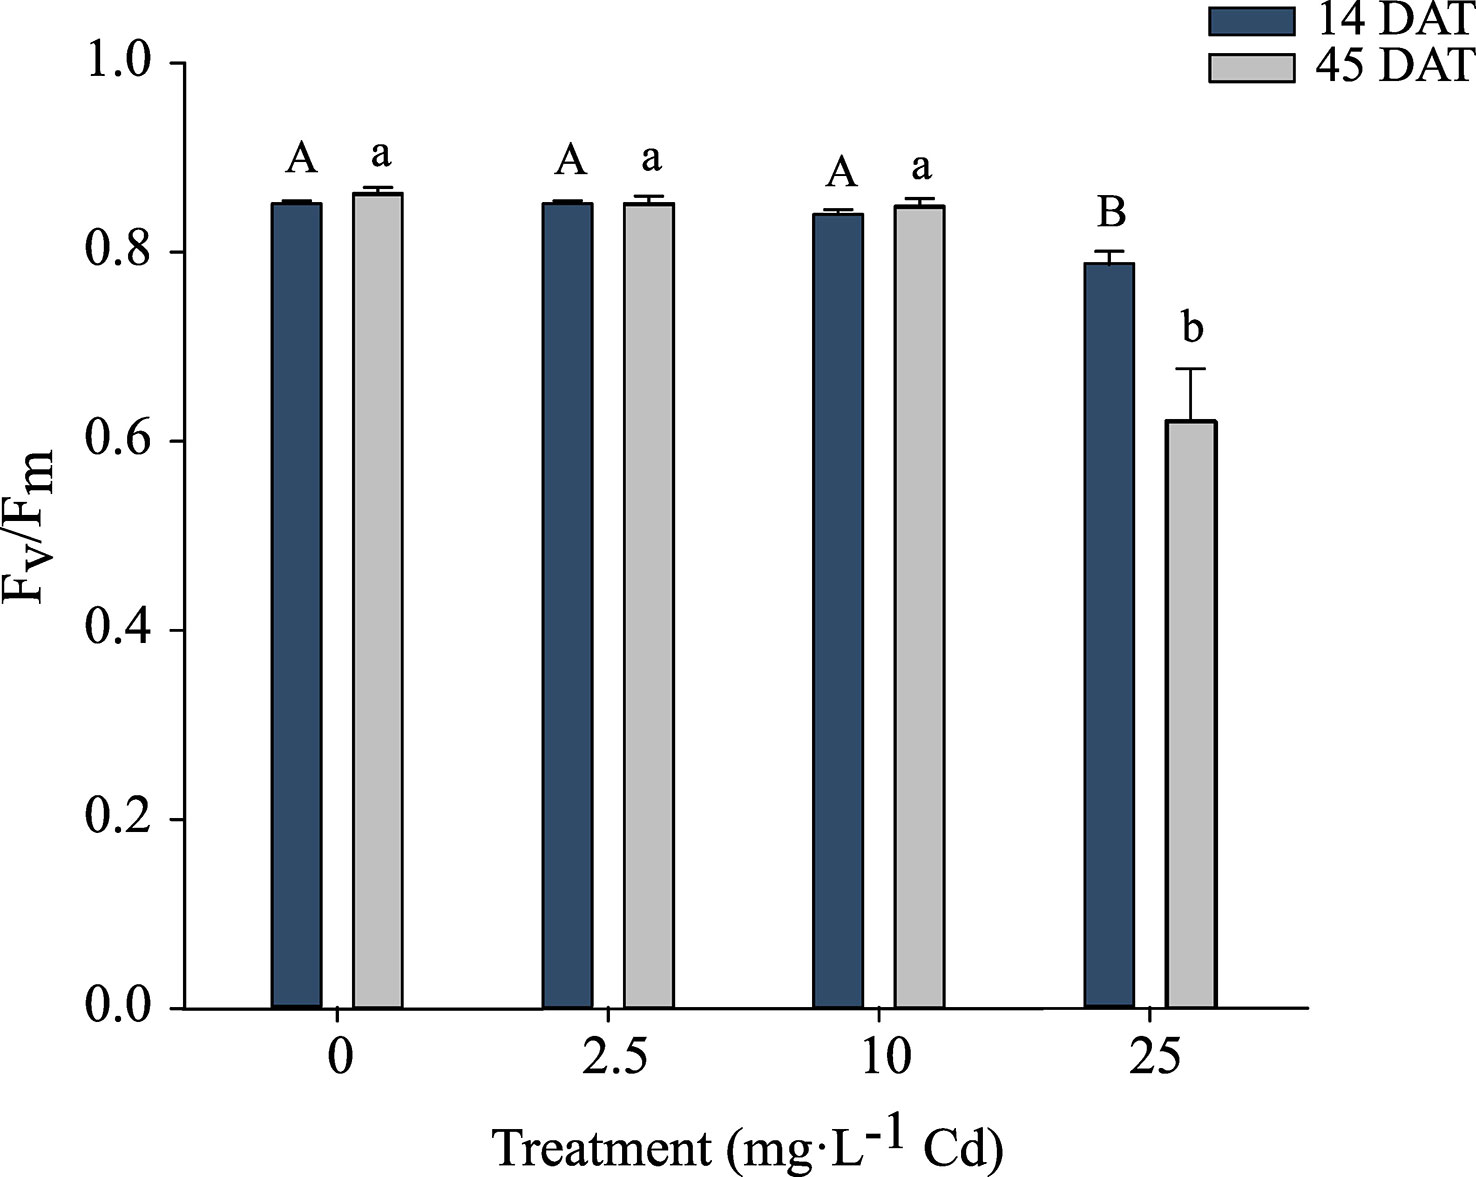
Figure 4 Maximum photochemical yield of Photosystem II (Fv/Fm) ± SE in hemp (Cannabis sativa L.) ‘Purple Tiger’ 14 and 45 d after treatment (DAT). Bars associated with the same letter(s) are not significantly different at P ≤ 0.05 according to Tukey’s HSD all pairwise comparison test.
The CCI was measured at 14 and 45 DAT. Despite similar trends, results for the two experiments are shown separately, as there was a significant interaction between experiment and Cd treatment. In experiment 1, plants exposed to 10 and 25 mg·L-1 Cd had a lower CCI at 14 DAT when compared to lower Cd treatments (0 and 2.5 mg·L-1 Cd) (Figure 5A). At 45 DAT, plants exposed to 10 mg·L-1 Cd had a similar CCI to the 0 and 2.5 mg·L-1 Cd treatments (Figure 5C), suggesting that the CCI in the 10 mg·L-1 Cd had recovered during the subsequent growth period. However, in experiment 2, the CCI in plants exposed to 10 mg·L-1 Cd remained lower than the 0 mg·L-1 Cd treatment at 45 DAT. Overall this decrease in CCI at 10 mg·L-1 Cd did not affect PSII efficiency (Figure 4). This may explain why biomass at 10 mg·L-1 Cd was not reduced compared to lower Cd treatments. The CCI in plants exposed to 25 mg·L-1 Cd were significantly lower than all the other treatments, throughout both studies, suggesting that the Cd concentrations in leaf tissue in the 25 mg·L-1 Cd treatment limited CCI and photosynthetic efficiency. Consistently, leaf chlorosis was observed at this treatment level. The reductions in Fv/Fm at 25 mg·L-1 Cd in this study may suggest photoinhibition damage, which has been observed in response to numerous environmental stresses (Maxwell and Johnson, 2000).
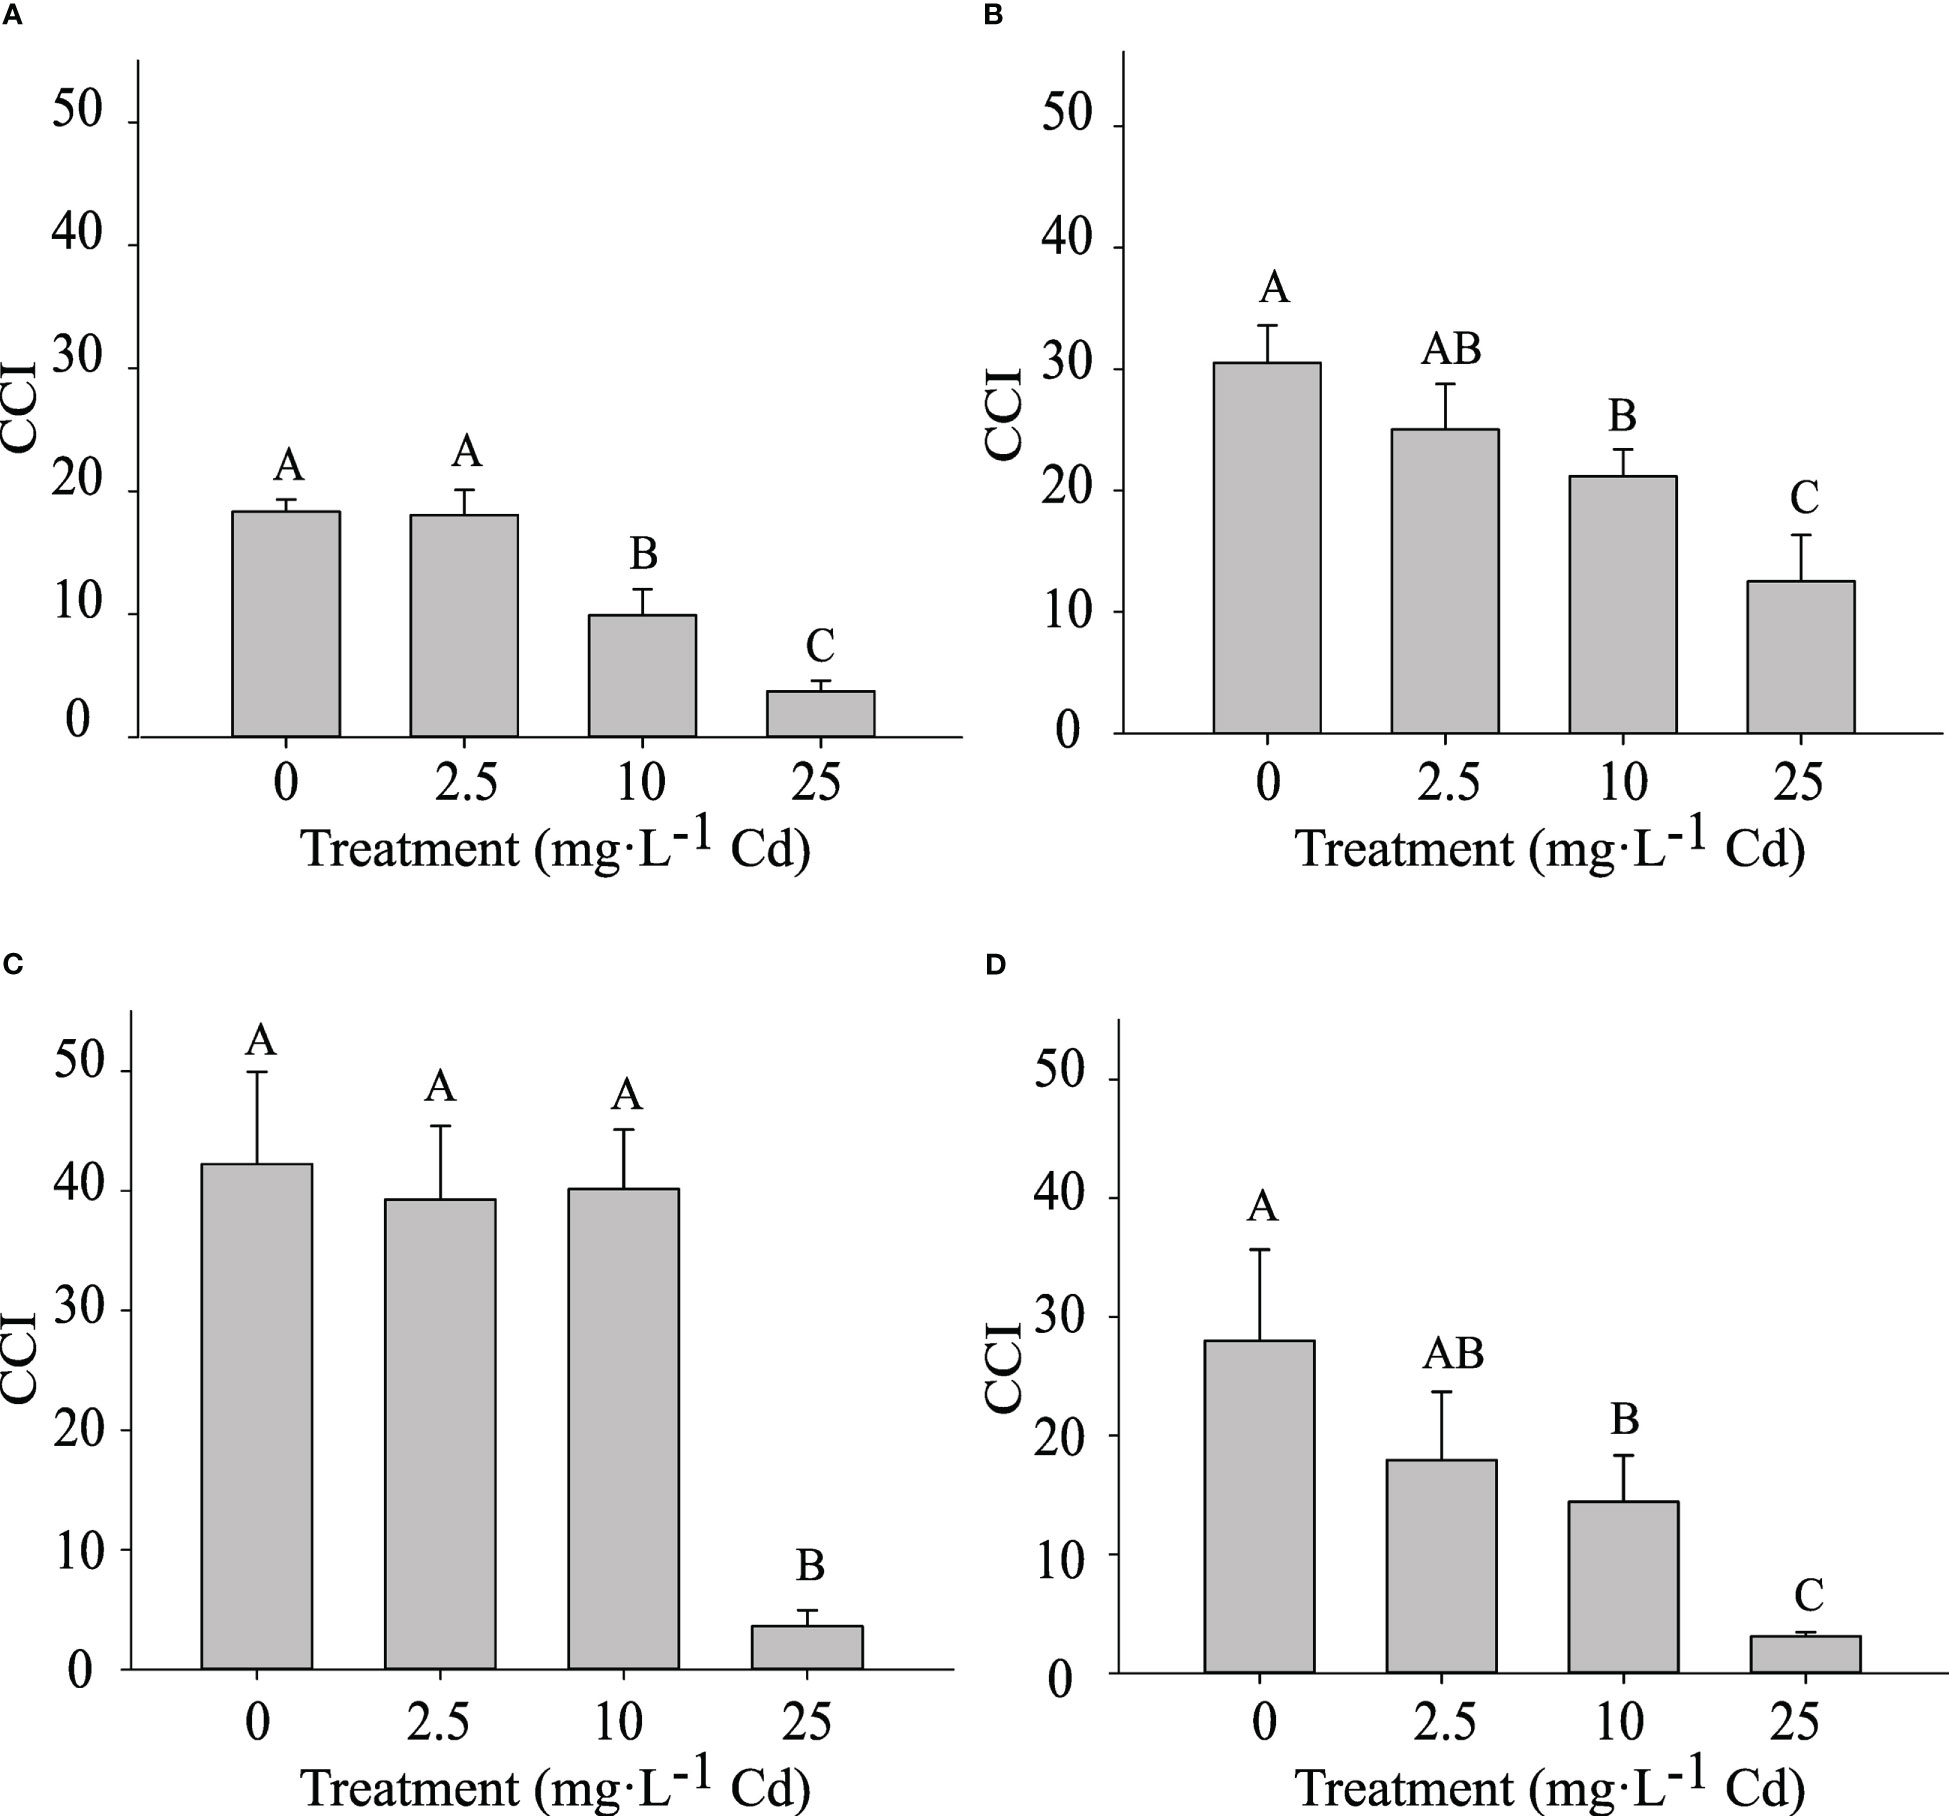
Figure 5 Chlorophyll Content Index (CCI) ± SE in in hemp (Cannabis sativa L.) ‘Purple Tiger’ experiment 1 at 14 d after treatment (DAT) (A) and 45 DAT (C) and CCI in experiment 2 at 14 DAT (B) and 45 DAT (D). Bars associated with the same letter(s) are not significantly different at P ≤ 0.05 according to Tukey’s HSD all pairwise comparison test.
Cadmium stress can also trigger oxidative stresses, leading to the accumulation of reactive oxygen species (ROS) (Gillet et al., 2006; Eutropio et al., 2016; Taiz et al., 2015; Singh et al., 2016). Further, metals such as Cd have been reported to replace essential nutrients, disrupting essential reactions in plants (Taiz et al., 2015). These processes can trigger a Cd-induced stress response that can inhibit chlorophyll and carotenoid biosynthesis, disturb chloroplast structure, and ultimately hamper photosynthetic efficiency (Küpper et al., 2002; Mallick and Mohn, 2003; Gillet et al., 2006; Parmar et al., 2013).
3.5 Total THC and CBD concentrations
There was an interaction between experiments and Cd treatments for total CBD concentrations, therefore, results from each experiment are presented separately. Total CBD concentrations in the flower material were not impacted by Cd treatments in experiment 1, with average concentrations of 4.94%. However, in experiment 2, CBD concentrations decreased from 9.52% to 7.47% (1.27-fold reduction) in the 0 mg·L-1 and 10 mg·L-1 Cd treatments, respectively (Table 3). Similar to CBD, total THC concentrations were not different among treatments and averaged 0.14% in experiment 1. In experiment 2, there was a reduction from 0.39 to 0.31% (1.25-fold reduction) in the 0 and 10 mg·L-1 Cd treatments, respectively.
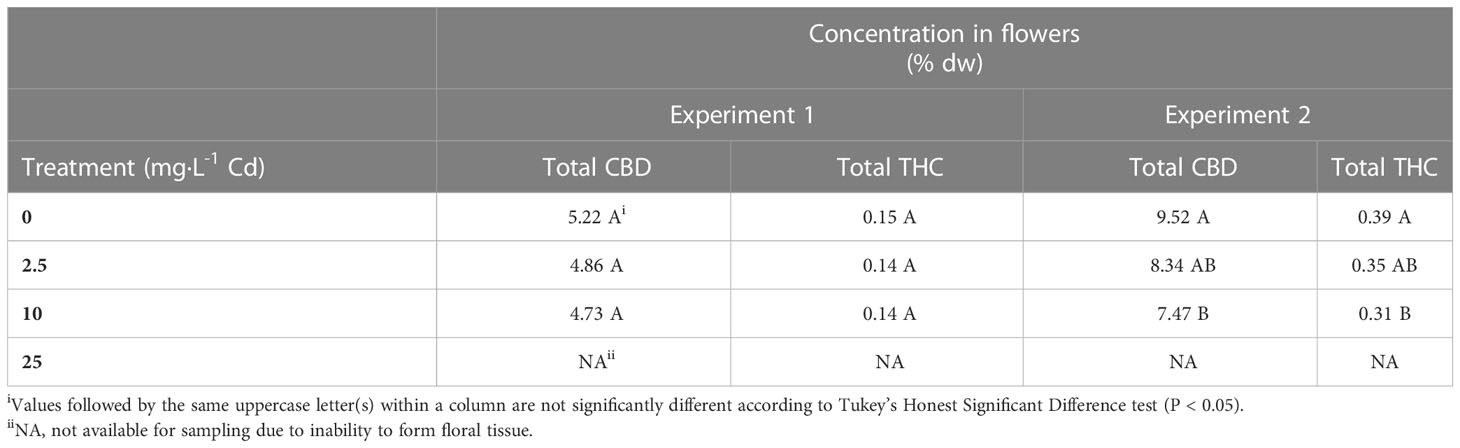
Table 3 Average total CBD and THC in hemp (Cannabis sativa L.) Purple Tiger.
The legal threshold concentrations of THC imposed by the U.S. for industrial hemp is 0.3%. In experiment 2, these threshold levels were exceeded even under the 0 mg·L-1 Cd treatment, suggesting that changes in environmental conditions between experiment 1 and 2 may have influenced total THC content. It is not uncommon for high CBD hemp cultivars, such as Purple Tiger, to have THC concentrations exceeding the 0.3% threshold (Stack et al., 2019; Yang et al., 2020; Coolong et al., 2023). Although variation in cannabinoid concentrations is largely impacted by genetics, it is also understood that there are genetic and environmental interactions that may impact cannabinoid concentrations (Trancoso et al., 2022). Rodriguez-Morrison et al. (2021) and Potter and Duncombe (2011) reported no significant impact of light intensity on cannabinoid concentration in floral tissue, though due to overall increases in yield, total cannabinoid production per plant increased with increasing light intensity. Plants in both experiments were harvested at the same number of days after planting; however, the slightly increased air temperature and increased DLI in experiment 2 may have hastened flower development, which could have led to increased concentrations of cannabinoids in experiment 2 (Yang et al., 2020)
Our results contrast with Husain et al. (2019), who reported total CBD concentrations were greater in the hemp cultivar Fedora 17, grown in mine-land soil containing 0.34 mg·L-1 Cd, when compared to plants grown in a commercial substrate containing < 0.25 mg·L-1 Cd. However, in agreement with our results, total THC concentrations were higher in plants grown in the commercial substrate compared to Cd-contaminated soil (Husain et al., 2019). Our results do not clearly suggest a link between Cd and concentrations of THC and CBD, particularly since differences were noted only in experiment 2. Further, Cd levels in flower tissue were 2.6-fold lower in experiment 2 than in experiment 1 suggesting a potential interaction between Cd concentration in flowers and environmental factors, leading to a decrease in resources allocated for cannabinoid production (Trancoso et al., 2022).
3.6 Transcript abundance of metal transporter and cannabinoid biosynthetic genes
Spatial and temporal expression patterns of genes coding for metal transporters, CsHMA1, CsHMA3, CsHMA3-C, CsHMA4, CsHMA5, CsPAA1, and CsPAA2, were analyzed in roots, leaves, and flowers of plants exposed to Cd treatments at three time points: 2, 45, and 68 (harvest) DAT. In addition, transcript expression of cannabinoid synthase genes, CsTHCAS and CsCBDAS, were analyzed in leaf and flower tissues. In flowers, none of the transporter and cannabinoid genes analyzed displayed quantifiable expression except for CsHMA5. Further, transcript abundance of CsHMA5 in flowers was also low and not significantly affected by treatments at harvest (Supplemental Figure 1A). The transcript abundance of the reference genes in flower tissue was comparable to that in other tissues suggesting optimal RNA integrity. Thus, it is very likely that genes analyzed in this study were not expressed or expressed at very low levels (below the detection limit) in the flower tissue.
In general, all metal transporters tested had higher transcript abundance in roots when compared to leaves at 2 DAT (Figure 6A), and at other time points (data not shown). Transcript abundance of CsHMA5 in leaves was upregulated by 3-fold in response to the 25 mg·L-1 Cd treatment when compared to the control (0 mg·L-1 Cd) at 45 DAT (Supplemental Figure 1B). However due to Cd toxicity and leaf yellowing, only two replications were analyzed at this stage. Transcript abundance of all seven metal transporters in root tissues was normalized to that of CsHMA3 exposed to 0 mg Cd·L-1 at 2 DAT to identify the most abundantly expressed genes. Among the seven metal transporter genes evaluated, CsHMA5 and CsPAA2 were generally highly expressed in roots with CsHMA1, CsHMA3, and CsPAA1 showing intermediate expression, and CsHMA3-C and CsHMA4 being least abundant (Figure 6B).
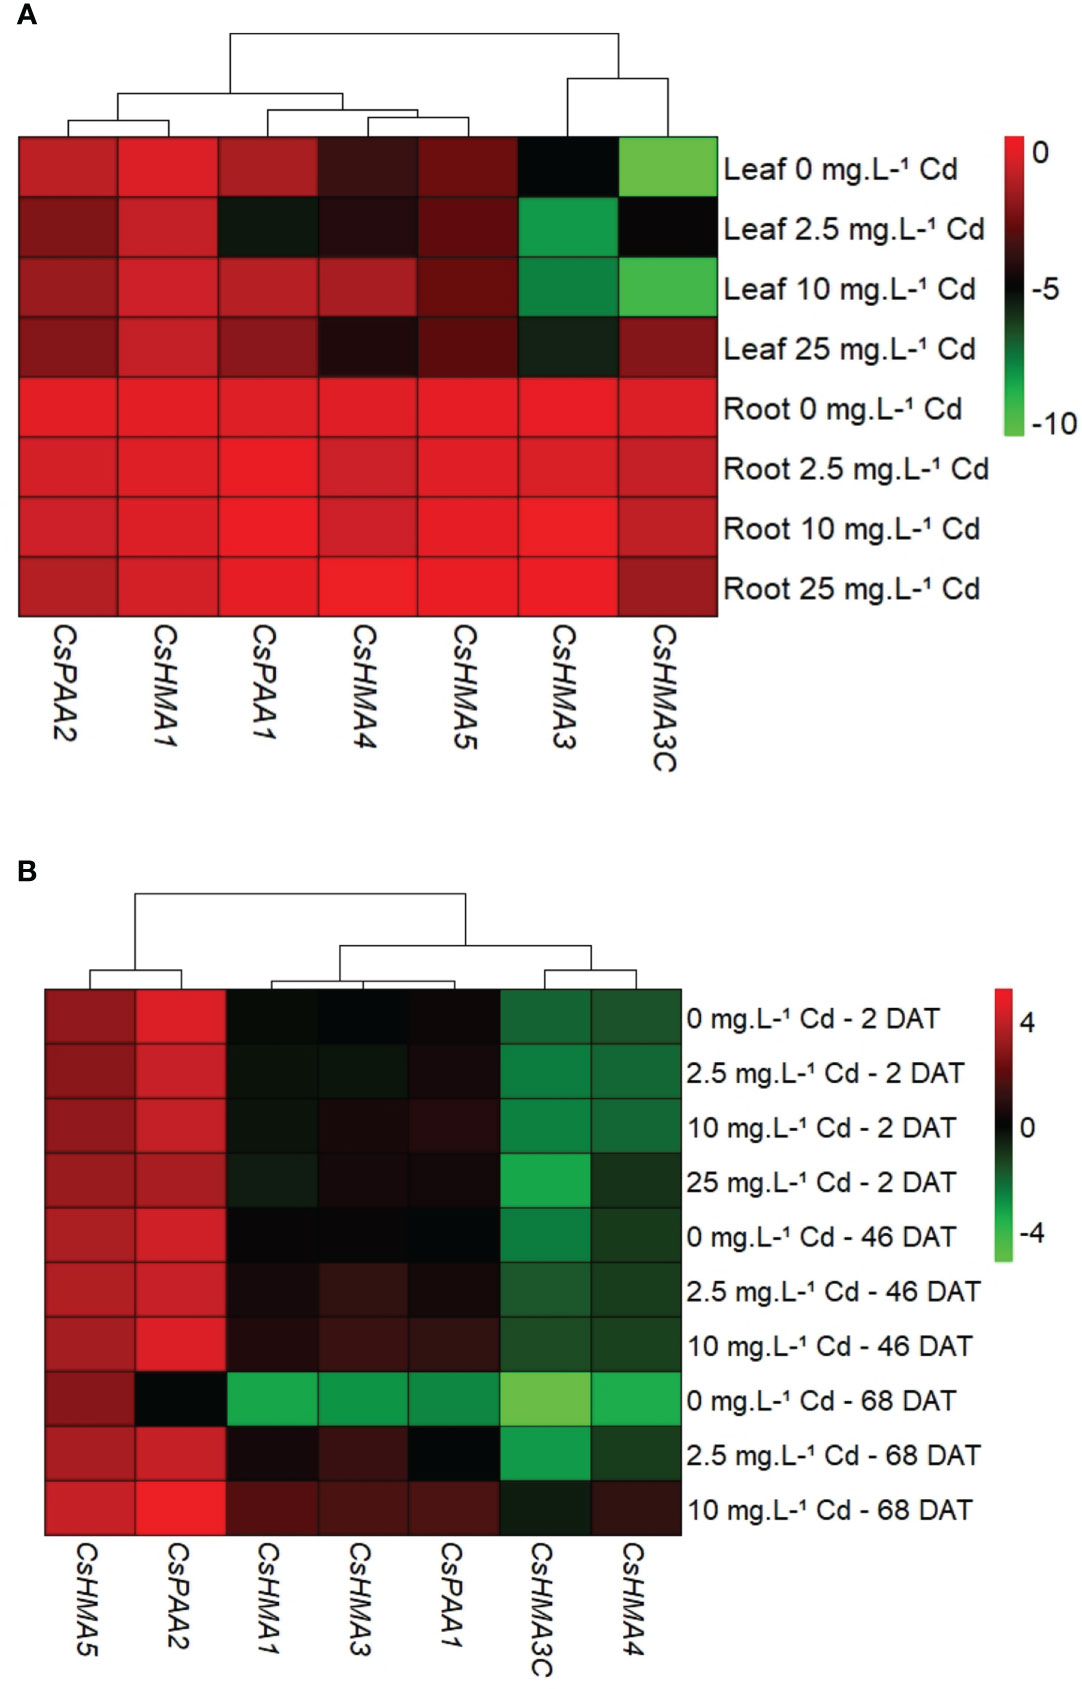
Figure 6 Spatial expression of metal transporter genes at 2 d after treatment (DAT). Transcript abundance of each gene in both tissues was normalized to its expression in roots at 2 DAT (A). Temporal expression of metal transporter genes in root tissues. Transcript abundance of each gene in both tissues was normalized to CsHMA3 expression at 2 DAT (B).
CsHMA3 was upregulated by 2.7- and 3-fold in plants exposed to 10 mg·L-1 Cd at 45 and 68 DAT, respectively (Figure 7B). CsHMA1, CsHMA4, and CsHMA5 were upregulated by 4-, 6-, and 2-fold, respectively, in plants exposed to 10 mg·L-1 Cd at 68 DAT (Figures 7A, D, E). The three remaining transporter genes, CsHMA3-C, CsPAA1, and CsPAA2 showed a trend of increasing abundance under 10 mg·L-1 Cd treatment at 68 DAT, but were not significantly different compared to the control treatment (Figures 7C, F, G). Transcript abundance of two transporter genes at harvest, CsHMA1 and CsHMA5 were positively correlated to Cd concentrations in roots (Table 4).
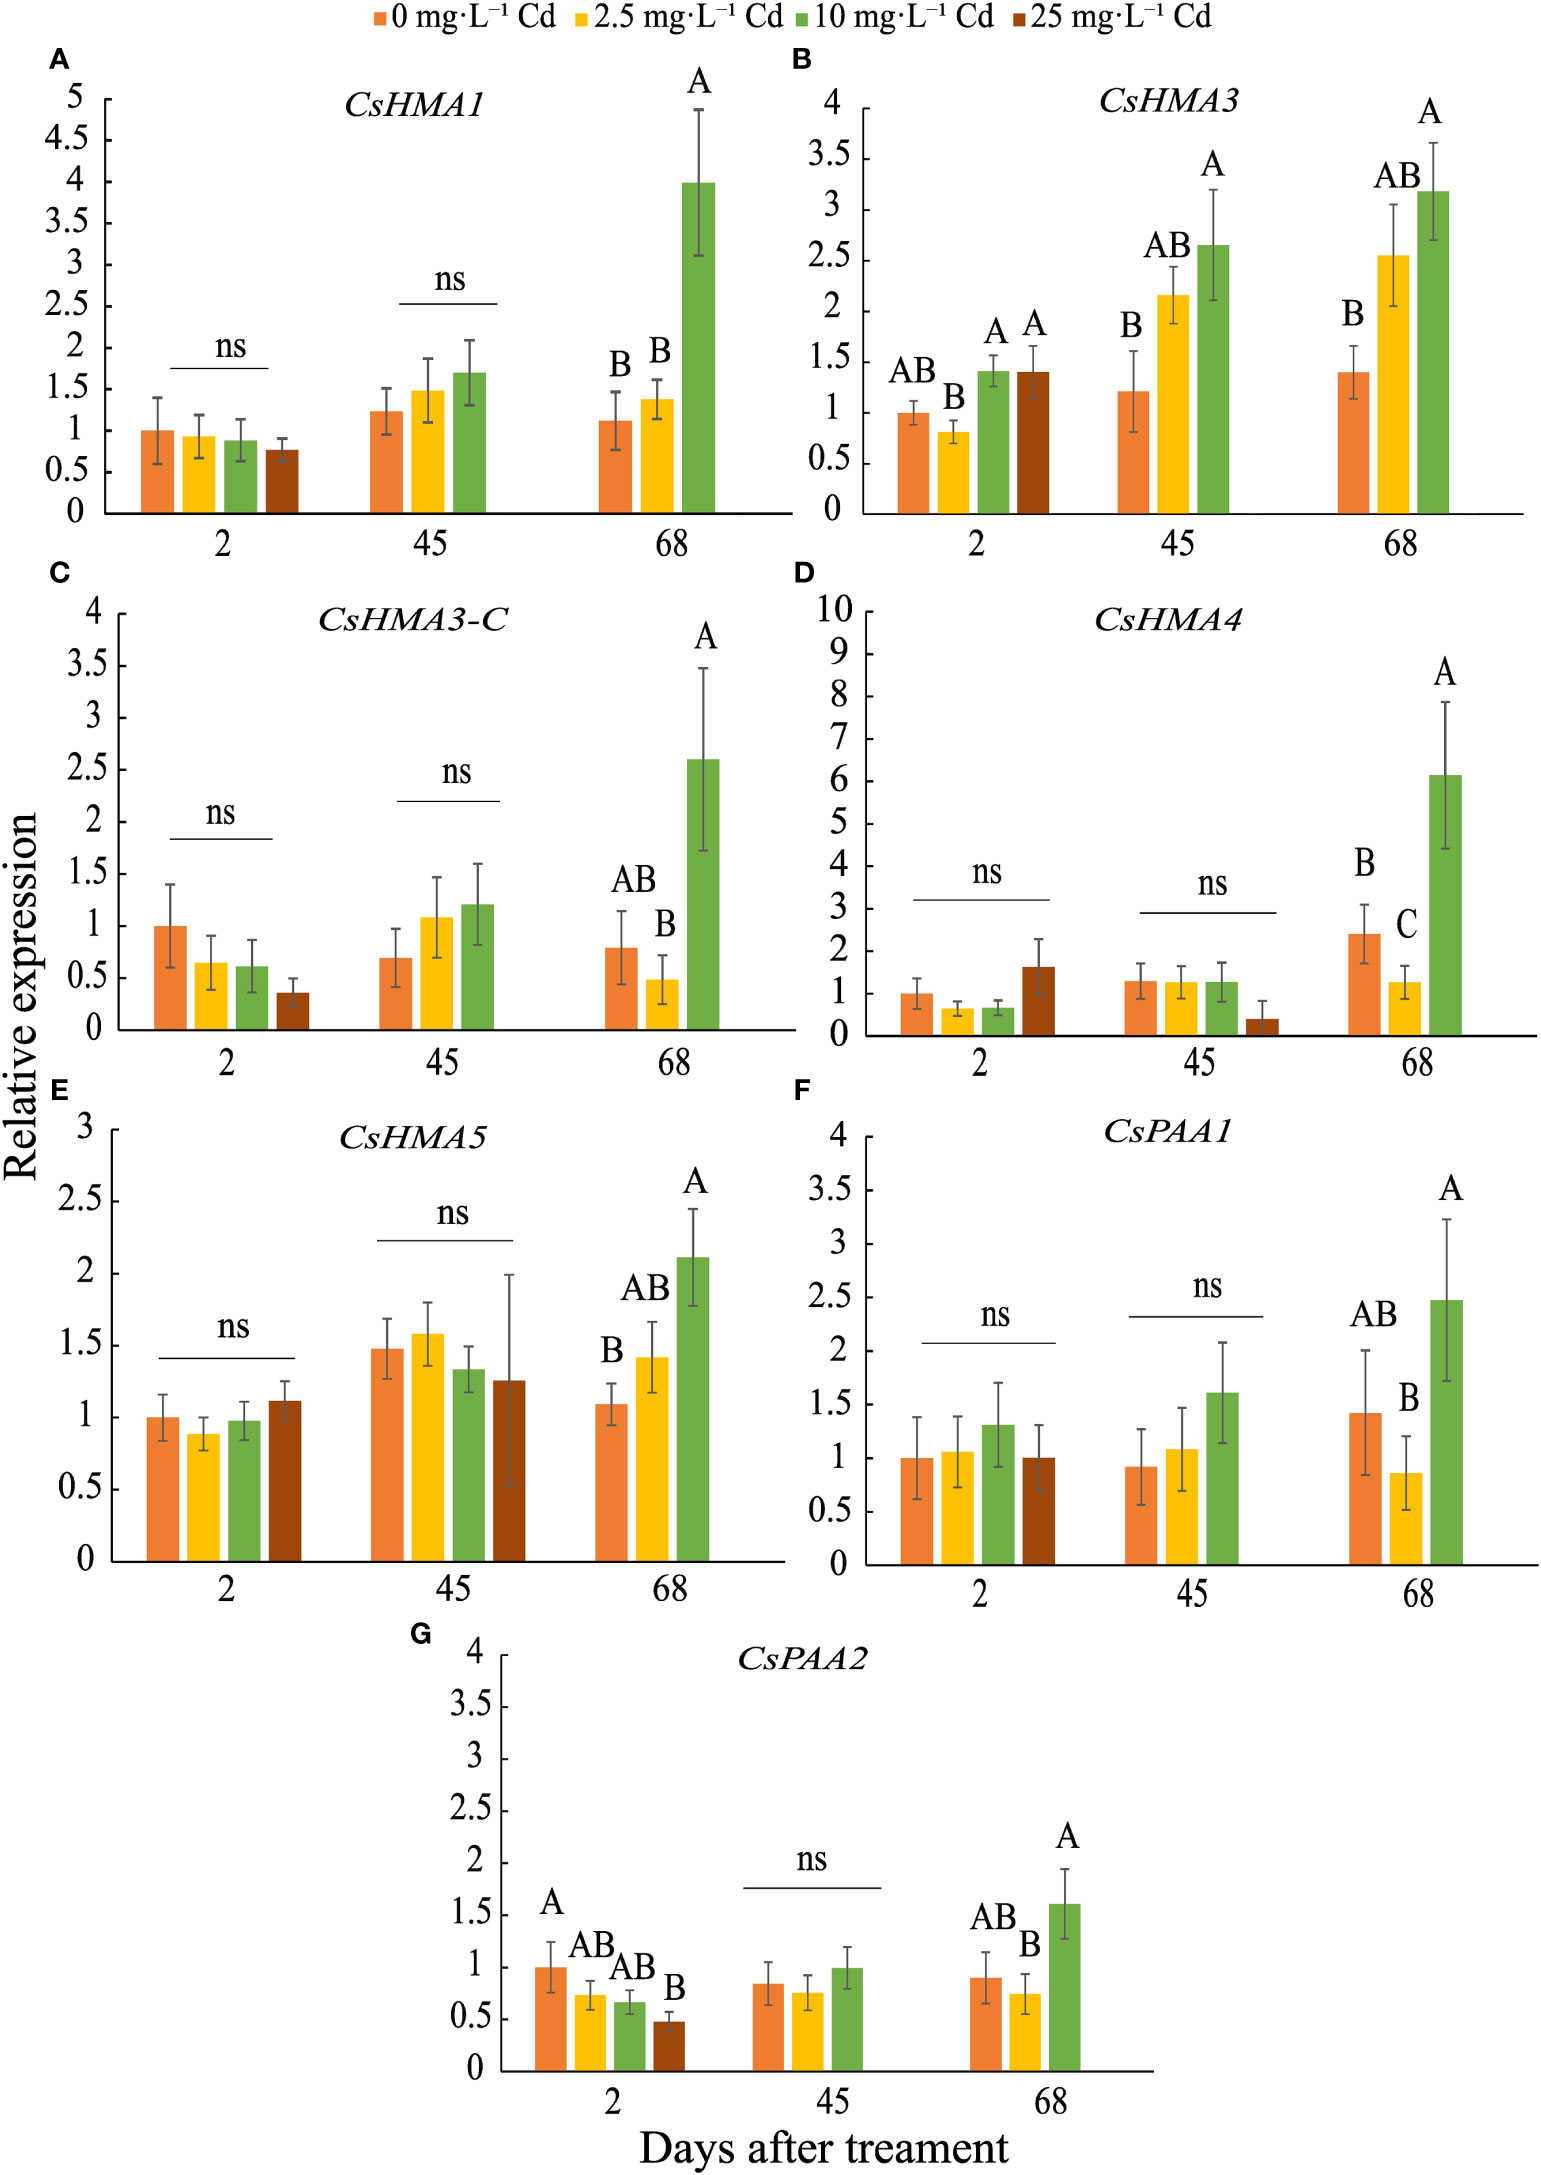
Figure 7 Relative expression ± SE of CsHMA1 (A), CsHMA3 (B), CsHMA3-C (C), CsHMA4 (D), CsHMA5 (E), CsPAA1 (F), and CsPAA2 (G) in roots of plants exposed to 0, 2.5, 10, and 25 mg.L-1 Cd at 2, 45, and 68 d after Cd treatment (DAT). Bars associated with the same letter(s) are not significantly different at P ≤ 0.05 according to Tukey’s HSD all pairwise comparison test. ns, not significant.
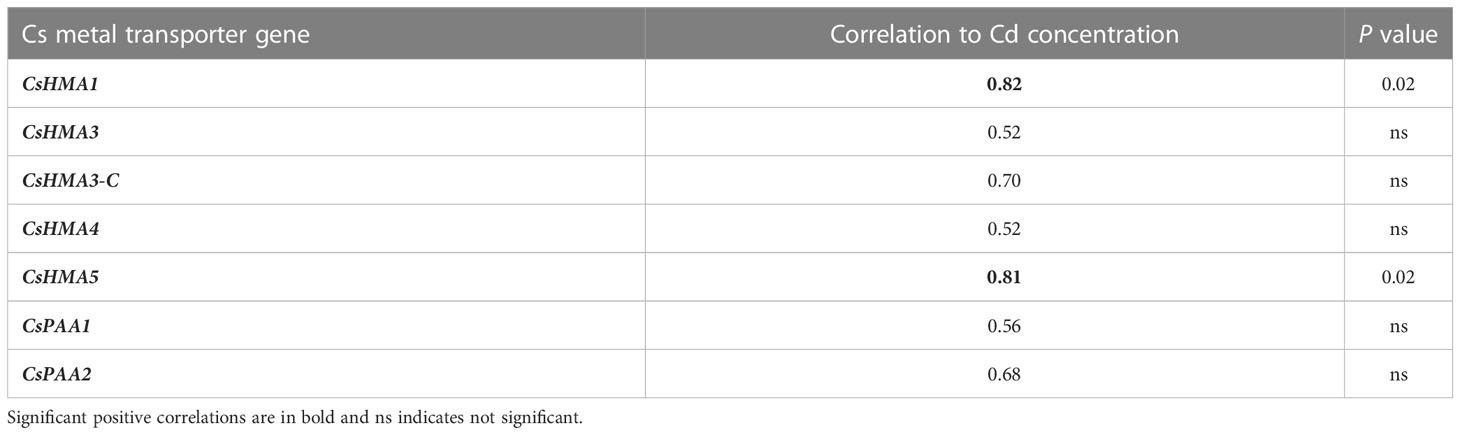
Table 4 Correlation between transcript expression of Cs metal transporter genes and Cd concentration in roots at 68 DAT.
Metal transporters from the heavy metal ATPase (HMA) family have been categorized into two subgroups based on their specificity of metal substrates. These are the Zn-ATPases (Zn2+/Cd2+/Co2+/Pb2+ specificity) and Cu-ATPases (Cu2+/Ag2+ specificity) which may be regulated within certain tissues or subcellular compartments (Takahashi et al., 2012; Wang et al., 2018; Zhang et al., 2018). A. thaliana has eight HMA genes of which AtHMA1-4 belong to the former group whereas AtHMA5-8 are closely related to the Cu2+/Ag2+ subclass. Based on the phylogenetic analysis, most similarities were observed between CsHMA1 and AtHMA1, CsHMA3/CsHMA3-C and AtHMA2-4, CsHMA4/CsHMA5 and AtHMA7 and AtHMA5, CsPAA1 and AtHMA6, and AtHMA8 and CsPAA2 (Figure 1).
AtHMA1 has been shown to play role in detoxification of excess Zn and is localized to the chloroplast envelope (Kim et al., 2009). Transcript abundance of CsHMA1, most closely related to AtHMA1, was upregulated in response to 10 mg·L-1 Cd at 68 DAT, suggesting that this gene is transcriptionally regulated during advanced growth stages, perhaps leading to greater plant Cd uptake and accumulation. Previous findings reported on the role of AtHMA3 and its orthologues on Cd sequestration into root vacuoles (Morel et al., 2009; Miyadate et al., 2011; Ismael et al., 2019). Further, AtHMA2 and AtHMA4 were reported to be involved in Cd uptake and translocation, being expressed in tissues adjacent to the root vascular bundle for loading Cd into the xylem (Wong & Cobbett, 2009; Ismael et al., 2019). CsHMA3 was the only transporter induced during mid and late growth stages at 45 and 68 DAT, and similar to AtHMA2-4 may be involved in Cd uptake, sequestration into the root vacuoles, and possibly xylem loading. Migocka et al. (2015) reported that in cucumber (Cucumis sativus) HMA3 was upregulated in roots in response to Cd exposure and conferred tolerance to heavy metal detoxification through sequestration in the vacuole. Further, HMA3 expression was greater in response to Cd exposure compared to HMA4 in cucumber, though activity of HMA4 was higher when exposed to elevated levels of Zn, suggesting that HMA4 may have been more efficient as a Zn2+-ATPase compared to a Cd2+-ATPase (Migocka et al., 2015).
As noted earlier, AtHMA5-8 belong to the Cu2+/Ag2+ ATPase subgroup and functions in Cu transport. AtHMA5 was predicted to be mainly expressed in roots and involved in Cu2+ transport, compartmentalization, and detoxification (Axelsen & Palmgren, 2001; Andres-Colas et al., 2006). Although CsHMA4 and CsHMA5 fall within this subclass, our data indicate the upregulation of these transporter genes under long-term Cd stress. Similarly, Populus tomentosa HMA5 shared similarity with AtHMA5, and overexpression of PtoHMA5 in tobacco plants increased Cd translocation from roots to leaves, suggesting its role in Cd transport (Wang et al., 2018). Similarly, upregulation of a putative Cu-transporting ATPase, HMA5 was found to be induced by Cd exposure in peanut (Chen et al., 2019) and durum wheat (Aprile et al., 2018).
Overall, the seven transporter genes were expressed in root tissue and potentially involved in cation uptake, including Cd. When Cd levels increased during the course of plant growth under the 10 mg·L-1 Cd treatment, CsHMA1, CsHMA3, CsHMA4 and CsHMA5 transcript abundance were upregulated in the roots possibly to allow for increased uptake, sequestration, and translocation of Cd. These transporters may play a role in leaf Cd uptake as well; however, leaf Cd concentrations were substantially lower compared to that in roots and may not elicit an increase in their transcript abundance.
Of the two cannabinoid biosynthetic genes, CsCBDAS and CsTHCAS, analyzed in leaf tissue, only the expression of CsTHCAS was downregulated at harvest in plants exposed to 10 mg·L-1 Cd (Supplemental Figure 2B). Cannabinoid levels in flower tissue did not change in experiment 1 and transcript abundance of cannabinoid biosynthetic genes in leaf tissues with cannabinoid levels in flower tissue may not be well correlated. Although previous studies have indicated upregulation of CsCBDAS in flowers with higher total CBD concentrations in Cd contaminated soil (Husain et al., 2019), other studies have proposed that transcript levels of both CsCBAS and CsTHCAS are not well correlated with CBD and THC synthesis (Apicella et al., 2022).
4 Conclusions
Our findings indicate that C. sativa may tolerate Cd exposure of 2.5 and 10 mg·L-1 Cd in a hydroponic solution. Concentrations of 25 mg·L-1 Cd severely restricted growth, reduced Fv/Fm, CCI, and caused premature death. As expected, Cd concentrations were highest in roots, but there was significant accumulation of Cd in leaves, stems, and flowers, with increasing Cd in the nutrient solution. Plant biomass and total CBD and THC in flowers were not significantly different between plants in the control treatment and plants exposed to up to 10 mg·L-1 Cd. Transcript abundance of CsHMA1, CsHMA3, CsHMA4, and CsHMA5 in the roots of C. sativa were upregulated in 10 mg·L-1 Cd treatments, suggesting that they may be associated with Cd uptake, sequestration in roots and xylem loading. While Cd concentrations that were available to plants used in the present study are greater than what would be encountered on agricultural soils, our results indicate that hemp plants have the potential to accumulate Cd in floral tissue. Therefore, heavy metal testing in C. sativa consumer products may be of importance.
Data availability statement
The raw data supporting the conclusions of this article will be made available by the authors, without undue reservation.
Author contributions
All authors listed have made a substantial, direct, and intellectual contribution to the work and approved it for publication.
Acknowledgments
We thank Dr. Allison Justice at The Hemp Mine for providing plant material for this research.
Conflict of interest
The authors declare that the research was conducted in the absence of any commercial or financial relationships that could be construed as a potential conflict of interest.
Publisher’s note
All claims expressed in this article are solely those of the authors and do not necessarily represent those of their affiliated organizations, or those of the publisher, the editors and the reviewers. Any product that may be evaluated in this article, or claim that may be made by its manufacturer, is not guaranteed or endorsed by the publisher.
Supplementary material
The Supplementary Material for this article can be found online at: https://www.frontiersin.org/articles/10.3389/fpls.2023.1183249/full#supplementary-material
References
Ahmad, A., Hadi, F., Ali, N. (2015). Effective phytoextraction of cadmium (cd) with increasing concentration of total phenolics and free proline in Cannabis sativa (L) plant under various treatments of fertilizers, plant growth regulators and sodium salt. Int. J. Phytoremediation 17, 56–65. doi: 10.1080/15226514.2013.828018
Akesson, A., Chaney, R. L. (2019). “Cadmium exposure in the environment: dietary exposure, bioavailability and renal effects,” in Encyclopedia of environmental health, 2nd ed. Ed. Nriagu, J. O. (Cambridge, MA: Elsevier), 475–484. doi: 10.1016/B978-0-12-409548-9.11746-4
Andres-Colas, N., Sancenon, V., Rodriguez-Navarro, S., Mayo, S., Thiele, D. J., Ecker, J. R., et al. (2006). The arabidopsis heavy metal p-type ATPase HMA5 interacts with metallochaperones and functions in copper detoxification of roots. Plant J. 45 (2), 225–236. doi: 10.1111/j.1365-313X.2005.02601.x
Angelova, V., Ivanova, R., Delibaltova, V., Ivanova, K. (2004). Bio-accumulation and distribution of heavy metals in fiber crops (flax, cotton and hemp). Ind. Crops Products 19, 197–205. doi: 10.1016/j.indcrop.2003.10.001
Apicella, P. V., Sands, L. B., Ma, Y., Berkowitz, G. A. (2022). Delineating genetic regulation of cannabinoid biosynthesis during female flower development in cannabis sativa. Plant Direct 6, 1–8. doi: 10.1002/pld3.412
Aprile, A., Sabella, E., Vergine, M., Genga, A., Siciliano, M., Nutricati, E., et al. (2018). Activation of a gene network in durum wheat roots exposed to cadmium. BMC Plant Biol. 18 (1), 238. doi: 10.1186/s12870-018-1473-4
Axelsen, K. B., Palmgren, M. G. (2001). Inventory of the superfamily of p-type ion pumps in arabidopsis. Plant Physiol. 126, 696–706. doi: 10.1104/pp.126.2.696
California Code of Regulations (2018). Bureau of marijuana control proposed text of regulations, Title 16, Division 42, Chapter 5. Available at: https://govt.westlaw.com/calregs/Index?transitionType=Default&contextData=%28sc.Default%29&bhcp=1 (Accessed 1 Oct 2022).
Chaney, R. L. (2010). “Cadmium and zinc,” in Trace elements in soils. Ed. Hooda, P. S. (Chichester, West Sussex, UK: Blackwell Publishing), 409–439. doi: 10.1002/9781444319477
Chen, C., Cao, Q., Jiang, Q., Li, J., Yu, R., Shi, G. (2019). Comparative transcriptome analysis reveals gene network regulating cadmium uptake and translocation in peanut roots under iron deficiency. BMC Plant Biol. 19 (1), 35. doi: 10.1186/s12870-019-1654-9
Citterio, S., Santagostino, A., Fumagalli, P., Prato, N., Ranalli, P., Sgorbati, S. (2003). Heavy metal tolerance and accumulation of cd, cr, and Ni by Cannabis sativa l. Plant Soil 25, 243–252. doi: 10.1023/A:1026113905129
Coolong, T., Cassity-Duffy, K., Joy, N. (2023). Role of planting date on yield and cannabinoid content of day-neutral and photoperiod-sensitive hemp in Georgia, USA. HortTechnology 33, 138–145. doi: 10.21273/HORTTECH05151-22
Creed, J. T., Brockhoff, C. A., Martin, T. D. (1994). “US-EPA Method 200.8: determination of trace elements in waters and wastes by inductively coupled plasma-mass spectrometry,” in Environmental monitoring systems laboratory office of research and development (Cincinnati, Ohio, USA: U.S. Environmental Protection Agency). Revision 5.4 EMMC Version.
ElSohly, M., Gul, W. (2014). Handbook of cannabis. Ed. Pertwee, R. (Oxford, UK: Oxford University Press), 3–22.
Eutropio, F. J., Ramos, A. C., Folli-Pereira, M. S., Portela, N. A., dos Santos, J. B., da Conceicao, J. M., et al. (2016). “Heavy metal stress and molecular approaches in plants,” in Plant metal interaction: emerging remediation techniques. Ed. Ahmad, P. (Waltham, MA: Elsevier), 531–544.
Galic, M., Percin, A., Zgorelec, Z., Kisic, I. (2019). Evaluation of heavy metal accumulation potential of hemp (Cannabis sativa l.). J. Cent. Eur. Agric. 20 (2), 700–711. doi: 10.5513/JCEA01/20.2.2201
Gauvin, D. V., Zimmermann, Z. J., Yoder, J., Tapp, R. (2018). Marijuana toxicity: heavy metal exposure through state-sponsored access to “la fee verte”. Pharmaceut. Reg. Affairs 7 (1), 1–10. doi: 10.4172/2167-7689.1000202
Gillet, S., Decottignies, P., Chardonnet, S., Le Marechal, P. (2006). Cadmium response and redoxin targets in Chlamydomonas reinhardtii: a proteomic approach. Photosynth Res. 89, 201–211. doi: 10.1007/s11120-006-9108-2
Guo, R., Guo, H., Zhang, Q., Guo, M., Xu, Y., Zeng, M., et al. (2018). Evaluation of reference genes for RT-qPCR analysis in wild and cultivated cannabis. Biosci. Biotechnol. Biochem. 82, 1902–1910. doi: 10.1080/09168451.2018.1506253
Guo, Z., Lv, J., Zhang, H., Hu, C., Qin, Y., Dong, H., et al. (2022). Red and blue light function antagonistically to regulate cadmium tolerance by modulating the photosynthesis, antioxidant defense system, and cd uptake in cucumber (Cucumis sativus l.). J. Hazardous Materials 429, 128412. doi: 10.1016/j.jhazmat.2022.128412
Huang, Y., Li, D., Zhao, L., Chen, A., Li, J., Tang, H., et al. (2019). Comparative transcriptome combined with physiological analyses revealed key factors for differential cadmium tolerance in two contrasting hemp (Cannabis sativa l.) cultivars. Ind. Crops Products 140, 111638. doi: 10.1016/j.indcrop.2019.111638
Husain, R., Weeden, H., Bogush, D., Deguchi, M., Soliman, M., Potlakayala, S., et al. (2019). Enhanced tolerance of industrial hemp (Cannabis sativa l.) plants on abandoned mine land soil leads to overexpression of cannabinoids. PLoS One 14 (8), e0221570. doi: 10.1371/journal.pone.0221570
Ismael, M. A., Elyamine, A. M., Moussa, M. G., Cai, M., Zhaoab, X., Hu, C. (2019). Cadmium in plants: uptake, toxicity, and its interactions with selenium fertilizers. Metallomics 11, 255–277. doi: 10.1039/C8MT00247A
Kim, Y.-Y., Choi, H., Segami, S., Cho, H.-T., Martinoia, E., Maeshima, M., et al. (2009). AtHMA1 contributes to the detoxification of excess Zn(II) in arabidopsis. Plant J. 58, 737–753. doi: 10.1111/j.1365-313X.2009.03818.x
Küpper, H., Šetlik, I., Spiller, M., Küpper, F., Prášil, O. (2002). Heavy metal-induced inhibition of photosynthesis: targets of in vivo heavy metal chlorophyll formation. J. Phycology 38, 429–441. doi: 10.1046/j.1529-8817.2002.t01-1-01148.x
Linger, P., Müssig, J., Fischer, H., Kobert, J. (2002). Industrial hemp (Cannabis sativa l.) growing on heavy metal contaminated soil: fiber quality and phytoremediation potential. Ind. Crops Products 16, 33–42. doi: 10.1016/S0926-6690(02)00005-5
Linger, P., Ostwald, A., Haensler, J. (2005). Cannabis sativa l. growing on heavy metal contaminated soil: growth, cadmium uptake and photosynthesis. Biol. Plantarum 49 (4), 567–576. doi: 10.1007/s10535-005-0051-4
Lux, A., Martinka, M., Vaculík, M., White, &, P., J. (2011). Root responses to cadmium in the rhizosphere: a review. J. Exp. Bot. 62 (1), 21–37. doi: 10.1093/jxb/erq281
Luyckx, M., Hausman, J. F., Blanquet, M., Guerriero, G., Lutts, S. (2021). Silicon reduces cadmium absorption and increases root-to-shoot translocation without impacting growth in young plants of hemp (Cannabis sativa l.) on a short-term basis. Environ. Sci. pollut. Res. 28, 37963–37977. doi: 10.1007/s11356-021-12912-y
Mallick, N., Mohn, F. H. (2003). Use of chlorophyll fluorescence in metal-stress research: a case study with the green microalga Scenedesmus. Ecotoxicology Environ. Saf. 55, 64–69. doi: 10.1016/s0147-6513(02)00122-7
Maxwell, K., Johnson, G. N. (2000). Chlorophyll fluourescence - a practical guide. J. Exp. Bot. 51, 659–668. doi: 10.1093/jexbot/51.345.659
Mayorga-Gómez, A., Nambeesan, S. U. (2020). Temporal expression patterns of fruit-specific α-EXPANSINS during cell expansion in bell pepper (Capsicum annuum l.). BMC Plant Biol. 20, 241. doi: 10.1186/s12870-020-02452-x
Migocka, M., Papierniak, A., Maciaszczyk-Dzibuinska, E., Posyniak, E., & Kosieradzka, A. (2015). Molecular and biochemical properties of two P1B2-ATPases, CsHMA3 and CsHMA4, from cucumber. Plant Cell Environ. 38, 1127–1141. doi: 10.1111/pce.12447
Miyadate, H., Adachi, S., Hiraizumi, A., Tezuka, K., Nakazawa, N., Kawamoto, T., et al. (2011). OsHMA3, a P1B-type of ATPase affects root-to-shoot cadmium translocation in rice by mediating efflux into vacuoles. New Phytol. 189, 190–199. doi: 10.1111/j.1469-8137.2010.03459.x
Moher, M., Llewellyn, D., Jones, M., Zheng, Y. (2022). Light intensity can be used to modify the growth and morphological characteristics of cannabis during the vegetative stage of indoor production. Ind. Crops Products 183, 114909. doi: 10.1016/j.indcrop.2022.114909
Morel, M., Crouzet, J., Gravot, A., Auroy, P., Leonhardt, N., Vavasseur, A., et al. (2009). AtHMA3, a P1B-ATPase allowing Cd/Zn/Co/Pb vacuolar storage in arabidopsis. Plant Physiol. 149, 894–904. doi: 10.1104/pp.108.130294
National Academies of Sciences, Engineering, and Medicine (2017). The health effects of cannabis and cannabinoids: the current state of evidence and recommendations for research (Washington, DC: The National Academies Press). doi: 10.17226/24625
Nesler, A., Furini, A. (2012). “Phytoremediation: the utilization of plants to reclaim polluted sites,” in Plants and heavy metals. Ed. Furini, A. (Dordrecht, Germany: Springer), 75–86.
Parmar, P., Kumari, N., Sharma, V. (2013). Structural and functional alterations in photosynthetic apparatus of plants under cadmium stress. Botanical Stud. 54 (45), 1–6. doi: 10.1186/1999-3110-54-45
Potter, D. J., Duncombe, P. (2011). The effect of electrical lighting power and irradiance on indoor-grown cannabis potency and yield. J. Forensic Sci. 57, 618–622. doi: 10.1111/j.1556-4029.2011.02024.x
Rodriguez-Morrison, V., Llewellyn, D., Zheng, Y. (2021). Cannabis yield, potency, and leaf photosynthesis respond differently to increasing light levels in an indoor environment. Front. Plant Sci. 12. doi: 10.3389/fpls.2021.646020
Sebastian, A., Nangia, A., Prasad, M. N. V., Rattanapolsan, L., Nakbanpote, W. (2019). “Cadmium toxicity and tolerance in micro- and phytobiomes,” in Cadmium toxicity and tolerance in plants. Eds. Hasanuzzaman, M., Prasad, M. N. V., Fujita, M. (Cambridge, MA: Elsevier), 19–46.
Singh, H., Parihar, P., Singh, R., Singh, VP., Prasad, SM. (2016). Heavy metal tolerance in plants: Role of transcriptomics, proteomics, metabolomics, and ionomics. Front. Plant Sci. 6:1143. doi: 10.3389/fpls.2015.01143\
Shah, K., Nahakpam, S., Chaturvedi, V., Singh, P. (2019). “Cadmium-induced anatomical abnormalities in plants,” in Cadmium toxicity and tolerance in plants. Eds. Hasanuzzaman, M., Prasad, M. N. V., Fujita, M. (Cambridge, MA: Elsevier), 111–139.
Shi, G., Cai, Q. (2009). Cadmium tolerance and accumulation in eight potential energy crops. Biotechnol. Adv. 27, 555–561. doi: 10.1016/j.biotechadv.2009.04.006
Shi, G., Cai, Q. (2010). Zinc tolerance and accumulation in eight oil crops. J. Plant Nutr. 33 (7), 982–997. doi: 10.1080/01904161003728669
Shi, G., Liu, C., Cui, M., Ma, Y., Cai, Q. (2012). Cadmium tolerance and bioaccumulation of 18 hemp accessions. Appl. Biochem. Biotechnol. 168, 163–173. doi: 10.1007/s12010-011-9382-0
Stack, G., Toth, J., Carlson, C., Genter, D., Zingg, T., DeSario, A., et al. (2019) 2019 CBD cultivar trial. Available at: https://hemp.cals.cornell.edu/files/2020/08/2019CBDTrialHandout_GMS.pdf (Accessed 14 Dec 2022).
Storm, C., Zumwalt, M., Macherone, A. (2020) Dedicated cannabinoid potency testing in cannabis or hemp products using the Agilent 1220 infinity II lc system. Agilent Technol Appl Note. 5991-9285. https://www.agilent.com/cs/library/applications/application-dedicatedcannabinoid-potency-testing-5991-9285-en-us-agilent.pdf [accessed 10 Sep2022].
Taiz, L., Zeiger, E., Moller, I. M., Murphy, A. (2015). Plant physiology and development. 6th edition (Sunderland, MA: Sinauer Associates).
Takahashi, R., Bashir, K., Ishimaru, Y., Nishizawa, N. K., Nakanishi, H. (2012). The role of heavy-metal ATPases, HMAs, in zinc and cadmium transport in rice. Plant Signaling Behav. 7, 1605–1607. doi: 10.4161/psb.22454
The Maryland Medical Cannabis Commission (2020). The Maryland medical cannabis commission’s technical authority for medical cannabis testing. 11–12. Available at https://mmcc.maryland.gov/Documents/2019_2020%20Laboratory%20Testing%20Page%20Updates/MMCC_TechnicalAuthority-Final-12-15-20.pdf
Trancoso, I., de Souza, G. A. R., dos Santos, P. R., dos Santos, K. D., de Miranda, R. M., dos, S. N., et al. (2022). Cannabis sativa l.: crop management and abiotic factors that affect phytocannabinoid production. Agronomy 12 (7), 1492. doi: 10.3390/agronomy12071492
US Department of Agriculture (2019). Establishment of a domestic hemp production program Vol. 84 (Washington, DC: Federal Register), 58522–58564.
USEPA Method 3052 (1995). “Microwave assisted acid digestion of siliceous and organically based matrices,” in Test methods for evaluating solid waste, 3rd edition (Washington, DC, USA: US Environmental Protection Agency).
Wang, X., Zhi, J., Liu, X., Zhang, H., Liu, H., Xu, J. (2018). Transgenic tobacco plants expressing a P1B-ATPase gene from populus tomentosa carr. (PtoHMA5) demonstrate improved cadmium transport. Int. J. Biol. Macromol 113, 655–661. doi: 10.1016/j.ijbiomac.2018.02.081
Washington State Liquor and Cannabis Board (2021). Permanent rule WSR 22-06-097. 12. Available at https://apps.leg.wa.gov/documents/Laws/WSRPDF/2022/06/22-06-097.pdf
Wong, C. K. E., Cobbett, C. S. (2009). HMA p-type ATPases are the major mechanism for root-to-Shoot cd translocation in. Arabidopsis thaliana. New Phytol. 181, 71–78. doi: 10.1111/j.1469-8137.2008.02638.x
Yang, R., Berthold, E. C., McCurdy, C. R., Benevenute, S. D. S., Brym, Z. T., Freeman, J. (2020). Development of cannabinoids in flowers of industrial hemp (Cannabis sativa l.): a pilot study. J. Agric. Food Chem. 68, 6058–6064. doi: 10.1021/acs.jafc.0c01211
Yin, M., Pan, G., Tao, J., Doblin, M. S., Zeng, W., Pan, L., et al. (2022). Identification of MYB genes reveals their potential functions in cadmium stress response and the regulation of cannabinoid biosynthesis in hemp. Ind. Crops Products 180 (114607), 1–15. doi: 10.1016/j.indcrop.2022.114607
Keywords: accumulation, cadmium, cannabinoids, Cannabis sativa, transporter genes, heavy metals
Citation: Marabesi AO, Nambeesan SU, van Iersel MW, Lessl JT and Coolong TW (2023) Cadmium exposure is associated with increased transcript abundance of multiple heavy metal associated transporter genes in roots of hemp (Cannabis sativa L.). Front. Plant Sci. 14:1183249. doi: 10.3389/fpls.2023.1183249
Received: 09 March 2023; Accepted: 02 May 2023;
Published: 30 May 2023.
Edited by:
Magdalena Arasimowicz-Jelonek, Adam Mickiewicz University, PolandReviewed by:
Khurram Bashir, Lahore University of Management Sciences, PakistanJie Zhang, Foshan University, China
Angela Cicatelli, University of Salerno, Italy
Copyright © 2023 Marabesi, Nambeesan, van Iersel, Lessl and Coolong. This is an open-access article distributed under the terms of the Creative Commons Attribution License (CC BY). The use, distribution or reproduction in other forums is permitted, provided the original author(s) and the copyright owner(s) are credited and that the original publication in this journal is cited, in accordance with accepted academic practice. No use, distribution or reproduction is permitted which does not comply with these terms.
*Correspondence: Amanda O. Marabesi, aom@uga.edu; Timothy W. Coolong, tcoolong@uga.edu