 Lara Gibellini1*†
 Sara De Biasi1†
 Camillo Porta2
 Domenico Lo Tartaro1Roberta Depenni3Giovanni Pellacani4
 Roberto Sabbatini3
 Andrea Cossarizza1,5
- 1Department of Medical and Surgical Sciences for Children and Adults, University of Modena and Reggio Emilia, Modena, Italy
- 2Department of Internal Medicine and Therapeutics, Division of Translational Oncology, IRCCS Istituti Clinici Scientifici Maugeri, University of Pavia, Pavia, Italy
- 3Department of Oncology, Hematology, University of Modena and Reggio Emilia, Modena, Italy
- 4Department of Surgery, Medicine, Dentistry and Morphological Sciences, University of Modena and Reggio Emilia, Modena, Italy
- 5Section of Modena, Istituto Nazionale per le Ricerche Cardiovascolari, Bologna, Italy
Novel treatments based upon the use of immune checkpoint inhibitors have an impressive efficacy in different types of cancer. Unfortunately, most patients do not derive benefit or lasting responses, and the reasons for the lack of therapeutic success are not known. Over the past two decades, a pressing need to deeply profile either the tumor microenvironment or cells responsible for the immune response has led investigators to integrate data obtained from traditional approaches with those obtained with new, more sophisticated, single-cell technologies, including high parameter flow cytometry, single-cell sequencing and high resolution imaging. The introduction and use of these technologies had, and still have a prominent impact in the field of cancer immunotherapy, allowing delving deeper into the molecular and cellular crosstalk between cancer and immune system, and fostering the identification of predictive biomarkers of response. In this review, besides the molecular and cellular cancer-immune system interactions, we are discussing how cutting-edge single-cell approaches are helping to point out the heterogeneity of immune cells in the tumor microenvironment and in blood.
Introduction
Immune checkpoints are critical regulators of the immune system which modulate the duration and amplitude of immune responses to maintain self-tolerance and prevent autoimmunity. Among immune checkpoints, cytotoxic T lymphocyte antigen-4 (CTLA-4, or CD152), programmed death-1 (PD-1, or CD279) and programmed death ligand-1 (PD-L1, or CD274) have been intensively studied and antibodies against these molecules have been developed to successfully reinvigorate T cell functions and provide a durable immune response. Antibodies against immune checkpoints have demonstrated impressive efficacy, and now constitute the backbone of systemic therapy in different malignancies (1).
Despite considerable advancements in clinical care, epidemiologic data and ongoing clinical trials suggest that most patients receiving immune checkpoint inhibitors (ICI) do not derive benefit or stable and lasting responses. The mechanisms at the basis of this lack of responsiveness are multiple, and still not completely known. Over the past years, accumulating evidence suggested that the elevated neoantigen load (i.e., the number of antigens actually targeted by T cells) may have a robust relationship with the response to ICI (2). In particular, the more is the neoantigen load, the better is the response to therapy. However, the intensity and efficacy of the immune response can vary upon neoantigens' clonality. It seems that neoantigens derived from clonal mutations, which appear early during tumorigenesis, may elicit more effective tumor responses than neoantigens derived from subclonal mutations, which are acquired later in tumorigenesis (3). This means that intratumoral heterogeneity may impact the response to ICI. Moreover, several biophysical matters occur in the binding and recognition between peptide-MHC complex and T cell receptor (TCR) (4), and current prediction algorithms are still unable to precisely define TCR binding capacity for specific neoantigens (2). An additional layer of complexity originates from the fact that T cells, which are the main mediator of anti-tumor immunity, are extremely heterogenous in the tumor microenvironment (TME), and that beyond T cells many other types of immune cells are present in the tumor tissue that could affect response to ICI (4). Furthermore, an anticancer immune response may be impaired also by a number of other factors, mainly immune cells polarized toward an immune suppressive phenotype (5).
Taken together, these observations suggest that most, if not all, of these components are involved in the clinical response to ICI, and that the identification of the mechanism(s) at the basis of such response is crucial, both to provide important insights into the molecular and cellular crosstalk between cancer and immune system, and possibly foster the identification of predictive biomarkers of response (6). In this scenario, recently several novel single-cell technologies have been used to draw an in-depth characterization of tumor and immune system ecosystems in different malignancies. Here, we first describe the interactions between tumor and immune cells and then give an overview of the cutting-edge single-cell approaches mainly used to interrogate cancer immunity both in the tumor microenvironment and in the blood. We also cover and discuss how single-cell analysis have revealed the vast heterogeneity characterizing intra-tumoral immune cells, mainly T cells, and how this knowledge is critical to understand the role of different cell states and phenotypes in the response to immune checkpoint inhibitors.
Immune System and Cancer
Cancer Immunosurveillance and Immunoediting
The long-standing theory of immune surveillance suggests that cells and tissues are regularly monitored by the immune system, which is responsible for recognizing and eliminating the vast majority of nascent cancer cells. The interactions between cancer and the immune system are regulated by a complex network of biological pathways, and start during the early steps of carcinogenesis, when normal cells acquire biological capabilities which allow them to evolve progressively to a neoplastic state. Such capabilities are commonly known as hallmarks of cancer, and among them the ability to evade immune system is crucial to guarantee cancer cell survival and tumor progression (7).
Over the past years, accumulating evidences, both from murine models and clinical epidemiology, have validated the concept of cancer immunosurveillance, demonstrating that the immune response acts as a barrier to tumor development and progression, and is a critical determinant of susceptibility to tumors (8–13). This action is exerted through at least three distinct mechanisms: (i) protection of the host from viral infections, and thus suppression of tumors of viral etiology; (ii) prevention or resolution of inflammation, which facilitates tumorigenesis; (iii) identification and elimination of cancer cells, in certain tissues and on the basis of the expression of tumor-specific antigens (14). In particular, deficiencies in the number or functionality of CD8+ cytotoxic T lymphocytes (CTLs), CD4+ type-1 T helper (Th1) cells, natural killer (NK) cells, natural killer T (NKT) cells, B cells, or γδ T cells lead to increased susceptibility to carcinogen-induced tumors and spontaneous tumors development (9, 11, 15, 16). Similarly, unsensitivity to interferons (IFNs) or lack of perforin, interleukin (IL)-12, tumor necrosis factor (TNF)-α or IL-1β are associated with increased tumor susceptibility (10, 11, 17–20).
Reinforcing this notion, clinical epidemiology supports the existence of antitumoral immune response in some types of cancer. Firstly, evidence for immunosurveillance can be found in patients with acquired immunodeficiencies, like that caused by the human immunodeficiency virus (HIV), the cause of AIDS, who have an increased frequency of virus-associated malignancies, including Kaposi's sarcoma, lymphomas, urogenital cancers, and cervical cancers due to different strains of papillomavirus (21). Secondly, higher cancer prevalence has been observed in transplanted recipients treated with immunosuppressive drugs. Immunosuppression to prevent transplant rejection is associated with a 3- to 100-fold increased risk of developing certain types of cancer, mainly lymphomas (22). However, solid tumors with no viral etiology also occur with increased frequency. For example, patients receiving renal transplant have a 3-fold increase in the incidence of cancers respect to the general population, and a 200-fold increase of skin cancers (23). Patients with liver transplant also display a greater incidence of malignancies, including head and neck cancers, and skin cancers (24, 25).
Along with clinical epidemiology, other evidences support the theory of cancer immunosurveillance, including the identification of tumor antigens and of antibodies against those antigens. In cancer patients, humoral immune response has been detected against more than a hundred tumor-associated antigens, thus indicating that the immune system is well able to fight against cancer (26). However, whether or not the identification and quantification of these antibodies has a clear diagnostic and/or prognostic relevance is still unclear. Other spontaneous immune responses against cancer cells have been described in paraneoplastic autoimmune syndromes, caused by the activation of an immune response against self-antigens expressed on cancer cells. Paraneoplastic autoimmune syndromes are often caused by cross-reactivity between the anti-tumor immune response and antigens present in the nervous system, and the onset of neurologic symptoms typically precedes the diagnosis of a formerly undetected tumor (27).
Advancements made all over the past two decades have demonstrated that the immune system not only defends the host against tumor development, but also edits tumor immunogenicity, in a process referred to as cancer immunoediting. In its most complicated form, cancer immunoediting proceeds through three phases, termed elimination, equilibrium and escape. During the elimination phase, both innate and adaptive immune system collaborate to recognize and kill neoplastic cells. Cancer clones which survive the elimination phase can then progress through the equilibrium phase, in which tumor growth is limited, but cellular immunogenicity is edited by the adaptive immune system, mainly lymphocytes. During this phase, the pressure of the immune system together with the genetic instability of tumor cells can lead to the selection of neoplastic subclones with low immunogenicity, which can enter into the escape phase and evade the immune recognition. A large number of mechanisms operate to enable tumor immune escape by interfering with almost every step required to generate an effective immune response, i.e., the: (i) tumor capacity to downregulate antigens and/or MHC I; (ii) tumor expression and/or secretion of immunosuppressive molecules and/or antiphagocytosis signals; (iii) tumor modulation of lymphocytes' metabolism; (iv) recruitment of immune cells that actively mediate tolerance, or even promote tumor growth (28).
Since Virchow noted the presence of lymphocyte infiltration in solid tumors in 1863 (29), additional support for cancer immunosurveillance and immunoediting is evident in uncountable reports that describe the presence of immune cells infiltrating the tumors, and that correlate their frequency with patient prognosis. The presence of T cells inside tumors was observed, in late 1990's, in patients with melanoma, and then described for several other malignancies, including ovarian, colorectal (CRC) or lung cancer (30–36). From then on, a great attention has been paid to investigate the role of tumor-infiltrating lymphocytes (TILs). This effort resulted in the identification of TILs frequency as a bona fide indicator of improved prognosis and increased overall survival for several types of tumors.
Recent advancements in the characterization of the immune context within the tumor microenvironment have revealed that different classes of the so-called tumor immune environment (TIME) exist that are associated to tumor initiation and could affect the response to therapies (37). The TIME varies greatly across individuals and over distinct cancers. However, despite variability, two main classes can be described, which differ on the basis of composition, functional status and spatial distribution of immune cells. Infiltrated-excluded TIMEs are populated by immune cells mainly along the tumor margins, and are relatively poor of CTLs in the tumor core (37). Moreover, CTLs from this kind of TIME typically display low expression of activation or cytotoxicity markers, including granzyme(GZM)-B and IFN-γ (37). Conversely, infiltrated-inflamed TIMEs are characterized by large immune infiltration among neoplastic cells, with a high frequency of CTLs expressing GZM-B, IFN-γ, and PD-1. In some cases, infiltrated-inflamed TIMEs contain compartments which resemble tertiary lymphoid structures (TLSs), and act as sites of lymphoid recruitment and immune activation (38). Such compartments are generally located at the invasive tumor margin and in the stroma, and include naïve and activated T cells, regulatory T (Treg) cells, B cells and dendritic cells (DCs) (37). Over the past years, the immune network of the TME has become a focus of cancer research and therapeutics development, and the need to understand its great complexity and diversity in this context is now compelling.
Immune Checkpoints and Their Inhibitors
Immune checkpoints are molecules expressed on T cell plasma membrane able to inhibit or activate the development or execution of effector functions exerted by cytotoxic or pro-inflammatory T cells. Among immune checkpoints, CTLA-4 and PD-1 have been most actively studied in the field of clinical cancer immunotherapy.
CTLA-4 and CD28 are homologous molecules expressed by CD4+ and CD8+ T cells, which mediate antagonistic functions in T cell activation, and share two ligands, namely B7-1 (CD80) and B7-2 (CD86), expressed on antigen-presenting cells (APCs). CD28 interacts with the CD80 dimer with relatively high affinity and the CD86 monomer with lower affinity, to mediate T cell activation in conjunction with TCR signals. Conversely, CTLA-4 interacts with both ligands with higher affinity and avidity than CD28, to inhibit T cell activation. CTLA-4 is constitutively expressed on Treg cells or induced following T-cell activation via CD28 and TCR signaling (39). The humanized anti-CTLA-4 antibody ipilimumab was approved by the United States Food and Drug Administration (FDA) in 2011. It blocks the interaction between CTLA-4 and its ligands expressed by APCs, thereby preventing the transmission of inhibitory signals to CTLA-4-expressing T cells. Although the blocking of inhibitory signals is the main mechanistic contributor to ipilimumab functions, other still poorly known mechanisms are involved. For example, the effects of anti-CTLA-4 on Treg is still matter of debate. Indeed, the binding of CTLA-4 by ipilimumab on Treg within the tumor tissue would likely promote Treg depletion by antibody-dependent cellular cytotoxicity (ADCC) and phagocytosis by NK cells and macrophages (40, 41). Recently it was found that both ipilimumab and tremelimumab, another anti-CTLA-4 drug, increase infiltration of intratumoral CD4+ and CD8+ T cells without significantly changing or depleting FOXP3+ cells within the TME (42). Nonetheless, regardless the mechanism of action, ipilimumab demonstrated impressive anti-tumor activity in several clinical settings in metastatic melanoma (43, 44).
Along with CTLA-4, the PD-1/PD-L1 system constitutes another immune checkpoint pathway mainly operating by controlling immune homeostasis. However, while transient expression of PD-1 is a feature of normal T lymphocyte activation, persistent antigen exposure leads to a sustained expression of PD-1 with a gradual loss of effector functions which are characteristic of exhausted T cell (45). PD-1 mediates an inhibitory signal in T cells after binding to its ligands, PD-L1 and PD-L2, which are expressed on APCs and cancer cells (46). The blockade of PD-1/PD-L1 pathway with anti-PD-1 or anti-PD-L1 antibodies, can successfully reinvigorate T cell functions and provide a durable response in different malignancies. There are currently six inhibitors of the PD-1/PD-L1 pathway, namely nivolumab, pembrolizumab, cemiplimab (directed against PD-1), and atezolizumab, avelumab and durvalumab (directed against PD-L1), which have been approved by the FDA for the treatment of tumors like melanoma, lung cancer, renal-cell carcinoma (RCC), microsatellite instability-high CRC, classical Hodgkin lymphoma, head and neck squamous cell cancer (HNSCC), hepatocellular carcinoma (HCC), bladder cancer, gastro-oesophageal cancer, and unresectable or metastatic, microsatellite instability-high or mismatch repair deficient solid tumors (47).
The best examples of stable response are those observed in patients with advanced melanoma. In these patients, it was reported that 3-year overall survival was 34 and 52% for ipilimumab and nivolumab, respectively (48). The 3-year overall survival was 60, 55, 41% for nivolumab plus ipilimumab, nivolumab alone, or ipilimumab alone (49). In advanced RCC, the 2-year overall survival of patients treated with nivolumab plus ipilimumab was 28%, and complete responses were 11% (50–52). In other cancers, responses to immune checkpoint monotherapies were not as impressive as in melanoma. This means that despite considerable advancements in clinical care of some tumors, epidemiologic data and ongoing clinical trials suggest that most of the patients receiving ICI do not derive benefit or durable responses, and the mechanisms at the basis of this lack of responsiveness are multiple and still not completely known.
Single-Cell Approaches to Immune Profile
Over the past two decades, a pressing need to deeply profile the TIME has led investigators to complement data obtained from traditional approaches, like immunohistochemistry, basic flow cytometry or measurements on bulk populations of cells, with data obtained with novel, more sophisticated, single-cell technologies. To date, a vast array of single-cell approaches, including high-parameter flow cytometry, deep sequencing, and high-resolution imaging are available to unmask cellular heterogeneity and to try to identify actionable hallmarks of efficient anticancer immunotherapy. In Table 1 a general overview of single-cell technologies is provided together with their advantages and disadvantages.
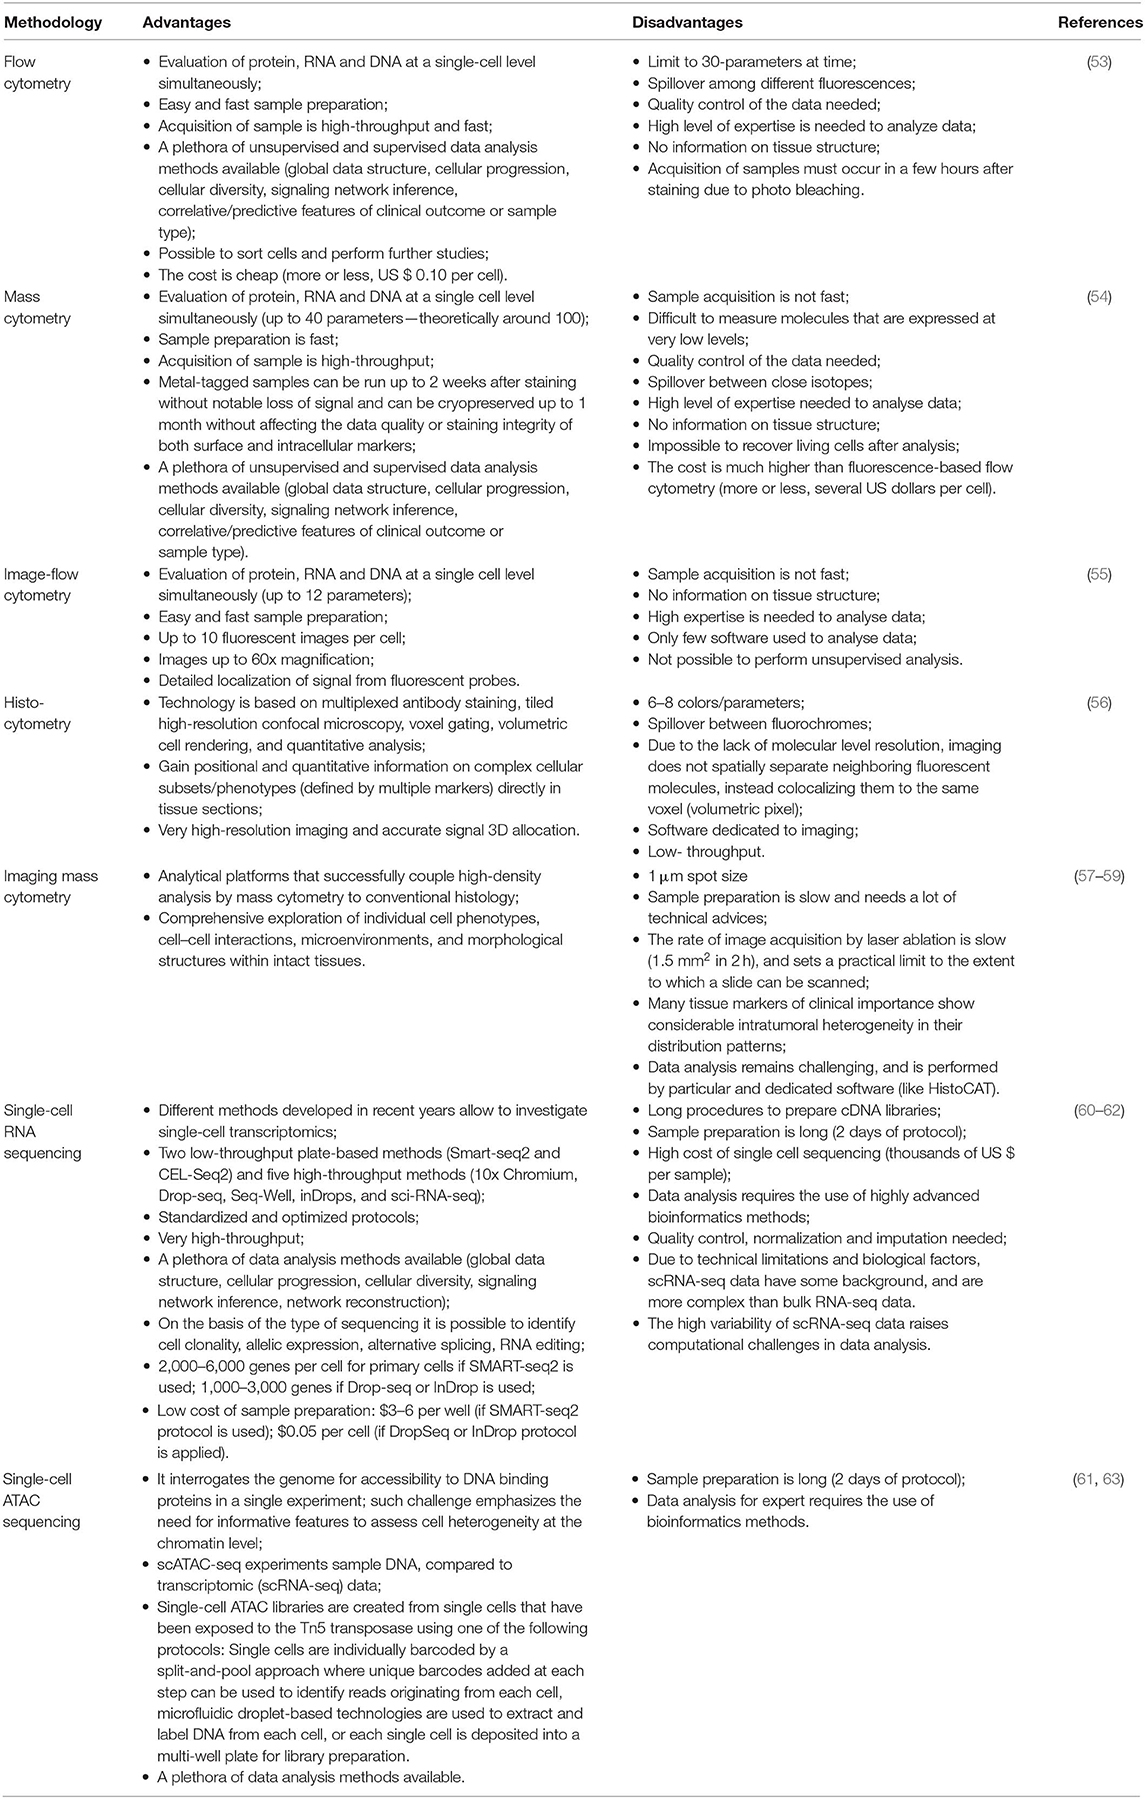
Table 1. Advantages and disadvantages of the cutting-edge single-cell technologies to profile cancer immunity.
High-Parameter Flow Cytometry
Last advances in proteomics and genomics are paving the way to comprehend the complexity and the heterogeneity of billions of specialized immune cells in cancer patients. For decades, immunologists relied mainly on flow cytometry, the first single-cell technique that now allows to study the expression and density of up to 30–40 antigens in a single-cell level. Flow cytometry is very popular technique used to measure physical and chemical characteristics of a population of cells/particles suspended in a fluid, and is routinely used both in basic research, and in clinical practice to perform cell count, determine cell phenotypes and functions allowing the monitoring of immune features in pathophysiological settings (64, 65). Flow cytometry is unmatched for its high throughput as several million cells can be analyzed in a few minutes. In addition, cells can be sorted achieving pure cell populations to perform further functional, metabolic and molecular analyses (66). Sample preparation for flow cytometry is relatively fast, but setting up a flow cytometry panel that includes 28–30 parameters takes a lot of time because of the need to optimize spectral overlap between fluorophores, and to choose best antibodies. These issues can be overcome by following precise rules applicable to panel design, and optimized panels published such as Optimized Multicolor Immunophenotyping Panels (OMIPs) (67–72). Together with fluorescent flow cytometry, mass cytometry (also called CyTOF—Cytometry by Time-Of-Flight) is a technology that allows simultaneous analysis of more than 40 different molecules, including cytokines and transcription factors, with minimal compensation (53, 54). This technique exploits the use of monoclonal antibodies conjugated with heavy-metal isotopes to stain cells and quadrupole time-of-flight mass spectrometer to perform the detection (73). Mass spectrometry is able to discriminate isotopes of different atomic weights with high accuracy, enabling more features to be assayed at the same time, so the quantity of reporter ions in a particular mass channel represents the marker expression with little signal overlap between parameters.
Among high-parameter single-cell technologies, at present flow cytometry is the gold standard. However, it reveals the different percentages of cell populations in different pathophysiological onsets barely identifying different clones (74). Flow cytometry perfectly captures the phenotype of cells, but fails to snap their biological complexity. The spectrum of phenotypic diversity of immune cells within the TME and in blood can better be appreciated by analyses at the single-cell level to explore cellular heterogeneity, in terms of gene expression and chromatin accessibility, that often confounds biomolecular variation from multi-omics approaches in bulk. Recently, the adaptation of high-parameter flow cytometry to imaging platforms took to the development of two promising technologies, known as Imaging Mass Cytometry (IMC), Co-detection by Indexing (CODEX) and multiepitope-ligand-cartography (MELC) (55–57, 75, 76). The former is used to process tissues, employs antibodies tagged with lanthanides and combines a high resolution laser ablation system with CyTOF (77). IMC enables the study of cell-cell interactions and of intercellular networks, thus providing information regarding the spatial distribution of cells within a tissue (57–59). CODEX employs oligonucleotide-conjugated antibodies. Although these technologies have not yet been applied to dissect immune responses in the field of cancer immunotherapy, the power will be used to investigate the role of immune cells in the TME.
Single-Cell RNA Sequencing
Single-cell RNA sequencing (scRNA-seq) technology provide a transformative view of cell-type-specific gene expression and allows to analyze hundreds of messenger RNAs (mRNAs) in a single experiment, enabling the reconstruction of a high-resolution map of cells according to their molecular signature (66). The first example of single-cell digital gene expression profiling was published in 2009, and since then on, a continuous effort has been made to improve experimental protocols and bioinformatics pipelines, which are essential to process data (60, 78, 79). A canonical scRNA-seq protocol involves several steps, including single cell isolation, cell lysis to obtain RNA, reverse transcription into the first-strand cDNA, second-strand synthesis, cDNA amplification, and sequencing (60–62).
Although single cells can be isolated by different techniques, the use of microdroplet-based microfluidics is now widely diffused among the majority of commercial platforms and allows the isolation of individual cells into aqueous droplets in a continuous oil phase. In every droplet, cells are lysed in a hypotonic buffer, and mRNAs are captured by poly-dT primers. When reverse transcription takes place, cDNA molecules originated from a given individual cells are identified by using short DNA barcode tags. Then, second strands are generated, and the small amount of synthesized double-strand cDNA is amplified by means of conventional polymerase chain reaction (PCR) or in vitro transcription, depending on the technology. Some protocols improved read coverage across transcripts, which significantly enhances detailed analyses of alternative transcript isoforms and identification of single nucleotide polymorphisms (SNPs) with high sensitivity and accuracy (80). Eventually, sequencing is performed, and once reads are obtained, data are pre-processed and analyzed through clustering of cells, classification and cell trajectory assignment (78, 79). Concerning T cells, during the last years, several algorithms have also been developed to utilize scRNA-seq data to reconstitute TCR information. TCR is a heterodimer composed of two chains, α and β, which result from genetic recombination of the V(D)J genes, and is responsible for the specificity of each T cell against cognate antigens. The diversity of TCRαβ repertoire is associated with efficient protection against several pathogens (81), and more recently, the clonality of both peripheral blood and tumor TCRαβ repertoire has also been associated with improved clinical outcome under anti-PD-1 or anti-CTLA-4 immunotherapy (82–84).
Despite its numerous pros and great potential, scRNA-seq suffers from the caveat that mRNA and protein expression do not always directly correlate. For this reason, recent technological advances have been made to capture new cell types with a better resolution, and to detect simultaneously mRNAs and proteins. For example, Cellular Indexing of Transcriptomes and Epitopes by Sequencing (CITE-seq), RNA Expression and Protein Sequencing (REAP-seq), Antibody sequencing (Ab-seq) enable the measurement of proteins and mRNAs in individual cells, by using antibodies labeled with DNA barcodes instead of fluorochromes, thus avoiding the limitations dictated by the possible spectral overlap of fluorescent signals (85–87). Quantifying proteins together with mRNAs allows to overcome the lack of correlation that sometimes exists between mRNA and protein levels, thus providing a more readout of cellular phenotype, at the single-cell level. Indeed, proteins, not mRNAs, are the real targets of drugs, and mRNA abundance cannot necessarily resemble protein abundance (85). Moreover, in certain settings, the measurement of protein abundance is more sensitive for markers with low levels of mRNA transcripts (85). Thus, CITE-seq, REAP-seq, and Abseq give an unbiased view of the mRNA and protein profile at the single-cell level, which is necessary to precisely identify cellular function, and provide important insights into the pathophysiology of multiple disorders. However, sample preparation requires more than 2 days and cells need to be fixed or lysed, therefore excluding the possibility to perform further analysis (85–87).
Another possibility to investigate both mRNA and proteins is the combination of scRNA-seq and high-parameter flow cytometry. The combinatorial use of scRNA-seq and high-parameter flow cytometry in the same sample would likely have a huge impact in the field of immunotherapy, as is associated with unique advantages to each method together with the advantage of using both methodologies. Whereas each technology uses unsupervised clustering to identify different populations, scRNA-seq is totally unbiased as it analyses the expression of thousands of genes. Conversely, high-parameter flow-cytometry looks at 30–40 markers that are pre-selected based on a priori knowledge. Also, scRNA-seq allows transcriptomic analysis between individual cell subsets, including the use of Gene Set Enrichment Analysis (GSEA) and comparisons to human datasets. However, as already described, mRNA and protein do not always correlate, meaning that the information on protein expression delivered by high-parameter flow-cytometry is also central. However, to date, a few studies reported the combination of scRNA-seq and CyTOF to profile the tumor immune microenvironment (88, 89).
Single-Cell ATAC-Seq
The Assay for Transposase-Accessible Chromatin using sequencing (ATAC-seq) is a method for assessing genome-wide chromatin accessibility. ATAC-seq identifies accessible DNA regions by probing accessible chromatin with hyperactive mutant Tn5 transposase that inserts sequencing adapters into open regions of the genome (90). Single cell ATAC-seq (scATAC-seq) measures chromatin accessibility enabling marker-free identification of cell type-specific cis- and trans-regulatory elements and mapping of disease-associated enhancer activity and reconstruction of trajectories of cellular differentiation, and has been used to map gene regulation in cell-to-cell variability and rare cell phenotypes, including in healthy and malignant immune cells (61, 63).
The Analysis of Single-Cell Data
Single-cell technologies generate huge amount of information that allow the exploration of cellular diversity at unprecedented depth and throughput. For this reason, one of the major analytical challenge is how to visualize and understand this high-dimensional datasets originating from high dimensional flow cytometry, scRNA-seq and scATAC-seq. Data generated by high-dimensional flow cytometry (up to 30 parameters in several million cells) can no longer be analyzed by using classical manual analysis techniques involving the use of bidimensional dot plots (91). Manual gating analyses is hard to reproduce, as is subjective and biased, and for large data set is extremely time consuming. Large datasets are computationally demanding, and therefore require the development and the application of novel techniques.
Computational flow cytometry provides a set of packages to analyze and visualize large amount of cells in an unbiased manner (92). These tools are automated, meaning that the quality of data is fundamental to get rid of false positive. For this reason, before analyzing high-parameter flow cytometry datasets, files need to be perfectly compensated, cleaned from the presence of aggregates and turbulences during acquisition. Only after this step, data can be analyzed by unsupervised tools (93, 94).
scRNA-seq requires pre-processing of data based on quality control performance and alignment (78). Several efforts have been made from bioinformaticians to develop and optimize new software and packages able to provide insights on the complex biology and dynamics of cells (66). Most software provide information regarding identification and characterization of cell types and their spatial organization in time (78). A canonical pipeline of data analysis firstly requires data visualization. There are methods based on dimensionality reduction techniques, including principal component analysis (PCA), t-distributed stochastic neighbor embedding (t-SNE), One-Dimensional Soli-Expression by Nonlinear Stochastic Embedding (ONE-sense), Uniform Manifold Approximation and Projection (UMAP), that aim to preserve the main structure of data while reducing a high-dimensional data description to a lower-dimensional projection (95–97). An example of the analysis of the same data by using PCA, t-SNE, and UMAP is reported in Figure 1. In addition, clustering-based techniques are available that group cells into cell type clusters in the original, high-dimensional space and subsequently use visualization algorithms to represent these cell type clusters in a lower-dimensional space (93, 98, 99).
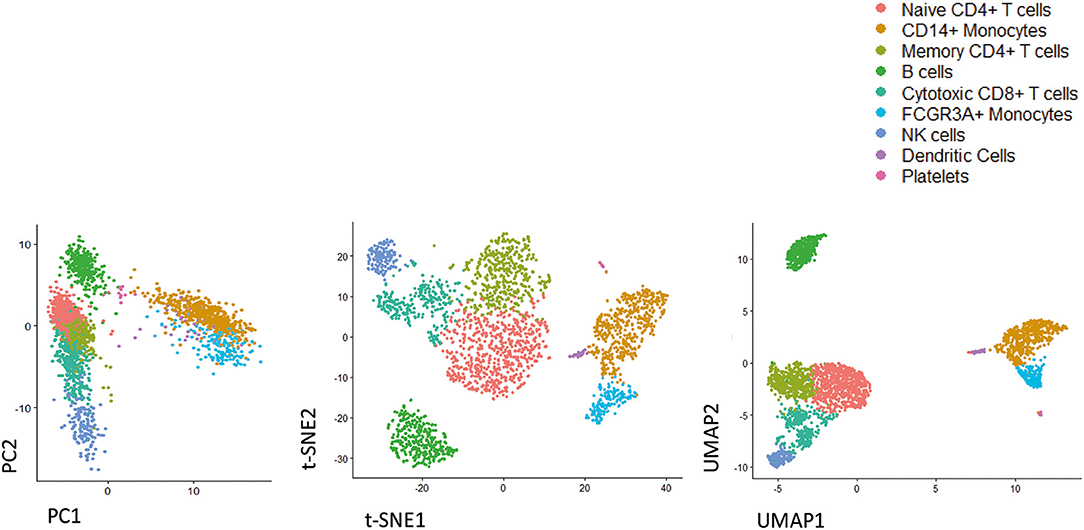
Figure 1. Representative image of different dimensionality reduction techniques that are widely used in single cell studies. As shown by analyzing freely available scRNA-seq dataset (3k PBMC, from 10X Genomics), UMAP preserves much of the local and more of the global data structure, highlighting its ability to resolve even subtly differing cell population. From left to right PCA, t-SNE, UMAP.
Secondly, differences in gene expression level between populations need to be analyzed. To this purpose, specialized methods have been designed for single-cell data that considers single cell features such as technical dropouts and shape of the distribution (100).
Thirdly, the software Monocle and Wanderlust independently introduced the concept of “pseudotemporal analysis,” in which scRNA-seq data are collected from a population of cells undergoing a dynamic biological process and then computationally ordered into a trajectory that reflects the continuous changes in gene expression that occur from the beginning to the end of the process (101–103). Pseudotime trajectories allow to identify genes that exhibit differential expression over the course of the biological process and cluster them based on their expression dynamics. As of February 2020, more than seventy trajectory inference tools have already been developed (104).
The Workflow of Single-Cell Experiment
Regardless of the specific technology employed to generate a particular dataset, a common workflow can be formulated which involves multiple steps linking the initial study design to the final correlation to clinical data. A typical pipeline for single-cell experiments is reported in Figure 2. An accurate experimental planning is imperative to avoid technical issues and improve scientific reproducibility. Several professionals, including the statistician, the bioinformatician, the biologist and the clinician should be involved at this step to: (i) define the biological question; (ii) find patients; (iii) calculate the sample size; (iv) define the number of replicates; (v) decide the number of cells; (vi) define the sequencing depth (in the case of scRNA-seq or sc-ATACseq experiments); (vii) choose the appropriate equipment (105). At this stage, experimental protocols should be standardized, and appropriate positive and negative controls should be selected to ensure good quality results. Then, experiment is performed and raw data are generated. Alongside, data pre-processing is performed. Quality control involves the examination of data, their possible transformation and normalization, the check for technical issues, batch effects or unexpected results. At the end of the entire process, clean data need to be visualized and analyzed by computational approaches to identify clusters and trajectories, and potentially derive novel predictive biomarkers of response to ICI.
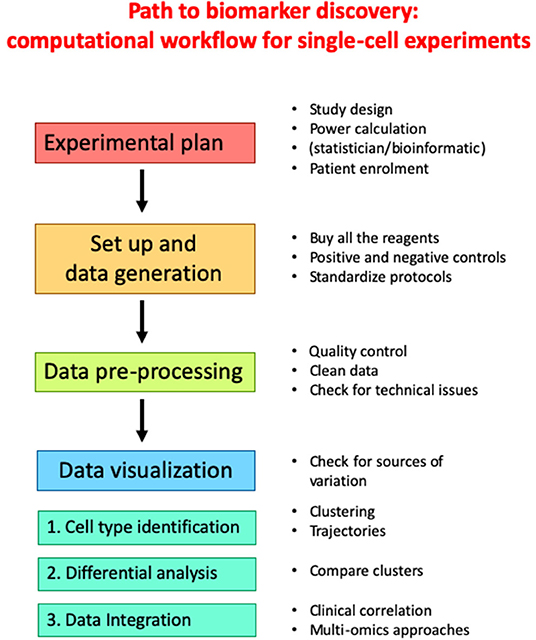
Figure 2. Workflow for canonical single-cell experiment.
Data From Single-Cell Studies
Immune Cells in the Tumor Microenvironment
Tumors contain different cell populations in endless evolution. This diversity is commonly referred to as tumor heterogeneity, and is considered the main driver of resistance to therapy and metastasis (106). The full comprehension of this heterogeneity would be extremely important to optimize existing therapeutic intervention and find new strategies to break down relapses and mortality. The recent development of technologies based on sequencing individual cells has been crucial to address tumor heterogeneity and to elucidate how cells are organized into multicellular systems. Single cell profiles not only revealed that human tumors comprise subpopulations of genetically different diverse malignant cells, but also that a profusion of different cell types from the surrounding tissues and the immune system, each with a precise role in pathogenicity, is present within the TME (106, 107). The immune components of the tumor microenvironment in different kind of malignancies, including non-small cell lung cancer (NSCLC), clear cell RCC (ccRCC), breast cancer (BC), HCC, glioblastoma multiforme (GMB), microsatellite instability-stable CRC have been recently annotated and finely characterized (88, 108–111). In general, in the majority of these tumors, immune cells were mostly T cells, whereas myeloid cells, B cells and NK cells were found at lower frequencies (108–111). Only GMB had higher levels of CD68+ myeloid cells if compared to T cells (88).
In NSCLC tumor samples, different subsets of CD8+ T cells, conventional CD4+ T cells, and Treg cells have been found (109). Each subset is characterized by a precise gene expression signature, which reflects a specific functional status. Two main clusters were found at high frequency: (i) exhausted CD8+ T cells, characterized by increased expression of effector molecules, including GZM-A, granulysin (GNLY), perforin (PRF), GZM-B, NKG7, and inhibitory receptors, like lymphocyte activating (LAG)-3 (CD223), T cell immunoreceptor with Ig and ITIM domains (TIGIT), PD-1, and CTLA-4; (ii) suppressive CD4+ Treg cells, characterized by increased expression of costimulatory molecules, including CD28 and inducible T cell costimulatory (ICOS or CD278), and inhibitory receptors like CTLA-4 and TIGIT (109). Moreover, two CD8+ T cell subsets exhibited a functional state that precede exhaustion, and is indeed called pre-exhaustion state. These subsets do not express CTLA-4, and express mild levels of TIGIT, PD-1, and the transcription factor TOX, which is a critical driver of exhaustion (112–115). Whether or not pre-exhausted subsets could be more effectively reinvigorated by ICI than fully exhausted subsets is still not known. Furthermore, the expression level of PD-1 or other inhibitory receptors does not necessarily correlate with exhaustion-dependent dysfunction. It was indeed reported that tissue-resident memory T (TRM) cells expressing PD-1, T-Cell Immunoglobulin And Mucin Domain-Containing Protein-3 (TIM-3) and negative for CD127 (the α chain of the IL-7 receptor), which are present in lung tumors, proliferate, can upregulate TCR activation–induced genes, exhibit a transcriptional signature indicative of effector, survival, and tissue-residency properties, and produce cytokines, like IL-2, IFN-γ and TNF-α (116). In early-stage triple-negative BC, among CD8+ T cells infiltrating the TME, TRM cells display high levels of genes encoding for cytotoxic molecules, including GZMB and PRF1, high levels of genes encoding for inhibitory checkpoint, as well as high levels of genes associated with proliferation (117). This means that the expression of inhibitory receptors is not a unique feature of exhausted T cells as several highly functional effector cells also express those receptors. This also means that exhausted T cells are heterogenous, and that T cell exhaustion, as well as T cell dysfunctionality, is a gradual, rather than a discrete, state (118).
In ccRCC, in-depth immunophenotyping analysis identified the main immune cell types in both T cells and tumor-associated macrophages (TAMs) (108). Concerning T cells, eight CD4+ clusters, eleven CD8+ clusters, one CD4+/CD8+ double positive cluster, and one CD4–/CD8– double negative cluster were identified (108). Notably, whereas PD-1 had a broad expression both CD8+ and CD4+ T cell population, other inhibitory molecules, like TIM-3, CTLA-4, and 4-1BB (CD137) were expressed only by a few PD-1+ subsets, indicating that a pre-exhaustion status is also present in ccRCC (108). Interestingly, both in CD8+ and CD4+ T cells, PD-1 is co-expressed with CD38, which mediates immunosuppression by activating nitric oxide synthetase which in turn catalyzes the production of nitric oxide from arginine. Although CD38 has traditionally been linked to T cell activation, these data suggest that its expression is not restricted to activated cells, but rather can be extended to exhausted T cells, at least in ccRCC and BC (108, 110). In the latter, a higher frequency of PD-1highCTLA-4+CD38+ T cells has been observed in tumor biopsies if compared to juxta-tumoral tissues, thus confirming that PD-1 and CD38 are both expressed in exhausted cells (110). Indeed, CD8+ T cells expressing high level of PD-1 also expressed the co-inhibitory molecules TIM-3 and CTLA-4, and the activation markers HLA-DR and CD38, which were not expressed by CD8+ T cells expressing intermediate levels of PD-1 (110). Similarly, HCC biopsies were mostly enriched by exhausted CD8+ T cells and Treg cells, and exhausted CD8+ T cells were increased in patients with late stage HCC if compared with early stage HCC (111).
Another cluster of special interest in HCC consisted of mucosal-associated invariant T (MAIT) cells, which are mainly involved in the protection against bacterial or viral mucosal infections (119). Although MAIT cells are considered as a first line defense in the liver, their role in liver cancer is still totally unexplored. Recent evidences revealed that tumor initiation and metastasis formation is reduced in mice knockout for MHC class I-related protein-1 (MR1), which is essential for MAIT development (120). A fraction of MAIT cells among tumor CD8+ T cells has been found also in NSCLC and CRC (109, 121). Interestingly, at least in chronic infections, MAIT cells can express inhibitory receptors, including PD-1, thus meaning that they could also be targets of ICI (122).
In uveal melanoma, single-cell analysis revealed that tumor-infiltrating immune cells, including CD8+ T cells and NK cells, mainly express LAG3, rather than PD-1 or CTLA-4 (123), thus partially explaining the limited efficacy of checkpoint inhibitor therapy in this type of tumors (124). This further confirms that PD-1 is not the exclusive determinant of CD8+ T exhaustion and that the expression of additional markers should be considered across different tumors. The situation is even further complicated by the fact that T cell exhaustion is associated with vast changes in chromatin accessibility (125). Emerging evidence revealed that exhausted CD8+ T cells are epigenetically distinct from functional memory CD8+ T cells, thus suggesting that exhausted T cells occupy a different differentiation state if compared to memory T cells (125).
ScRNA-seq analysis of NK cells obtained from human melanoma metastases indicated that seven clusters of tumor-infiltrating NK are present in these tissues, each with an individual functional specialization (126). NK cells were recently shown to recruit cross-presenting DCs to tumors that are critical for CD8+ T cell–mediated tumor immunity (126).
Although T cells have a dominant role in controlling cancer growth, there is growing interest for other subsets of immune elements that infiltrate the TME, including B and myeloid cells, and that could have a role in the response to therapy. Tumor-infiltrating myeloid cells (TIMs) consist of various subsets of granulocytes, monocytes, macrophages and DCs, at different stage of differentiation, that contribute to cancer progression and response to therapy (127, 128). Among TIMs, the frequency of a specific subset of monocytes, i.e., CD14+, CD16–, HLA-DRhigh monocytes, has been identified as predictor of progression-free and overall survival in patients with metastatic melanoma prior anti-PD-1 therapy (129). High-dimensional single-cell profiling of lung cancer revealed that an enrichment of macrophages expressing high levels of peroxisome proliferator-activated receptor (PPAR)-γ has been observed in lung adenocarcinoma at early stage (130). Macrophages in the TME have also been studied in breast cancer, renal cancer and HCC using scRNA-seq data (4, 108, 131). TAM-like macrophages in HCC highly express two genes, SLC40A1 and GPNMB. The former encodes ferroportin, a transporter exporting iron from cells, and regulates pro-inflammatory cytokines, like IL-6, IL-23, and IL-1β, through a Toll like receptor (TLR)-dependent pathway (131).
Single-cell profiling of tumor biopsies also revealed that DCs can be present at the TME (4, 108, 130). Among TIMs, DCs are the best armed to prime and activate T cells (132), and among DCs, several subsets with a specific molecular signature have been found to be depleted or enriched in the TME. This was possible by combining CyTOF with single-cell transcriptomics. For example, CD141+ DCs express high levels of CD207, CLEC9A, and XCR1 and preferentially interact with CD8+ T cells, whereas CD1c+ DCs express high levels of CX3CR1, IRF4, CCL22, and CCL17, which are involved in chemokine signaling, and are better equipped to interact with CD4+ T cells (130). Also LAMP3+ DCs have various interesting features (131). They indeed exhibit a higher migration capacity toward lymph node if compared to conventional DCs (131).
Checkpoint Inhibitor Therapy Effects on TILs and PBMCs
During the last years, single cell technologies have been used to interrogate a number of tumoral settings with the goal to understand both successful and ineffective immune responses after treatment with ICI, and identify accessible biomarkers that clinicians could use to discriminate between patients who most likely respond or not to therapy (2). The most important studies reporting the use of cutting-edge single-cell technologies to identify the effects of checkpoint inhibitor therapy on immune system are reported in Table 2. Concerning the type of neoplasia, the vast majority of studies regard patients with melanoma or NSCLC, treated with anti-CTLA-4 or anti-PD-1 or, in few cases, with both of them.
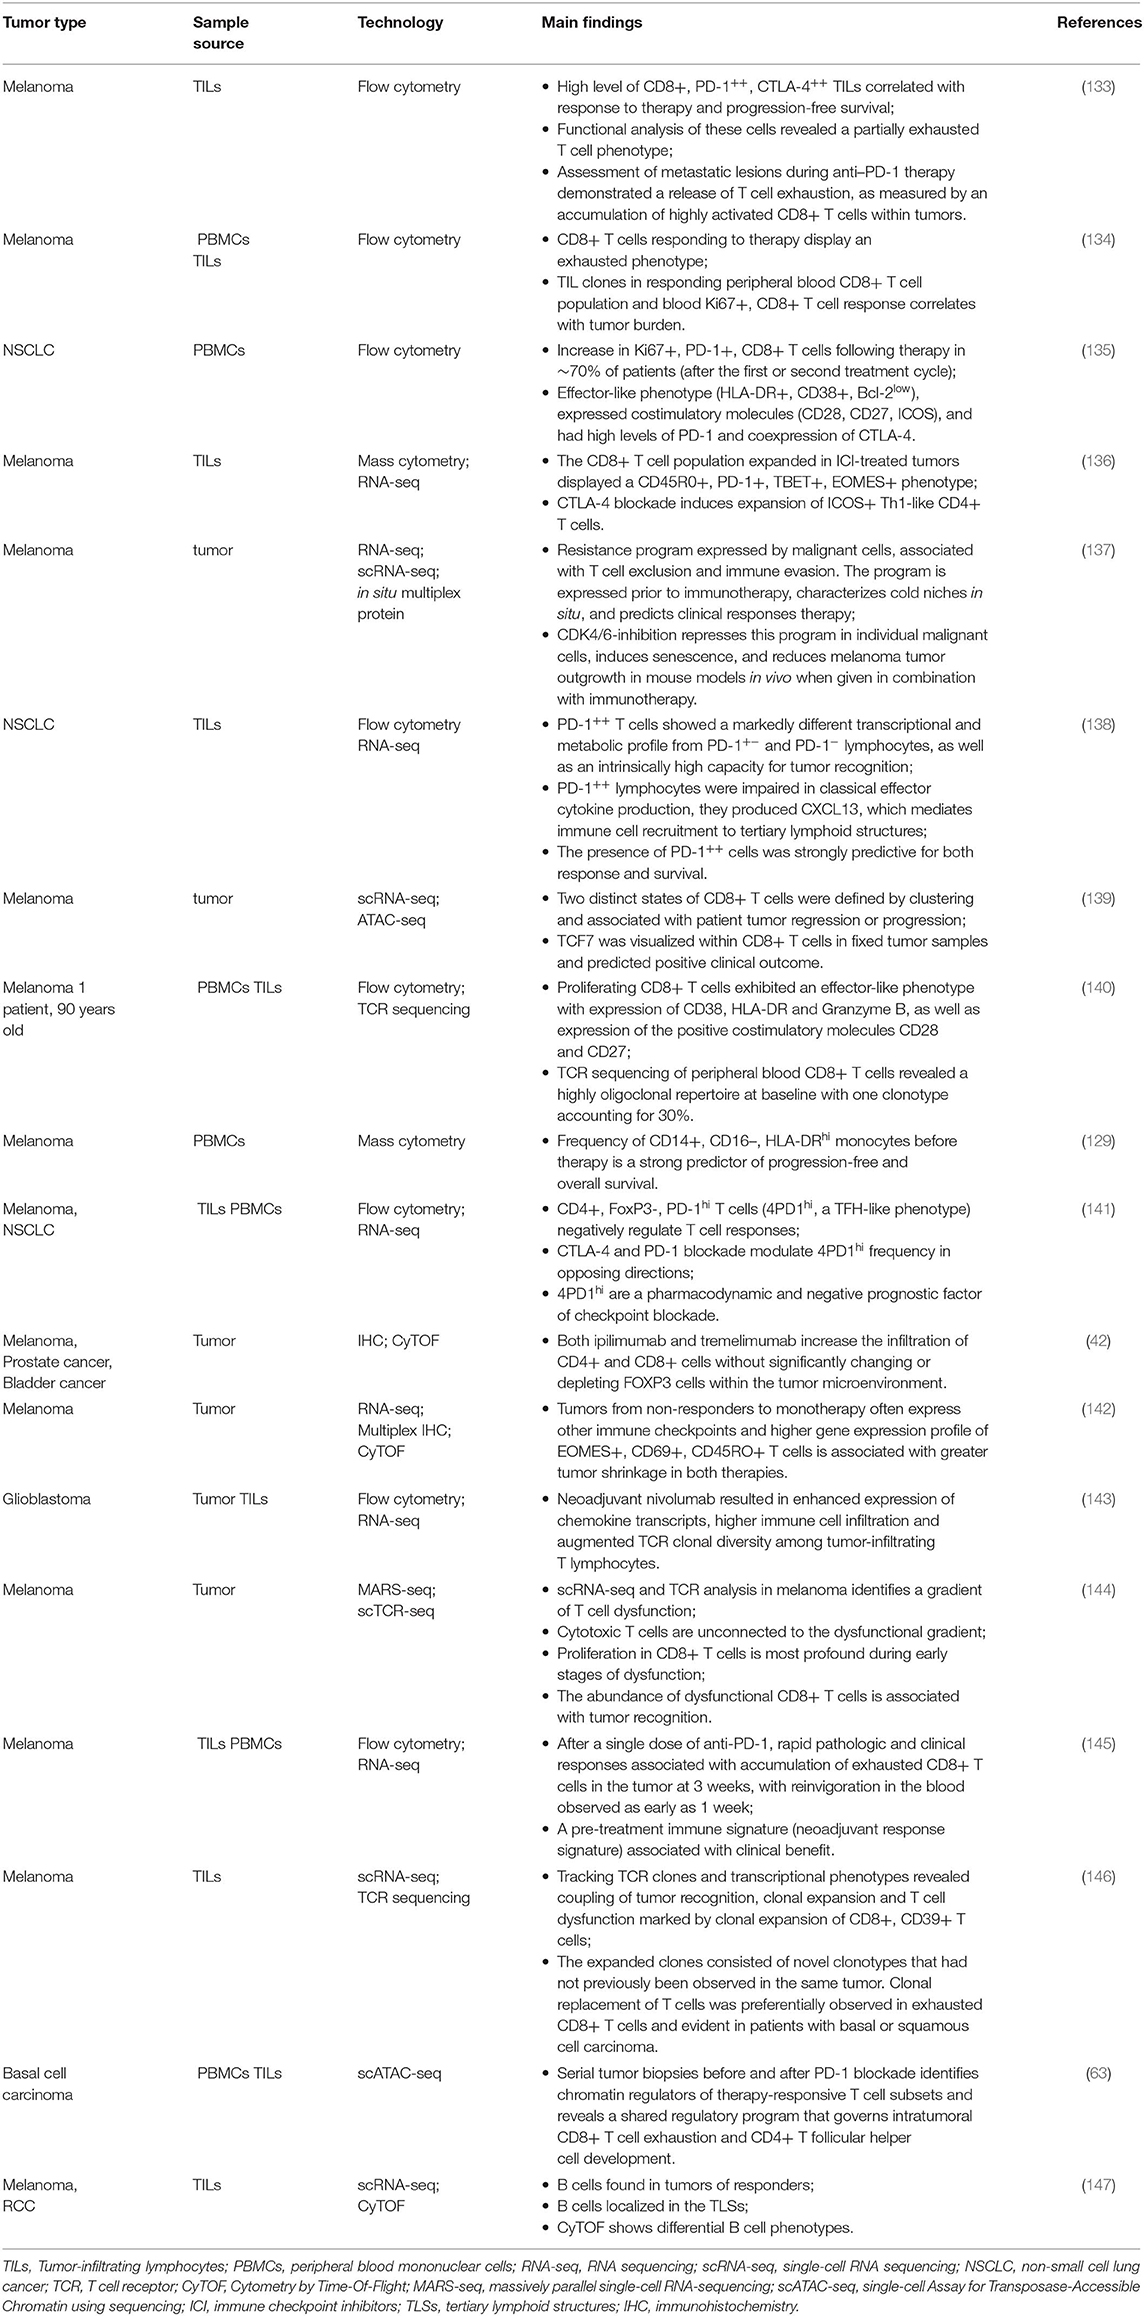
Table 2. Main studies reporting the use of cutting-edge single-cell technologies to identify the effects of checkpoint inhibitor therapy on immune system.
CD8+ T Cells
Overall, among immune cells, main differences have been found in T cell compartment, and among T lymphocytes, cytotoxic cells are often affected by checkpoint inhibitor therapy. Single-cell technologies have shown that cytotoxic T cells do not form a homogenous population but are a heterogenous mix of cells with different transcriptomes, phenotype and functional capacity. According to their differentiation state and on the basis of the expression levels of few proteins, CD8+ T cells have been typically classified in well-defined subsets of naïve, memory, and effector cells (148). During the last few years, high-dimensional single-cell profiling allowed immunologists to understand that a variety of other states with significant phenotypic and functional diversity is observed within the CD8+ T cell compartment (149). This heterogeneity becomes increasingly relevant at the level of the TME, both within and among patients, and could be at the basis of the mechanisms linking T cells states and response to checkpoint inhibitor therapy.
A study performed on freshly isolated metastatic melanoma samples from two cohorts of 20 patients used flow cytometry alone to show that an increased fraction of tumor-infiltrating CD8+ T cells expressing high level of PD-1 and CTLA-4 strongly correlated with response to therapy and progression-free survival (133). These cells were named as “partially exhausted,” as they retained the capacity to produce IFN-y but lose the ability to produce TNF-α and IL-2 (133). In another cohort of patients with melanoma treated with ICI, single-cell RNA profiling of immune cells from baseline, on-therapy and post-therapy tumor samples was performed (139). Exhausted cells were defined as those with increased expression of several genes encoding for inhibitory receptors, including LAG3, FASLG, HAVCR2 (which encodes for TIM-3), PDCD1 (which encodes for PD-1), CD38 (139). It was also showed that TIM-3 and CD39 were markers for discriminating exhausted from memory CD8+ T cells, and that the elevated frequency of TCF7+, CD8+ T cells can predict with a positive outcome (139). Concerning CD39, it was also found that CD8+ TILs from lung cancer and CRC were not only specific for tumor antigens but also could recognize a broad range of epitopes unrelated to cancer, and that CD39 was critical to distinguish tumor-specific CD8+ TILs from bystander CD8+ T cells (150).
In other melanoma patients treated with anti-PD-1, the combination of scRNA-seq to TCR-seq allowed to identify a dysfunctional axis consisting of cells able to actively proliferate despite having an “exhausted” phenotype (144). The application of different single-cell technologies to three different cohorts of melanoma patients treated with anti-PD-1 allowed to understand that a noteworthy phenotypic heterogeneity is observed within CD8+ TILs that display characteristics of dysfunction, reflected by various combinations and expression levels of inhibitory receptor and activation markers, the proliferative capacity and the ability to produce cytokines and effector molecules. A resistance program that is associated with hallmarks of T cell exclusion and suppression has also been found in malignant cells prior to immunotherapy, likely indicating the presence of intrinsic resistance (137).
Other striking results of single-cell technologies have been obtained in blood samples from cancer patients treated with ICI. In those with melanoma, circulating Ki67+, CD8+ T cell response was correlated with tumor burden (134). Similar results were found in NSCLC treated with anti-PD-1. After therapy, an increase of Ki-67+, PD-1+, CD8+ T cells displaying an effector-like phenotype (HLA-DR+, CD38+, Bcl-2low), costimulatory molecules (CD28+, CD27+, ICOS+), high levels of PD-1 and co-expression of CTLA-4 was observed in patients responding to therapy (135, 140). In the same patients, the expansion of CD39+, CD8+ T cells was observed a few days after a single dose of anti-PD-1 in a neoadjuvant setting (145). Tracking TCR clones and transcriptional phenotypes in basal cell carcinoma (BCC) also revealed clonal expansion of CD8+, CD39+ T cells, which co-expressed markers of chronic T cell activation and exhaustion. However, in this case, the expansion of T cell clones did not derive from pre-existing TILs, but from novel clonotypes that had not previously been observed in the same tumor (146). This suggests that the response to anti-PD-1 depends on the intrinsic capacity of tumors to recruit novel T cell clones, which replace pre-existing exhausted T cells that have insufficient capacity to reinvigorate in response to therapy (151).
In addition, data obtained from melanoma samples and peripheral blood from patients treated with anti-CTLA-4 and anti-PD-1 revealed that treatment-specific effects can be observed. Indeed, while anti-PD-1 mainly induced the expansion of specific tumor-infiltrating exhausted-like CD8+ T cell subsets, anti-CTLA-4 led to the expansion of an ICOS+ Th1-like CD4+ effector subsets other than engaging specific subsets of exhausted-like CD8 T cells (136). It was also reported that the population of CD8+, CD45RO+, PD-1+, TBET+, EOMES+ T cells increased after treatment only in TILs if compared to the peripheral blood (136), and that the gene expression signature of EOMES+, CD69+, CD45RO+ T cells was associated with greater tumor shrinkage in both therapies (142). Likewise, in a cohort of patients with NSCLC treated with anti-PD-1, the presence of PD-1++ T cells within the tumor was strongly predictive for both response and survival (138). PD-1++ T cells indeed produce C-X-C Motif Chemokine Ligand 13 (CXCL13), which mediates immune cell recruitment to TLSs (138). Similarly, in a cohort of patients with GMB treated with anti-PD-1 an enhanced expression of chemokine transcripts, higher immune cell infiltration and augmented TCR clonal diversity among tumor-infiltrating TILs was reported (143). In summary, a large variability can be observed among different patients' cohorts concerning the abundance of different T cell functional states. An increase in CD8+ T cells with an effector-like phenotype expressing inhibitory/costimulatory molecules and proliferations markers has been described in several cancer settings after therapy with ICI. However, only in few cases this immune cellular response were correlated with a measurable clinical response.
CD4+ T Cells
The vast majority of recent studies based on single-cell technologies have been focused on CD8+ T cells, as their role in cancer surveillance, editing and control is compelling. However, a role in tumor control is also played by the CD4+ T cell compartment, as reflected by the observation that CD4+ T cells infiltrate the tumor, and by the prognostic value of several CD4 subsets in different malignancies (152–154). Distinct CD4+ T cells subsets have been described by means of single-cell technologies, including naïve cells, memory-like cells, Th1 cells, Treg, follicular helper T cells (TFH), and even cytotoxic effector T cells (109, 111, 121, 141, 144, 146, 155, 156).
In NSCLC tumor and blood samples, scRNA-seq allowed to identify seven CD4+ T cell populations (109). Interestingly, among them an “exhausted” CD4+ T subset was present and displayed a gene signature comparable to that observed in exhausted CD8+ T cells. Two Treg clusters were also identified and one of them was defined as “suppressive Treg” as cells expressed high levels of TNFRSF9 (encoding for 4-IBB), TIGIT and CTLA-4 genes (109). A closer quantification of this cluster in blood and tumor samples revealed that a higher percentage of suppressive Treg cells was present in tumor if compared to blood (109).
A combination of scRNA-seq and TCR analysis allowed to identify a subset of “dysfunctional” CD4+ T cells in a cohort of melanoma patients, and again these dysfunctional cells expressed specific combinations of genes encoding for inhibitory checkpoints that partially overlapped with those observed in CD8+ T cells (144). The fact that in TME CD4+ T cell also express PD-1 and/or CTLA-4 suggests that most of the current immunotherapy strategies that use checkpoint inhibitor can potentially leverage on these cells. Although data dissecting the effects of these drugs on CD4+ T cells are still elusive, it was recently found that in melanoma patients treated with anti-PD-1/anti-CTLA4 the frequency of the T cell population characterized by a TFH-like phenotype (CD4+, Foxp3-, PD-1high) is modulated differently by the two drugs and is a negative prognostic factor of response to therapy (141).
Other Cells Than T Lymphocytes
Through mass cytometry and scRNA-seq, in GMB a unique subset of macrophages expressing high levels of CD73 able to persist after anti-PD-1 therapy was observed (88). Notably, a number of reports have shown that CD73 can induce immunosuppression in GMB (157, 158).
Tumor-infiltrating B cells exist and are mainly found in lymphoid aggregates, known as TLSs (147, 159). It was found that the density of CD20+ B cells and TLSs, together with the ratio of TLSs to tumor area were higher in responders than in non-responders (147). Moreover, a prognostic B-cell-related gene signature was found in patients with cutaneous melanoma or RCC. Several genes, including FCRL5, IDO1, IFNG, and BTLA, were indeed enriched in patients responding to therapy (147).
Conclusions
The interactions between tumor and immune system are ruled by several complex mechanisms, with several main players such as malignant cells, tumor infiltrate, tumor stroma and vasculature, and systemic factors. Among them, the heterogeneity of intra-tumor immune cells has been extensively studied by using traditional approaches, including basic flow cytometry and immunohistochemistry, which have the limitations described above. Recently, substantial advances in emerging techniques and bioinformatic pipelines have enabled researchers to investigate in detail the complexity of the TME, and to interrogate in depth previously unexplored cell types. Among single-cell approaches, scRNA-seq has been crucial for exploratory analysis, and the combination of scRNA-seq with mass cytometry has been even more helpful.
The application of single-cell technologies to tumor and blood samples has generated and will generate in the upcoming years, an explosion of new data with a clear impact in the translational clinical research, thanks to the identification of possible biomarkers. It is likely that the huge amount of information will also thoroughly revolutionize the field of basic research in immunology and cancer biology. A big effort should be posed to make all data, including the raw ones, available to the scientific community and to create rigs for data extraction. The information gathered from these technologies will add novel hallmarks of response to immune therapy that could be integrated in the routine clinical management.
Nonetheless, the route to the discovery of new biomarkers is still bumpy. Due to the high sensitivity of single-cell technologies, adequate attention must be put into experimental setup and execution. A very careful handling of cells during pre-processing and an adequate data analysis with potent bioinformatic tools are critical factors to preserve the native biological profile that will ensure meaningful conclusions.
Lastly but importantly, although a number of specific immune cell subsets have been identified that are associated with response or resistance to ICI, still additional studies should be planned to address the role and function of different types of immune cells in the TME. Investigating the role of T cell exhaustion and/or dysfunction in the TME and translating this knowledge to clinical practice can be considered main challenges in the battle against cancer.
Author Contributions
CP, RD, GP, RS, and AC outlined the concept, wrote the manuscript, and overviewed the review. LG and SD wrote the manuscript. LG, SD, and DL designed and prepared the figures.
Funding
This study was supported by a grant to AC and GP by Fondazione Cassa di Risparmio di Modena e Reggio Emilia, and by the grant Fondo di Ateneo per la Ricerca (FAR) 2017 to AC.
Conflict of Interest
The authors declare that the research was conducted in the absence of any commercial or financial relationships that could be construed as a potential conflict of interest.
Acknowledgments
SD is a Marylou Ingram Scholar of the International Society for Advancement of Cytometry (ISAC).
References
1. Wilky BA. Immune checkpoint inhibitors: the linchpins of modern immunotherapy. Immunol Rev. (2019) 290:6–23. doi: 10.1111/imr.12766
2. Havel JJ, Chowell D, Chan TA. The evolving landscape of biomarkers for checkpoint inhibitor immunotherapy. Nat Rev Cancer. (2019) 19:133–50. doi: 10.1038/s41568-019-0116-x
3. McGranahan N, Furness AJ, Rosenthal R, Ramskov S, Lyngaa R, Saini SK, et al. Clonal neoantigens elicit T cell immunoreactivity and sensitivity to immune checkpoint blockade. Science. (2016) 351:1463–9. doi: 10.1126/science.aaf1490
4. Azizi E, Carr AJ, Plitas G, Cornish AE, Konopacki C, Prabhakaran S, et al. Single-cell map of diverse immune phenotypes in the breast tumor microenvironment. Cell. (2018) 174:1293–308.e36. doi: 10.1016/j.cell.2018.05.060
5. Flavell RA, Sanjabi S, Wrzesinski SH, Licona-Limon P. The polarization of immune cells in the tumour environment by TGFbeta. Nat Rev Immunol. (2010) 10:554–67. doi: 10.1038/nri2808
6. Jenkins RW, Barbie DA, Flaherty KT. Mechanisms of resistance to immune checkpoint inhibitors. Br J Cancer. (2018) 118:9–16. doi: 10.1038/bjc.2017.434
7. Hanahan D, Weinberg RA. Hallmarks of cancer: the next generation. Cell. (2011) 144:646–74. doi: 10.1016/j.cell.2011.02.013
8. Dighe AS, Richards E, Old LJ, Schreiber RD. Enhanced in vivo growth and resistance to rejection of tumor cells expressing dominant negative IFN gamma receptors. Immunity. (1994) 1:447–56. doi: 10.1016/1074-7613(94)90087-6
9. Girardi M, Oppenheim DE, Steele CR, Lewis JM, Glusac E, Filler R, et al. Regulation of cutaneous malignancy by gammadelta T cells. Science. (2001) 294:605–9. doi: 10.1126/science.1063916
10. Kaplan DH, Shankaran V, Dighe AS, Stockert E, Aguet M, Old LJ, et al. Demonstration of an interferon gamma-dependent tumor surveillance system in immunocompetent mice. Proc Natl Acad Sci USA. (1998) 95:7556–61. doi: 10.1073/pnas.95.13.7556
11. Shankaran V, Ikeda H, Bruce AT, White JM, Swanson PE, Old LJ, et al. IFNgamma and lymphocytes prevent primary tumour development and shape tumour immunogenicity. Nature. (2001) 410:1107–11. doi: 10.1038/35074122
12. Smyth MJ, Thia KY, Street SE, Cretney E, Trapani JA, Taniguchi M, et al. Differential tumor surveillance by natural killer (NK) and NKT cells. J Exp Med. (2000) 191:661–8. doi: 10.1084/jem.191.4.661
13. Smyth MJ, Thia KY, Street SE, MacGregor D, Godfrey DI, Trapani JA. Perforin-mediated cytotoxicity is critical for surveillance of spontaneous lymphoma. J Exp Med. (2000) 192:755–60. doi: 10.1084/jem.192.5.755
14. Schreiber RD, Old LJ, Smyth MJ. Cancer immunoediting: integrating immunity's roles in cancer suppression and promotion. Science. (2011) 331:1565–70. doi: 10.1126/science.1203486
15. Engel AM, Svane IM, Rygaard J, Werdelin O. MCA sarcomas induced in scid mice are more immunogenic than MCA sarcomas induced in congenic, immunocompetent mice. Scand J Immunol. (1997) 45:463–70. doi: 10.1046/j.1365-3083.1997.d01-419.x
16. Smyth MJ, Crowe NY, Godfrey DI. NK cells and NKT cells collaborate in host protection from methylcholanthrene-induced fibrosarcoma. Int Immunol. (2001) 13:459–63. doi: 10.1093/intimm/13.4.459
17. Krelin Y, Voronov E, Dotan S, Elkabets M, Reich E, Fogel M, et al. Interleukin-1beta-driven inflammation promotes the development and invasiveness of chemical carcinogen-induced tumors. Cancer Res. (2007) 67:1062–71. doi: 10.1158/0008-5472.CAN-06-2956
18. Liu J, Xiang Z, Ma X. Role of IFN regulatory factor-1 and IL-12 in immunological resistance to pathogenesis of N-methyl-N-nitrosourea-induced T lymphoma. J Immunol. (2004) 173:1184–93. doi: 10.4049/jimmunol.173.2.1184
19. Street SE, Cretney E, Smyth MJ. Perforin and interferon-gamma activities independently control tumor initiation, growth, and metastasis. Blood. (2001) 97:192–7. doi: 10.1182/blood.V97.1.192
20. Swann JB, Vesely MD, Silva A, Sharkey J, Akira S, Schreiber RD, et al. Demonstration of inflammation-induced cancer and cancer immunoediting during primary tumorigenesis. Proc Natl Acad Sci USA. (2008) 105:652–6. doi: 10.1073/pnas.0708594105
21. Boshoff C, Weiss R. AIDS-related malignancies. Nat Rev Cancer. (2002) 2:373–82. doi: 10.1038/nrc797
22. Buell JF, Gross TG, Woodle ES. Malignancy after transplantation. Transplantation. (2005) 80(2 Suppl):S254–64. doi: 10.1097/01.tp.0000186382.81130.ba
23. Moloney FJ, Comber H, O'Lorcain P, O'Kelly P, Conlon PJ, Murphy GM. A population-based study of skin cancer incidence and prevalence in renal transplant recipients. Br J Dermatol. (2006) 154:498–504. doi: 10.1111/j.1365-2133.2005.07021.x
24. Aberg F, Pukkala E, Hockerstedt K, Sankila R, Isoniemi H. Risk of malignant neoplasms after liver transplantation: a population-based study. Liver Transpl. (2008) 14:1428–36. doi: 10.1002/lt.21475
25. Baccarani U, Piselli P, Serraino D, Adani GL, Lorenzin D, Gambato M, et al. Comparison of de novo tumours after liver transplantation with incidence rates from Italian cancer registries. Dig Liver Dis. (2010) 42:55–60. doi: 10.1016/j.dld.2009.04.017
26. Vesely MD, Kershaw MH, Schreiber RD, Smyth MJ. Natural innate and adaptive immunity to cancer. Annu Rev Immunol. (2011) 29:235–71. doi: 10.1146/annurev-immunol-031210-101324
27. Swann JB, Smyth MJ. Immune surveillance of tumors. J Clin Invest. (2007) 117:1137–46. doi: 10.1172/JCI31405
28. Pardoll D. Cancer and the immune system: basic concepts and targets for intervention. Semin Oncol. (2015) 42:523–38. doi: 10.1053/j.seminoncol.2015.05.003
30. Clark WH Jr, Elder DE, Guerry DT, Braitman LE, Trock BJ, Schultz D, et al. Model predicting survival in stage I melanoma based on tumor progression. J Natl Cancer Inst. (1989) 81:1893–904. doi: 10.1093/jnci/81.24.1893
31. Clemente CG, Mihm MC Jr, Bufalino R, Zurrida S, Collini P, Cascinelli N, et al. Prognostic value of tumor infiltrating lymphocytes in the vertical growth phase of primary cutaneous melanoma. Cancer. (1996) 77:1303–10. doi: 10.1002/(SICI)1097-0142(19960401)77:7<1303::AID-CNCR12>3.0.CO;2-5
32. Galon J, Costes A, Sanchez-Cabo F, Kirilovsky A, Mlecnik B, Lagorce-Pages C, et al. Type, density, and location of immune cells within human colorectal tumors predict clinical outcome. Science. (2006) 313:1960–4. doi: 10.1126/science.1129139
33. Pages F, Berger A, Camus M, Sanchez-Cabo F, Costes A, Molidor R, et al. Effector memory T cells, early metastasis, and survival in colorectal cancer. N Engl J Med. (2005) 353:2654–66. doi: 10.1056/NEJMoa051424
34. Sato E, Olson SH, Ahn J, Bundy B, Nishikawa H, Qian F, et al. Intraepithelial CD8+ tumor-infiltrating lymphocytes and a high CD8+/regulatory T cell ratio are associated with favorable prognosis in ovarian cancer. Proc Natl Acad Sci USA. (2005) 102:18538–43. doi: 10.1073/pnas.0509182102
35. van Houdt IS, Sluijter BJ, Moesbergen LM, Vos WM, de Gruijl TD, Molenkamp BG, et al. Favorable outcome in clinically stage II melanoma patients is associated with the presence of activated tumor infiltrating T-lymphocytes and preserved MHC class I antigen expression. Int J Cancer. (2008) 123:609–15. doi: 10.1002/ijc.23543
36. Zhang L, Conejo-Garcia JR, Katsaros D, Gimotty PA, Massobrio M, Regnani G, et al. Intratumoral T cells, recurrence, and survival in epithelial ovarian cancer. N Engl J Med. (2003) 348:203–13. doi: 10.1056/NEJMoa020177
37. Binnewies M, Roberts EW, Kersten K, Chan V, Fearon DF, Merad M, et al. Understanding the tumor immune microenvironment (TIME) for effective therapy. Nat Med. (2018) 24:541–50. doi: 10.1038/s41591-018-0014-x
38. Sautes-Fridman C, Petitprez F, Calderaro J, Fridman WH. Tertiary lymphoid structures in the era of cancer immunotherapy. Nat Rev Cancer. (2019) 19:307–25. doi: 10.1038/s41568-019-0144-6
39. Rowshanravan B, Halliday N, Sansom DM. CTLA-4: a moving target in immunotherapy. Blood. (2018) 131:58–67. doi: 10.1182/blood-2017-06-741033
40. Pol J, Kroemer G. Anti-CTLA-4 immunotherapy: uncoupling toxicity and efficacy. Cell Res. (2018) 28:501–2. doi: 10.1038/s41422-018-0031-9
41. Selby MJ, Engelhardt JJ, Quigley M, Henning KA, Chen T, Srinivasan M, et al. Anti-CTLA-4 antibodies of IgG2a isotype enhance antitumor activity through reduction of intratumoral regulatory T cells. Cancer Immunol Res. (2013) 1:32–42. doi: 10.1158/2326-6066.CIR-13-0013
42. Sharma A, Subudhi SK, Blando J, Vence L, Wargo J, Allison JP, et al. Anti-CTLA-4 immunotherapy does not deplete FOXP3+ regulatory T cells (Tregs) in human cancers-response. Clin Cancer Res. (2019) 25:3469–70. doi: 10.1158/1078-0432.CCR-19-0402
43. Hodi FS, O'Day SJ, McDermott DF, Weber RW, Sosman JA, Haanen JB, et al. Improved survival with ipilimumab in patients with metastatic melanoma. N Engl J Med. (2010) 363:711−23. doi: 10.1056/NEJMoa1003466
44. Robert C, Thomas L, Bondarenko I, O'Day S, Weber J, Garbe C, et al. Ipilimumab plus dacarbazine for previously untreated metastatic melanoma. N Engl J Med. (2011) 364:2517–26. doi: 10.1056/NEJMoa1104621
45. Thommen DS, Schumacher TN. T cell dysfunction in cancer. Cancer Cell. (2018) 33:547–62. doi: 10.1016/j.ccell.2018.03.012
46. Wu Y, Chen W, Xu ZP, Gu W. PD-L1 distribution and perspective for cancer immunotherapy-blockade, knockdown, or inhibition. Front Immunol. (2019) 10:2022. doi: 10.3389/fimmu.2019.02022
47. Gong J, Chehrazi-Raffle A, Reddi S, Salgia R. Development of PD-1 and PD-L1 inhibitors as a form of cancer immunotherapy: a comprehensive review of registration trials and future considerations. J Immunother Cancer. (2018) 6:8. doi: 10.1186/s40425-018-0316-z
48. Wolchok JD, Chiarion-Sileni V, Gonzalez R, Rutkowski P, Grob JJ, Cowey CL, et al. Overall survival with combined nivolumab and ipilimumab in advanced melanoma. N Engl J Med. (2017) 377:1345−56. doi: 10.1056/NEJMoa1709684
49. Hodi FS, Chiarion-Sileni V, Gonzalez R, Grob JJ, Rutkowski P, Cowey CL, et al. Nivolumab plus ipilimumab or nivolumab alone versus ipilimumab alone in advanced melanoma (CheckMate 067): 4-year outcomes of a multicentre, randomised, phase 3 trial. Lancet Oncol. (2018) 19:1480–92. doi: 10.1016/S1470-2045(18)30700-9
50. Motzer RJ, Penkov K, Haanen J, Rini B, Albiges L, Campbell MT, et al. Avelumab plus axitinib versus sunitinib for advanced renal-cell carcinoma. N Engl J Med. (2019) 380:1103–15. doi: 10.1056/NEJMoa1816047
51. Motzer RJ, Rini BI, McDermott DF, Aren Frontera O, Hammers HJ, Carducci MA, et al. Nivolumab plus ipilimumab versus sunitinib in first-line treatment for advanced renal cell carcinoma: extended follow-up of efficacy and safety results from a randomised, controlled, phase 3 trial. Lancet Oncol. (2019) 20:1370–85. doi: 10.1016/S1470-2045(19)30413-9
52. Rini BI, Powles T, Atkins MB, Escudier B, McDermott DF, Suarez C, et al. Atezolizumab plus bevacizumab versus sunitinib in patients with previously untreated metastatic renal cell carcinoma (IMmotion151): a multicentre, open-label, phase 3, randomised controlled trial. Lancet. (2019) 393:2404−15. doi: 10.1016/S0140-6736(19)30723-8
53. Gadalla R, Noamani B, MacLeod BL, Dickson RJ, Guo M, Xu W, et al. Validation of CyTOF against flow cytometry for immunological studies and monitoring of human cancer clinical trials. Front Oncol. (2019) 9:415. doi: 10.3389/fonc.2019.00415
54. Spitzer MH, Nolan GP. Mass cytometry: single cells, many features. Cell. (2016) 165:780–91. doi: 10.1016/j.cell.2016.04.019
55. Robinson JP. Comparative overview of flow and image cytometry. Curr Protoc Cytom. (2005) Chapter 12:Unit 12.1. doi: 10.1002/0471142956.cy1201s31
56. Gerner MY, Kastenmuller W, Ifrim I, Kabat J, Germain RN. Histo-cytometry: a method for highly multiplex quantitative tissue imaging analysis applied to dendritic cell subset microanatomy in lymph nodes. Immunity. (2012) 37:364–76. doi: 10.1016/j.immuni.2012.07.011
57. Chang Q, Ornatsky OI, Siddiqui I, Loboda A, Baranov VI, Hedley DW. Imaging mass cytometry. Cytometry A. (2017) 91:160–9. doi: 10.1002/cyto.a.23053
58. Baharlou H, Canete NP, Cunningham AL, Harman AN, Patrick E. Mass cytometry imaging for the study of human diseases-applications and data analysis strategies. Front Immunol. (2019) 10:2657. doi: 10.3389/fimmu.2019.02657
59. Schapiro D, Jackson HW, Raghuraman S, Fischer JR, Zanotelli VRT, Schulz D, et al. histoCAT: analysis of cell phenotypes and interactions in multiplex image cytometry data. Nat Methods. (2017) 14:873–6. doi: 10.1038/nmeth.4391
60. Papalexi E, Satija R. Single-cell RNA sequencing to explore immune cell heterogeneity. Nat Rev Immunol. (2018) 18:35–45. doi: 10.1038/nri.2017.76
61. Chen G, Ning B, Shi T. Single-cell RNA-seq technologies and related computational data analysis. Front Genet. (2019) 10:317. doi: 10.3389/fgene.2019.00317
62. Wang Y, Navin NE. Advances and applications of single-cell sequencing technologies. Mol Cell. (2015) 58:598–609. doi: 10.1016/j.molcel.2015.05.005
63. Satpathy AT, Granja JM, Yost KE, Qi Y, Meschi F, McDermott GP, et al. Massively parallel single-cell chromatin landscapes of human immune cell development and intratumoral T cell exhaustion. Nat Biotechnol. (2019) 37:925–36. doi: 10.1038/s41587-019-0206-z
64. Cossarizza A, Radbruch A. Cytometry for immunology: a stable and happy marriage. Cytometry A. (2013) 83:673–5. doi: 10.1002/cyto.a.22336
65. Cossarizza A, Radbruch A. Cytometry for immunology: the marriage continues. Cytometry A. (2014) 85:13–4. doi: 10.1002/cyto.a.22429
66. Chattopadhyay PK, Winters AF, Lomas WE III, Laino AS, Woods DM. High-parameter single-cell analysis. Annu Rev Anal Chem. (2019) 12:411–30. doi: 10.1146/annurev-anchem-061417-125927
67. Cossarizza A, Chang HD, Radbruch A, Acs A, Adam D, Adam-Klages S, et al. Guidelines for the use of flow cytometry and cell sorting in immunological studies (second edition). Eur J Immunol. (2019) 49:1457–973. doi: 10.1002/eji.201970107
68. Maciorowski Z, Chattopadhyay PK, Jain P. Basic multicolor flow cytometry. Curr Protoc Immunol. (2017) 117:5.4.1–5.4.38. doi: 10.1002/cpim.26
69. Mahnke Y, Chattopadhyay P, Roederer M. Publication of optimized multicolor immunofluorescence panels. Cytometry A. (2010) 77:814–8. doi: 10.1002/cyto.a.20916
70. Mahnke YD, Roederer M. Optimizing a multicolor immunophenotyping assay. Clin Lab Med. (2007) 27:469–85. doi: 10.1016/j.cll.2007.05.002
71. Nguyen R, Perfetto S, Mahnke YD, Chattopadhyay P, Roederer M. Quantifying spillover spreading for comparing instrument performance and aiding in multicolor panel design. Cytometry A. (2013) 83:306–15. doi: 10.1002/cyto.a.22251
72. Roederer M. Compensation in flow cytometry. Curr Protoc Cytom. (2002) Chapter 1:Unit 1.14. doi: 10.1002/0471142956.cy0114s22
73. Finotello F, Rieder D, Hackl H, Trajanoski Z. Next-generation computational tools for interrogating cancer immunity. Nat Rev Genet. (2019) 20:724–46. doi: 10.1038/s41576-019-0166-7
74. Landhuis E. Single-cell approaches to immune profiling. Nature. (2018) 557:595–7. doi: 10.1038/d41586-018-05214-w
75. Goltsev Y, Samusik N, Kennedy-Darling J, Bhate S, Hale M, Vazquez G, et al. Deep profiling of mouse splenic architecture with CODEX multiplexed imaging. Cell. (2018) 174:968–81.e15. doi: 10.1016/j.cell.2018.07.010
76. Holzwarth K, Kohler R, Philipsen L, Tokoyoda K, Ladyhina V, Wahlby C, et al. Multiplexed fluorescence microscopy reveals heterogeneity among stromal cells in mouse bone marrow sections. Cytometry A. (2018) 93:876–88. doi: 10.1002/cyto.a.23526
77. Giesen C, Wang HA, Schapiro D, Zivanovic N, Jacobs A, Hattendorf B, et al. Highly multiplexed imaging of tumor tissues with subcellular resolution by mass cytometry. Nat Methods. (2014) 11:417–22. doi: 10.1038/nmeth.2869
78. Hwang B, Lee JH, Bang D. Single-cell RNA sequencing technologies and bioinformatics pipelines. Exp Mol Med. (2018) 50:96. doi: 10.1038/s12276-018-0071-8
79. Tang F, Barbacioru C, Wang Y, Nordman E, Lee C, Xu N, et al. mRNA-Seq whole-transcriptome analysis of a single cell. Nat Methods. (2009) 6:377–82. doi: 10.1038/nmeth.1315
80. Ramskold D, Luo S, Wang YC, Li R, Deng Q, Faridani OR, et al. Full-length mRNA-Seq from single-cell levels of RNA and individual circulating tumor cells. Nat Biotechnol. (2012) 30:777–82. doi: 10.1038/nbt.2282
81. Nikolich-Zugich J, Slifka MK, Messaoudi I. The many important facets of T-cell repertoire diversity. Nat Rev Immunol. (2004) 4:123–32. doi: 10.1038/nri1292
82. De Simone M, Rossetti G, Pagani M. Single cell T cell receptor sequencing: techniques and future challenges. Front Immunol. (2018) 9:1638. doi: 10.3389/fimmu.2018.01638
83. Hogan SA, Courtier A, Cheng PF, Jaberg-Bentele NF, Goldinger SM, Manuel M, et al. Peripheral blood TCR repertoire profiling may facilitate patient stratification for immunotherapy against melanoma. Cancer Immunol Res. (2019) 7:77–85. doi: 10.1158/2326-6066.CIR-18-0136
84. Tumeh PC, Harview CL, Yearley JH, Shintaku IP, Taylor EJ, Robert L, et al. PD-1 blockade induces responses by inhibiting adaptive immune resistance. Nature. (2014) 515:568–71. doi: 10.1038/nature13954
85. Peterson VM, Zhang KX, Kumar N, Wong J, Li L, Wilson DC, et al. Multiplexed quantification of proteins and transcripts in single cells. Nat Biotechnol. (2017) 35:936–9. doi: 10.1038/nbt.3973
86. Shahi P, Kim SC, Haliburton JR, Gartner ZJ, Abate AR. Abseq: ultrahigh-throughput single cell protein profiling with droplet microfluidic barcoding. Sci Rep. (2017) 7:44447. doi: 10.1038/srep44447
87. Stoeckius M, Hafemeister C, Stephenson W, Houck-Loomis B, Chattopadhyay PK, Swerdlow H, et al. Simultaneous epitope and transcriptome measurement in single cells. Nat Methods. (2017) 14:865–8. doi: 10.1038/nmeth.4380
88. Goswami S, Walle T, Cornish AE, Basu S, Anandhan S, Fernandez I, et al. Immune profiling of human tumors identifies CD73 as a combinatorial target in glioblastoma. Nat Med. (2020) 26:39–46. doi: 10.1038/s41591-019-0694-x
89. Gubin MM, Esaulova E, Ward JP, Malkova ON, Runci D, Wong P, et al. High-dimensional analysis delineates myeloid and lymphoid compartment remodeling during successful immune-checkpoint cancer therapy. Cell. (2018) 175:1443. doi: 10.1016/j.cell.2018.11.003
90. Buenrostro JD, Wu B, Chang HY, Greenleaf WJ. ATAC-seq: a method for assaying chromatin accessibility genome-wide. Curr Protoc Mol Biol. (2015) 109:21.29.1–21.29.9. doi: 10.1002/0471142727.mb2129s109
91. Mair F, Hartmann FJ, Mrdjen D, Tosevski V, Krieg C, Becher B. The end of gating? An introduction to automated analysis of high dimensional cytometry data. Eur J Immunol. (2016) 46:34–43. doi: 10.1002/eji.201545774
92. Saeys Y, Van Gassen S, Lambrecht BN. Computational flow cytometry: helping to make sense of high-dimensional immunology data. Nat Rev Immunol. (2016) 16:449–62. doi: 10.1038/nri.2016.56
93. Brummelman J, Haftmann C, Nunez NG, Alvisi G, Mazza EMC, Becher B, et al. Development, application and computational analysis of high-dimensional fluorescent antibody panels for single-cell flow cytometry. Nat Protoc. (2019) 14:1946–69. doi: 10.1038/s41596-019-0166-2
94. Mazza EMC, Brummelman J, Alvisi G, Roberto A, De Paoli F, Zanon V, et al. Background fluorescence and spreading error are major contributors of variability in high-dimensional flow cytometry data visualization by t-distributed stochastic neighboring embedding. Cytometry A. (2018) 93:785–92. doi: 10.1002/cyto.a.23566
95. Becht E, McInnes L, Healy J, Dutertre CA, Kwok IWH, Ng LG, et al. Dimensionality reduction for visualizing single-cell data using UMAP. Nat Biotechnol. (2018) 37:38–44. doi: 10.1038/nbt.4314
96. Cheng Y, Wong MT, van der Maaten L, Newell EW. Categorical analysis of human T cell heterogeneity with one-dimensional soli-expression by nonlinear stochastic embedding. J Immunol. (2016) 196:924–32. doi: 10.4049/jimmunol.1501928
97. Lugli E, Pinti M, Nasi M, Troiano L, Ferraresi R, Mussi C, et al. Subject classification obtained by cluster analysis and principal component analysis applied to flow cytometric data. Cytometry A. (2007) 71:334–44. doi: 10.1002/cyto.a.20387
98. Levine JH, Simonds EF, Bendall SC, Davis KL, Amir el AD, Tadmor MD, et al. Data-driven phenotypic dissection of AML reveals progenitor-like cells that correlate with prognosis. Cell. (2015) 162:184–97. doi: 10.1016/j.cell.2015.05.047
99. Van Gassen S, Callebaut B, Van Helden MJ, Lambrecht BN, Demeester P, Dhaene T, et al. FlowSOM: using self-organizing maps for visualization and interpretation of cytometry data. Cytometry A. (2015) 87:636–45. doi: 10.1002/cyto.a.22625
100. Wang T, Li B, Nelson CE, Nabavi S. Comparative analysis of differential gene expression analysis tools for single-cell RNA sequencing data. BMC Bioinformatics. (2019) 20:40. doi: 10.1186/s12859-019-2599-6
101. Bendall SC, Davis KL, Amir el AD, Tadmor MD, Simonds EF, Chen TJ, et al. Single-cell trajectory detection uncovers progression and regulatory coordination in human B cell development. Cell. (2014) 157:714–25. doi: 10.1016/j.cell.2014.04.005
102. Packer J, Trapnell C. Single-cell multi-omics: an engine for new quantitative models of gene regulation. Trends Genet. (2018) 34:653–65. doi: 10.1016/j.tig.2018.06.001
103. Trapnell C, Cacchiarelli D, Grimsby J, Pokharel P, Li S, Morse M, et al. The dynamics and regulators of cell fate decisions are revealed by pseudotemporal ordering of single cells. Nat Biotechnol. (2014) 32:381–6. doi: 10.1038/nbt.2859
104. Saelens W, Cannoodt R, Todorov H, Saeys Y. A comparison of single-cell trajectory inference methods. Nat Biotechnol. (2019) 37:547–54. doi: 10.1038/s41587-019-0071-9
105. Todorov H, Saeys Y. Computational approaches for high-throughput single-cell data analysis. FEBS J. (2019) 286:1451–67. doi: 10.1111/febs.14613
106. Gonzalez-Silva L, Quevedo L, Varela I. Tumor functional heterogeneity unraveled by scRNA-seq technologies. Trends Cancer. (2020) 6:13–9. doi: 10.1016/j.trecan.2019.11.010
107. Navin N, Kendall J, Troge J, Andrews P, Rodgers L, McIndoo J, et al. Tumour evolution inferred by single-cell sequencing. Nature. (2011) 472:90–4. doi: 10.1038/nature09807
108. Chevrier S, Levine JH, Zanotelli VRT, Silina K, Schulz D, Bacac M, et al. An immune atlas of clear cell renal cell carcinoma. Cell. (2017) 169:736–49.e18. doi: 10.1016/j.cell.2017.04.016
109. Guo X, Zhang Y, Zheng L, Zheng C, Song J, Zhang Q, et al. Global characterization of T cells in non-small-cell lung cancer by single-cell sequencing. Nat Med. (2018) 24:978–85. doi: 10.1038/s41591-018-0045-3
110. Wagner J, Rapsomaniki MA, Chevrier S, Anzeneder T, Langwieder C, Dykgers A, et al. A single-cell atlas of the tumor and immune ecosystem of human breast cancer. Cell. (2019) 177:1330–45.e18. doi: 10.1016/j.cell.2019.03.005
111. Zheng C, Zheng L, Yoo JK, Guo H, Zhang Y, Guo X, et al. Landscape of infiltrating T cells in liver cancer revealed by single-cell sequencing. Cell. (2017) 169:1342–56.e16. doi: 10.1016/j.cell.2017.05.035
112. Alfei F, Kanev K, Hofmann M, Wu M, Ghoneim HE, Roelli P, et al. TOX reinforces the phenotype and longevity of exhausted T cells in chronic viral infection. Nature. (2019) 571:265–9. doi: 10.1038/s41586-019-1326-9
113. Khan O, Giles JR, McDonald S, Manne S, Ngiow SF, Patel KP, et al. TOX transcriptionally and epigenetically programs CD8+ T cell exhaustion. Nature. (2019) 571:211–8. doi: 10.1038/s41586-019-1325-x
114. Scott AC, Dundar F, Zumbo P, Chandran SS, Klebanoff CA, Shakiba M, et al. TOX is a critical regulator of tumour-specific T cell differentiation. Nature. (2019) 571:270–4. doi: 10.1038/s41586-019-1324-y
115. Seo H, Chen J, Gonzalez-Avalos E, Samaniego-Castruita D, Das A, Wang YH, et al. TOX and TOX2 transcription factors cooperate with NR4A transcription factors to impose CD8+ T cell exhaustion. Proc Natl Acad Sci USA. (2019) 116:12410–5. doi: 10.1073/pnas.1905675116
116. Clarke J, Panwar B, Madrigal A, Singh D, Gujar R, Wood O, et al. Single-cell transcriptomic analysis of tissue-resident memory T cells in human lung cancer. J Exp Med. (2019) 216:2128–49. doi: 10.1084/jem.20190249
117. Savas P, Virassamy B, Ye C, Salim A, Mintoff CP, Caramia F, et al. Single-cell profiling of breast cancer T cells reveals a tissue-resident memory subset associated with improved prognosis. Nat Med. (2018) 24:986–93. doi: 10.1038/s41591-018-0078-7
118. Blank CU, Haining WN, Held W, Hogan PG, Kallies A, Lugli E, et al. Defining ‘T cell exhaustion’. Nat Rev Immunol. (2019) 19:665–74. doi: 10.1038/s41577-019-0221-9
119. Provine NM, Klenerman P. MAIT cells in health and disease. Annu Rev Immunol. (2020) 38:203–28. doi: 10.1146/annurev-immunol-080719-015428
120. Yan J, Allen S, McDonald E, Das I, Mak JYW, Liu L, et al. MAIT cells promote tumor initiation, growth, and metastases via tumor MR1. Cancer Discov. (2020) 10:124–41. doi: 10.1158/2159-8290.CD-19-0569
121. Zhang L, Yu X, Zheng L, Zhang Y, Li Y, Fang Q, et al. Lineage tracking reveals dynamic relationships of T cells in colorectal cancer. Nature. (2018) 564:268–72. doi: 10.1038/s41586-018-0694-x
122. Yong YK, Saeidi A, Tan HY, Rosmawati M, Enstrom PF, Batran RA, et al. Hyper-expression of PD-1 is associated with the levels of exhausted and dysfunctional phenotypes of circulating CD161++ TCR iValpha7.2+ mucosal-associated invariant T cells in chronic hepatitis B virus infection. Front Immunol. (2018) 9:472. doi: 10.3389/fimmu.2018.00472
123. Durante MA, Rodriguez DA, Kurtenbach S, Kuznetsov JN, Sanchez MI, Decatur CL, et al. Single-cell analysis reveals new evolutionary complexity in uveal melanoma. Nat Commun. (2020) 11:496. doi: 10.1038/s41467-019-14256-1
124. Heppt MV, Steeb T, Schlager JG, Rosumeck S, Dressler C, Ruzicka T, et al. Immune checkpoint blockade for unresectable or metastatic uveal melanoma: a systematic review. Cancer Treat Rev. (2017) 60:44–52. doi: 10.1016/j.ctrv.2017.08.009
125. Sen DR, Kaminski J, Barnitz RA, Kurachi M, Gerdemann U, Yates KB, et al. The epigenetic landscape of T cell exhaustion. Science. (2016) 354:1165–69. doi: 10.1126/science.aae0491
126. de Andrade LF, Lu Y, Luoma A, Ito Y, Pan D, Pyrdol JW, et al. Discovery of specialized NK cell populations infiltrating human melanoma metastases. JCI Insight. (2019) 4:e133103. doi: 10.1172/jci.insight.133103
127. Engblom C, Pfirschke C, Pittet MJ. The role of myeloid cells in cancer therapies. Nat Rev Cancer. (2016) 16:447–62. doi: 10.1038/nrc.2016.54
128. Gabrilovich DI, Ostrand-Rosenberg S, Bronte V. Coordinated regulation of myeloid cells by tumours. Nat Rev Immunol. (2012) 12:253–68. doi: 10.1038/nri3175
129. Krieg C, Nowicka M, Guglietta S, Schindler S, Hartmann FJ, Weber LM, et al. High-dimensional single-cell analysis predicts response to anti-PD-1 immunotherapy. Nat Med. (2018) 24:144–53. doi: 10.1038/nm.4466
130. Lavin Y, Kobayashi S, Leader A, Amir ED, Elefant N, Bigenwald C, et al. Innate immune landscape in early lung adenocarcinoma by paired single-cell analyses. Cell. (2017) 169:750–65.e17. doi: 10.1016/j.cell.2017.04.014
131. Zhang Q, He Y, Luo N, Patel SJ, Han Y, Gao R, et al. Landscape and dynamics of single immune cells in hepatocellular carcinoma. Cell. (2019) 179:829–45.e20. doi: 10.1016/j.cell.2019.10.003
132. Merad M, Sathe P, Helft J, Miller J, Mortha A. The dendritic cell lineage: ontogeny and function of dendritic cells and their subsets in the steady state and the inflamed setting. Annu Rev Immunol. (2013) 31:563–604. doi: 10.1146/annurev-immunol-020711-074950
133. Daud AI, Loo K, Pauli ML, Sanchez-Rodriguez R, Sandoval PM, Taravati K, et al. Tumor immune profiling predicts response to anti-PD-1 therapy in human melanoma. J Clin Invest. (2016) 126:3447–52. doi: 10.1172/JCI87324
134. Huang AC, Postow MA, Orlowski RJ, Mick R, Bengsch B, Manne S, et al. T-cell invigoration to tumour burden ratio associated with anti-PD-1 response. Nature. (2017) 545:60–5. doi: 10.1038/nature22079
135. Kamphorst AO, Pillai RN, Yang S, Nasti TH, Akondy RS, Wieland A, et al. Proliferation of PD-1+ CD8 T cells in peripheral blood after PD-1-targeted therapy in lung cancer patients. Proc Natl Acad Sci USA. (2017) 114:4993–8. doi: 10.1073/pnas.1705327114
136. Wei SC, Levine JH, Cogdill AP, Zhao Y, Anang NAS, Andrews MC, et al. Distinct cellular mechanisms underlie anti-CTLA-4 and anti-PD-1 checkpoint blockade. Cell. (2017) 170:1120–33.e17. doi: 10.1016/j.cell.2017.07.024
137. Jerby-Arnon L, Shah P, Cuoco MS, Rodman C, Su MJ, Melms JC, et al. A cancer cell program promotes T cell exclusion and resistance to checkpoint blockade. Cell. (2018) 175:984–97.e24. doi: 10.1016/j.cell.2018.09.006
138. Thommen DS, Koelzer VH, Herzig P, Roller A, Trefny M, Dimeloe S, et al. A transcriptionally and functionally distinct PD-1+ CD8+ T cell pool with predictive potential in non-small-cell lung cancer treated with PD-1 blockade. Nat Med. (2018) 24:994–1004. doi: 10.1038/s41591-018-0057-z
139. Sade-Feldman M, Yizhak K, Bjorgaard SL, Ray JP, de Boer CG, Jenkins RW, et al. Defining T cell states associated with response to checkpoint immunotherapy in melanoma. Cell. (2018) 175:998–1013.e20. doi: 10.1016/j.cell.2018.10.038
140. Wieland A, Kamphorst AO, Adsay NV, Masor JJ, Sarmiento J, Nasti TH, et al. T cell receptor sequencing of activated CD8 T cells in the blood identifies tumor-infiltrating clones that expand after PD-1 therapy and radiation in a melanoma patient. Cancer Immunol Immunother. (2018) 67:1767–76. doi: 10.1007/s00262-018-2228-7
141. Zappasodi R, Budhu S, Hellmann MD, Postow MA, Senbabaoglu Y, Manne S, et al. Non-conventional inhibitory CD4+Foxp3(-)PD-1(hi) T cells as a biomarker of immune checkpoint blockade activity. Cancer Cell. (2018) 33:1017–32.e7. doi: 10.1016/j.ccell.2018.05.009
142. Gide TN, Quek C, Menzies AM, Tasker AT, Shang P, Holst J, et al. Distinct immune cell populations define response to anti-PD-1 monotherapy and anti-PD-1/anti-CTLA-4 combined therapy. Cancer Cell. (2019) 35:238–55.e6. doi: 10.1016/j.ccell.2019.01.003
143. Schalper KA, Rodriguez-Ruiz ME, Diez-Valle R, Lopez-Janeiro A, Porciuncula A, Idoate MA, et al. Neoadjuvant nivolumab modifies the tumor immune microenvironment in resectable glioblastoma. Nat Med. (2019) 25:470–6. doi: 10.1038/s41591-018-0339-5
144. Li H, van der Leun AM, Yofe I, Lubling Y, Gelbard-Solodkin D, van Akkooi ACJ, et al. Dysfunctional CD8 T cells form a proliferative, dynamically regulated compartment within human melanoma. Cell. (2019) 176:775–89.e18. doi: 10.1016/j.cell.2018.11.043
145. Huang AC, Orlowski RJ, Xu X, Mick R, George SM, Yan PK, et al. A single dose of neoadjuvant PD-1 blockade predicts clinical outcomes in resectable melanoma. Nat Med. (2019) 25:454–61. doi: 10.1038/s41591-019-0357-y
146. Yost KE, Satpathy AT, Wells DK, Qi Y, Wang C, Kageyama R, et al. Clonal replacement of tumor-specific T cells following PD-1 blockade. Nat Med. (2019) 25:1251–9. doi: 10.1038/s41591-019-0522-3
147. Helmink BA, Reddy SM, Gao J, Zhang S, Basar R, Thakur R, et al. B cells and tertiary lymphoid structures promote immunotherapy response. Nature. (2020) 577:549–55. doi: 10.1038/s41586-019-1922-8
148. Taniuchi I. CD4 helper and CD8 cytotoxic T cell differentiation. Annu Rev Immunol. (2018) 36:579–601. doi: 10.1146/annurev-immunol-042617-053411
149. van der Leun AM, Thommen DS, Schumacher TN. CD8+ T cell states in human cancer: insights from single-cell analysis. Nat Rev Cancer. (2020). doi: 10.1038/s41568-019-0235-4
150. Simoni Y, Becht E, Fehlings M, Loh CY, Koo SL, Teng KWW, et al. Bystander CD8+ T cells are abundant and phenotypically distinct in human tumour infiltrates. Nature. (2018) 557:575–9. doi: 10.1038/s41586-018-0130-2
151. Harjes U. T cells pass on the baton during checkpoint inhibition. Nat Rev Cancer. (2019) 19:546. doi: 10.1038/s41568-019-0194-9
152. Fridman WH, Zitvogel L, Sautes-Fridman C, Kroemer G. The immune contexture in cancer prognosis and treatment. Nat Rev Clin Oncol. (2017) 14:717–34. doi: 10.1038/nrclinonc.2017.101
153. Friedman KM, Prieto PA, Devillier LE, Gross CA, Yang JC, Wunderlich JR, et al. Tumor-specific CD4+ melanoma tumor-infiltrating lymphocytes. J Immunother. (2012) 35:400–8. doi: 10.1097/CJI.0b013e31825898c5
154. Wang K, Shen T, Siegal GP, Wei S. The CD4/CD8 ratio of tumor-infiltrating lymphocytes at the tumor-host interface has prognostic value in triple-negative breast cancer. Hum Pathol. (2017) 69:110–17. doi: 10.1016/j.humpath.2017.09.012
155. Magen A, Nie J, Ciucci T, Tamoutounour S, Zhao Y, Mehta M, et al. Single-cell profiling defines transcriptomic signatures specific to tumor-reactive versus virus-responsive CD4+ T cells. Cell Rep. (2019) 29:3019–32.e6. doi: 10.1016/j.celrep.2019.10.131
156. Tirosh I, Izar B, Prakadan SM, Wadsworth MH, 2nd, Treacy D, Trombetta JJ, et al. Dissecting the multicellular ecosystem of metastatic melanoma by single-cell RNA-seq. Science. (2016) 352:189−96. doi: 10.1126/science.aad0501
157. Antonioli L, Pacher P, Vizi ES, Hasko G. CD39 and CD73 in immunity and inflammation. Trends Mol Med. (2013) 19:355–67. doi: 10.1016/j.molmed.2013.03.005
158. Azambuja JH, Gelsleichter NE, Beckenkamp LR, Iser IC, Fernandes MC, Figueiro F, et al. CD73 downregulation decreases in vitro and in vivo glioblastoma growth. Mol Neurobiol. (2019) 56:3260–79. doi: 10.1007/s12035-018-1240-4
Keywords: immunotherapy, immune checkpoint, single-cell technologies, cancer, immune system
Citation: Gibellini L, De Biasi S, Porta C, Lo Tartaro D, Depenni R, Pellacani G, Sabbatini R and Cossarizza A (2020) Single-Cell Approaches to Profile the Response to Immune Checkpoint Inhibitors. Front. Immunol. 11:490. doi: 10.3389/fimmu.2020.00490
Received: 11 December 2019; Accepted: 03 March 2020;
Published: 20 March 2020.
Edited by:
Attila Tarnok, Fraunhofer Institute for Cell Therapy and Immunology (IZI), GermanyReviewed by:
Daniel Olive, Aix Marseille Université, FranceMatteo Bellone, San Raffaele Hospital (IRCCS), Italy
Copyright © 2020 Gibellini, De Biasi, Porta, Lo Tartaro, Depenni, Pellacani, Sabbatini and Cossarizza. This is an open-access article distributed under the terms of the Creative Commons Attribution License (CC BY). The use, distribution or reproduction in other forums is permitted, provided the original author(s) and the copyright owner(s) are credited and that the original publication in this journal is cited, in accordance with accepted academic practice. No use, distribution or reproduction is permitted which does not comply with these terms.
*Correspondence: Lara Gibellini, lara.gibellini@unimore.it
†These authors have contributed equally to this work