
VOR gain calculation methods in video head impulse recordings
Abstract
BACKGROUND:
International consensus on best practices for calculating and reporting vestibular function is lacking. Quantitative vestibulo-ocular reflex (VOR) gain using a video head impulse test (HIT) device can be calculated by various methods.
OBJECTIVE:
To compare different gain calculation methods and to analyze interactions between artifacts and calculation methods.
METHODS:
We analyzed 1300 horizontal HIT traces from 26 patients with acute vestibular syndrome and calculated the ratio between eye and head velocity at specific time points (40 ms, 60 ms) after HIT onset (‘velocity gain’), ratio of velocity slopes (‘regression gain’), and ratio of area under the curves after de-saccading (‘position gain’).
RESULTS:
There was no mean difference between gain at 60 ms and position gain, both showing a significant correlation (r2 = 0.77, p < 0.001) for artifact-free recordings. All artifacts reduced high, normal-range gains modestly (range –0.06 to –0.11). The impact on abnormal, low gains was variable (depending on the artifact type) compared to artifact-free recordings.
CONCLUSIONS:
There is no clear superiority of a single gain calculation method for video HIT testing. Artifacts cause small but significant reductions of measured VOR gains in HITs with higher, normal-range gains, regardless of calculation method. Artifacts in abnormal HITs with low gain increased measurement noise. A larger number of HITs should be performed to confirm abnormal results, regardless of calculation method.
1Introduction
There are different calculation methods of VOR gain measured quantitatively by a video head impulse test (vHIT) and there is no international consensus on how to best report vestibular function. The head impulse test, first described by Halmagyi and Curthoys [9], is a critical method to evaluate the vestibulo-ocular reflex (VOR) in patients with dizziness and balance disorders, but can be challenging to interpret clinically [11]. Thanks to new light-weight mobile and non-invasive video-oculography devices it is now possible to quantitatively measure VOR and to identify corrective saccades [15].
vHIT devices consist of a light-weight goggles frame, a mounted infrared high-speed camera for eye-tracking, and an inertial sensor for head acceleration measurements. These devices test VOR function of horizontal and vertical semicircular canals. The VOR gain is predominately mediated by the function of the ipsilateral canal with some influence from the contralateral canal. The accuracy of the measurement with such non-invasive devices has been validated against recordings with magnetic scleral search coils [14, 15, 23, 26], a laboratory gold standard for ocular motor recordings [23].
VOR gain measured with scleral magnetic search coils is calculated as the ratio of eye to head velocity [2, 3, 12]. Gain can be measured over a time range/period or at specific time points after initiation of head movement such as 40 ms [8], 60 ms, or at the time of peak head velocity [4], here called ‘velocity gain.’ Another possibility to evaluate gain is a linear regression of eye and head velocity [3], which compares the slopes between head and eye velocity around peak head acceleration, here called ‘regression gain.’ Another method is calculating gain as the ratio of the areas under the curve (AUC) after de-saccading eye and head velocity curves [15], which compares eye and head position, here called ‘position gain.’
On the other hand, there are disruptive eye movements and measurement artifacts observed while testing dizzy patients [16]. Frequent artifacts can interfere with VOR gain measurements [16], causing different calculation methods to result in different gain values. This issue is important, as VOR gain is also now starting to be used as a triage tool for differentiating between peripheral and central causes of acute dizziness or vertigo [16, 19].
The aim of this study was to compare different gain calculation methods, to analyze the impact of artifacts on VOR gain, and to test whether specific gain calculation algorithms were\enlargethispage 3pt particularly robust despite the presence of these artifacts.
2Material and methods
2.1Test subjects
The data set from the previous publication [17] was used for all vHIT gain calculations in this manuscript. The vHIT data were collected as part of a prospective cross-sectional multicenter study (OSF Saint Francis Medical Center, Peoria, Ill., USA, and Johns Hopkins Hospital, Baltimore, MD, USA) between August 2011 and December 2012. Twenty-six patients with an acute vestibular syndrome and a mix of underlying disease pathologies [25] were examined. Patient characteristics and diagnoses are summarized in previous publications reporting diagnostic accuracy [17] and type of artifacts [16] in the same population.
2.2Video head impulse test (vHIT) assessment
Fig.1
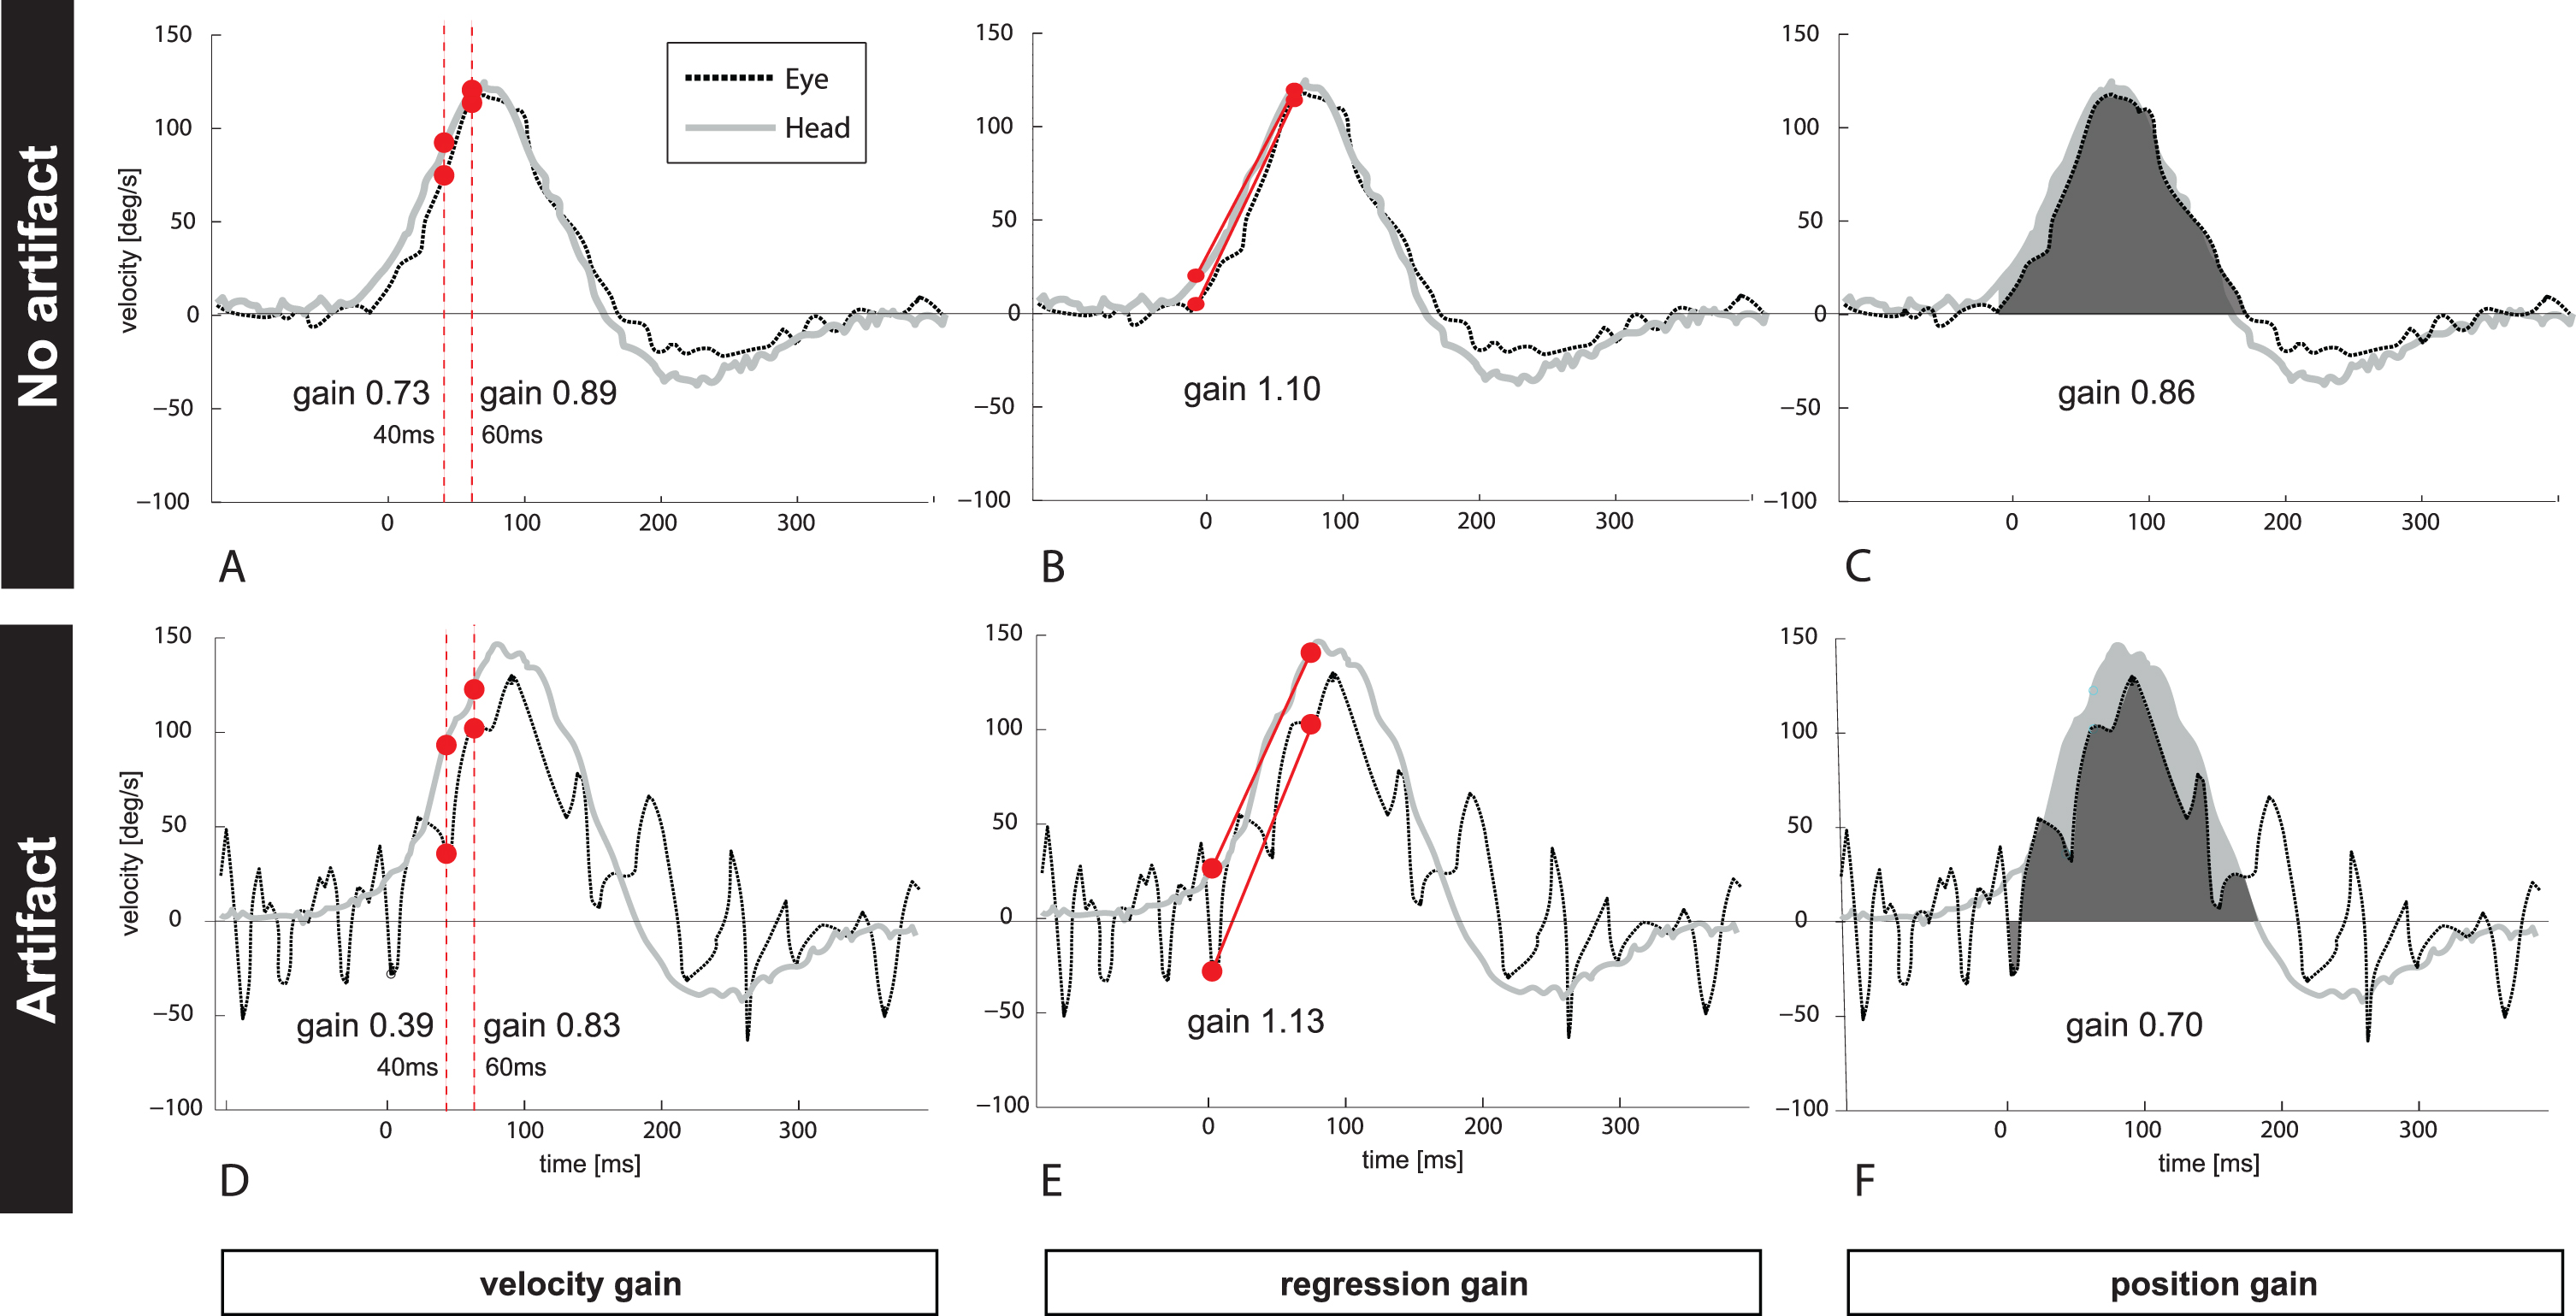
Figure 1 depicts one clean (Fig. 1A–C, no artifacts) and unclean (Fig. 1D–E, trace with artifacts) vHIT example (eye- and head velocity profile) from one patient with PICA stroke. The unclean vHIT shows trace oscillation artifacts due to intermittent pupil tracking loss. VOR gain has been calculated by (A and D) taking different time points at 40 ms and at 60 ms after HIT onset (‘velocity gain’), (B and E) applying a linear regression (‘regression gain’), or (C and F) comparing the area under the curve for eye (black) and head (grey) velocity (‘position gain’). Note that VOR gain from the same patient and the same vHIT trace resulted in different VOR gains for each calculation method ranging from 0.73–1.1 (traces with no artifact) and from 0.39–1.13 if artifacts changed the morphology of the bell-shaped slow phase curve.
A dataset with 1300 HIT traces in total was used as the basis for our study. While performing the horizontal head impulse test toward each ear, eye and head movements were recorded at the bedside with a vHIT device (ICS Impulse; formerly GN Otometrics, Taastrup, Denmark; now Otometrics division of Natus Medical Inc., Pleasanton, CA, USA). vHIT recordings can be categorized as reflecting either normal or abnormal vestibular function on the basis of VOR gain. A VOR gain close to 1.0 usually reflects a normal value, where as a gain <0.8 is considered abnormal. A gain cutoff of ∼0.7 optimally distinguishes between peripheral and central pathology in patients with the acute vestibular syndrome [17]. Therefore, we classified HIT exams from patients with vestibular neuritis or vestibular strokes into groups with lower (<0.7) or higher gain values (>0.7), since artifacts might have a differential impact on low versus high gain values.
vHITs performed on a diseased ear in patients with clinically-diagnosed vestibular neuritis (i.e., peripheral cases) showed lower gains (i.e., abnormal) on the affected side. The contralateral, clinically-unaffected side showed higher gains within the normal range (though generally below 1.0, presumably because of loss of the contribution from the opposing, affected canal). By contrast, vHITs derived from patients with PICA strokes (i.e., central cases) had higher gains (>0.7, and generally within the normal range) in both ears. PICA stroke was diagnosed based on history, clinical features and diffusion weighted imaging [16]. AICA strokes were excluded because patients might have normal or abnormal HITs with variable VOR gains.
Data from 23 patients, 46 total ears, and 1070 HITs were available for analysis. We classified both clean data (without artifacts, Fig. 1A–C)) and artifactual data (Fig. 1D–F) based on selection criteria reported in a previous publication [16]. Clean records were available for 22 patients, 42 ears, and 539 HITs. We distinguished 6 types of artifacts according to a previously published classification [16]: 1) covert saccades, 2) blinks, 3) trace oscillations, 4) phase shift 5) several peaks, 6) high gain and 7) all artifacts combined (all artifacts pulled together). Traces with infrequent, non-disruptive artifacts (occurring after the head movement) or overt saccades were excluded from the analysis of artifactual data.
2.3vHIT gain calculation methods
Table 1
Mean VOR gain by calculation method, stratified by higher vs. lower gain HITs and pairwise comparisons by calculation method. Results reflect only “clean” traces, after all artifacts have been removed
| Clean Mean VOR Gain (95% CI) | ||
| Calculation method | Higher gain (n = 434 | Lower gain (n = 105 |
| HITs in 27 ears in 21 patients) | HITs in 15 ears in 15 patients) | |
| Velocity gain 40 | 0.89 (0.81 to 0.98) | 0.63 (0.53 to 0.73) |
| Velocity gain 60 | 0.90 (0.82 to 0.99) | 0.51 (0.41 to 0.61) |
| Regression gain | 0.97 (0.88 to 1.05) | 0.45 (0.35 to 0.55) |
| Position gain | 0.93 (0.85 to 1.02) | 0.53 (0.43 to 0.63) |
| Pairwise comparisons | ||
| Regression gain vs. position gain | 0.010 | <0.001 |
| Velocity gain 40 vs. regression gain | <0.001 | <0.001 |
| Velocity gain 40 vs. position gain | <0.001 | <0.001 |
| Velocity gain 40 vs. velocity gain 60 | 0.72 | <0.001 |
| Velocity gain 60 vs. regression gain | <0.001 | 0.016 |
| Velocity gain 60 vs. position gain | 0.007 | 0.78 |
Raw vHIT data were extracted from the vHIT device. We applied four different gain calculation methods on the same data using a customized Matlab script (Matlab R2014b, Mathworks, Natick, Mass., USA): (#1a) the ratio between eye and head velocity at 40 ms (Fig. 1A); (#1b) the ratio between eye and head velocity at 60 ms after onset of head movement (Fig. 1A); (#2) the ratio of velocity slopes using regression around peak acceleration (±15 ms) (Fig. 1B) and (#3) the ratio of area under the curves after de-saccading the whole slow phase VOR trace (Fig. 1C).
Calculations #1a, #1b reflect a ratio between velocities at given time points; calculation #2 compares regression slopes between eye- and head velocity around peak head acceleration [3]; and calculation #3 analyzes eye- and head positions before and after the head movement [14]. For calculation #1, the latency of 40 or 60 ms after head movement onset (head velocity exceeding 20deg/s) was used. Calculation #2 is currently not used by commercial devices. For calculation #3 we used the built-in calculation algorithm from Otometrics (Otosuite® software, v1.2.18) since they use a proprietary method for de-saccading traces and for determining the area under the curve. For simplicity, we call these gain calculation methods here ‘velocity gain’ (specifying either 40 ms [#1a] or 60 ms [#1b]); ‘regression gain’ (#2); and ‘position gain’ (#3) (Fig. 1).
2.4Statistical analysis
Fig.2
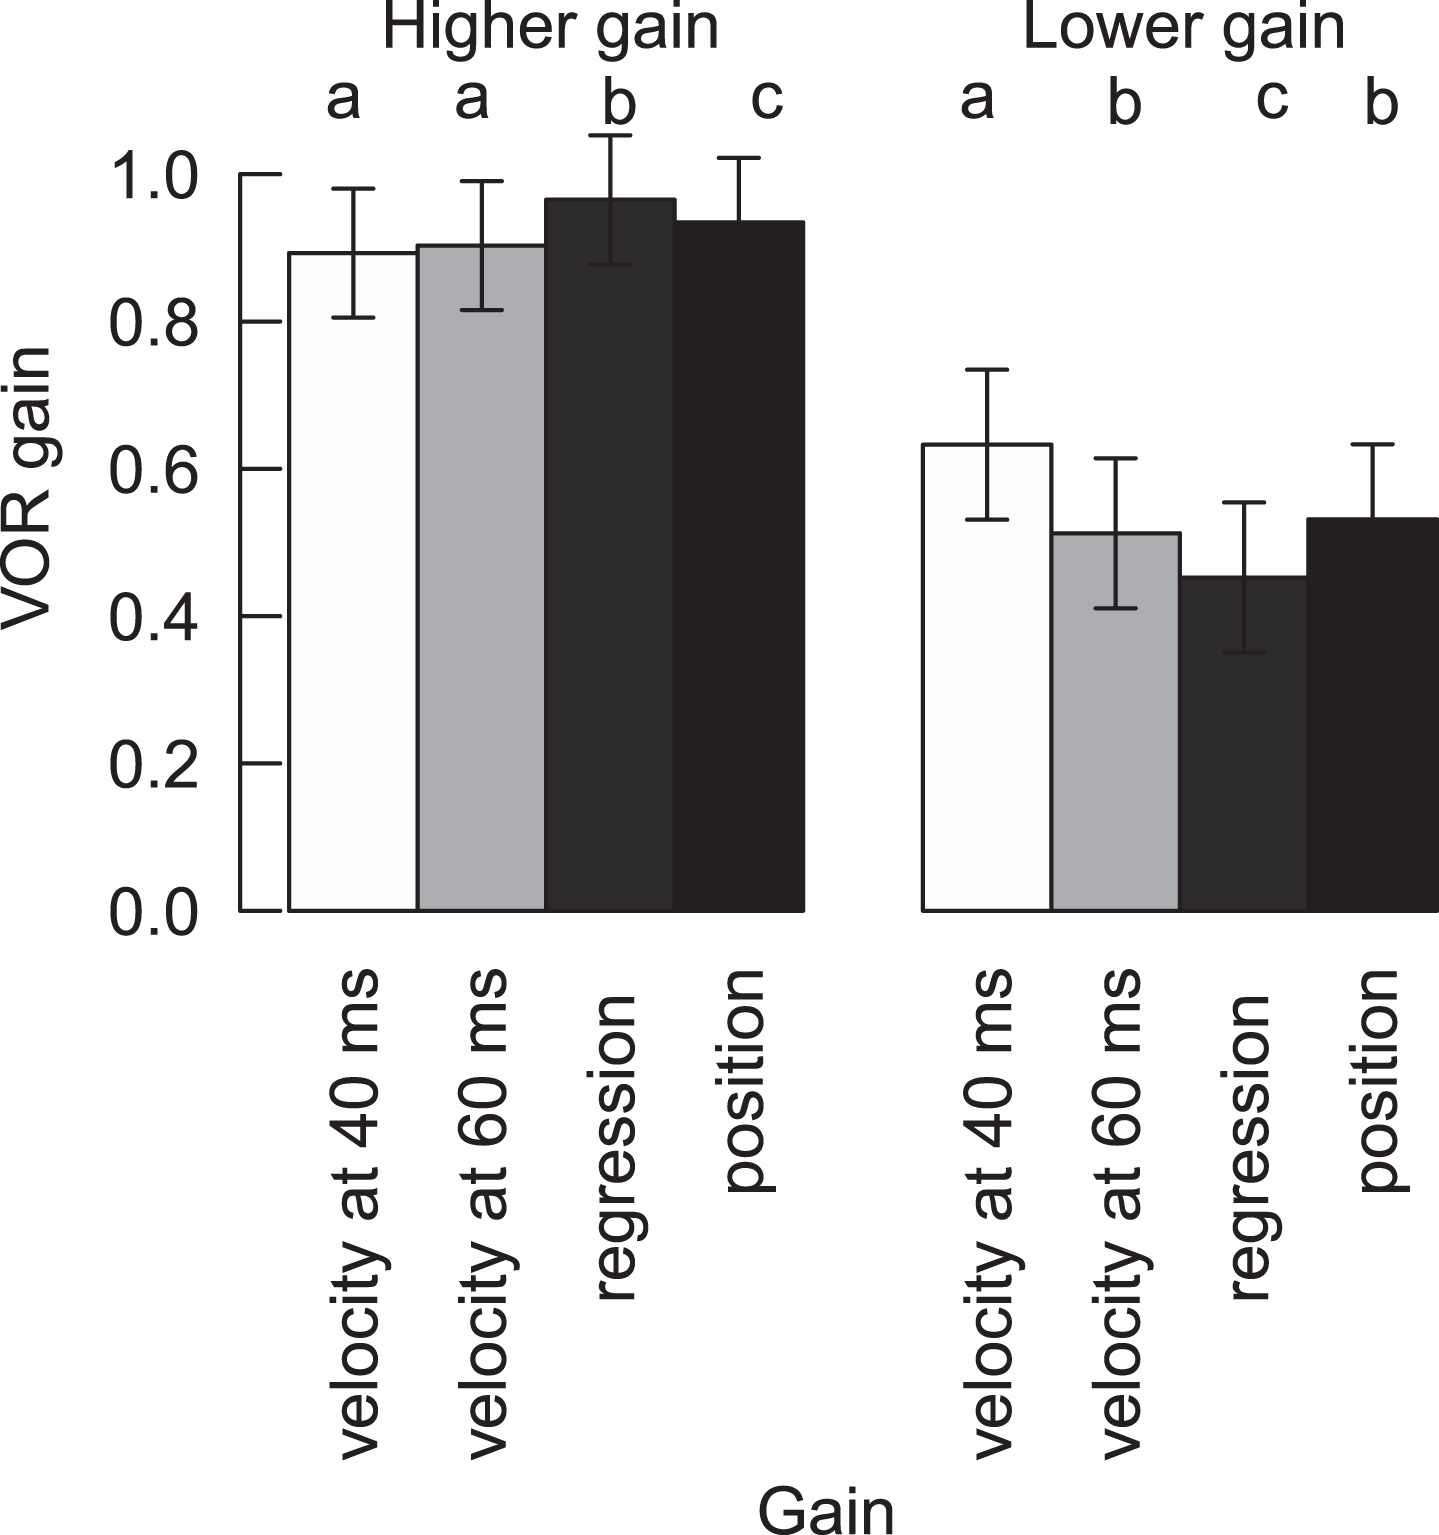
VOR gain of HITs with higher gain and lower (abnormal) gain for clean recordings for all four methods. Different letters represent significant differences among the methods inside the normal or abnormal HITs (For variables with the same letter, the difference between these variables is not statistically significant. Likewise, for variables with a different letter, the difference is statistically significant). Means and confidence intervals are model based, due to the nested data.
We recorded 539 HITs from 42 ears from 26 patients. HITs were thus nested within ears (there are several HITs per ear), and ears were nested within patients (data from two ears per patient). The effective sample size were the 26 patients. Due to the nested data, all analyses were fitted with mixed effects models. First, only clean recordings (i.e. without artifacts) were analyzed. VOR gain was fit using calculation method, HIT classification (low/high gain), and the interaction between calculation method and HIT classification as fixed effects, with random intercepts for test nested in ear nested in patient. Position gain was correlated with velocity gain at 60 ms for clean records only, with random intercepts for ear nested in patient. Finally, gain was fit using calculation method, pathology, and artifact, with all possible interactions among the three as fixed effects, and random intercepts for test nested in ear nested in patient. Each artifact was included in a separate model. Multiple comparisons were performed first between the methods for HITs with artifacts, and second between clean and artifact-laden HITs. Multiple comparisons were performed for each artifact and HIT category (low gain/high gain) separately. All analyses were performed in R [22], with the packages nlme [21] for mixed effects models, and emmeans [13] for multiple comparisons.
Table 2
Linear mixed effects model of VOR gain in dependence of calculation method, HIT “normality”1, and the interaction between method and HIT classification as fixed effect, and random intercepts for test nested in ear nested in patient. Model was fit on “clean” traces only, after all artifacts have been removed
| Model term | DFnum2 | DFden3 | F | p value |
| Method | 3 | 1605 | 10.8 | <0.001 |
| HIT classification | 1 | 19 | 93.7 | <0.001 |
| Method:HIT classification | 3 | 1605 | 42.6 | <0.001 |
| Random effects | ||||
| Group | N | StdDev | ||
| Patient | 22 | 0.16 | ||
| Ear | 42 | 0.10 | ||
| Test | 539 | 0.07 |
1High vs. low-gain HIT (threshold cutoff value 0.7). 2Degrees of freedom in numerator or 3denominator.
3Results
3.1VOR gain calculations after excluding artifacts (Clean HITs Only)
Fig.3
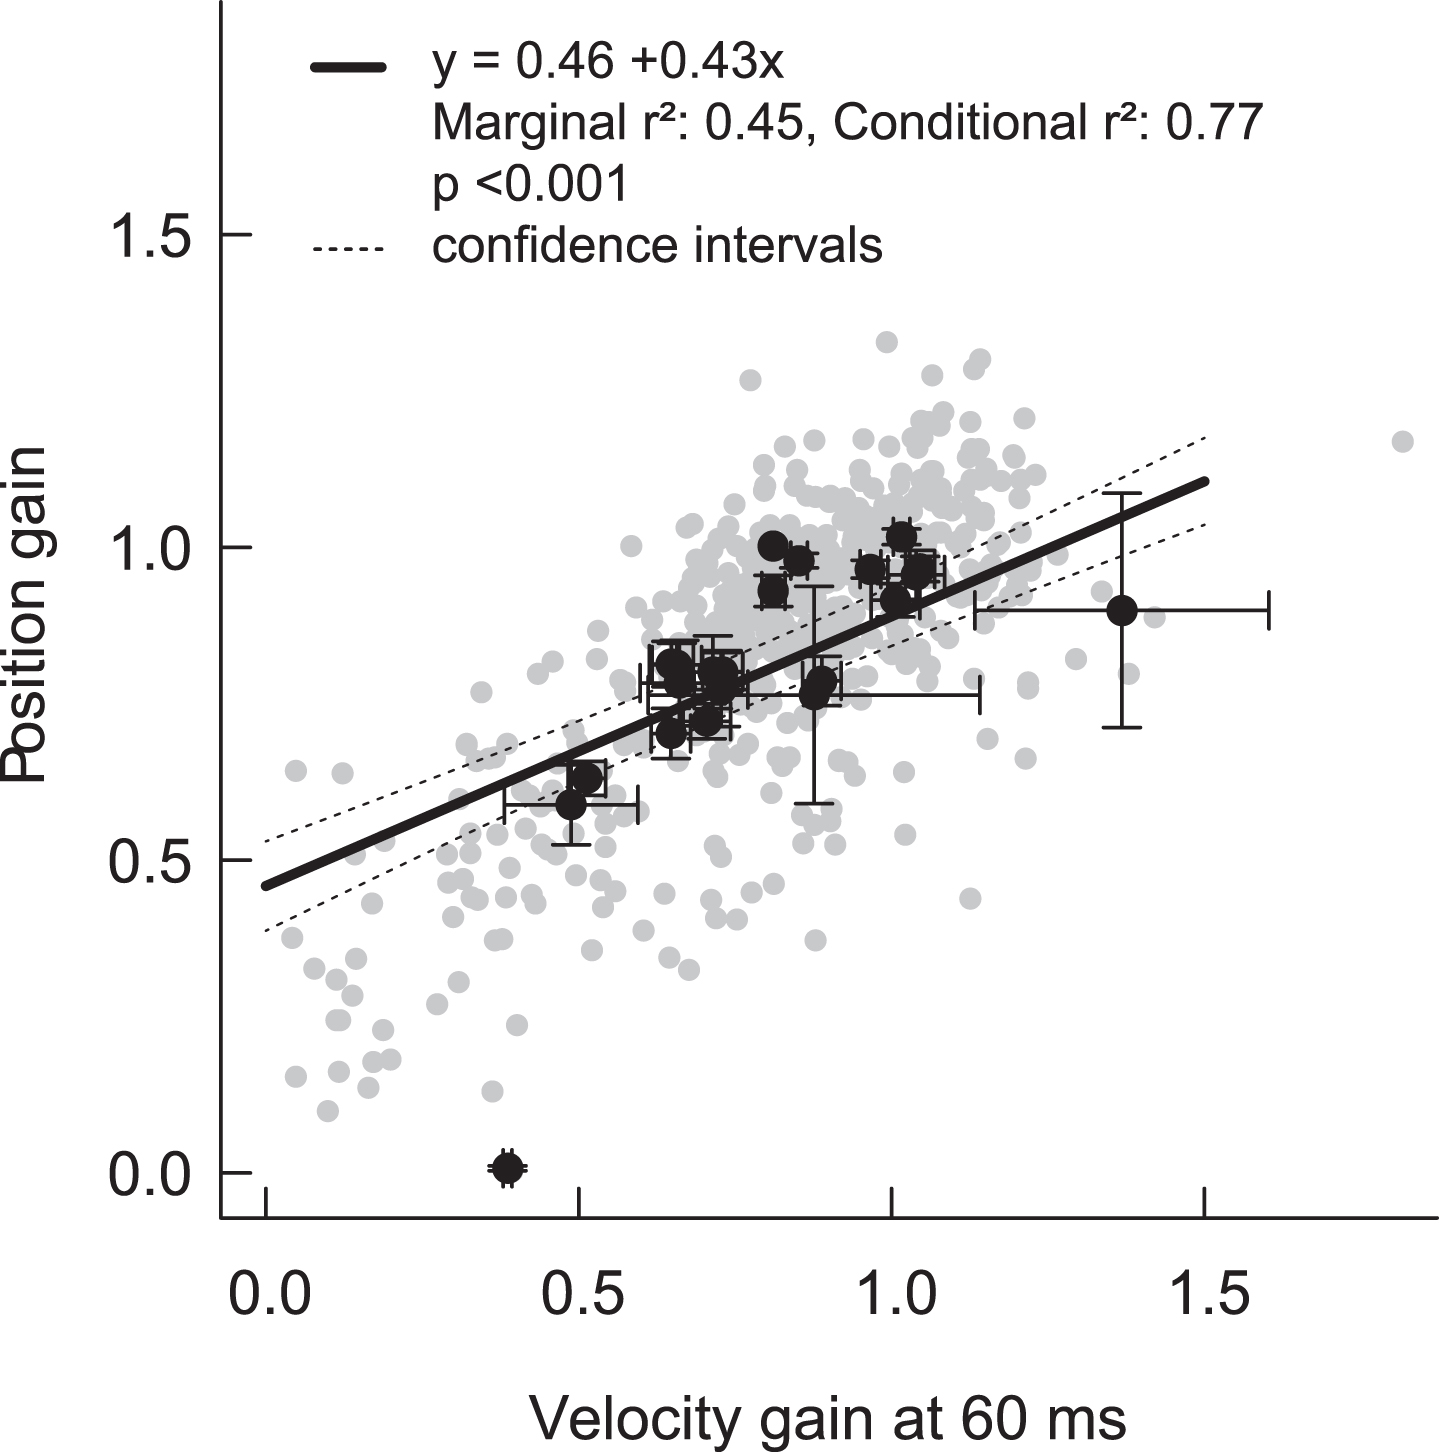
Correlation between position gain and velocity gain at 60 ms. Grey dots represent the individual HITs, and black dots are mean (±standard error) values per patient. The regression line is derived from the mixed effects model (+/–95% confidence intervals), and takes into account the nested structure of HITs within ears within patients. Note that the regression line shows an offset with an intercept of 0.46. Imperfect calculation algorithms including imperfect de-saccading, removal of negative gain values by the device or data lowpass filtering might lead to a skewed regression line.
Mean VOR gains for clean/filtered higher-gain HITs were all within normal limits, regardless of calculation method, but there were small, statistically significant differences across most calculation methods (range 0.89 to 0.97) (Table 1, Fig. 2). Importantly, these differences were not clinically significant with respect to classifying VOR gain “normality” (i.e., mean results for a given ear, regardless of calculation method, did not cross either the 0.8 [normal vs. abnormal] or 0.7 [central vs. peripheral] thresholds described in the Methods section) (Fig. 2). Similarly, HITs with higher gains were significantly different from abnormal HITs with lower gains, regardless of the calculation method (Table 1).
Mean VOR gains for clean/filtered lower-gain (abnormal) HITs were all below normal limits, and they also showed statistically significant differences across most calculation methods (range 0.45 to 0.63, Table 1, Fig. 2). In addition, there was a strong positive relationship between ‘velocity gain at 60 ms’ and ‘position gain’ for clean HITs (both high and low gain HITs) (conditional r2 = 0.77, p > 0.001) (Fig. 3). Table 2 shows the impact of (a) calculation method, (b) “normality” of HITs (high vs. low VOR gain), and (c) the interaction between calculation method and “normality” on mean VOR gain— in a multi-variate regression using a linear, mixed-effects model, all three effects were significant.
3.2Interaction between VOR gain calculations and artifacts (Unclean HITs Only)
Table 3
Interaction between gain calculation method and artifact type, stratified by high vs. low gain HITs. Shown are differences in mean gain results between unclean (with artifacts) and clean (without artifacts) HITs
| Saccades1 | Blinks | Trace oscillations | Phase shift | >2 peaks | High Gain | All artifacts combined | |
| High gain HITs | |||||||
| Velocity gain 40 | 0.03 | –0.29*** | –0.08* | –0.13 | –0.03 | 0.43*** | –0.06* |
| Velocity gain 60 | 0.06 | –0.50*** | –0.08* | 0.03 | –0.11*** | 0.55*** | –0.08*** |
| Regression gain | 0.05 | –0.51*** | –0.06 | 0.19** | –0.08** | 0.50*** | –0.07** |
| Position gain | 0.09 | –0.32*** | –0.12*** | 0.02 | –0.06* | 0.21*** | –0.11*** |
| Low gain HITs | |||||||
| Velocity gain 40 | –0.04 | –0.26** | –0.01 | –0.19** | 0.12*** | –0.18 | –0.03 |
| Velocity gain 60 | 0.02 | 0.15 | –0.09* | –0.09 | 0.00 | 0.09 | –0.03 |
| Regression gain | 0.02 | –0.05 | –0.10* | 0.06 | –0.06 | 0.85*** | –0.07 |
| Position gain | –0.06 | –0.07 | –0.07 | 0.09 | 0.08* | 0.11 | 0.01 |
Significance levels: ’***’<0.001; ’**’<0.01; ’*’<0.05. 1covert saccades.
Fig.4
VOR gain for clean (white bars) and artifactual (grey bars) higher gain and lower gainHITs for different artifacts and the four methods. Different letters represent significant differences among the methods for gains with artifacts (see legend Fig. 2). Stars denote significant differences between HITs with and without artifacts within a method: *p < 0.05, **p < 0.01, ***p < 0.001. Means and confidence intervals are model-based due to the nested data.
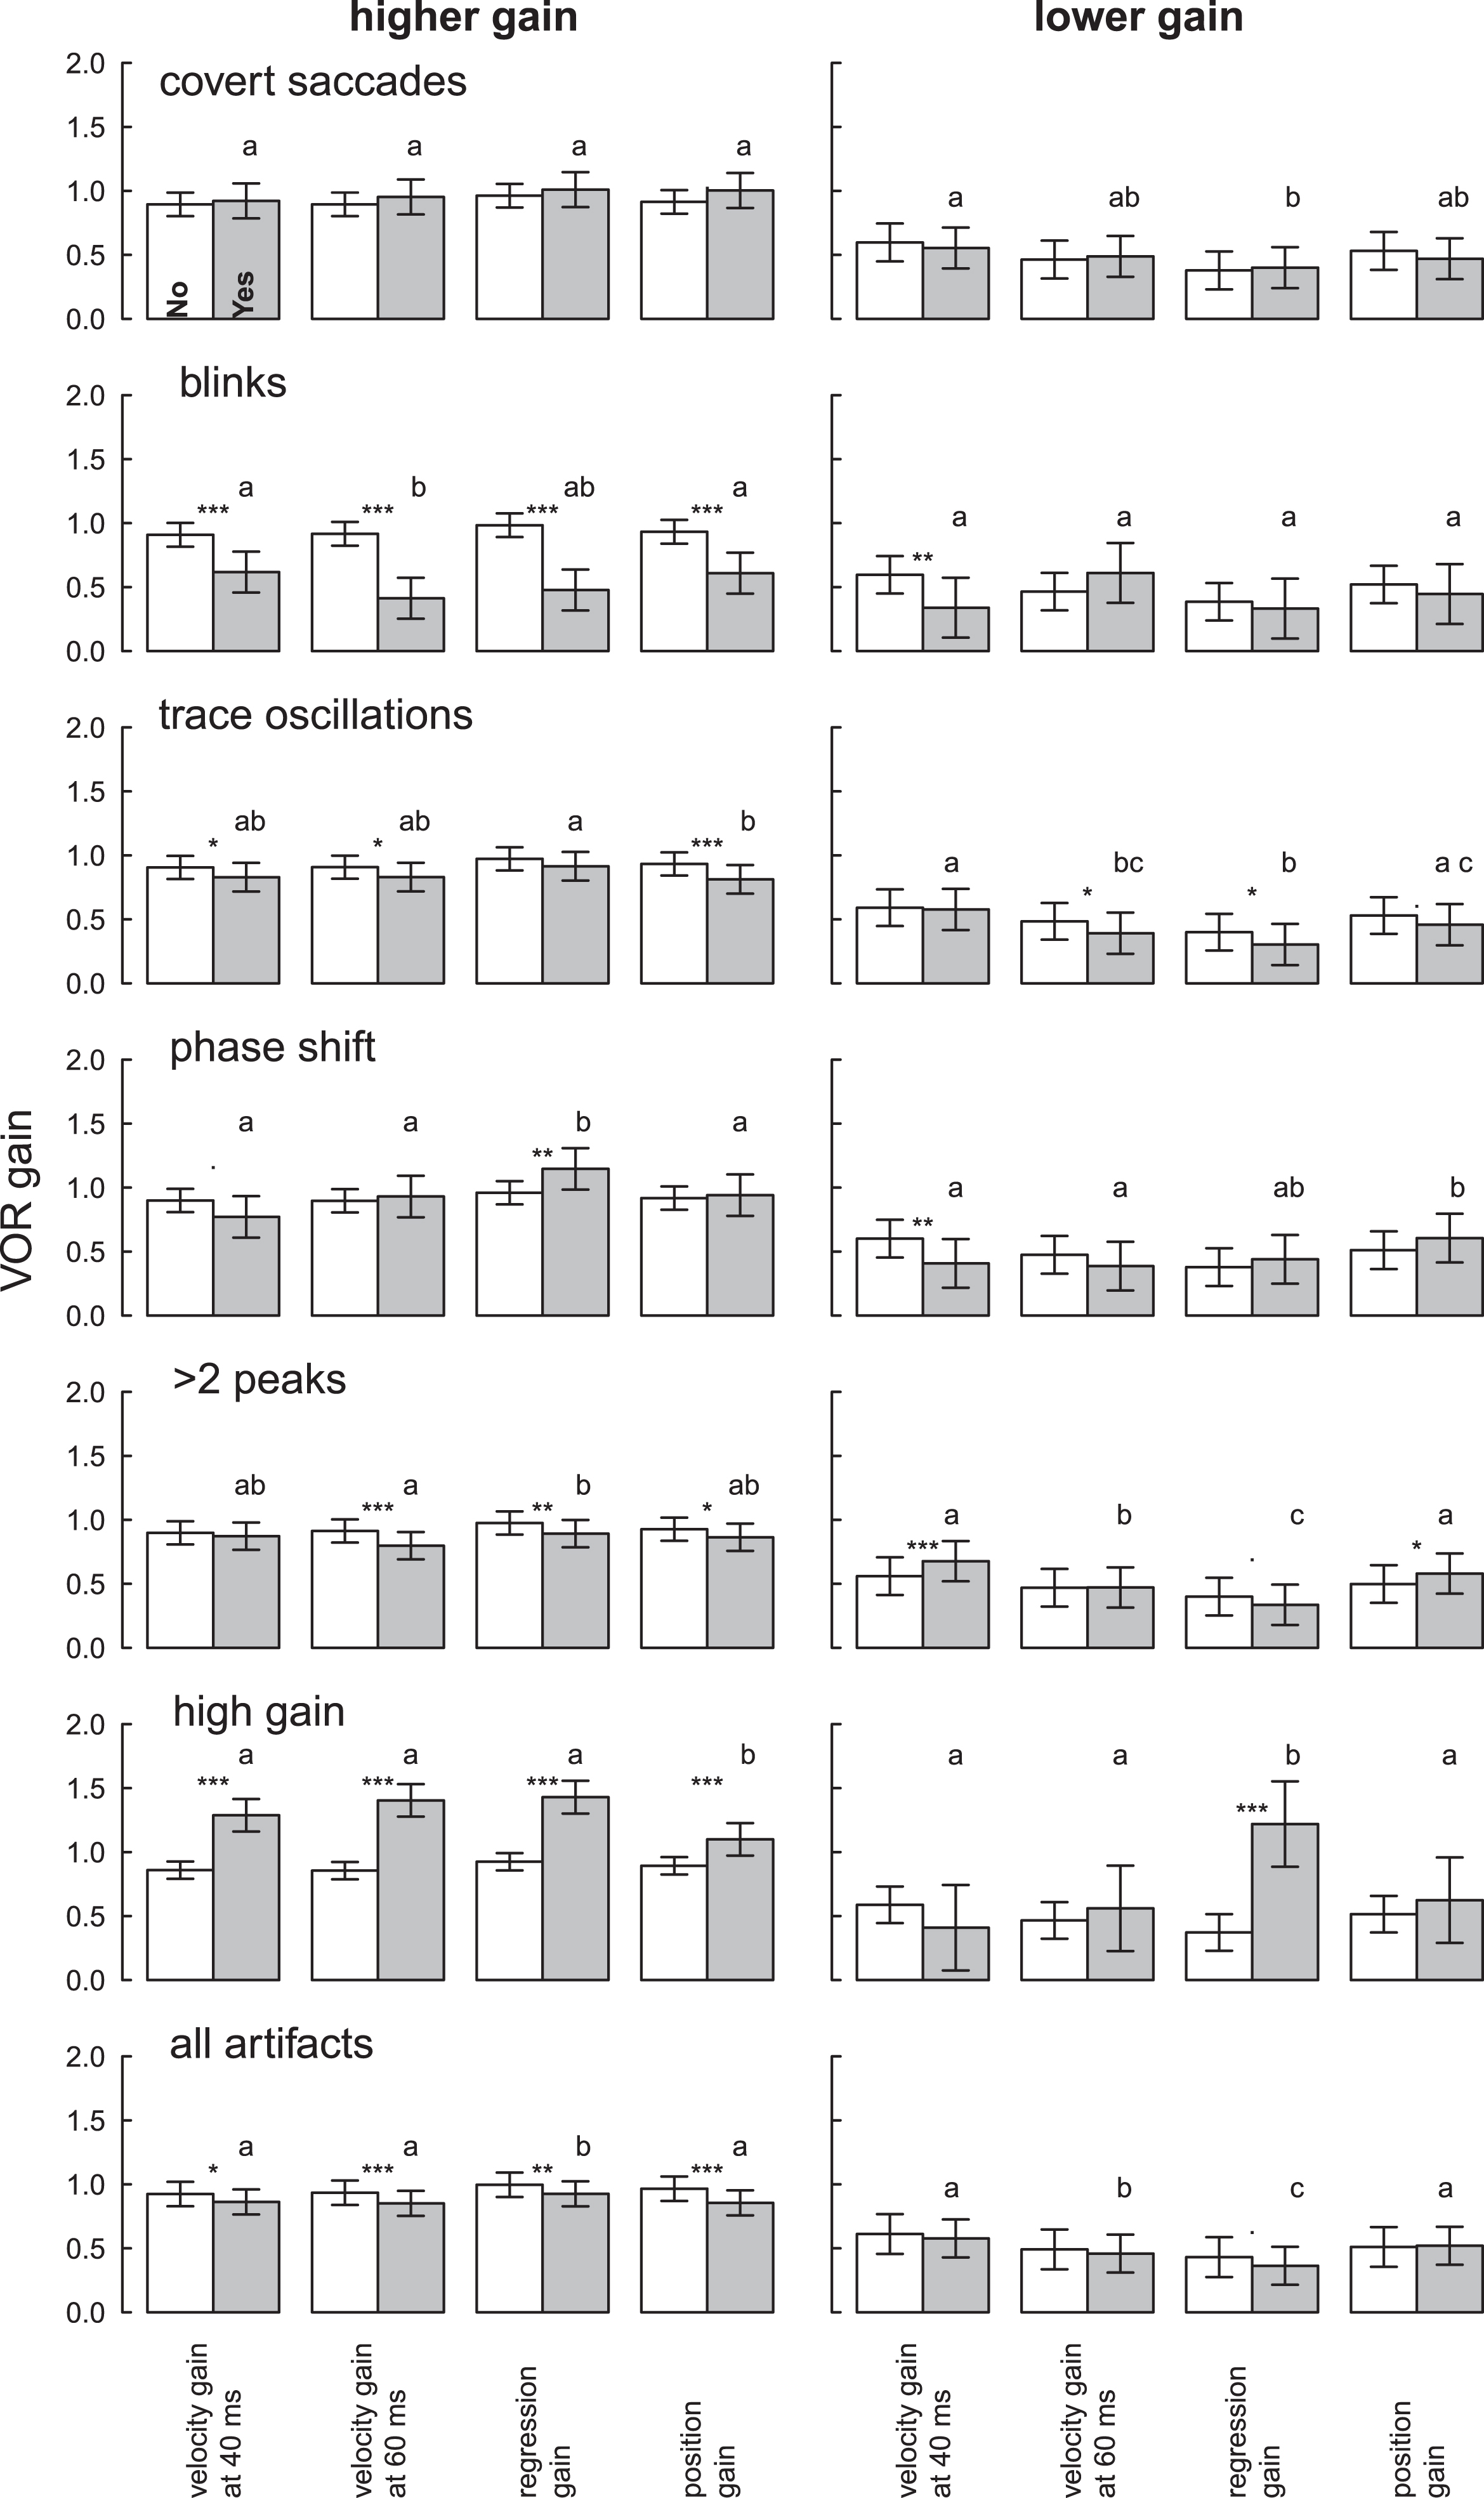
Figure 1D–F shows one example with trace oscillation artifacts (pupil tracking loss) resulting in variable VOR gain values for each calculation method. Gain measures for unclean HITs were more likely to vary by calculation method when gain was high, in the normal range, rather than low, in the abnormal range (Table 3, Fig. 4). HITs with higher gains and artifacts were statistically significantly lower than HITs without artifacts (–0.06 to –0.11, Table 3), but values still remained within normal limits (Fig. 4, Table S1). Abnormal HIT mean gains with artifacts were also generally lower than HITs without artifacts (–0.07 to +0.01, Table 3) but not statistically significantly so when averaged across artifact types (Table 3, “all artifacts” column).
3.3Impact of specific artifacts
The influence of each artifact type on mean VOR gain is shown in Tables 3, 4, and 5 and mean VOR gains with confidence intervals are shown in Fig. 4.
Covert saccades were present in some HITs. The presence of such saccades presumably reflected incomplete de-saccading by the vHIT software, but they did not affect VOR gains meaningfully for either high or low VOR gains in any calculation method (Table 3).
Blinks caused intrusive trace oscillations and a clinically and statistically significant mean gain reduction across all calculation methods in HITs with higher gain (range –0.51 to –0.29) (Table 3). Mean normal (higher) VOR gains when blinks were present fell into the abnormal (lower) range (mean gain range 0.41 to 0.62) (Table S1). Abnormal HIT gains were not significantly affected by eye blinks except when the velocity gain at 40 ms calculation was used (Table 3).
Trace oscillations (pupil tracking loss) showed small gain reductions in higher-gain HITs (range –0.06 to –0.12) that were statistically significant for three calculation methods (Table 3), but calculated gains still remained within normal limits (range 0.81 to 0.91, Table S1). Trace oscillations reduced VOR gains by small amounts for lower-gain (abnormal) HITs as well (range –0.01 to –0.10), statistically significant for two of the four calculation methods (Table 3). Again, all gains from lower-gain HITs remained in the abnormal range (Table S2).
Phase shift between head and eye velocity traces showed a strong interaction between artifact and calculation method (Table 3). For HITs with higher gains, there were variable differences (range –0.13 to +0.19) with regression gain showing a statistically significant increase. For lower-gain (abnormal) HITs, there were variable differences (range –0.19 to +0.09) with velocity gain showing a statistically significant decrease. There was, however, no impact on the classification of gain as normal vs. abnormal or central vs. peripheral for any calculation method for either cutoff (0.7 or 0.8).
More than two peaks in the VOR slow phase (no bell-shaped curve, often an iatrogenic artifact) caused high-gain HITs to be lower (range –0.03 to –0.11), statistically significant in three of four calculation methods. However, none of these reductions put results into the abnormal range (Table S1). By contrast, lower-gain (abnormal) HITs were statistically-significantly higher for two calculation methods (position +0.08 and velocity +0.12) (Table 3), and these pushed abnormal gains towards the normal range (Table S2).
High gains (likely due to goggle slippage or false calibration) caused a clinically-meaningful and statistically significant increase in higher-gain (normal) HITs (range +0.21 to +0.55). Resulting mean gains were above normal (range 1.1 to 1.43) (Table S1). High gain artifacts in abnormal HITs still showed abnormal values in the “peripheral” cause range (gain < 0.7) except when using the regression gain calculation which was highly susceptible to this artifact (unclean mean gain 1.22 vs. clean mean gain 0.37, p = 0.001).
4Discussion
The application of different VOR gain calculation methods for the same clean HITs (i.e., with artifacts removed) resulted in small but significant mean gain differences; nevertheless, gains remained within the expected normal or abnormal range. The most well studied VOR gain calculation methods (i.e., ‘velocity gain at 60 ms’ and ‘position gain’) showed similar mean VOR gain values and a strong, statistically-significant correlation in clean vHIT recordings.
Artifacts affected high gains more than low gains, independent of the calculation method. When averaged across artifact types, artifacts reduced higher-gain (normal) HITs by a small but statistically-significant margin (range –0.11 to –0.06) that did not push mean gains below the normal range. There was, however, clinically-meaningful heterogeneity in impact by artifact type (large gain reductions by suspected blink artifacts and large gain increases by suspected goggles slippage), and some interaction between artifact type and calculation method. By contrast, the overall impact of artifacts on abnormal, lower-gain HITs was smaller (range –0.07 to +0.01) and not statistically significant. There was still some interaction between artifact type and calculation method. However, in neither case was there a clinically meaningful interaction between the impact of all artifacts combined and calculation method.
Overall, these results suggest that the impact of calculation method on VOR gain measures is small and probably not clinically impactful, especially relative to the impact of artifacts. The interaction between calculation method and artifact type is inconsistent, with some calculation methods susceptible to specific artifact types and robust to other artifact types.
Scleral search coils have been used for gold standard VOR measurements using instantaneous gain calculations as a continuous function of time [3, 6, 12]. This analytic approach allows a more complete representation of VOR gain during the entire time span of a head impulse compared to data read at a given time point. In some studies, the highest gain value calculated around peak head velocity was used to represent maximal VOR gain changes after ototoxic intratympanic injections [20]. Even in search coil studies, depending on the chosen gain calculation time point, the result might under- or overestimate ‘true’ VOR gain. In general, non-vestibular reflexes have longer latencies [10]. The calculation of gain at an early time point after HIT onset (e.g. 40 ms or 60 ms) or early time period (0–100 ms, increasing head velocity before peak head velocity) has the advantage of preventing inputs of non-vestibular origin such as optokinetic, smooth pursuit, cervico-ocular reflexes etc. [7]. Some authors choose even a shorter observation period or earlier calculation time points to minimize the influence of catch-up saccades on gain calculation [1, 27].
On the other hand, the reflection of gain only at a given time point [8] is said to be more prone to specific artifacts such as blinks, phase shifts or trace oscillations due to random recording noise or disturbances. Our study differed from prior literature with blink artifacts artifactually reducing higher HIT gains substantially across all calculation methods and producing dissimilar impacts for the two different instantaneous velocity gain calculation methods (40 ms vs. 60 ms).
Regression gain [6, 12] includes a larger time span (during increasing head velocity) and thus contains more information about the velocity profile. This method, however, might be more prone to artifacts due to a longer observation time from HIT start until peak head velocity and due to the chosen time interval. In our study, we found an interaction between this calculation method and the phase shift artifact for higher gain HITs; however, this effect was small and insignificant for abnormal HITs and it is also due to the selected time interval further away from head movement onset.
Although potentially susceptible to influence by delayed, non-vestibular inputs to eye movements, the calculation method of de-saccaded position gain [14] might correct for artifacts such as oscillations or phase shifts between eye and head velocity traces (goggle slippage). One would expect that calculating the ‘area under the curve’ would compensate for any trace oscillations or phase shifts, however, we did not find this calculation method to be more robust to such artifacts. The approach of de-saccading traces might be more susceptible to intrusive covert saccades since the de-saccading algorithms might not identify all kind of fast phases during a HIT, but we found no statistically-significant effects for any calculation method.
Techniques of gain calculation and software-based correction of artifacts continue to advance. One approach to improve the accuracy of position gain calculation was proposed by Shen et al. [24] introducing the SHIMPS paradigm: Disruptive covert saccades were either absent or small and the direction of compensatory eye movements were opposite to the deficient slow phase VOR and therefore less interfering with de-saccading algorithms. Cleworth et al. [5] compared different analyzing techniques favoring two calculation techniques such as area under the curve during increasing head velocity or gain over 50–70 ms (around peak head acceleration or peak head velocity) post onset in order to decrease variances and inaccuracy. Software solutions might correct for specific artifacts such as goggle slippage [12] and, thus, achieve a more reliable VOR gain value. In addition, software algorithms have the ability to analyze data during data collection and discard invalid impulses which are not meeting predefined quality standards. Such solutions, paired with repeated measures, could theoretically improve both the accuracy and reliability of vHIT gain estimates.
On average, under real-world conditions, artifacts bias vHIT-based higher VOR gains downward slightly but do not impact diagnostic classification as normal vs. abnormal. Although different gain calculation methods can be differentially impacted by specific artifacts, on average, the impact of calculation method is small compared to the impact of artifacts themselves. Overall, gain impacts of the calculation method tend to average out over multiple artifact types, creating a picture of imprecision due to random variation, rather than systematic bias. We recommend repeated measures of >10–20 HITs per ear, which tends to neutralize artifact effects, likely resulting in more accurate mean gains. Although we found no apparently measurement superiority of a given calculation method, efforts should be taken to standardize measurements for research and clinical care. Groups such as the B
4.1Limitations
Our study involved many head impulses, but from only 26 subjects with a specific clinical presentation (acute vestibular syndrome), so results may not generalize to other patient populations. Although we assessed the most commonly used calculation methods (including those employed by US FDA-approved, production-line vHIT systems currently being sold in the US and Europe), other methods were not tested in our study (e.g., point by point gain average over different time windows using whole or partial velocity profile, ascending or descending window, ±12 ms around peak head velocity).
Although there was a strong correlation between velocity and position gain, with found a skewed regression line (Fig. 3): At lower gains, calculated position gain was rather too high or – vice versa – velocity gain could have been too low. At higher gains velocity gain was higher than position gain. This phenomenon might be due to imperfect gain calculations including imperfect de-saccading algorithms, removal of negative gain values by the device or data low pass filtering. We had, however, no gold standard (scleral search coil) measures to determine the “true” gain for any of our traces.We used raw data from only a single brand of vHIT device in order to obtain uniform data, potentially limiting the generalizability of our results; however, lateral vHIT gains computed with the same technique appear to be similar across vHIT systems [5]. Finally, the data were limited to the lateral impulses only. HITs in the RALP or LARP plane seem to be more prone to artifacts and these artifacts might be more difficult to classify.
5Conclusions
Our results showed no clear superiority of a particular gain calculation method for vHIT testing, with the results being most similar in the middle range (0.5–0.8) in which most VOR gain values fall. When averaged across multiple trials and patients, artifacts do influence gain by causing small but significant reductions in HITs with normal-range gains, whereas those with lower (i.e., abnormal) HIT gains remain unchanged. Artifacts increase measurement noise, but different types of artifacts influence calculation methods differently, but they still tend to average out. This suggests a larger number of HITs should be performed to confirm vHIT results, regardless of calculation method. Practically, we recommend an international consensus for vHIT gain measurement and reporting.
Potential conflicts of interest
None
Acknowledgments
This study was supported by the Swiss National Science Foundation PBBEP2 1365-73 and #320030_173081 (GM) and the Inselspital Bern (Insel-grant, #2602). Dr. David E. Newman-Toker’s effort was partially supported by a grant from the National Institutes of Health, National Institute of Deafness and Communication Disorders (U01DC013778). GN Otometrics and Interacoustics loaned VOG equipment for research.
SUPPLEMENTARY MATERIAL
[1] Supplementary material can be found here: https://dx.doi.org/10.3233/VES-200708
References
[1] | Agrawal Y. , Schubert M.C. , Migliaccio A.A. , Zee D.S. , Schneider E. , Lehnen N. , Carey J.P. , Evaluation of quantitative head impulse testing using search coils versus video-oculography in older individuals, Otol Neurotol 35: ((2014) ), 283–288. |
[2] | Aw S.T. , Halmagyi G.M. , Haslwanter T. , Curthoys I.S. , Yavor R.A. , Todd M.J. , Three-dimensional vector analysis of the human vestibuloocular reflex in response to high-acceleration head rotations. II. responses in subjects with unilateral vestibular loss and selective semicircular canal occlusion, J Neurophysiol 76: ((1996) ), 4021–4030. |
[3] | Aw S.T. , Haslwanter T. , Halmagyi G.M. , Curthoys I.S. , Yavor R.A. , Todd M.J. , Three-dimensional vector analysis of the human vestibuloocular reflex in response to high-acceleration head rotations. I. Responses in normal subjects, J Neurophysiol 76: ((1996) ), 4009–4020. |
[4] | Carey J.P. , Minor L.B. , Peng G.C. , la C.C. , Santina, P.D. Cremer and T. Haslwanter, Changes in the three-dimensional angular vestibulo-ocular reflex following intratympanic gentamicin for Meniere’s disease, J Assoc Res Otolaryngol 3: ((2002) ), 430–443. |
[5] | Cleworth T.W. , Carpenter M.G. , Honegger F. , Allum J.H.J. , Differences in head impulse test results due to analysis techniques, J Vestib Res 27: ((2017) ), 163–172. |
[6] | Collewijn H. , Smeets J.B. , Early components of the human vestibulo-ocular response to head rotation: latency and gain, J Neurophysiol 84: ((2000) ), 376–389. |
[7] | Crane B.T. , Demer J.L. , Human horizontal vestibulo-ocular reflex initiation: effects of acceleration, target distance, and unilateral deafferentation, J Neurophysiol 80: ((1998) ), 1151–1166. |
[8] | Glasauer S. , von Lindeiner H. , Siebold C. and Buttner U. , Vertical vestibular responses to head impulses are symmetric in downbeat nystagmus, Neurology 63: ((2004) ), 621–625. |
[9] | Halmagyi G.M. , Curthoys I.S. , A clinical sign of canal paresis, Arch Neurol 45: ((1988) ), 737–739. |
[10] | Halmagyi G.M. , Curthoys I.S. , Cremer P.D. , Henderson C.J. , Todd M.J. , Staples M.J. , D’Cruz D.M. , The human horizontal vestibulo-ocular reflex in response to high-acceleration stimulation before and after unilateral vestibular neurectomy, Exp Brain Res 81: ((1990) ), 479–490. |
[11] | Jorns-Haderli M. , Straumann D. , Palla A. , Accuracy of the bedside head impulse test in detecting vestibular hypofunction, J Neurol Neurosurg Psychiatry 78: ((2007) ), 1113–1118. |
[12] | Lehnen N. , Aw S.T. , Todd M.J. , Halmagyi G.M. , Head impulse test reveals residual semicircular canal function after vestibular neurectomy, Neurology 62: ((2004) ), 2294–2296. |
[13] | Lenth R. , Singmann H. , Love J. , Buerkner J. , Herve M. , emmeans: Estimated Marginal Means, aka Least-Squares Means, (2018) . |
[14] | MacDougall H.G. , McGarvie L.A. , Halmagyi G.M. , Curthoys I.S. , Weber K.P. , Application of the video head impulse test to detect vertical semicircular canal dysfunction, Otol Neurotol 34: ((2013) ), 974–979. |
[15] | MacDougall H.G. , Weber K.P. , McGarvie L.A. , Halmagyi G.M. , Curthoys I.S. , The video head impulse test: diagnostic accuracy in peripheral vestibulopathy, Neurology 73: ((2009) ), 1134–1141. |
[16] | Mantokoudis G. , Saber Tehrani A.S. , Kattah J.C. , Eibenberger K. , Guede C.I. , Zee D.S. and Newman-Toker D.E. , Quantifying the vestibulo-ocular reflex with video-oculography: nature and frequency of artifacts, Audiol Neurootol 20: ((2015) ), 39–50. |
[17] | Mantokoudis G. , Tehrani A.S. , Wozniak A. , Eibenberger K. , Kattah J.C. , Guede C.I. , Zee D.S. , Newman-Toker D.E. , VOR gain by head impulse video-oculography differentiates acute vestibular neuritis from stroke, Otol Neurotol 36: ((2015) ), 457–465. |
[18] | McGarvie L.A. , MacDougall H.G. , Halmagyi G.M. , Burgess A.M. , Weber K.P. , Curthoys I.S. , The Video Head Impulse Test (vHIT) of Semicircular Canal Function – Age-Dependent Normative Values of VOR Gain in Healthy Subjects, Front Neurol 6: ((2015) ), 154. |
[19] | Newman-Toker D.E. , Saber Tehrani A.S. , Mantokoudis G. , Pula J.H. , Guede C.I. , Kerber K.A. , Blitz A. , Ying S.H. , Hsieh Y.H. , Rothman R.E. , Hanley D.F. , Zee D.S. and Kattah J.C. , Quantitative video-oculography to help diagnose stroke in acute vertigo and dizziness: toward an ECG for the eyes, Stroke 44: ((2013) ), 1158–1161. |
[20] | Nguyen K.D. , Minor L.B. , Della Santina C.C. and Carey J.P. , Vestibular function and vertigo control after intratympanic gentamicin for Meniere’s disease, Audiol Neurootol 14: ((2009) ), 361–372. |
[21] | Pinheiro J. , Bates D. , DebRoy S. , Sarkar D. and R Core Team, nlme: Linear and Nonlinear Mixed Effects Models, (2018) . |
[22] | R Core Team, A language and environment for statistical computing, R Foundation for Statistical Computing, Vienna, (2018) . |
[23] | Robinson D.A. , A Method of Measuring Eye Movement Using a Scleral Search Coil in a Magnetic Field, IEEE Trans Biomed Eng 10: ((1963) ), 137–145. |
[24] | Shen Q. , Magnani C. , Sterkers O. , Lamas G. , Vidal P.P. , Sadoun J. , Curthoys I.S. , de C. , Waele, Saccadic Velocity in the New Suppression Head Impulse Test: A New Indicator of Horizontal Vestibular Canal Paresis and of Vestibular Compensation, Front Neurol) 7: ((2016) ), 160 |
[25] | Tarnutzer A.A. , Berkowitz A.L. , Robinson K.A. , Hsieh Y.H. , Newman-Toker D.E. , Does my dizzy patient have a stroke? A systematic review of bedside diagnosis in acute vestibular syndrome, CMAJ 183: ((2011) ), E571–592. |
[26] | Weber K.P. , Aw S.T. , Todd M.J. , McGarvie L.A. , Curthoys I.S. , Halmagyi G.M. , Horizontal head impulse test detects gentamicin vestibulotoxicity, Neurology 72: ((2009) ), 1417–1424. |
[27] | Weber K.P. , MacDougall H.G. , Halmagyi G.M. , Curthoys I.S. , Impulsive testing of semicircular-canal function using video-oculography, Ann N Y Acad Sci ((2009) ) 1164: , 486–491. |

