
Investigating Compensatory Brain Activity in Older Adults with Subjective Cognitive Decline
Abstract
Background:
Preclinical Alzheimer’s disease (AD) is one possible cause of subjective cognitive decline (SCD). Normal task performance despite ongoing neurodegeneration is typically considered as neuronal compensation, which is reflected by greater neuronal activity. Compensatory brain activity has been observed in frontal as well as parietal regions in SCD, but data are scarce, especially outside the memory domain.
Objective:
To investigate potential compensatory activity in SCD. Such compensatory activity is particularly expected in participants where blood-based biomarkers indicated amyloid positivity as this implies preclinical AD.
Methods:
52 participants with SCD (mean age: 71.00±5.70) underwent structural and functional neuroimaging (fMRI), targeting episodic memory and spatial abilities, and a neuropsychological assessment. The estimation of amyloid positivity was based on plasma amyloid-β and phosphorylated tau (pTau181) measures.
Results:
Our fMRI analyses of the spatial abilities task did not indicate compensation, with only three voxels exceeding an uncorrected threshold at p < 0.001. This finding was not replicated in a subset of 23 biomarker positive individuals.
Conclusion:
Our results do not provide conclusive evidence for compensatory brain activity in SCD. It is possible that neuronal compensation does not manifest at such an early stage as SCD. Alternatively, it is possible that our sample size was too small or that compensatory activity may be too heterogeneous to be detected by group-level statistics. Interventions based on the individual fMRI signal should therefore be explored.
INTRODUCTION
Subjective cognitive decline (SCD) is defined as self-perceived cognitive decline that does not manifest in cognitive tests and affects around 20% of individuals older than 65 years [1]. SCD might have different causes (e.g., neurodegenerative disorders, psychiatric disorders, or head trauma) [2]. Despite achieving normal results in neuropsychological tests, the average performance in SCD is somewhat lower in episodic memory measures of immediate and delayed verbal recall, compared to healthy older adults [3, 4]. Regardless of variations in the trajectory of SCD, it is considered an at-risk state for the development of Alzheimer’s disease (AD), particularly when the individual is worried about the decline. Longitudinal studies show that SCD approximately doubles the risk of developing manifest dementia in the following years within five years [5]. This is in line with several studies that reported increased biomarkers of AD in SCD [6]. Studies investigating amyloid-β for example, reported greater levels of amyloid depositions in positron emission tomography (PET) in participants with greater SCD [7, 8]. Therefore, increased amyloid levels might be associated with SCD many years before cognitive impairment manifests [6]. The recent development of amyloid-β blood biomarkers allows the estimation of PET amyloid positivity throughout the different phases of the AD spectrum [9]. Tau depositions are another biomarker of AD but also SCD [6]. pTau181 has been associated with amyloid and tau PET positivity in healthy older adults and participants with AD [10]. These blood-based biomarkers have the potential to identify amyloid positive individuals, which might be in a preclinical stage of AD (SCD likely due to AD).
There seems to be a complex interaction between brain activity, brain area and disease stage in cognitive impairment. In the memory domain, a recent study in individuals with SCD, mild cognitive impairment (MCI) and healthy controls reported an inverse quadratic relationship for task-related activation in an associative memory task in the left parietal lobe across the different study samples. For the hippocampus and other brain regions a negative linear relationship described the activation better than the quadratic function in relation to the volume, i.e., activation was constantly greater when volume became lower. The SCD classification included APOE genotyping (ɛ4 carrier) and/or biomarker evidence (left or right hippocampal volume one standard deviation below the mean of the healthy control sample) to increase the likelihood of including participants with preclinical AD [11]. In another study, hyperactivity in the hippocampus at baseline predicted increased longitudinal amyloid deposition, which was not the case for cortical regions. This indicates that hippocampal hyperactivity is related to pathological effects, while greater cortical activity reflects compensatory processes [12]. Evidence for compensatory activity in SCD has also been found outside the parietal cortex. In individuals with subjective memory complaints, the right dorsolateral prefrontal cortex showed greater activity during cued recall in a face-occupation task, while task performance in this sample was not significantly different from healthy controls. The face-occupation task assesses associative episodic memory and especially the recall condition is a sensitive test for early memory impairment in the course of AD [13]. Another study reported greater prefrontal activity in participants with subjective memory decline in an episodic memory encoding task as an indicator of compensatory activity [14].
In addition to the results from functional neuroimaging, two systematic reviews summarizing structural brain changes in SCD reported heterogeneous results. However, a lower hippocampal volume has been a consistent finding [6, 15]. The hippocampus is part of the medial temporal lobe (MTL), which is affected by neuropathology (e.g., atrophy) early in AD whereas neocortical structures like the parietal lobe are affected later [16]. Therefore, many imaging studies have focused on the MTL. The parietal lobe is less investigated in SCD even though it is prone to exhibit early amyloid deposition [17, 18]. Both the MTL as well as the parietal lobe are relevant in episodic memory [19–22].
In the spatial domain, impairments are observed early in the course of AD. Delayed recall performance in visuospatial memory tasks like the delayed recall in the Rey–Osterrieth complex figure test has shown the ability to discriminate MCI from healthy aging [23]. Spatial abilities include different subfunctions like spatial perception and mental rotation [24]. A meta-analysis reported consistent activity in the superior and inferior parietal lobes in both hemispheres in mental rotation and spatial imagery tasks in healthy subjects [25]. While no study with functional magnetic resonance imaging (fMRI) investigated spatial abilities in SCD, greater activity in parietal and temporal areas has been reported in MCI. As no significant difference in task performance between the MCI sample and healthy controls was found this might indicate compensatory activity [26].
Overall, there is evidence for compensatory activity in SCD, but data is scarce. More data for this population is especially important because SCD allows the study of early compensatory brain changes. But there exists no clear definition of how neuronal compensation can be addressed. Gregory et al. [27] defined a model to operationalize compensatory brain activity in neurodegeneration due to Huntington’s disease. This model includes three variables: task performance, a proxy of disease severity, and brain activity. In an early disease-stage accompanied by normal performance, compensation through greater brain activity is possible. Generally, compensatory activity is seen in early or mild cases of neurodegeneration. In later disease-stages performance starts to decline as disease severity increases and compensation is no longer possible [27]. In accordance with previous studies, we hypothesized that compensatory effects in SCD will be present in parietal [11] and/or frontal [13, 14] brain regions and will be most pronounced in subjects with probable amyloid positivity.
The aim of this study was to investigate the existence of compensatory brain activity in SCD. As a lower hippocampal volume was a sfinding in studies investigating SCD, we used hippocampal atrophy as an indicator of potential neurodegeneration associated with SCD. We deployed the model of Gregory et al. [27] in fMRI tasks on episodic memory and spatial abilities. We selected these tasks based on their involvement of the parietal lobe and the early impact of AD related pathologies on task performance. In the episodic memory task we focused on the cued recall condition as this is a sensitive test for early memory impairment in AD [13]. We defined successful neuronal compensation as greater activity in brain regions correlated with greater task performance in the presence of high hippocampal atrophy. Hippocampal atrophy served as a marker of disease related neuropathology. Compensatory effects might be most pronounced in SCD if it is a preclinical state of AD. Therefore, we repeated the fMRI analyses in a subsample with probable amyloid positivity according to blood biomarkers for amyloid-β or pTau.
METHODS
This bi-centric study (Bern and Lucerne; Switzerland) was approved by both local Ethics Committees and registered on ClinicalTrials.gov (NCT04452864). All study participants gave informed consent before the first study visit.
Participants
52 Caucasian participants (mean age 71.00, SD: 5.70, mean years of education: 15.15, SD: 3.06) were included in the analyses. The data were collected as part of the baseline assessment of a cognitive training study [28]. This assessment was the first in person contact of the participants with a member of the research team, therefore, we do not assume any effect of the planned intervention or general study setting on the results. We included participants who reported subjective cognitive complaints and related worries as this increased the probability to include participants with SCD likely due to AD [2]. To identify SCD, participants completed a questionnaire on memory related concerns and attentional deficits during the last 12 months. Language or other cognitive abilities were not assessed. This questionnaire is based on suggested criteria for SCD [29]. We included participants only if they reported a decline in memory or attention functions and expressed related worries. For this categorical questionnaire no cut-off scores are available.
Other inclusion criteria were age between 60–85 years, native or fluent German speakers and normal or corrected to normal vision. Exclusion criteria included a diagnosis of cognitive impairment (MCI or dementia), a severe neurological or acute psychiatric disease, substance abuse, current psychoactive medication, contraindication for MRI (i.e., metal implants) or stroke in previous history. The diagnosis of MCI was based on established criteria [30]. Furthermore, participants which scored below 23 points in the MoCA were excluded from this study as this is an indicator of objective cognitive decline [31].
For 21 participants no increased cardio-vascular risk factors were identified (i.e., no self-reported high blood pressure, cardiac disease, or abnormalities in the MRI data). 18 participants reported high blood pressure and 5 participants reported heart problems (e.g., heart attack or auricular fibrillation in the past). T1 weighted MRI images were investigated by a clinical neuroradiologist to rate hypointensities, which could reflect a vascular component explaining cognitive impairment. 34 participants of our sample had a Fazekas score (i.e., presence of white matter lesions) [32] of 0, for 10 participants the score was 1, for 7 participants the score was 2 and for 1 participant the score was 3. Of note, we did not acquire FLAIR or similar sequences, which would have been more sensitive measures of white matter lesions.
51 participants were included in the fMRI model for the episodic memory fMRI task, one participant was excluded due to motion artefacts.
Blood samples from 38 participants were available. To investigate neuronal compensation specifically in SCD likely due to AD, we repeated all analyses with a subsample with blood biomarkers indicating amyloid positivity (n = 23). In this subsample, one participant had to be excluded from analyses in the episodic memory fMRI task due to motion artefacts.
Neuropsychological assessment and behavioral composite scores
The neuropsychological test battery included the Montreal Cognitive Assessment (MoCA) [33], auditory verbal learning test (AVLT) [34], Rey–Osterrieth complex figure (RCF) [32], flanker test [36], graded naming test [37], semantic fluency, digit span forward and backward, and questionnaires related to the cognitive training intervention. Additional questionnaires assessed situational motivation [38], quality of life [39], activities of daily living [40], handedness [41] and depressive symptoms [42]. Furthermore, we assessed subjective cognitive complaints in self and informant rated versions. The MoCA was the only test performed as paper-pencil version, all other tests and the questionnaires were administered using a tablet (iPad, 7. Generation) with the Apollo App [43].
We computed a composite score of episodic memory and spatial abilities based on raw test scores. The episodic memory (memory) composite score included the learning sum, immediate and delayed recall of the AVLT. The spatial abilities composite score included encoding, immediate and delayed recall from the RCF. Before calculating the behavioral composite scores, two principal component analyses (PCAs) were performed, one for the three AVLT and the other for the RCF scores. In a next step, we centered and standardized the three test scores included in the composite score. If the PCA showed different loadings for the test scores (i.e., the differences between two loadings were larger than 0.05) within one composite score, the centered and standardized scores were weighted according to their loading and a mean score was calculated, resulting in one memory and one spatial abilities composite score.
Blood-based biomarkers
We used the amyloid-β42/40 (Aβ42/40) ratio and pTau181 measures to identify participants with probable AD-specific neuropathologies and repeated the fMRI analyses with a subsample with positive blood biomarkers for amyloid positivity.
For blood biomarker measurement in this study we used N4PE Simoa immunoassays (IA-N4PE) developed by Amsterdam University Medical Center, Amsterdam, the Netherlands, and ADx Neurosciences, Ghent, Belgium, and commercially available from Quanterix, Billerica, Massachusetts [44]. Cut off scores of 0.06 for the Aβ42/40 ratio and 1.8 pg/ml for pTau181were used. These are based on unpublished data in which 1111 participants with known amyloid status based on CSF or amyloid PET from the Amsterdam Dementia Cohort were analyzed (AUC for Aβ42/40 0.735 and for p-tau181 0.828).
Study procedures
The duration of the study visit was approximately 3 h, including the MRI session. After signing the consent form, the MoCA and tablet-based cognitive tests were performed. Next, participants practiced all conditions of the fMRI tasks outside the MRI scanner to ensure task comprehension. The MRI session itself took around 50 min. The session started with a resting-state fMRI (rs-fMRI) while fixating a cross, followed by the face-occupation task (episodic memory) during task-based fMRI, T1 w structural imaging, a visual construction task targeting spatial abilities during task-based fMRI, and an arterial spin labelling (ASL) protocol. This listing of MRI sequences corresponds to the order in MRI data acquisition. Data on rs-fMRI and ASL are not reported here.
Face-occupation task
Episodic memory was assessed with a blocked face-occupation task (duration: 638 s, Fig. 1), which was based on a previous study [45]. This paradigm induces activity in the MTL and occipital brain areas [46]. Additionally, cued recall tasks have been suggested as sensitive markers for AD [13, 47] and have been related to CSF markers of AD [47].
Fig. 1
Face-occupation task. A) Encoding: participants were asked whether a face matches an occupation (subjective rating) B) Control condition: participants were asked to indicate whether a male or female silhouette is shown. C) Cued recall: a face from the encoding condition was presented as cue and participants indicated whether the occupation of the presented person requires a university degree or an apprenticeship. D) Recognition: participants had to choose the correct job between two different options.
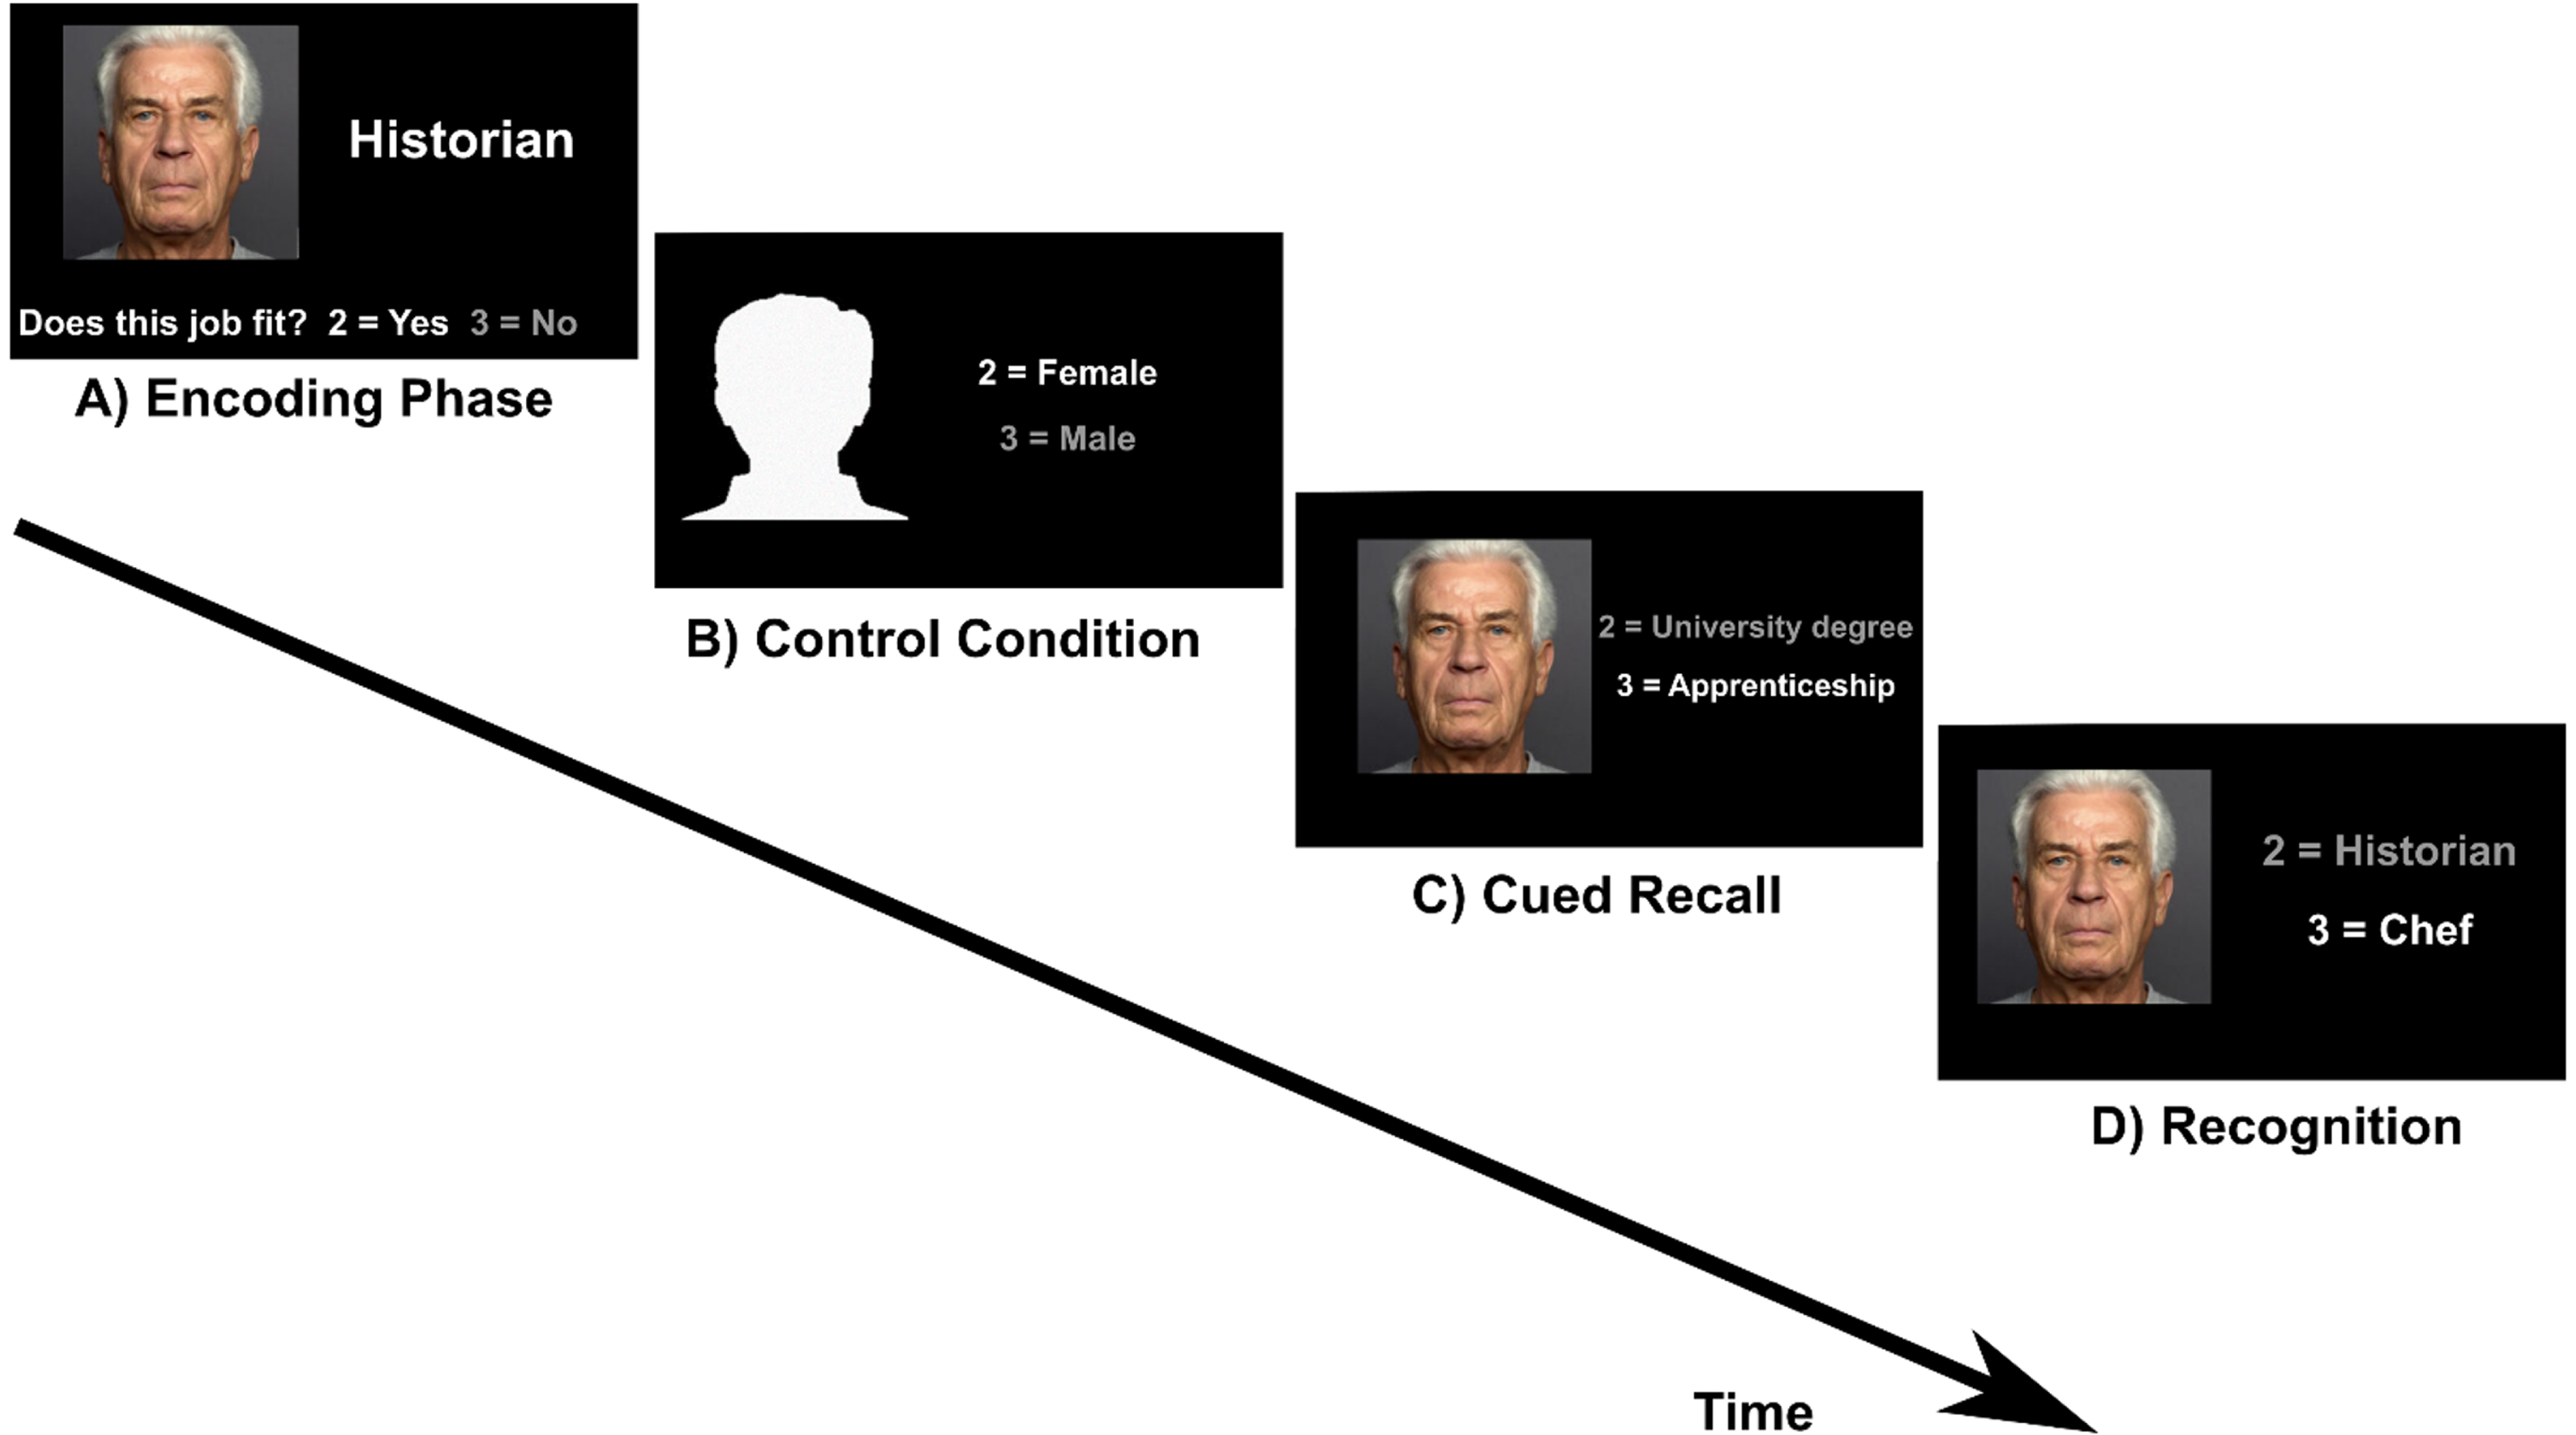
The task included four conditions which were presented in the same order (encoding, cued recall, control condition, recognition) in six runs. Before the encoding block a task instruction was shown (“Please remember the people and their job. Does the face fit to the job? Yes = 2, No = 3”). This text disappeared after 4 s and the first of five face-occupation associations was shown. Below the picture and the occupation the question “Does the face fit to the job? Yes = 2, No = 3” was displayed. The aim of this question was to induce a deeper level of encoding [13]. This block was followed by the control condition. The instruction text appeared again for 4 s (“Silhouettes: Male or female? 2 = Female, 3 = Male”). This text was followed by five head contours with the question “2 = Female/3 = Male” right aside. Then the instruction for the cued recall condition was displayed for 4 s (“What is this person’s education? 2 = University degree, 3 = Apprenticeship”). During the cued recall condition, a previously learned face appeared as cue with the text “2 = University degree/ 3 = Apprenticeship” right aside. For the recognition condition the instruction was “What is this person’s occupation?”. This instruction screen was followed by the presentation of the five faces that had also been shown during the encoding and cued recall condition. The faces were shown with two occupations and the correct one had to be selected by button press. One block lasted 21.25 s and included one condition. The given answer was indicated by the font color switching from white to grey. The interstimulus-interval was 0.5 s and stimuli were displayed for 3.75 s, regardless of the answer from the participant. After the third run the 15 face-occupation associations were presented again in the same order. This repetition was included to limit the number of stimuli to remember. As stimuli eight pictures of female and seven pictures of male faces from the Ebner face database [48] were shown.
As performance measure, we computed task accuracy for cued recall and recognition blocks.
Spatial construction task
Spatial abilities were assessed with a blocked spatial construction task (duration: 604 s, Fig. 2). This task was designed in accordance with a task which has been shown to elicit bilateral activation in parietal and occipital brain regions [49]. Spatial abilities are another domain early affected by behavioral deficits in the course of AD [50].
Fig. 2
Spatial construction task. A) Translation and C) Rotation conditions: participants had to either translate or rotate puzzle pieces mentally in order to decide if the pieces fit together to build a square. As control condition, participants indicated if the two grey squares in black boxes in similarly shaped puzzle pieces were of the same grayscale (B) Luminance translation and D) Luminance rotation condition).
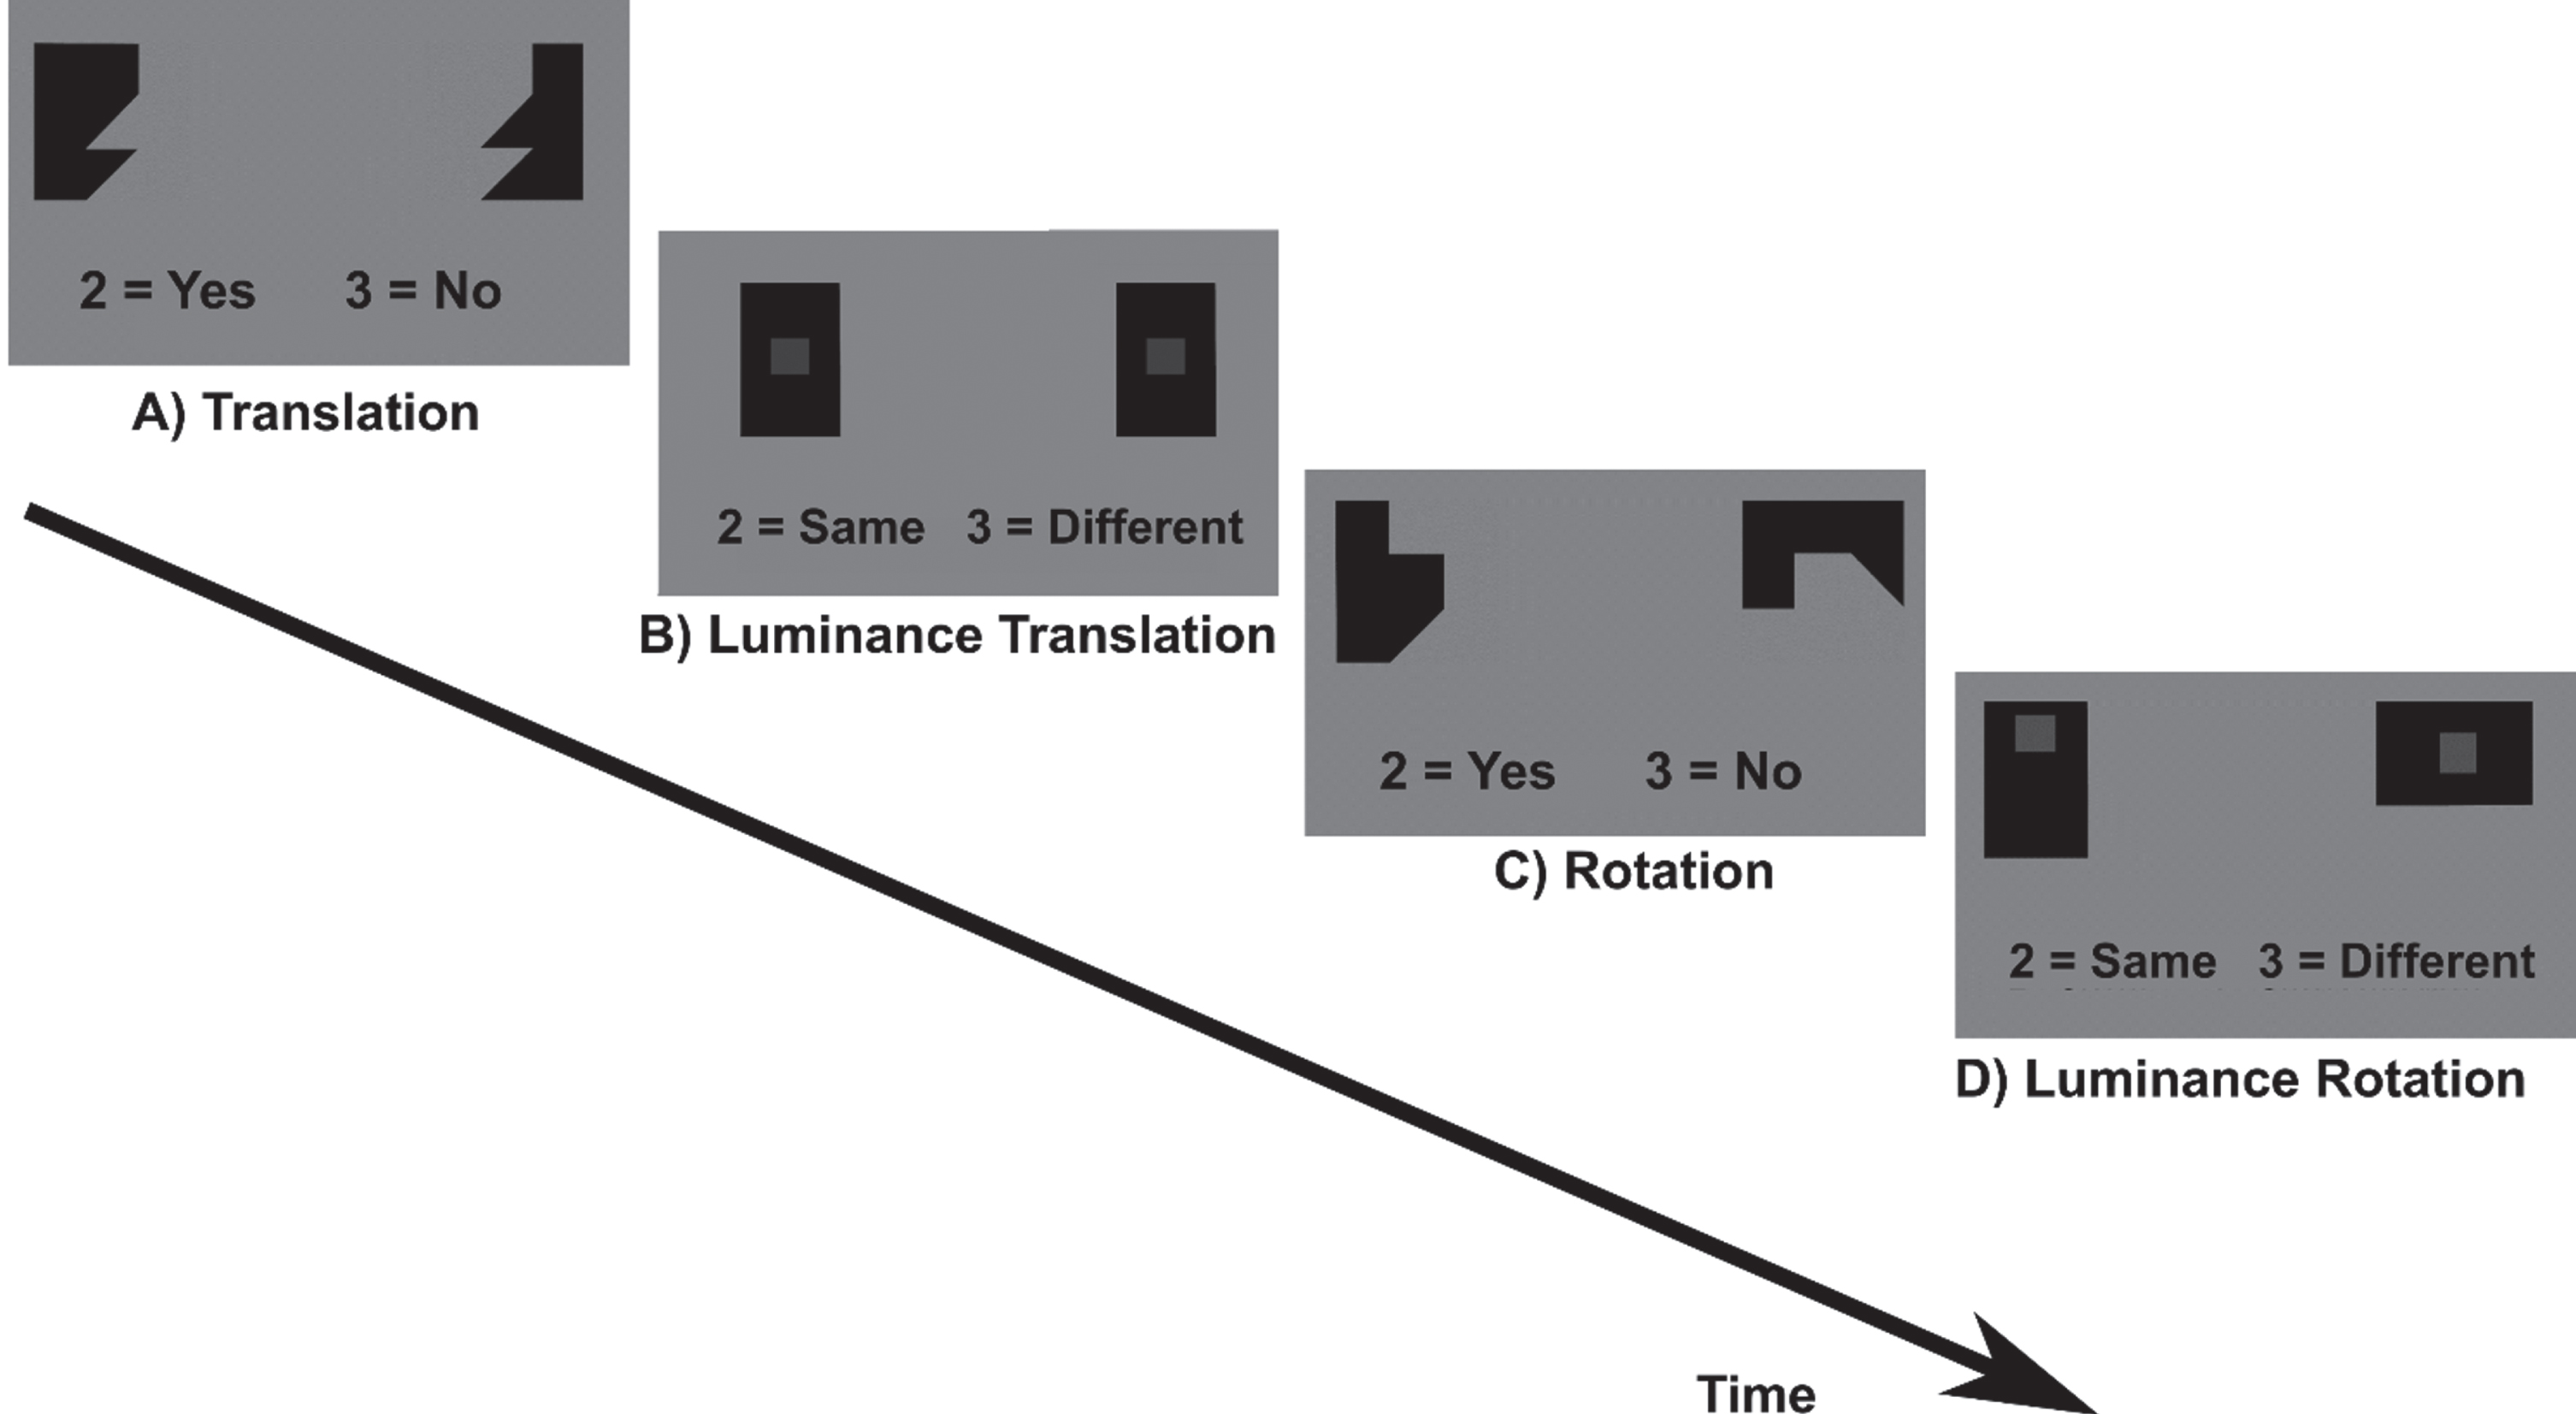
The task included four conditions (translation and rotation and the respective control conditions, luminance translation and luminance rotation). Participants had to either translate or rotate geometric puzzle pieces mentally in order to decide if the pieces fit together to build a square. As control condition, participants indicated if the two grey squares in black boxes in similarly shaped puzzle pieces were of the same grayscale. The task included two runs with eight blocks each. Before each block an instruction text was displayed for 3 s (rotation/translation conditions: “Do these shapes build a square? 2 = Yes, 3 = No”; luminance conditions: “Are the squares displayed in the same opacity? 2 = Same, 3 = Different”). One block lasted 24 s and included one condition. During the block the text “2 = Yes, 3 = No” or “2 = Same, 3 = Different” was displayed below the puzzle pieces. Each block was presented four times in a fixed order ensuring that translation and rotation conditions would always alternate. Between two blocks, breaks of 12 s and of 27 s between two runs were included during which a black fixation cross was displayed. In the long break (27 s), a text was displayed that now is a short break and the participant should not move. During the task each stimulus was presented for 2.5 s if no button press occurred. After button press or 2.5 s, the stimuli disappeared and a fixation cross appeared for 0.4 s. Stimuli within a block were displayed in a randomized order. Due to the fixed block duration in combination with self-paced trial solving, the number of solved trials differed between participants.
Performance was computed analogous to the episodic memory task but here the translation and rotation condition were combined to obtain one value for spatial abilities task accuracy. Due to the fixed block length, the presentation duration of the last trial of each block varied. Therefore, the last trial of each block was not included in the analysis.
Participants answered with the index (2/yes/female/same) and middle finger (3/no/ male/different) of the right hand, using a Celeritas® button box with two buttons. Left-handers were asked to use the right-hand.
MRI data acquisition
Neuroimaging was acquired with a 3T Siemens scanner (Bern: Siemens Magnetom Prisma, 32 channel head coil; Lucerne: Siemens Magneton Vida, 64 channel head coil). Sequences and coil system at the Lucerne site were adapted to resemble the protocol in Bern to acquire high quality data while minimizing hardware differences (please see statistical analyses section for the handling of site differences). The described MRI parameters below were identical at both study sites.
From all participants, T1- weighted images (MP2RAGE, TR = 5000 ms, TE = 2.98 ms, TI 1/2 = 700 ms/2500 ms, flip angle 1/2 = 4%5°, FOV = 256 mm x 256 mm, matrix = 256 x 256, voxel size = 1 x 1 x 1 mm, 176 slices) were acquired.
For the fMRI sequences we used echo-planar imaging (EPI) with 604 (spatial abilities Task) and 638 (episodic memory task) volumes (TR = 1000 ms, TE = 37 ms, flip angle = 30°, FOV = 230 mm x 230 mm, matrix = 92 x 92, accelerating factor 8, voxel size 2.5 x 2.5 x 2.5 mm, 72 slices). The axial slices were positioned along the anterior commissure and the posterior commissure.
MRI processing
To calculate hippocampal atrophy, the structural images were automatically segmented with the computational anatomy toolbox (CAT12: http://www.neuro.uni-jena.de/cat/). ROIs were calculated using the neuromorphometrics atlas. To calculate hippocampal atrophy, total hippocampal volume was scaled by total intracranial volume and the results subtracted from one, so that larger numbers were corresponding to higher levels of hippocampal atrophy.
To provide a grey matter mask for the task fMRI group analyses, the anatomical images of each participant were segmented using SPM12 [51] in MATLAB version 2019b (Natick, MA: The MathWorks Inc.) on a Linux platform. After segmentation the individual grey matter images were spatially normalized to standard MNI space and then combined into one mean image over all participants as grey matter mask.
Functional volumes were first realigned to the mean image of each individual, coregistered to the anatomical image in native space and finally smoothed with a 6 mm full width at half maximum Gaussian Kernel.
As first-level analyses general linear models were computed for each participant in native space with BOLD signal changes as dependent variable. Each block type was included as separate predictors with one additional predictor for instruction screens and breaks (episodic memory task: encoding, control, cued recall, recognition, instruction screens; spatial abilities task: translation, rotation, luminance translation, luminance rotation, instruction screens). To account for possible head movements, the absolute values of the first derivate of the six default movement parameters obtained during realignment were included. Each predictor’s time course was convolved with a standard hemodynamic response function. A 128-s high pass filter was used to account for scanner drift and a separate variable was added to model the intercept. The resulting first level contrast images were then normalized into MNI space and resampled to isometric voxels with a side length of 2 mm.
To test if severe motion artefacts were present in the fMRI data, the absolute derivate of the first three movement parameters (x, y, z axis) were checked for values exceeding 2 mm between subsequent volumes. Two participants exceeded this threshold in the episodic memory task, one participant 17 times and one participant once. The participant with 17 movements was excluded from data analysis in the face-occupation episodic memory task. In the spatial abilities task, movements exceeding 2 mm were observed once in one participant and, therefore, no participants were excluded.
Statistical analyses
Behavioral data analyses
To investigate the association between blood-based biomarkers, behavioral composite scores and hippocampal atrophy we performed correlation analyses as well as partial Pearson’s correlation analyses controlling for age. For categorical variables (APOE ɛ4 carrier: yes/no) Welch’s t-tests were used. We also used Welch’s t-tests to test for significant differences between study sites in behavioral composite scores, hippocampal atrophy, and fMRI task accuracy. Paired t-tests were used to investigate differences in task accuracy, reaction times and number of solved trials between the different conditions in the fMRI tasks.
The analysis of the behavioral data was performed with R studio [52].
Imaging data analyses
Spatially normalized contrast images from the individual subjects level coding cued recall > control contrasts (i.e., deciding if the occupation associated with the presented face requires an apprenticeship or university degree > is the presented head contour male or female) from the face-occupation episodic memory task entered group level analyses (second level). We expected this contrast to elicit parietal activity associated with episodic memory retrieval processes. A study using a similar face-name paradigm for example, reported activation during successful retrieval in the posteromedial cortex compared to lower activation during encoding in young adults [53]. Furthermore, cued recall tasks are sensitive markers for early AD related memory impairment [13, 47]
For the visual construction task, we selected the [translation+rotation]> [luminance translation+luminance rotation] contrast, in accordance with the results of Seydell et al. [49] which showed strong parietal activity.
As outlined in the introduction, patterns reflecting neuronal compensation were defined as regions where greater functional activity is associated with greater hippocampal atrophy and better task performance [27].
To investigate potential neuronal compensation, we used inclusive masking with an orthogonal (i.e., independent) contrast as in previous work [54]. In detail, significant activity with an uncorrected threshold of p < 0.01 in a first t-contrast for activity correlating with hippocampal atrophy was calculated. The resulting image was used as inclusive binary mask for a second estimation of the same contrast with activity positively correlated with fMRI task performance. For this second contrast estimation a family-wise error correction (FWE, p < 0.05) for multiple testing as well as a less conservative threshold of p < 0.001 uncorrected were used. The masking image included only few clusters where activity could be detected in the second contrast. Therefore, p-values in the second contrast estimation were corrected for the small search region with a small volume correction after masking.
While we selected tasks especially activating parietal areas, compensatory brain activity might also appear in brain areas outside the parietal lobe. Therefore, we performed whole brain analyses with the grey matter mask calculated for the study sample (please see below for detailed information about the grey matter mask). We included the fMRI in-task performance measures in the main models (model 1.1: Compensation related to performance in the episodic fMRI task; model 2.1: Compensation related to performance in the spatial abilities fMRI task). In a secondary analysis, we included performance measures from the behavioral composite scores instead of fMRI task performance, these models are reported in the Supplementary Material (model 1.2: Compensation related to the memory composite score; model 2.2: Compensation related to the spatial abilities composite score).
As previously mentioned, we repeated all analyses with a subsample with positive blood biomarkers for amyloid positivity (model 1.3: Compensation related to performance in the episodic memory fMRI task in a subsample with positive blood biomarkers for amyloid positivity; model 2.3: Compensation related to performance in the spatial abilities fMRI task in a subsample with positive blood biomarkers for amyloid positivity). The results from the subsample whole brain analyses and the detailed results from the models including fMRI task performance are reported in the Supplementary Material (model 1.4: Compensation related to performance in the memory composite score in a subsample with positive blood biomarkers for amyloid positivity; model 2.4: Compensation related to the spatial abilities composite score in a subsample with positive blood biomarkers for amyloid positivity). We did not correct for the number of models as we aimed to detect indications for compensation and consequently employed liberal statistical thresholds throughout (i.e., p < 0.01 for the masking image and pFWE < 0.05 as well as puncorrected < 0.001 for the combination of both contrast images) [55]. For the same reason, we did not apply a voxel extent threshold. In all models one-sample t-tests were performed. Another possibility to investigate neuronal compensation is to build two samples according to the residuals in a linear regression for task performance and hippocampal atrophy. Participants with positive residuals in the regression scored better than estimated based on their hippocampal volume and we expect neuronal compensation to be most likely in this group (i.e., sample one). This is not the case in participants with null or negative residuals (i.e., sample two). We compared these samples with two-sample t-tests. Furthermore, we performed two-sample t-tests to compare subsamples with and without probable amyloid positivity based on blood biomarkers. The results for these analyses are reported in the Supplementary Material.
All reported p-values in the fMRI analyses correspond to the peak-level significance and coordinates to the MNI space (x, y, z).
Age was related to hippocampal atrophy and behavioral performance (please see the section “Relationship between behavioral data and hippocampal atrophy” for the results of the correlation analyses) and, therefore, was included as covariate in all fMRI analyses. Because MRI devices and head coils were different between study sites, site was also included as covariate. Sex was not related to hippocampal atrophy or behavioral composite scores (please see Table 2 for detailed results), but to address potential neuronal differences between females and males [56], sex was included as additional covariate.
RESULTS
Demographic details for the participants are summarized in Table 1. The mean score of the geriatric depression scale [42] was 1.73 (SD: 1.55). No participant had ten or more points, which would indicate severe depressive symptoms.
Table 1
Demographics of participants
| Mean | SD | Range | |
| Age (y) | 71 | 5.70 | 60–81 |
| Gender (m/f) | 22/30 | ||
| Education (y) | 15.15 | 3.06 | 9–20 |
| MoCA Score | 27.32 | 1.97 | 24–30 |
| Composite Score M | 0.00 | 0.93 | –2.29–1.6 |
| Composite Score SA | 0.00 | 0.49 | –1.20-0.93 |
SD, standard deviation; M, memory; SA, spatial abilities.
The mean values and standard deviations of the six test scores included in the behavioral composite scores are reported in the Supplementary Material.
To explore potential effects of study site on behavioral outcomes and hippocampal atrophy scores Welch’s t-tests were performed for the behavioral composite scores (memory: t(35.68) = –1.97, p = 0.06; spatial abilities: t(31.95) = –0.1, p = 0.91), hippocampal atrophy (t(46.59)= –0.86, p = 0.50) and fMRI task accuracy (memory: t(23.71)= 0.35, p = 0.73; spatial abilities: t(32.13)= 0.09, p = 0.93). The results did not indicate significant differences between study sites in any of these outcomes. Therefore, the correlation analyses were not controlled for study site.
Composite scores
For the episodic memory outcomes, the PCA showed very similar loadings (loading AVLT delayed recall: –0.58, loading immediate recall: –0.57, loading total learning sum: -0.58). Therefore, no weighting of the single raw test scores was performed for the behavioral composite score. The PCA for the SA raw scores showed differences between the loadings of the encoding and the two other scores which were larger than 0.05 (loading RCF encoding: –0.41, loading immediate recall: –0.65, loading delayed recall: –0.6). Therefore, we weighted the individual test scores with their absolute loads before combining them into one composite score.
Relationship between behavioral data and hippocampal atrophy
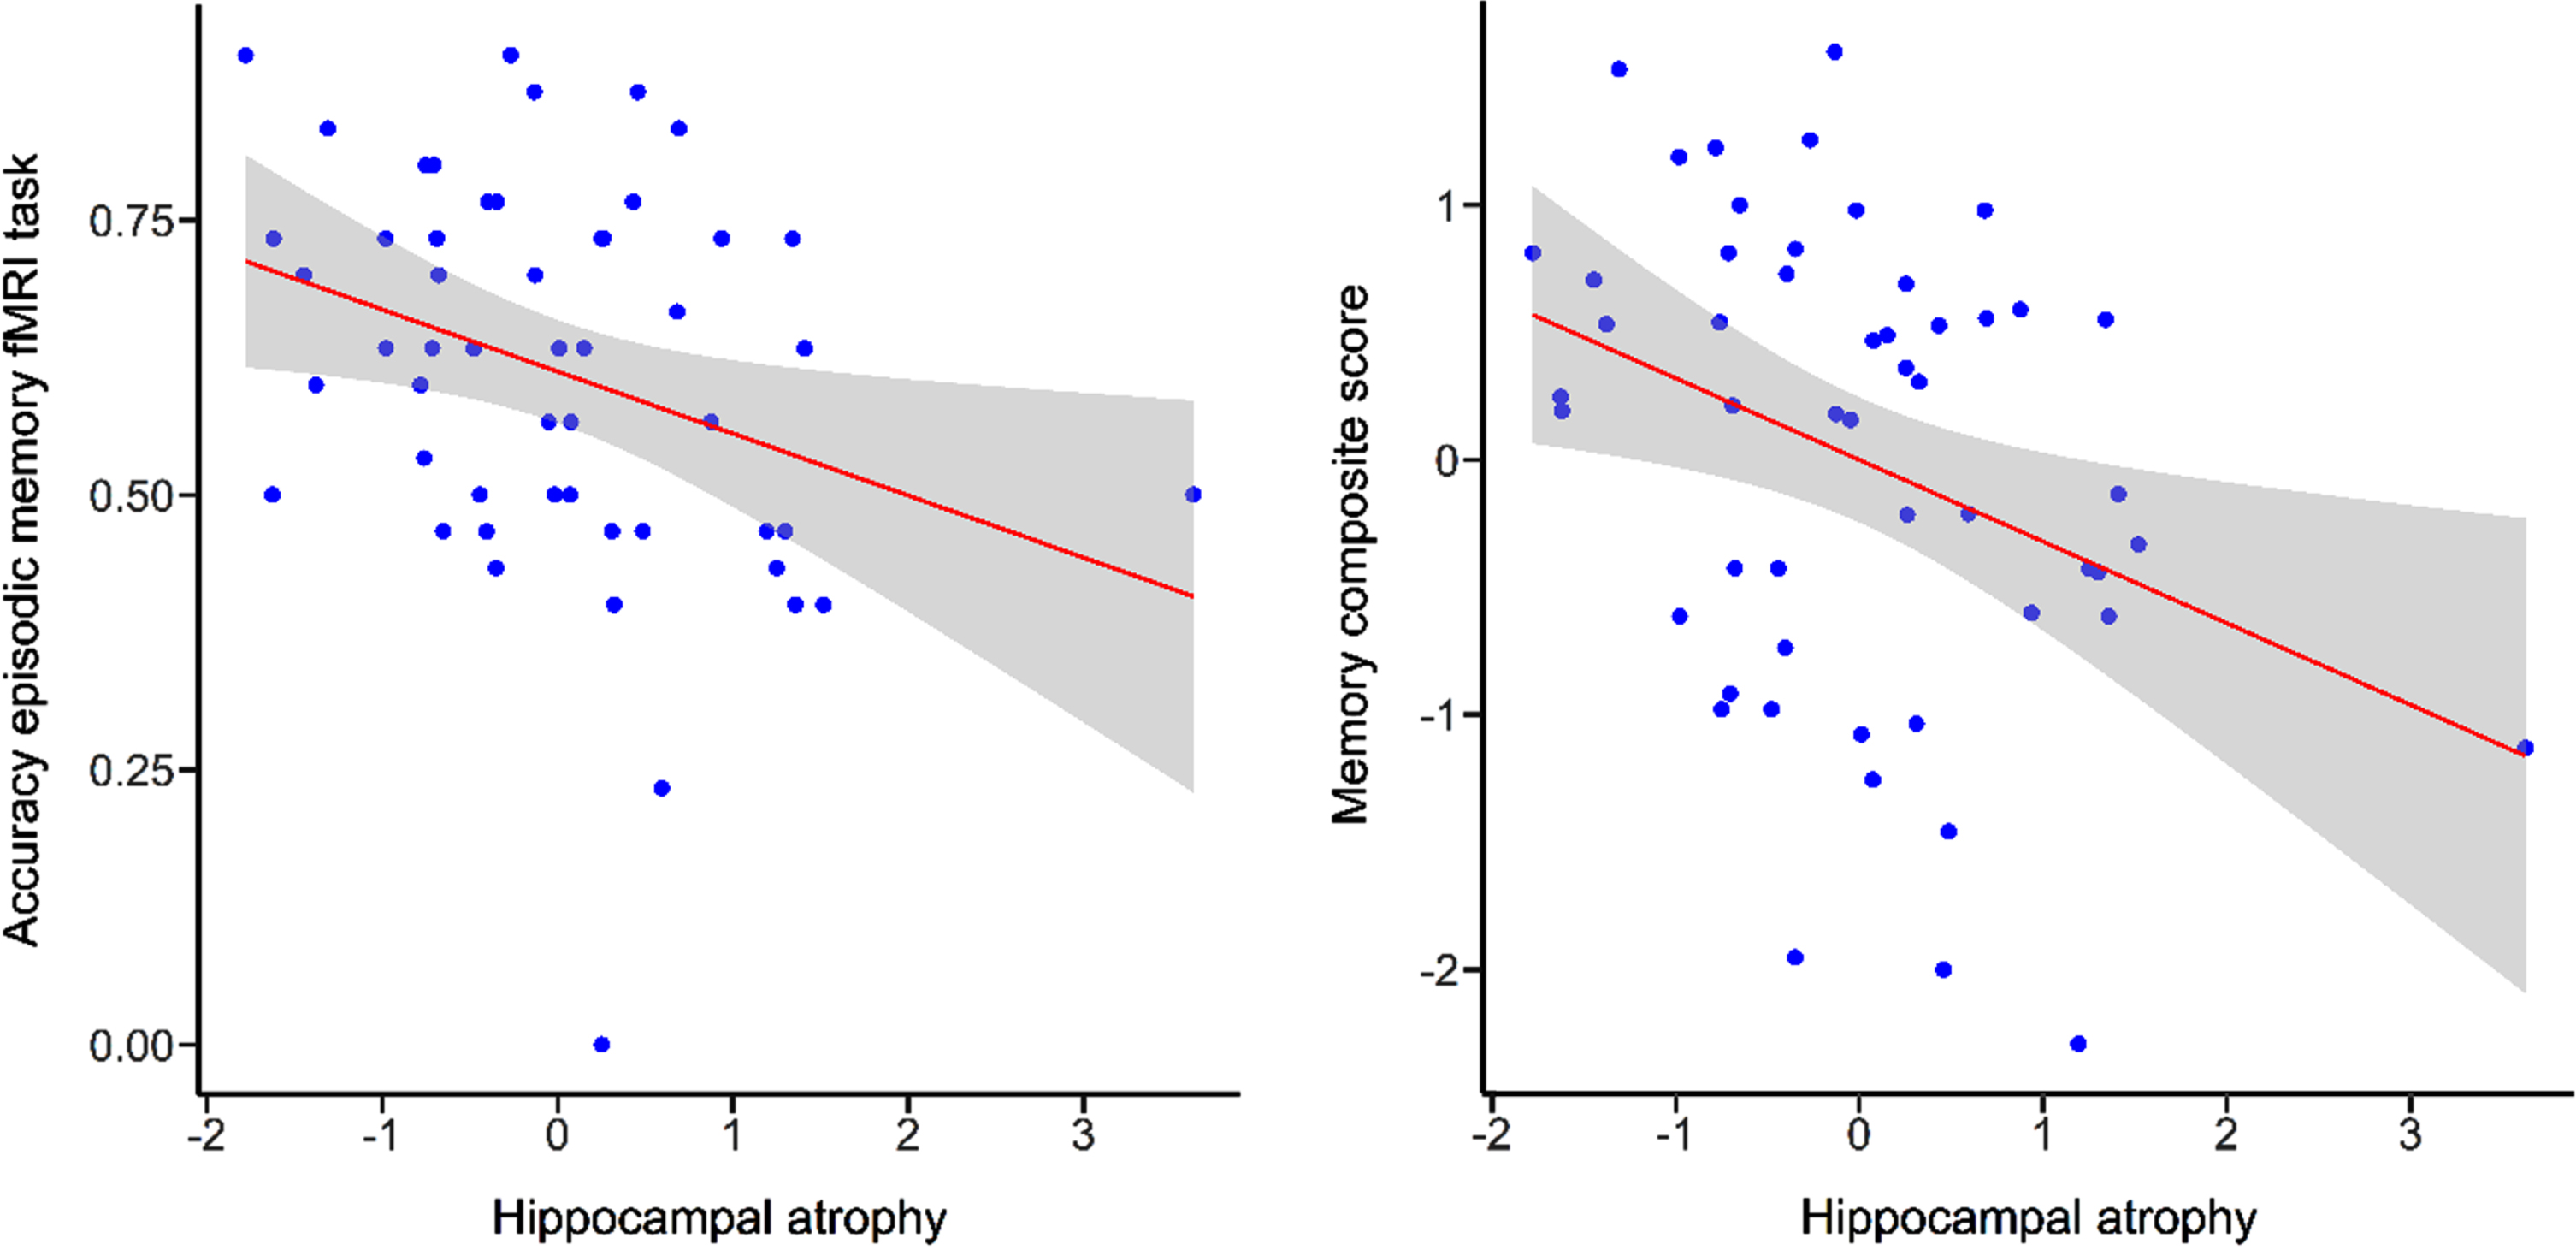
There was a significant correlation between performance in measures of episodic memory and hippocampal atrophy (fMRI task accuracy: r =–0.32, p < 0.05; memory composite score: r =–0.34, p = 0.01) indicating that higher performance in the episodic memory task or memory composite score was associated with lower hippocampal atrophy (Fig. 3). There were no correlations between measures of spatial abilities tasks and hippocampal atrophy (fMRI task performance: r =–0.07, p = 0.62; spatial abilities composite score: r = –0.25, p = 0.07).
Fig. 3
Scatterplots illustrating correlations for episodic memory fMRI task performance and memory composite score with hippocampal atrophy. Grey bands indicate standard errors.
Age was significantly correlated with hippocampal atrophy (r = 0.46, p < 0.001), episodic memory fMRI task performance (r = –0.49, p < 0.001) and the composite scores (memory: r = –0.32, p < 0.05; spatial abilities: r = –0.29, p < 0.05). This indicated higher hippocampal atrophy and lower task performance with increasing age. There was no significant correlation between performance in the spatial abilities fMRI task and age (r = –0.21, p = 0.14)
Cook’s distance plots did not indicate any influential data points (Cook’s distances larger than 0.5) in the correlations.
When controlled for age, no correlations were significant (episodic memory task performance and hippocampal atrophy: r = –0.12, p = 0.39; memory composite score and hippocampal atrophy: r = –0.24, p = 0.10).
Blood-based biomarkers
Seven participants were carriers of at least one APOE ɛ4 allele. Furthermore, we analyzed Aβ42/40 ratio (mean = 0.068, SD = 0.014), pTau181 (mean = 2.34 pg/ml, SD = 1.22), glial fibrillary acidic protein (mean = 126.86 pg/ml, SD = 60.21), and neurofilament light chain (mean = 22.9 pg/ml, SD = 11.21). Based on currently recommended cut-off scores, ratios lower than 0.06 in the Aβ42/40 ratio indicate amyloid positivity [57]. In our sample, this included eight participants. For pTau181, a cut-off of 1.8 pg/ml has been suggested for amyloid positivity [57], which indicated 18 participants with amyloid positivity. This pTau181 cut-off score is in-line with previous research [58]. Three participants reached the cut-off scores for amyloid positivity in both the Aβ42/40 ratio and pTau181. Therefore, we considered 23 participants as positive for AD pathology related blood-based biomarkers. There was a significant association between hippocampal atrophy and Aβ42/40 ratio (r = –0.55, p < 0.001) when controlling for age. Please see Table 2 for the complete results of the performed Welch’s t-test and partial Pearson’s correlation analyses.
Table 2
Association between blood-based biomarkers, behavioral composite scores, sex, and hippocampal atrophy (n = 38). For the dichotomous variable APOE ɛ4 carrier (yes/no) and sex (female/male) Welch’s t-tests were performed and t-values are reported. For the other blood-based biomarkers partial Pearson’s correlations were calculated and partial correlation coefficients are reported
| Blood -based biomarkers | Memory composite score | Spatial abilities composite score | Hippocampal atrophy |
| APOE4 carrier (Welch’s t) | 0.00 | 1.14 | 0.24 |
| Sex (Welch’s t) | –1.2 | 1.37 | 0.77 |
| Amyloid-β42/40 ratio (partial r) | 0.20 | 0.06 | –0.55** |
| pTau181 (partial r) | 0.07 | –0.13 | –0.13 |
*p<0.05, **p<0.001.
The correlation between Aβ42/40 ratio and hippocampal atrophy remained significant also when the correlation analysis was additionally controlled for sex and years of education (r = –0.60, p < 0.001).
fMRI task performance
The accuracy levels across all conditions in the two fMRI tasks were significantly above the chance level of 50% (cued recall: t(51) = –4.59, p < 0.001; recognition: t(51) = -8.71, p < 0.001, translation: t(51) = – 10.58, p < 0.001; rotation: t(51) = -10.40, p < 0.001; luminance translation: t(51) = – 11.49, p < 0.001; luminance rotation: t(51) = –10.54, p < 0.001). Therefore, we assume that both tasks were appropriately designed regarding task duration and level of difficulty.
Model 1: Episodic memory fMRI task
A whole brain analysis (constrained to the grey matter mask) for the cued recall > control contrast in the face-occupation episodic memory fMRI task showed significant activity in the parietal and occipital lobe. Therefore, we considered the episodic memory task and the selected contrast as appropriate and conducted further analyses (please see the Supplementary Material for details). Study site, total intracranial volume, age, and sex were included as covariates.
Model 1.1: Compensation related to performance in the episodic memory fMRI task
A mask for task-related activity positively correlated with hippocampal atrophy (puncorrected < 0.01) was calculated in a first step in the cued recall > control contrast. The clusters with the strongest activity were detected in the left temporal pole (t = 3.53; puncorrected = 0.001; peak x, y, z coordinates: –46, 4, –20), the right middle cingulate gyrus (t = 3.50; puncorrected = 0.001; peak x, y, z coordinates: 8, 12, 36) and the right occipital fusiform gyrus (t = 3.47; puncorrected = 0.001; peak x, y, z coordinates: 18, –98, –20) (Fig. 4A).
Fig. 4A
Greater activity related to greater hippocampal atrophy in the episodic memory task (cued recall > control contrast, puncorrected < 0.01), used as mask. Activity was detected in the left temporal pole and the right middle cingulate and occipital fusiform gyrus. b) Greater activity related to high episodic memory task accuracy in the cued recall > control contrast was located in the left lateral orbital gyrus and the left cerebral white matter/occipital fusiform gyrus (puncorrected < 0.001, before masking). R, right; P, posterior.
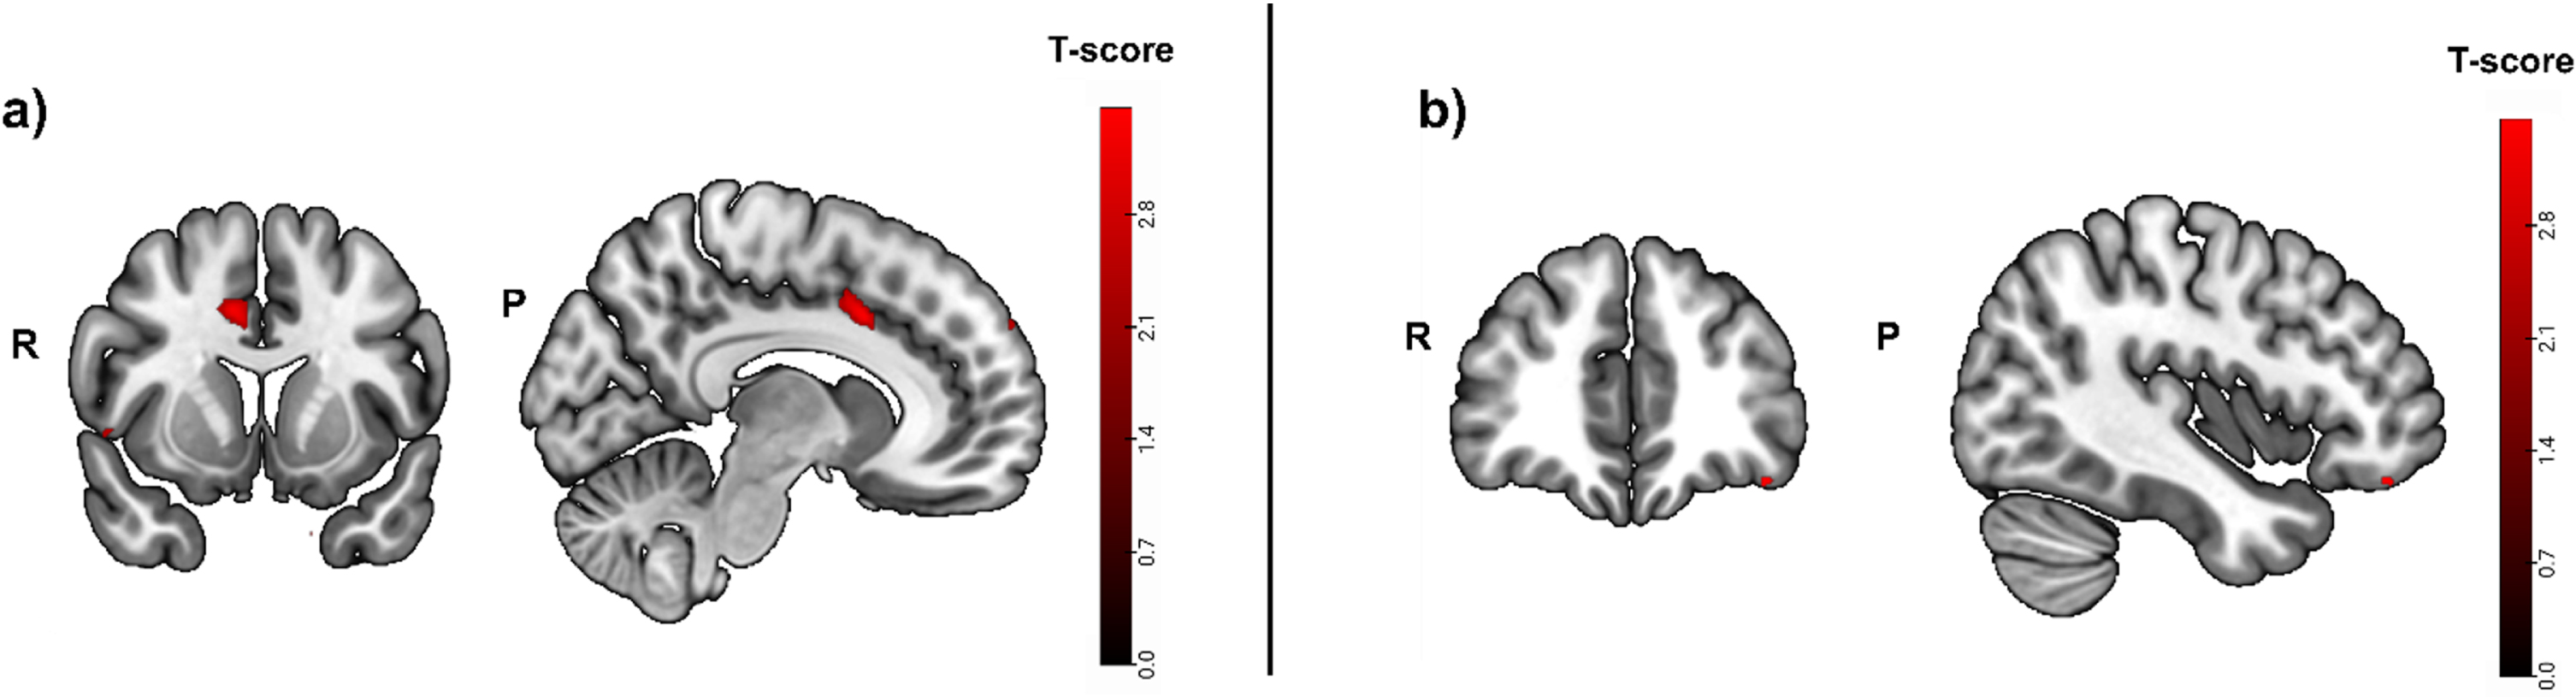
In a second step, the same contrast was calculated, but this time for activity that was positively correlated with fMRI task performance (i.e., accuracy). Task accuracy was not correlated with significant brain activity in any brain region when corrected for multiple testing (pFWE < 0.05). Without correction for multiple testing, the strongest activity before masking was located in the left lateral orbital gyrus (t = 3.49; puncorrected = 0.001; peak x, y, z coordinates: -40, 40, -18) and the left cerebral white matter/occipital fusiform gyrus (Fig. 4B).
Finally, the binary mask was used (inclusive masking) in the same contrast for activity that was positively correlated with episodic memory fMRI task performance. There were no significant clusters after masking (pFWE < 0.05 or puncorrected < 0.001).
Model 1.2: Compensation related to the memory composite score
An identical inclusive masking analysis with the memory composite score instead of episodic memory fMRI task accuracy did not show any significant results (pFWE < 0.05 or puncorrected < 0.001). Please see the Supplementary Material for details.
Model 2: Spatial abilities fMRI task
A whole brain analysis ([translation+rotation]>luminance conditions contrast, constrained to the grey matter mask) with study site, total intracranial volume and age as covariates was calculated and revealed several clusters with significant activity in the parietal lobe (please see the Supplementary Material for details). Therefore, we considered the selected spatial abilities contrast as appropriate for the planned analyses.
Model 2.1: Compensation related to performance in the spatial abilities fMRI task
We calculated also for the spatial abilities fMRI paradigm task-related activity positively correlated with hippocampal atrophy (puncorrected < 0.01). This showed the strongest activity in the left subcallosal area (t = 4.78; puncorrected = 0.000; peak x, y, z coordinates: –4, 10, –24), cerebellar vermal lobules I-V (t = 4.18; puncorrected = 0.000; peak x, y, z coordinates: 0, –54, –16), and the left cerebral white matter/superior frontal gyrus (t = 3.91; puncorrected = 0.000; peak x, y, z coordinates: -20, 12, 46) (Fig. 5A).
Fig. 5A
Greater activity related to greater hippocampal atrophy in the spatial abilities task ([translation+rotation]>luminance conditions contrast, puncorrected < 0.01), used as mask. Activity was detected in the left subcallosal area, the cerebellar vermal lobules I-V and the left cerebral white matter/superior frontal gyrus. b) Greater activity related to high spatial abilities task accuracy (before masking) was located in the right medial orbital gyrus and the left supramarginal gyrus (puncorrected < 0.001). c) After inclusive masking a significant effect in the left supramarginal gyrus was detected (puncorrected < 0.001). R, right; P, posterior.
![Greater activity related to greater hippocampal atrophy in the spatial abilities task ([translation+rotation]>luminance conditions contrast, puncorrected < 0.01), used as mask. Activity was detected in the left subcallosal area, the cerebellar vermal lobules I-V and the left cerebral white matter/superior frontal gyrus. b) Greater activity related to high spatial abilities task accuracy (before masking) was located in the right medial orbital gyrus and the left supramarginal gyrus (puncorrected < 0.001). c) After inclusive masking a significant effect in the left supramarginal gyrus was detected (puncorrected < 0.001). R, right; P, posterior.](https://content.iospress.com:443/media/jad/2023/93-1/jad-93-1-jad221001/jad-93-jad221001-g005.jpg)
Task accuracy was not positively correlated with significant brain activity when corrected for multiple testing (pFWE < 0.05). Without correction for multiple testing (puncorrected < 0.001) the only significant clusters were located in the right medial orbital gyrus (t = 4.62; puncorrected = 0.000; peak x, y, z coordinates: 14, 26, -30; t = 3.91; puncorrected = 0.000; peak x, y, z coordinates: 18, 18, -28; t = 3.78; puncorrected = 0.000; peak x, y, z coordinates: 12, 20, -28) and the left supramarginal gyrus (t = 3.59; puncorrected = 0.000; peak x, y, z coordinates: -66, -32, 32) (Fig. 5B).
After inclusive masking, one isolated effect with significant activity was located in the left supramarginal gyrus without correction for multiple testing (t = 3.64; puncorrected = 0.000; peak x, y, z coordinates: -66, -32, 32) (Fig. 5C).
Model 2.2: Compensation related to the spatial abilities composite score
A model with hippocampal atrophy as mask (puncorrected < 0.01) for activity positively correlated with the spatial abilities composite score also did not show any significant results (pFWE < 0.05 or puncorrected < 0.001). Please see the Supplementary Material for details.
Repetition of fMRI analyses in a subsample with positive blood biomarkers for amyloid positivity
Model 1.3: Compensation related to performance in the episodic memory fMRI task in a subsample with positive blood biomarkers for amyloid positivity
A contrast for the positive correlation between activity and hippocampal atrophy was calculated (puncorrected < 0.01) (Fig. 6A). The clusters with strongest activity were detected in the left middle temporal gyrus (t = 5.50; puncorrected = 0.000; peak x, y, z coordinates: -66, -10,-20), the right angular gyrus (t = 5.41; puncorrected = 0.000; peak x, y, z coordinates: 48, -64, 18) and left cerebral white mater/temporal pole (t = 5.27; puncorrected = 0.000; peak x, y, z coordinates: -44, 4,-22).
Fig. 6A
Greater activity related to greater hippocampal atrophy in the episodic memory task (cued recall > control contrast, puncorrected < 0.01), used as mask in a subsample with positive blood biomarkers for amyloid positivity. Activity was detected in the left middle temporal gyrus, the right angular gyrus and left cerebral white mater/temporal pole. b) Greater activity related to high episodic memory task accuracy (cued recall > control contrast, before masking) was located in the right calcarine cortex, the left middle frontal gyrus, the left cerebral white matter and opercular part of the inferior frontal gyrus. R, right; P, posterior.
Task accuracy was not positively correlated to significant brain activity when corrected for multiple testing (pFWE < 0.05). Without correction for multiple testing, the strongest activity was located in the right calcarine cortex (t = 4.80; puncorrected = 0.000; peak x, y, z coordinates: 8, -84, -2), the left middle frontal gyrus (t = 4.70; puncorrected = 0.000; peak x, y, z coordinates: -26, 6, 56) and the left cerebral white matter/opercular part of the inferior frontal gyrus (t = 4.46; puncorrected = 0.000; peak x, y, z coordinates: -48, 16, 16) (Fig. 6B).
Also in this contrast no voxel survived when the binary mask for hippocampal atrophy was applied (puncorrected < 0.001).
Model 1.4: Compensation related to the memory composite score in a subsample with positive blood biomarkers for amyloid positivity
A model with hippocampal atrophy as mask (puncorrected < 0.01) for activity positively correlated with episodic memory task accuracy did not show any significant results (pFWE < 0.05 or puncorrected < 0.001). Please see the Supplementary Material for details.
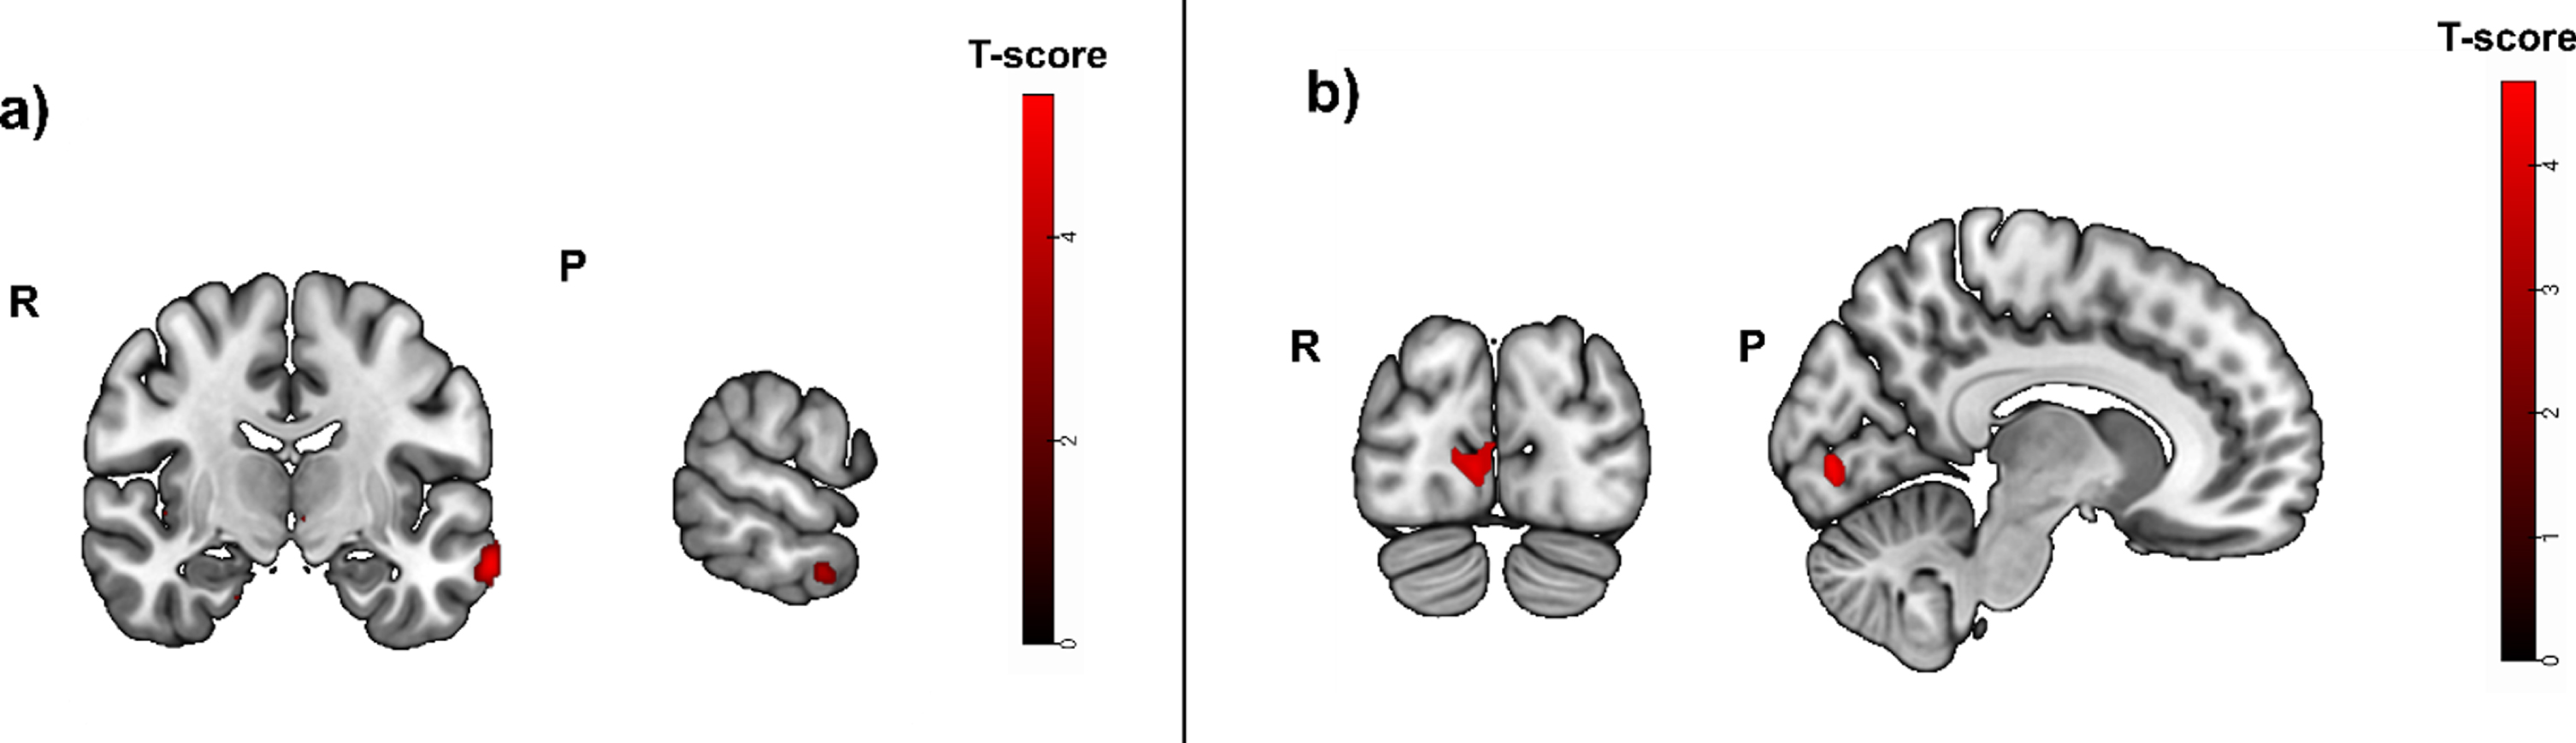
3.7.3Model 2.3: Compensation related to performance in the spatial abilities fMRI task in a subsample with positive blood biomarkers for amyloid positivity
The [translation+rotation]>luminance conditions contrast showed the strongest activity (puncorrected < 0.01) positively correlated with hippocampal atrophy in the left middle frontal gyrus (t = 5.24; puncorrected = 0.000; peak x, y, z coordinates: -40, 2, 60), the left superior frontal gyrus (t = 4.95; puncorrected = 0.000; peak x, y, z coordinates: -24, 10, 66), and the left superior frontal gyrus medial segment (t = 4.81; puncorrected = 0.000; peak x, y, z coordinates: -6, 64, 24) (Fig. 7A).
Fig. 7A
Greater activity related to greater hippocampal atrophy in the spatial abilities task ([translation+rotation]>luminance conditions contrast, puncorrected < 0.01), used as mask in a subsample with positive blood biomarkers for amyloid positivity. Activity was detected in the left middle frontal gyrus, the left superior frontal gyrus and the left superior frontal gyrus medial segment. b) Greater activity related to high spatial abilities task accuracy (before masking) was located in the right medial orbital gyrus and the gyrus rectus (puncorrected < 0.001).
![Greater activity related to greater hippocampal atrophy in the spatial abilities task ([translation+rotation]>luminance conditions contrast, puncorrected < 0.01), used as mask in a subsample with positive blood biomarkers for amyloid positivity. Activity was detected in the left middle frontal gyrus, the left superior frontal gyrus and the left superior frontal gyrus medial segment. b) Greater activity related to high spatial abilities task accuracy (before masking) was located in the right medial orbital gyrus and the gyrus rectus (puncorrected < 0.001).](https://content.iospress.com:443/media/jad/2023/93-1/jad-93-1-jad221001/jad-93-jad221001-g007.jpg)
No significant results remained after pFWE < 0.05 correction when positive correlations with the spatial abilities task accuracy were calculated. Without correction for multiple testing (puncorrected < 0.001) the only significant cluster was located in the right medial orbital gyrus (t = 4.56; puncorrected = 0.000; peak x, y, z coordinates: 14, 26, -30) and close by in the gyrus rectus (t = 3.68; puncorrected = 0.001; peak x, y, z coordinates: 6, 24, -32) (Fig. 7B).
After inclusive masking no significant voxel survived (puncorrected < 0.001).
Model 2.4: Compensation related to the spatial abilities composite score in a subsample with positive blood biomarkers for amyloid positivity
A model with hippocampal atrophy as mask (puncorrected < 0.01) for activity positively correlated with the spatial abilities composite score also did not show any significant results (pFWE < 0.05 or puncorrected < 0.001). Please see the Supplementary Material for details.
DISCUSSION
In the present study, we investigated if neuronal compensation existed in a sample of older adults with SCD. We employed two fMRI tasks targeting different cognitive domains. Both tasks should induce activity in the parietal lobe, which is affected by neuropathology early in the course of AD.
We did not find strong evidence for compensatory brain activity in either of the two tasks. The model for the complete sample in the spatial abilities task (model 2.1) showed a very small effect in the left supramarginal gyrus uncorrected for multiple comparisons. This brain region has been associated with working memory and attention. It is part of the fronto-parietal attentional control network and crucial for spatial working memory [59]. Another study reported compensatory activity in the left parietal lobe in early neurodegeneration [11], which is located closely to the effect we detected.
However, in fMRI studies, a common minimal cluster size is ten voxels [59]. Regarding the very small size of three voxels, the small t-value (t = 3.64) and the location of our finding at the outer grey matter/CSF border, this result must be interpreted with caution. In a subsample with blood biomarkers indicating amyloid positivity, and in subsamples based on residuals of regressions of task performance and hippocampal atrophy, we found no evidence for neuronal compensation.
Whole brain analysis for the contrast cued recall > control in the face-occupation task showed the strongest activity in the occipital lobe and the left ventral diencephalon. The activity over the occipital lobe was partially caused by the visually different stimuli in both conditions [46]. The cluster including the left diencephalon encompassed also structures like the parahippocampal gyrus and the hippocampus, which can be expected when using a task targeting episodic memory [16]. The whole brain analysis for the [translation+rotation]>luminance conditions contrast in the spatial abilities task showed the strongest activation in the inferior occipital gyrus encompassing several structures from the parietal and occipital lobe in both hemispheres. This corresponds to the activity pattern reported for young adults in this task [49]. Our results show that the selection of tasks and contrasts was appropriate for eliciting activity in the parietal cortex.
Previous research supports the existence of neuronal compensation [11, 13, 14, 26]. However, there are substantial differences between these and the present study, which might explain the different findings. The other studies included different samples for healthy controls and participants affected by SCD [11, 13, 14] and MCI [26]. To fulfil the criteria of successful compensation, greater activity has to be related to better performance. In studies including SCD as well as healthy controls this correlation would appear in the SCD sample only [60]. This has been the case in the studies from Erk et al. [13] and Corriveau-Lecavalier et al. [11, 61]. As only these two studies fulfil the criteria for successful compensation in SCD our results indicate that compensation in this population is not a stable finding.
While the absence of clear compensatory brain activity in our full sample might be due to the inclusion of subjects without neuropathology this explanation is less likely in the subset with positive blood biomarkers for amyloid positivity. For the identification of amyloid positivity, we relied on relatively new blood biomarkers for amyloid-β and pTau181. The Aβ42/40 ratio has shown to be a good measure for amyloid PET status [62]. In our sample, eight participants were positive for amyloid pathology according to the cut-off score. To increase sample size, we also included participants with high plasma pTau181 values. This blood biomarker predicted amyloid PET positivity [63]. It is possible that current plasma pTau181 measures are not sensitive enough to differentiate within a sample of SCD for amyloid positivity yet. This assumption is supported by the lack of a correlation between pTau181 values and our measure of hippocampal atrophy (r = –0.13, p = 0.44), which was correlated with the Aβ42/40 ratio (r = – 0.55, p < 0.001) also when corrected for age.
It is possible that different patterns of brain activity in neuronal compensation occur in our study sample. Therefore, it might be interesting to investigate single subject data to identify groups with different patterns of compensatory activity in a future study. Another statistical approach would be to investigate fMRI data with dimensional reduction methods following, e.g., an independent component analysis [64]. It is possible that such alternative approaches would lead to different results but with the downside of inflating the number of tests.
Limitations
We included no sample of healthy subjects, which might have facilitated the detection of neuronal compensation.
We used hippocampal volume as a proxy for disease load and therefore refer to it as hippocampal atrophy. This term reflects our interpretation of volume, but we have no knowledge on longitudinal changes in hippocampal size of participants. Therefore, it is possible that some participants with high hippocampal atrophy according to our study results were actually born with a relatively small hippocampus and no atrophy occurred. Data for blood-based biomarkers was available for 38 participants, resulting in a final sample of 23 participants with biomarker values indicating amyloid positivity. This sample size might have been too small to find subtle effects of early AD related pathology in brain activity. Additionally, in our sample only eight participants were positive for amyloid pathology according to the cut-off score for the Aβ42/40 ratio. A larger number might have been necessary to detect neuronal compensation. This limitation can also be applied to the sample as a whole.
As mentioned in the introduction, SCD is non-specific and can appear as an early sign of cognitive decline but also as consequence of psychiatric disorders [2]. Therefore, our sample probably included SCD due to different causes, while compensatory activity in SCD is mostly expected to be a result of beginning neurodegeneration. This heterogeneity might have reduced our ability to detect strong compensatory brain activity on the group level.
While our approach focused on increased brain activity, also reduced activity and network connectivity have been observed in SCD [65]. The authors of this review suggest a model where neuronal connectivity is related to SCD stage (i.e., after increased connectivity due to noisy signal propagation and potential compensation in early SCD connectivity decreases). In our sample we considered SCD as one category and did not include the onset of SCD as potential moderating factor of compensatory effects. But we expect hippocampal atrophy as an indicator of disease load to increase in the course of SCD.
Conclusion
Our study did not provide conclusive evidence for compensatory brain activity in older adults with SCD in tasks targeting episodic memory or spatial abilities. It is possible that SCD is too early in the process of neurodegeneration to elicit compensatory activity or that this activity is too divergent among individuals given the broad definition of SCD in combination with the sample size used. Future studies could emphasize on detecting compensation in the individual as interventions such a transcranial electric current stimulation could be adapted to the individual’s pattern of compensation.
ACKNOWLEDGMENTS
We would like to thank Tania Geiger, Dominique Hürzeler, Julia Hübscher, Fiona Pfister, and Raphaela Zwimpfer for their help with the cognitive assessments. Additionally, we would like to thank all participants for their commitment.
FUNDING
This research was funded by the Swiss National Science Foundation (SNSF; grant number 32003B_189240).
CONFLICT OF INTEREST
The authors declare that the research was conducted in the absence of any commercial or financial relationships that could be construed as a potential conflict of interest.
DATA AVAILABILITY
The relevant data for this publication is openly available in the “Bern Open Repository and Information System” at https://doi.org/10.48620/66.
SUPPLEMENTARY MATERIAL
[1] The supplementary material is available in the electronic version of this article: https://dx.doi.org/10.3233/JAD-221001.
REFERENCES
[1] | Zullo L , Clark C , Gholam M , Castelao E , von Gunten A , Preisig M , Popp J ((2021) ) Factors associated with subjective cognitive decline in dementia-free older adults-A population-based study. Int J Geriatr Psychiatry 36: , 1188–1196. |
[2] | Jessen F , Amariglio RE , Buckley RF , van der Flier WM , Han Y , Molinuevo JL , Rabin L , Rentz DM , Rodriguez-Gomez O , Saykin AJ , Sikkes SAM , Smart CM , Wolfsgruber S , Wagner M ((2020) ) The characterisation of subjective cognitive decline. Lancet Neurol 19: , 271–278. |
[3] | Hao L , Xing Y , Li X , Mu B , Zhao W , Wang G , Wang T , Jia J , Han Y ((2019) ) Risk factors and neuropsychological assessments of subjective cognitive decline (plus) in Chinese memory clinic. Front Neurosci 13: , 846. |
[4] | Koppara A , Wagner M , Lange C , Ernst A , Wiese B , König H-H , Brettschneider C , Riedel-Heller S , Luppa M , Weyerer S , Werle J , Bickel H , Mösch E , Pentzek M , Fuchs A , Wolfsgruber S , Beauducel A , Scherer M , Maier W , Jessen F ((2015) ) Cognitive performance before and after the onset of subjective cognitive decline in old age. Alzheimers Dement (Amst) 1: , 194–205. |
[5] | Pike KE , Cavuoto MG , Li L , Wright BJ , Kinsella GJ ((2022) ) Subjectivecognitive decline: Level of risk for future dementia and mildcognitive impairment, a meta-analysis of longitudinal studies. Neuropsychol Rev 32: , 703–735. |
[6] | Wang X , Huang W , Su L , Xing Y , Jessen F , Sun Y , Shu N , Han Y ((2020) ) Neuroimaging advances regarding subjective cognitive decline in preclinical Alzheimer’s disease. Mol Neurodegener 15: , 55. |
[7] | Amariglio RE , Mormino EC , Pietras AC , Marshall GA , Vannini P , Johnson KA , Sperling RA , Rentz DM ((2015) ) Subjective cognitive concerns, amyloid-β, and neurodegeneration in clinically normal elderly. Neurology 85: , 56–62. |
[8] | Perrotin A , La Joie R , de La Sayette V , Barrée L , Mézenge F , Mutlu J , Guilloteau D , Egret S , Eustache F , Chételat G ((2017) ) Subjective cognitive decline in cognitively normal elders from the community or from a memory clinic: Differential affective and imaging correlates. Alzheimers Dement 13: , 550–560. |
[9] | Verberk IMW , Thijssen E , Koelewijn J , Mauroo K , Vanbrabant J , de Wilde A , Zwan MD , Verfaillie SCJ , Ossenkoppele R , Barkhof F , van Berckel BNM , Scheltens P , van der Flier WM , Stoops E , Vanderstichele HM , Teunissen CE ((2020) ) Combination of plasma amyloid beta(1-42/1-40) and glial fibrillary acidic protein strongly associates with cerebral amyloid pathology. Alzheimers Res Ther 12: , 118. |
[10] | Mielke MM , Hagen CE , Xu J , Chai X , Vemuri P , Lowe VJ , Airey DC , Knopman DS , Roberts RO , Machulda MM , Jack CR , Petersen RC , Dage JL ((2018) ) Plasma phospho-tau181 increases with Alzheimer’s disease clinical severity and is associated with tau- and amyloid-positron emission tomography. Alzheimers Dement 14: , 989–997. |
[11] | Corriveau-Lecavalier N , Duchesne S , Gauthier S , Hudon C , Kergoat M-J , Mellah S , Belleville S ((2020) ) A quadratic function ofactivation in individuals at risk of Alzheimer’s disease. Alzheimers Dement (Amst) 12: , e12139. |
[12] | Leal SL , Landau SM , Bell RK , Jagust WJ ((2017) ) Hippocampal activation is associated with longitudinal amyloid accumulation and cognitive decline. Elife 6: , e22978. |
[13] | Erk S , Spottke A , Meisen A , Wagner M , Walter H , Jessen F ((2011) ) Evidence of neuronal compensation during episodic memory in subjective memory impairment. Arch Gen Psychiatry 68: , 845–852. |
[14] | Rodda JE , Dannhauser TM , Cutinha DJ , Shergill SS , Walker Z ((2009) ) Subjective cognitive impairment: Increased prefrontal cortexactivation compared to controls during an encoding task. Int JGeriatr Psychiatry 24: , 865–874. |
[15] | Pini L , Wennberg AM ((2021) ) Structural imaging outcomes in subjective cognitive decline: Community vs. clinical-based samples. Exp Gerontol 145: , 111216. |
[16] | Tromp D , Dufour A , Lithfous S , Pebayle T , Després O ((2015) ) Episodic memory in normal aging and Alzheimer disease: Insights from imaging and behavioral studies. Ageing Res Rev 24: , Part B 232–262. |
[17] | Insel PS , Mormino EC , Aisen PS , Thompson WK , Donohue MC ((2020) ) Neuroanatomical spread of amyloid β and tau in Alzheimer’sdisease: Implications for primary prevention . Brain Commun 2: , fcaa007. |
[18] | Sperling RA , Dickerson BC , Pihlajamaki M , Vannini P , LaViolette PS , Vitolo OV , Hedden T , Becker JA , Rentz DM , Selkoe DJ , Johnson KA ((2010) ) Functional alterations in memory networks in early Alzheimer’s disease. Neuromolecular Med 12: , 27–43. |
[19] | Cabeza R (2002) Hemispheric Asymmetry Reduction in Older Adults: The HAROLD Model. |
[20] | Wagner AD , Shannon BJ , Kahn I , Buckner RL ((2005) ) Parietal lobe contributions to episodic memory retrieval. Trends Cogn Sci 9: , 445–453. |
[21] | Sestieri C , Shulman GL , Corbetta M ((2017) ) The contribution of the human posterior parietal cortex to episodic memory. Nat Rev Neurosci 18: , 183–192. |
[22] | Edde M , Dilharreguy B , Theaud G , Chanraud S , Helmer C , DartiguesJ-F , Amieva H , Allard M , Descoteaux M , Catheline G ((2020) ) Age-related change in episodic memory: Role of functional andstructural connectivity between the ventral posterior cingulate andthe parietal cortex. Brain Struct Funct 225: , 2203–2218. |
[23] | Mitolo M , Gardini S , Fasano F , Crisi G , Pelosi A , Pazzaglia F , Caffarra P ((2013) ) Visuospatial memory and neuroimaging correlates in mild cognitive impairment. J Alzheimers Dis 35: , 75–90. |
[24] | Fasano F , Mitolo M , Gardini S , Venneri A , Caffarra P , Pazzaglia F ((2018) ) Combining structural magnetic resonance imaging and visuospatial tests to classify mild cognitive impairment. Curr Alzheimer Res 15: , 237–246. |
[25] | Cona G , Scarpazza C ((2019) ) Where is the “where” in the brain? A meta-analysis of neuroimaging studies on spatial cognition. Hum Brain Mapp 40: , 1867–1886. |
[26] | Jacobs HIL , Boxtel MPJV , Heinecke A , Gronenschild EHBM , Backes WH , Ramakers IHGB , Jolles J , Verhey FRJ ((2012) ) Functional integration ofparietal lobe activity in early Alzheimer disease. Neurology 78: , 352–360. |
[27] | Gregory S , Long Jeffrey D , Tabrizi SJ , Rees G ((2017) ) Measuring compensation in neurodegeneration using MRI. Curr Opin Neurol 30: , 380–387. |
[28] | Brill E , Krebs C , Falkner M , Peter J , Henke K , Züst M , Minkova L , Brem A-K , Klöppel S ((2022) ) Can a serious game-based cognitive training attenuate cognitive decline related to Alzheimer’s disease? Protocol for a randomized controlled trial. BMC Psychiatry 22: , 552. |
[29] | Molinuevo JL , Rabin LA , Amariglio R , Buckley R , Dubois B , Ellis KA , Ewers M , Hampel H , Klöppel S , Rami L , Reisberg B , Saykin AJ , Sikkes S , Smart CM , Snitz BE , Sperling R , Flier van der WM , Wagner M , Jessen F ((2017) ) Implementation of subjective cognitive decline criteria in research studies. Alzheimers Dement 13: , 296–311. |
[30] | Petersen RC ((2016) ) Mild cognitive impairment. Continuum (Minneap Minn) 22: , 404–418. |
[31] | Carson N , Leach L , Murphy KJ ((2018) ) A re-examination of Montreal Cognitive Assessment (MoCA) cutoff scores. Int J Geriatr Psychiatry 33: , 379–388. |
[32] | Fazekas F , Barkhof F , Wahlund LO , Pantoni L , Erkinjuntti T , Scheltens P , Schmidt R ((2002) ) CT and MRI rating of white matter lesions. Cerebrovasc Dis 13: , 31–36. |
[33] | Nasreddine ZS , Phillips NA , Bédirian V , Charbonneau S , Whitehead V , Collin I , Cummings JL , Chertkow H ((2005) ) The Montreal Cognitive Assessment, MoCA: A brief screening tool for mild cognitive impairment. J Am Geriatr Soc 53: , 695–699. |
[34] | VLMT –Verbaler Lern- und Merkfähigkeitstest –Hogrefe Verlag,https://www.testzentrale.ch/shop/verbaler-lern-und-merkfaehigkeitstest.html. |
[35] | Rey A ((1941) ) L’examen psychologique dans les cas d’encéphalopathie traumatique.(Les problems.). Arch Psychol 28: , 215–285. |
[36] | Zelazo PD , Anderson JE , Richler J , Wallner-Allen K , Beaumont JL , Conway KP , Gershon R , Weintraub S ((2014) ) NIH Toolbox Cognition Battery (CB): Validation of executive function measures in adults. J Int Neuropsychol Soc 20: , 620–629. |
[37] | McKenna PAT , Warrington EK ((1980) ) Testing for nominal dysphasia. J Neurol Neurosurg Psychiatry 43: , 781–788. |
[38] | Guay F , Vallerand RJ , Blanchard C ((2000) ) On the assessment of situational intrinsic and extrinsic motivation: The Situational Motivation Scale (SIMS). Motiv Emot 24: , 175–213. |
[39] | Endicott J , Nee J , Harrison W , Blumenthal R ((1993) ) Quality of LifeEnjoyment and Satisfaction Questionnaire: A new measure. Psychopharmacol Bull 29: , 321–326. |
[40] | Graf C ((2008) ) The Lawton instrumental activities of daily living scale. Am J Nurs 108: , 52–62; quiz 62-63. |
[41] | Oldfield RC ((1971) ) The assessment and analysis of handedness: The Edinburgh inventory. Neuropsychologia 9: , 97–113. |
[42] | Yesavage JA , Brink TL , Rose TL , Lum O , Huang V , Adey M , Leirer VO ((1983) ) Development and validation of a geriatric depressionscreening scale: A preliminary report. J Psychiatr Res 17: , 37–49. |
[43] | Baykara E , Kuhn C , Linz N , Tröger J , Karbach J ((2022) ) Validationof a digital, tablet-based version of the Trail Making Test in theΔelta platform. Eur J Neurosci 55: , 461–467. |
[44] | Thijssen EH , Verberk IMW , Vanbrabant J , Koelewijn A , Heijst H , Scheltens P , van der Flier W , Vanderstichele H , Stoops E , Teunissen CE ((2021) ) Highly specific and ultrasensitive plasma test detects Abeta(1-42) and Abeta(1-40) in Alzheimer’s disease. Sci Rep 11: , 9736. |
[45] | Klink K , Peter J , Wyss P , Klöppel S ((2020) ) Transcranial electriccurrent stimulation during associative memory encoding: ComparingtACS and tDCS effects in healthy aging. Front Aging Neurosci 12: , 66. |
[46] | de Quervain DJ-F , Papassotiropoulos A ((2006) ) Identification of a genetic cluster influencing memory performance and hippocampal activity in humans. Proc Natl Acad Sci U S A 103: , 4270–4274. |
[47] | Wagner M , Wolf S , Reischies FM , Daerr M , Wolfsgruber S , Jessen F , Popp J , Maier W , Hull M , Frolich L , Hampel H , Perneczky R , Peters O , Jahn H , Luckhaus C , Gertz H-J , Schroder J , Pantel J , Lewczuk P , Kornhuber J , Wiltfang J ((2012) ) Biomarker validation of a cued recall memory deficit in prodromal Alzheimer disease. Neurology 78: , 379–386. |
[48] | Ebner NC , Riediger M , Lindenberger U ((2010) ) FACES—A database of facial expressions in young, middle-aged, and older women and men: Development and validation. Behav Res Methods 42: , 351–362. |
[49] | Seydell-Greenwald A , Ferrara K , Chambers CE , Newport EL , Landau B ((2017) ) Bilateral parietal activations for complex visual-spatial functions: Evidence from a visual-spatial construction task. Neuropsychologia 106: , 194–206. |
[50] | Suzuki A , Shinozaki J , Yazawa S , Ueki Y , Matsukawa N , Shimohama S , Nagamine T ((2018) ) Establishing a new screening system for mild cognitive impairment and Alzheimer’s disease with mental rotation tasks that evaluate visuospatial function. J Alzheimers Dis 61: , 1653–1665. |
[51] | Penny WD , Friston KJ , Ashburner JT , Kiebel SJ , Nichols TE (2011) Statistical parametric mapping: The analysis of functional brain images, Elsevier. |
[52] | RStudio Team (2015) RStudio: integrated development for R. RStudio Inc., Boston, MA. MA. |
[53] | Vannini P , O’Brien J , O’Keefe K , Pihlajamäki M , LaViolette P , Sperling RA ((2011) ) What goes down must come up: Role of theposteromedial cortices in encoding and retrieval. Cereb Cortex 21: , 22–34. |
[54] | Klöppel S , Vongerichten A , Eimeren van T , Frackowiak RSJ , Siebner HR ((2007) ) Can left-handedness be switched? Insights from an early switch of handwriting. J Neurosci 27: , 7847–7853. |
[55] | Klöppel S , Gregory S , Scheller E , Minkova L , Razi A , Durr A , Roos RAC , Leavitt BR , Papoutsi M , Landwehrmeyer GB , Reilmann R , Borowsky B , Johnson H , Mills JA , Owen G , Stout J , Scahill RI , Long JD , Rees G , Tabrizi SJ ((2015) ) Compensation in preclinical Huntington’s disease: Evidence from the Track-On HD Study. EBio Medicine 2: , 1420–1429. |
[56] | Spets DS , Slotnick SD ((2021) ) Are there sex differences in brain activity during long-term memory? A systematic review and fMRI activation likelihood estimation meta-analysis. Cogn Neurosci 12: , 163–173. |
[57] | Verberk IMW , van Harten AC , Gouda M , Hussainali Z , van Engelen M-PE , Wilson D , Lemstra AW , Pijnenburg YAL , van der Flier WM , Teunissen CE ((2022) ) Implementation of the Alzheimer’s blood-based biomarker panelin clinical practice: The development of cutoffs for plasmaAbeta1-42/1-40, P-tau181, GFAP and NfL across the clinicalcontinuum. Alzheimers Dement 18: , e064069. |
[58] | Bayoumy S , Verberk IMW , den Dulk B , Hussainali Z , Zwan M , van der Flier WM , Ashton NJ , Zetterberg H , Blennow K , Vanbrabant J , Stoops E , Vanmechelen E , Dage JL , Teunissen CE ((2021) ) Clinical and analytical comparison of six Simoa assays for plasma P-tau isoforms P-tau181, P-tau217, and P-tau231. Alzheimers Res Ther 13: , 198. |
[59] | Paulraj SR , Schendel K , Curran B , Dronkers NF , Baldo JV ((2018) ) Role of the left hemisphere in visuospatial working memory. J Neurolinguistics 48: , 133–141. |
[60] | Scheller E , Schumacher LV , Peter J , Lahr J , Wehrle J , Kaller CP , Gaser C , Kloppel S ((2018) ) Brain aging and APOE epsilon4 interact to reveal potential neuronal compensation in healthy older adults. Front Aging Neurosci 10: , 74. |
[61] | Corriveau-Lecavalier N , Rajah MN , Mellah S , Belleville S ((2021) ) Latent patterns of task-related functional connectivity in relation to regions of hyperactivation in individuals at risk of Alzheimer’s disease. Neuroimage Clin 30: , 102643. |
[62] | Li Y , Schindler SE , Bollinger JG , Ovod V , Mawuenyega KG , Weiner MW , Shaw LM , Masters CL , Fowler CJ , Trojanowski JQ , Korecka M , Martins RN , Janelidze S , Hansson O , Bateman RJ ((2022) ) Validation of plasma amyloid-β 42/40 for detecting Alzheimer disease amyloid plaques. Neurology 98: , e688–e699. |
[63] | Thijssen EH , La Joie R , Wolf A , Strom A , Wang P , Iaccarino L , Bourakova V , Cobigo Y , Heuer H , Spina S , VandeVrede L , Chai X , Proctor NK , Airey DC , Shcherbinin S , Duggan Evans C , Sims JR , Zetterberg H , Blennow K , Karydas AM , Teunissen CE , Kramer JH , Grinberg LT , Seeley WW , Rosen H , Boeve BF , Miller BL , Rabinovici GD , Dage JL , Rojas JC , Boxer AL ((2020) ) Diagnostic value of plasma phosphorylated tau181 in Alzheimer’s disease and frontotemporal lobar degeneration. Nat Med 26: , 387–397. |
[64] | Erhardt EB , Rachakonda S , Bedrick EJ , Allen EA , Adali T , Calhoun VD ((2011) ) Comonparis of multi-subject ICA methods for analysis of fMRI data. Hum Brain Mapp 32: , 2075–2095. |
[65] | Viviano RP , Damoiseaux JS ((2020) ) Functional neuroimaging insubjective cognitive decline: Current status and a research pathforward. Alzheimers Res Ther 12: , 23. |

