
The Potential Role of Gustatory Function as an Early Diagnostic Marker for the Risk of Alzheimer’s Disease in Subjective Cognitive Decline
Abstract
Background:
Patients with subjective cognitive decline (SCD) report memory deterioration and are at an increased risk of converting to Alzheimer’s disease (AD) although psychophysical testing does not reveal any cognitive deficit.
Objective:
Here, gustatory function is investigated as a potential predictor for an increased risk of progressive cognitive decline indicating higher AD risk in SCD.
Methods:
Measures of smell and taste perception as well as neuropsychological data were assessed in patients with subjective cognitive decline (SCD): Subgroups with an increased likelihood of the progression to preclinical AD (SCD+) and those with a lower likelihood (SCD–) were compared to healthy controls (HC), patients with mild cognitive impairment and AD patients. The Sniffin’ Sticks test contained 12 items with different qualities and taste was measured with 32 taste stripes (sweet, salty, bitter, sour) of different concentration.
Results:
Only taste was able to distinguish between HC/SCD– and SCD+ patients.
Conclusion:
This study provides a first hint of taste as a more sensitive marker than smell for detecting preclinical AD in SCD. Longitudinal observation of cognition and pathology are necessary to further evaluate taste perception as a predictor of pathological objective decline in cognition.
INTRODUCTION
Neuropathological changes of Alzheimer’s disease (AD) develop years before first cognitive deficits occur [1, 2]. There is an urgent need for non-invasive and cost-efficient diagnostic tests to distinguish between healthy individuals and people who have a higher risk of developing AD. Only early identification of higher risk patients with validated, easily applicable tests could enable the early implementation of goal-directed therapy. Therefore, transitional AD stages have been defined, namely subjective cognitive decline (SCD) and mild cognitive impairment (MCI).
MCI represents a transitional stage between normal aging and AD [3]. Patients are suffering from subjective complaints and manifest impairments in memory performance, but activities of daily living are not affected [4]. SCD is characterized by a mere subjective decline in cognition in the absence of any impairment in usual objective cognitive tests. SCD patients are at an increased risk of future cognitive decline and of developing MCI or AD [5–7], especially those with consistent worries about their cognitive status who have a four times higher risk compared to individuals without worries [8]. As other pathological processes than AD could underlie SCD and as not every patient suffering from SCD has to develop AD, research criteria for an increased likelihood of preclinical AD in SCD were defined by the working group of the Subjective Cognitive Decline Initiative (SCD-I) [9]. According to these, SCD plus criteria patients report a subjective decline in memory rather than in other cognitive domains with an onset within the last 5 years at an age of at least 60 years as well as SCD associated worries, namely the feeling that they perform worse compared to others of the same age group [9]. The presence of preclinical AD in SCD can be further supported by neuroimaging such as magnetic resonance imaging (MRI), single-photon emission computed tomography (SPECT), positron emission tomography (PET), or the examination of the cerebrospinal fluid (CSF), blood, saliva, or urine [10–12]. However, neuroimaging is expensive, sometimes invasive and exhausting but other objective tests are currently scarce. Therefore, it is essential to establish new methods that can reliably and effectively differentiate between SCD patients at higher and those at lower risk.
A simple objective measure to validate the increased likelihood of preclinical AD in SCD could be provided by the Sniffin’ Sticks test, a smell test measuring the performance by matching sniffing pens with an odor. So far, olfaction has been well-established for early detection of MCI patients who are likely to be in the transitional phase of AD. Early AD associated tau pathologies affect, among others, the olfactory system [13] and hence might reduce olfactory functions [14]. Patients in early stages of AD show a deterioration of olfactory functions [14–16] and their impaired odor identification ability is associated with an increased risk of AD [17]. Olfactory functions have been investigated in MCI and AD and allowed the differentiation between patients and HC [18, 19]. Yet, in a meta-analysis effect sizes which hint to an impairment of olfaction in earlier stages of AD are very small [20] and the Sniffin’ Sticks test does not seem to be sensitive enough to distinguish between SCD and HC[21, 22].
Another potential measure is taste sensitivity. While a high prevalence of olfactory deficits is described in the literature (>24%), especially with increasing age (>62% in people between 80 and 97 years) [23], only 5% of general population show deficits of gustatory functions [24]. Moreover, olfactory functions are strongly connected with gustatory functions and have shown overlapping neuronal activation in regions such as the insula, amygdala, or orbitofrontal cortex [25]. According to current knowledge, there are some studies that have dealt with the function of taste in patients with AD, but their results are inconsistent. Earlier investigations negated gustatory impairment in AD [26, 27] or only found decreases in certain taste qualities [28], while more recent studies observed gustatory impairment in AD [29–32]. Concerning the question whether taste is affected in earlier stages of AD, a study compared MCI with HC and AD [18]. MCI and AD patients performed worse in the taste test compared to HC. There were no differences regarding taste between MCI and AD. The authors concluded that taste can be useful to differentiate between MCI/AD and HC in a clinical context. These results suggest that, next to olfaction, gustatory function could be a potential predictor for transitional stages of AD and furthermore leads to the question whether taste is also impairedin SCD.
This study investigated the functions of taste and smell in patients with SCD, MCI and AD and compared it to HC. As SCD patients’ clinical backgrounds are heterogeneous, criteria provided by Jessen et al. [9] were applied to differentiate between SCD patients who have a lower risk (SCD–) to develop AD and those with a slightly increased risk of later cognitive decline and are assumed to be in a preclinical stage of AD (SCD plus; here referred to as SCD+), who are assumed to be in a preclinical stage of AD. We expected that SCD+ patients would have lower taste scores than HC and SCD– patients. Accordingly, we expect taste to be more sensitive in distinguishing SCD+ and SCD– patients as compared to smell and neuropsychological data.
METHODS
Sample
A prior G*Power Analysis [33] for between-subject comparison with an expected effect size of d = 1.06 (taste left between HC and MCI in [18]) and a target power = 0.95 resulted in a suggested sample size of 19 participants in each group (total sample size for comparison of HC and SCD: n = 38). In total, 115 participants (20 healthy, 95 patients) were recruited in 2017 and 2018. They gave written informed consent for participating in this study, which was approved by the Ethics committee of the Otto-von-Guericke University Magdeburg. HC were recruited via the DZNE data base. HC with a Mini-Mental State Examination (MMSE) value below 27, diagnosed depression or medication affecting the central nervous system were excluded from the study. Patients were recruited in the memory clinic of the German Center of Neurodegenerative Diseases (DZNE) in Magdeburg. A trained neurologist (WG) diagnosed SCD, MCI, and AD. SCD was diagnosed according to criteria from Jessen et al. [9], MCI according to Winblad et al. [34] and AD according to McKhann and the revised NIA-AA criteria [35].
All 115 recruited subjects underwent the CERAD-Plus test battery in the memory clinic (detailed in Materials and Procedure). Afterwards, 17 patients with other diseases than SCD, MCI, or AD were excluded from the study resulting in 98 remaining participants: 20 HC, 23 SCD, 31 MCI, 24 AD (Fig. 1). Three patients were younger than 55 years or older than 90 years (1 SCD, 1 MCI, 1 AD). Questionnaire data revealed that three participants (2 SCD, 1 MCI) had drunken or eaten 60 min prior to the taste-test and one MCI patient was suffering from oral mucositis. They were excluded. Four outliers (2 HC, 1 SCD, 1 MCI) below or above 2 standard deviations from the mean in smell and taste scores and seven incomplete data sets were excluded (2 SCD, 4 MCI, 1 AD), too. After exclusion 80 participants (18 HC, 17 SCD, 23 MCI, and 22 AD) were included in the analysis (Fig. 1).
Fig. 1
Sample and procedure.
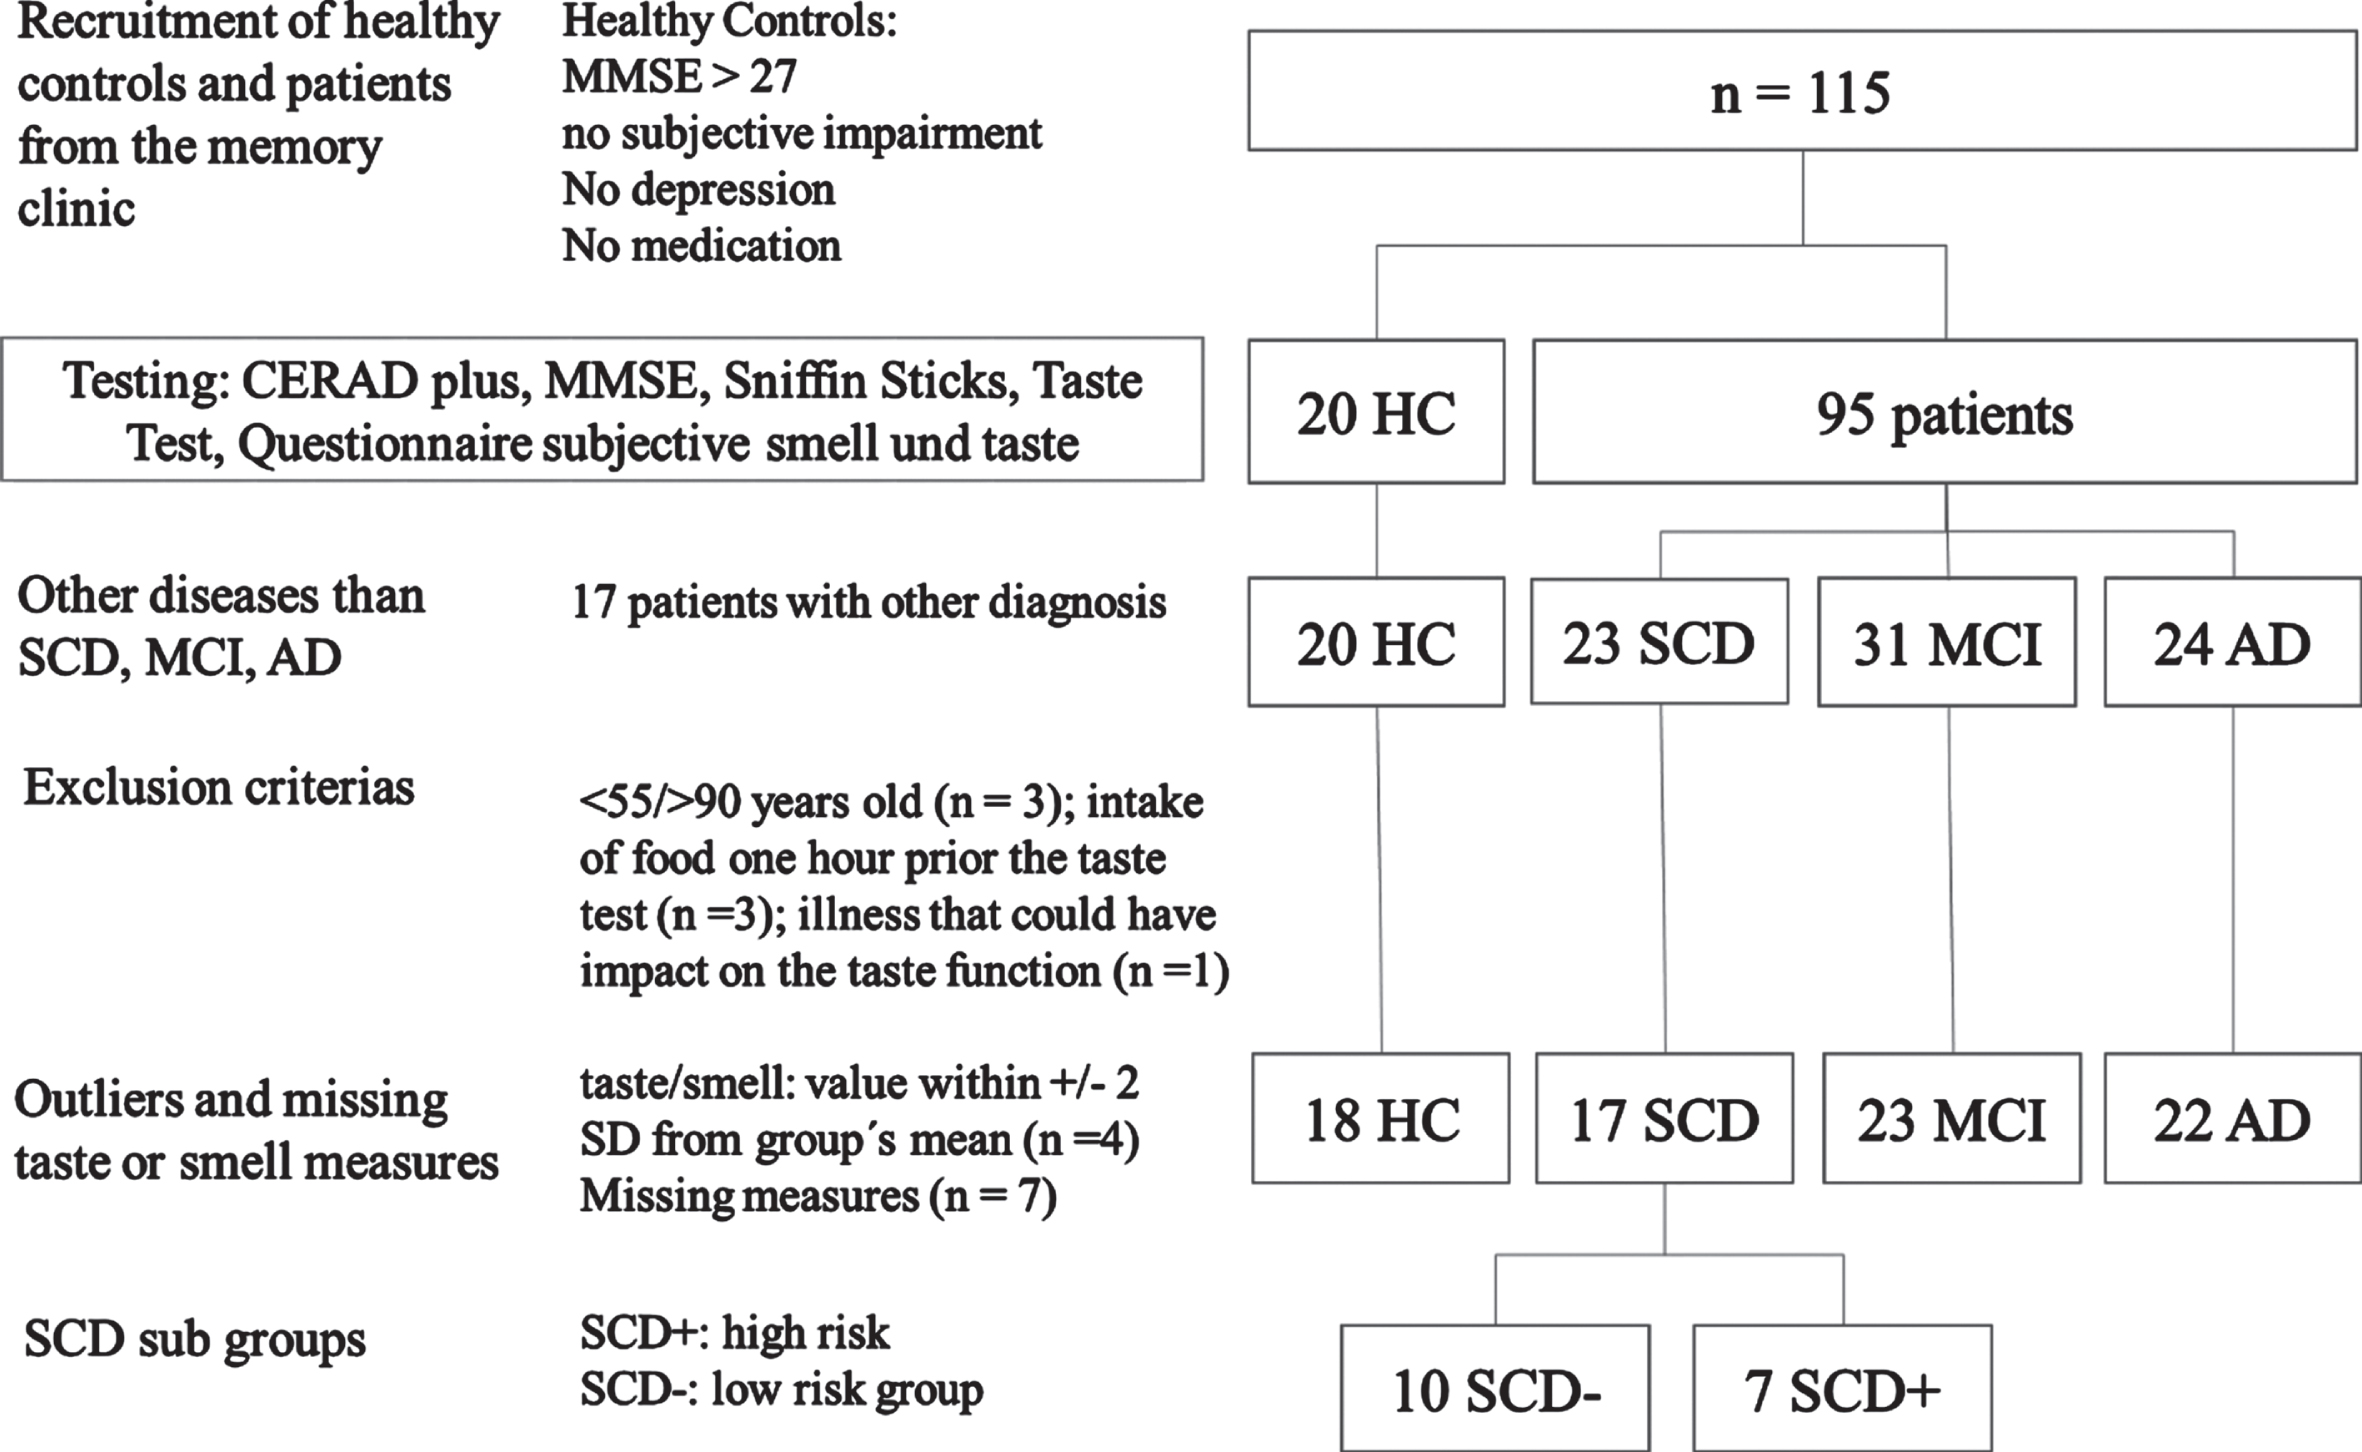
Classification of SCD patients into the subgroups of “SCD– ” and “SCD+” was conducted by a trained neurologist (WG). Patients were assigned to the SCD+ group if they met the “Research criteria for pre-MCI” and at least 3 of the 5 “SCD Plus criteria” by Jessen et al. [9]. The “Research criteria for pre-MCI” assume that patients themselves notice a decline in cognitive function compared to a previous normal state of health without an acute event. At the same time, an overall inconspicuous result must be achieved in neuropsychological tests. Furthermore, MCI or AD must not have already been diagnosed. In addition, the patients in this group were not allowed to have any previously or newly diagnosed depression or depressive episode. The additional “SCD Plus criteria” include 1) subjective deterioration of memory function rather than other domains, 2) concerns about SCD, 3) age >60 years, 4) feeling of performing worse than peers, 5) starting SCD within the past five years. SCD patients who did not meet at least 3 of 5 of these criteria were automatically classified as SCD– [9].
Materials and procedure
All participants underwent the common cognitive assessment of the DZNE’s memory clinic, which contains the extended and validated German version of the Consortium to Establish a Registry for Alzheimer’s disease – Neuropsychological Battery (CERAD-Plus) [36]. Moreover, the Geriatric Depression Scale (GDS) [37] and the smell test “Sniffin’ Sticks” [38] were conducted.
In addition to the usual memory clinic procedure, taste performance, self-reported smell as well as self-reported taste functions were assessed. Participants had to answer the questions “How well would you rate your smell/taste performance?” using a Likert-Scale from 0 (not existent) to 10 (very well) similar to Steinbach et al. [18]. In order to keep conditions across participants constant, HC underwent the same measurement. The session took 60–90 min for each participant.
Neuropsychological assessment
The CERAD-Plus includes the MMSE, a screening instrument evaluating the cognitive status by measuring short-term memory, concentration, temporal and spatial orientation, language and executive functions. A maximum of 30 points can be reached in the MMSE. The CERAD-Plus further includes subtests for verbal episodic learning and memory (Wordlist– Encoding, Delayed recall and Recognition), visuo-constructive abilities (Figures– Copy), visual episodic memory (Figures– Delayed recall), confrontational word retrieval (15-item Boston Naming Test, BNT), and executive functions (phonemic and semantic verbal fluency, and Trail Making Tests (TMT) A and B. For all subtests, raw scores and z-scores, adjusted for age, gender, and education were derived. Here, we report data for memory and executive function measured by wordlist delayed recall, figure delayed recall, BNT, verbal fluency, TMT A/B, and MMSE.
Sniffin’ sticks test
The Sniffin’ Sticks Screening 12 Test (Burghart Messtechnik GmbH, Wedel, Germany) was used to test the olfactory functions of patients and HC [38]. The test consists of 12 pens, each containing a different odor. The odor pens were held under the patient’s nose at a distance of 2 centimeters for about 3 s [38]. The participant was then asked to report the kind of odor from four different options in a multiple-forced-choice procedure (odor identification). A maximum result of 12 points was possible. The whole test took about 5 min.
Taste test
A validated filter paper method measured the perception of taste (Burghart Messtechnik GmbH, Wedel, Germany). This identification test uses taste strips containing the four taste qualities sweet, sour, salty, and bitter and was carried out as suggested by Landis et al. [39]. The participants were asked not to drink or to eat anything 1 h before the testing took place. Between each test strip, participants were offered a sip of water to neutralize the previous taste. The strips were presented to each subject in a counterbalanced order and ascending concentrations alternately on the right and on the left side of the tongue (Table 1). The sequence with which the taste strips were presented was based on a study by Mueller et al. [40]. During the test participants had to have their mouth opened while giving an answer indicating one of the four tastes from a list in a forced-choice procedure. 16 strips were tested on the left and 16 on the right side of the tongue, thus all four taste qualities in four different concentrations. Means of the total taste were added from trials of the left and the right side of the tongue. A maximum score of 32 points was possible.
Table 1
Sequence of the presented taste strips (according to Mueller et al, 2003). The scheme starts with the lowest concentration (4 = lowest concentration) and continues with rising concentrations (1 = highest concentration). The test started on the left side of the tongue and both sides were tested alternately
| Left | Right | Left | Right | ||
| 1 | Sweet 4 | Sour 4 | 9 | Salty 2 | Bitter 2 |
| 2 | Bitter 4 | Salty 4 | 10 | Sour 2 | Sweet 2 |
| 3 | Salty 4 | Bitter 4 | 11 | Sweet 2 | Sour 2 |
| 4 | Sour 4 | Sweet 4 | 12 | Sour 2 | Salty 2 |
| 5 | Sour 3 | Salty 3 | 13 | Salty 1 | Sweet 1 |
| 6 | Sweet 3 | Bitter 3 | 14 | Bitter 1 | Sour 1 |
| 7 | Bitter 3 | Sweet 3 | 15 | Bitter 1 | Salty 1 |
| 8 | Salty 3 | Sour 3 | 16 | Sweet 1 | Bitter 1 |
Data analysis
IBM SPSS Statistics 22 was employed for the statistical analysis. Means and standard deviations are reported. Outliers below or above 2 standard deviations from the mean in smell and taste values within diagnostic groups were excluded (2 HC, 1 SCD, 1 MCI). All variables were tested for normal distribution using the Shapiro-Wilk test. Age was not normally distributed in AD and education was not normally distributed in MCI. Concerning neuropsychological assessment, only the subtest wordlist delayed recall was normally distributed in the investigated groups HC, SCD–, and SCD+. MMSE was not normally distributed in HC and SCD, while GDS was not normally distributed in HC, MCI, and AD. Furthermore, education and GDS were not normally distributed in SCD+. In SCD–, all variables mentioned so far were normally distributed. However, smell judgements were not normally distributed in SCD and SCD–. Taste was normally distributed in all groups.
For the comparison between the different groups one-way ANOVAs and Kruskal-Wallis Tests (for non-parametric testing) were applied. First, the main groups were compared (HC, SCD, MCI, AD). The subgroups of SCD patients were included in the subsequent analyses resulting in five groups (HC, SCD–, SCD+, MCI, AD). For parametric post-hoc analysis LSD correction was used, for Kruskal-Wallis post-hoc, adjusted significance levels are given by multiplying the unadjusted significance values by the number of comparisons. Neuropsychological assessment was only analyzed between HC, SCD–, and SCD+. For TMT A/B missing data of 3 subjects decreased the sample size of SCD+ (n = 6) and SCD– (n = 8).
In general, for clearer understanding the comparisons are illustrated in a common figure depicting total SCD group comparisons and sub group comparisons with SCD– and SCD+. The alpha level was set to p > 0.05. Furthermore, we correlated the outcome variables (Spearman, rs) for main and subgroups and reported the correlations, corrected for multiple comparisons. Moreover, receiver operating characteristics (ROC) curves were used to compare specificity, sensitivity, and area under the curve (AUC) of smell and taste judgements to distinguish SCD, SCD+, and MCI from HC as well as SCD+ from SCD–. A cut-off value was determined by means of the Youden-Index.
RESULTS
Sample
The analyzed sample included 18 HC, 17 SCD, 23 MCI, and 22 AD. The division of SCD patients resulted in 10 SCD– and 7 SCD+ patients. Demographic data (Table 2) of all 80 participants show that age, education, MMSE and GDS were significantly different (p < 0.05).
Table 2
Demographic data
| Sample | HC | SCD | SCD– | SCD+ | MCI | AD | χ2 | p | |
| (n = 80) | (n = 18) | (n = 17) | (n = 10) | (n = 7) | (n = 23) | (n = 22) | main/sub | main/sub | |
| Female | 38 | 10 | 8 | 6 | 2 | 8 | 12 | ||
| Age | 74.1 (±7.4) | 73.5 (±4.8) | 71.7 (±7) | 68.9 (±5.7) | 75.1 (±7.2) | 73.0 (±8.2) | 77.8 (±7.7) | 10.19/14.57 | 0.017/0.006 |
| Education | 13.0 (±2.7) | 14.3 (±2.2) | 13.8 (±2.7) | 13.2 (±2.3) | 14.7 (±3.3) | 13.0 (±2.7) | 11.2 (±2.3) | 15.16/16.22 | 0.002/0.003 |
| MMSE | 24.7 (±5.2) | 29.1 (±1.0) | 28.1 (±1.5) | 28.1 (±1.2) | 28.1 (±0.9) | 25.1 (±2.4) | 17.8 (±4.2) | 61.4/61.4 | 0.001/0.001 |
| GDS | 2.7 (±2.9) | 0.4 (±0.6) | 3.7 (±2.7) | 4.8 (±2.9) | 2.0 (±1.4) | 4.2 (±3.6) | 2.4 (±2.1) | 25.47/27.82 | 0.001/0.001 |
Sex (number of females), years of age and education, the Mini-Mental State Examination (MMSE) and the Geriatric Depression Scale are shown for healthy controls (HC), subjective cognitive decline (SCD) patients divided in patients with higher (+) and lower (–) risk to develop objective cognitive decline and patients with mild cognitive impairment (MCI) and Alzheimer’s disease (AD). Numbers, means, standard deviations, χ2 and p values are given for main group comparison (HC, SCD, MCI, AD) and subgroup comparison (HC, SCD–, SCD+, MCI, and AD).
Post-hoc tests indicate that age in AD patients differs from SCD patients (z = –2.85, p < 0.05) and SCD– patients (z = –3.52, p < 0.05). AD patient showed significantly less years of education compared to SCD (z = 2.90, p < 0.05) and HC (z = 3.62, p < 0.01). GDS values were significantly lower in HC compared to SCD (z = –4.25, p < 0.001), SCD– (z = –4.43, p < 0.001), MCI (z = –4.53, p < 0.001), and AD (z = –3.28, p = 0.006).
Concerning the MMSE differences, HC reached significantly higher values compared to MCI (z = 4.07, p < 0.001) and AD (z = 7.24, p < 0.001). AD performed significantly lower than SCD (z = 5.73, p < 0.001), SCD– (z = –4.9, p < 0.001), SCD+ (z = 4.20, p < 0.001), and MCI (z = 3.42, p = 0.006). The subgroups SCD– and SCD+ did not differ in MMSE. Four persons scored as hypogeusia (taste strips cut-off value 9, [39]), 51 as hyposmia, and 16 as anosmia (Sniffin’ Sticks hyposmia: 6–10, anosmia: 0–6, [41]). No healthy control was hypogeusic or anosmic.
Neuropsychological assessment
The comparison of HC, SCD–, and SCD+ concerning neuropsychological functions revealed no significant differences for wordlist delayed recall, figure delayed recall, BNT, verbal fluency, or TMT A/B. In contrast, the ANOVA including HC, SCD–, and SCD+ showed that taste judgements were significantly lower in SCD+ compared to HC (95% -CI [–10.10, –1.05], p = 0.017) and SCD– (95% -CI [–12.08, –2.06], p = 0.007), while Sniffin’ Sticks values did not differ (Table 3).
Table 3
Results of neuropsychological assessments, Sniffin’ Sticks and Taste testing
| Test | HC | SCD– | SCD+ | F/χ2 | p |
| Boston Naming task | 14.67 (±1.08) | 14.40 (±0.84) | 14.14 (±0.90) | 1.15 | 0.563 |
| Verbal fluency | 21.72 (±4.62) | 20.40 (±7.82) | 21.14 (±6.47) | 0.38 | 0.981 |
| Word list delayed recall | 91.93 (±14.13) | 102.3 (±24.67) | 92.86 (±19.18) | 1.06 | 0.358 |
| Figure delayed recall | 95.67 (±11.40) | 91.10 (±14.22) | 80.57 (±31.30) | 1.37 | 0.504 |
| Trail Making Test A/B | 2.14 (±0.62) | 2.39 (±0.63) | 2.32 (±0.96) | 1.01 | 0.602 |
| Sniffin’ Sticks | 9.06 (±1.47) | 9.80 (±1.23) | 8.86 (±1.78) | 2.23 | 0.328 |
| Taste Test | 19.00 (±4.13) | 20.50 (±6.19) | 13.43 (±5.19) | 4.49 | 0.019 |
Self-rated assessment of smell and taste quality
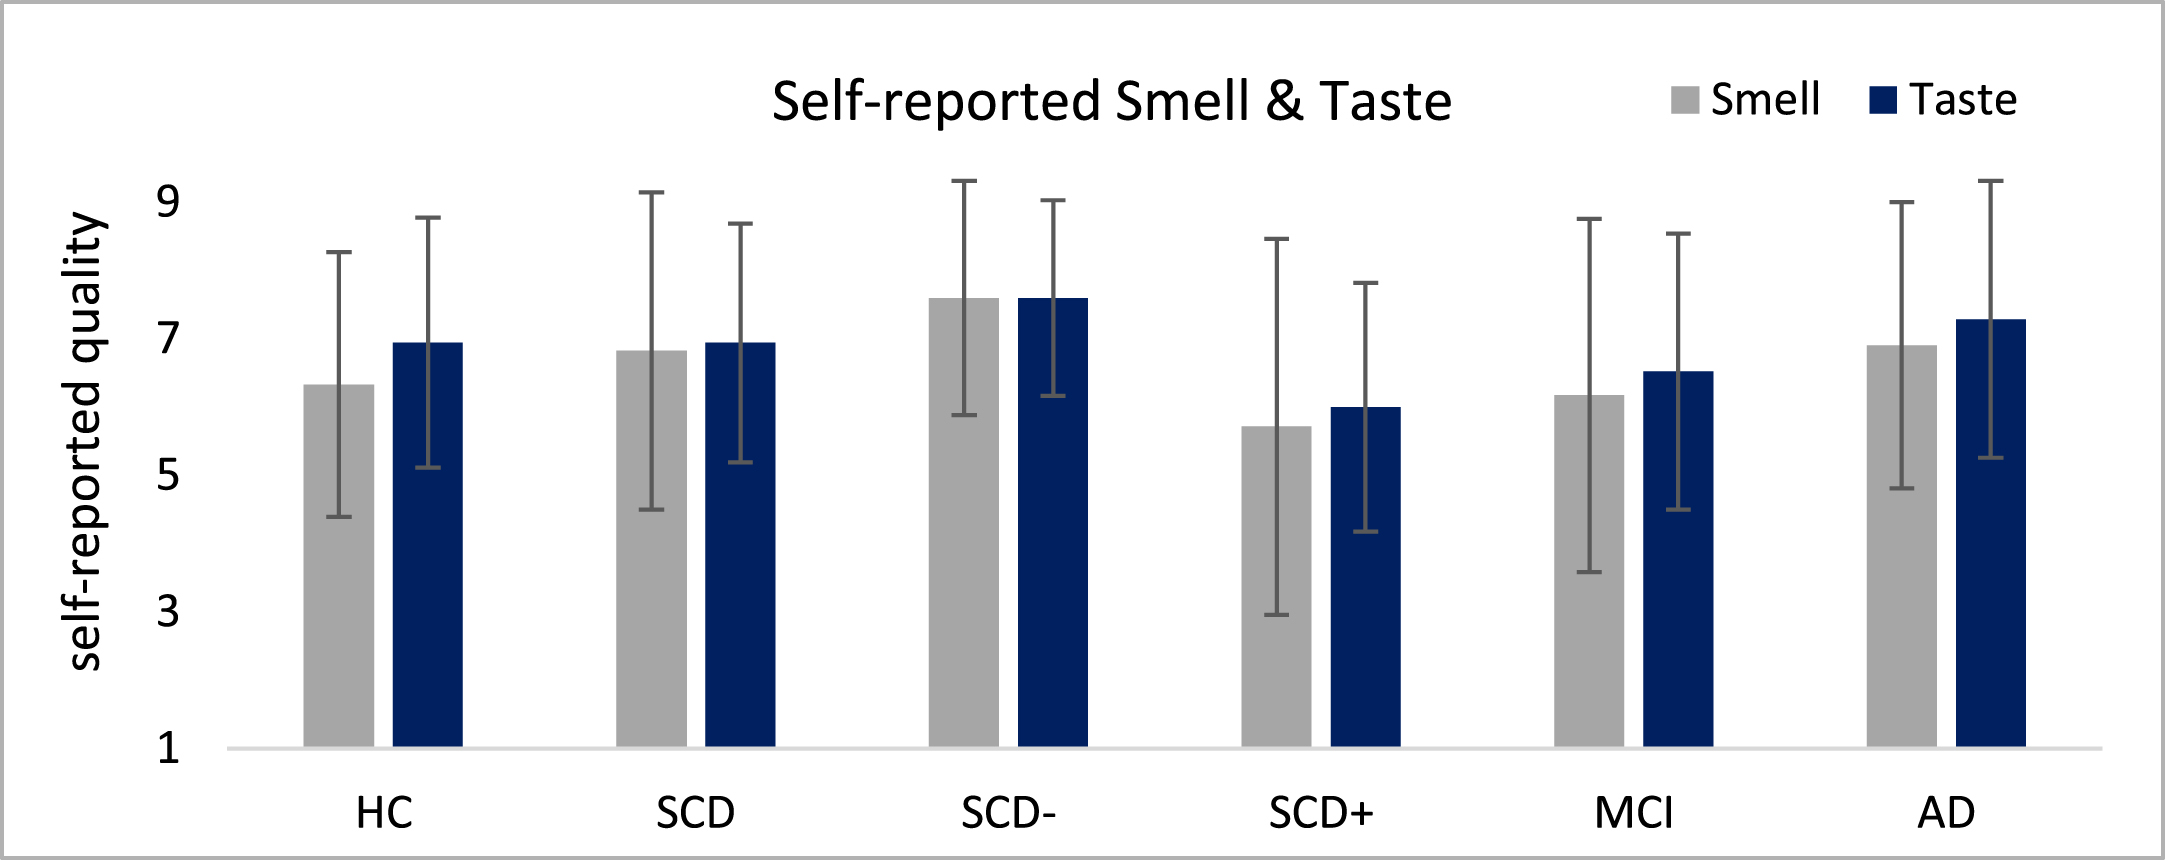
The assessments of self-reported smell and taste functions indicated subtle descriptive differences between the groups which however did not reach significance in non-parametric analyses (Fig. 2). SCD– and SCD+ patients differed in smell (1.89 points, dCohen >0.8) and taste (1.6 points, dCohen >0.8) on a descriptive level, but these differences failed to reach significance.
Fig. 2
Self-rating of smell and taste quality depicted on a 1–10 Likert-Scale where 1 is not present and 10 very good.
Smell performance
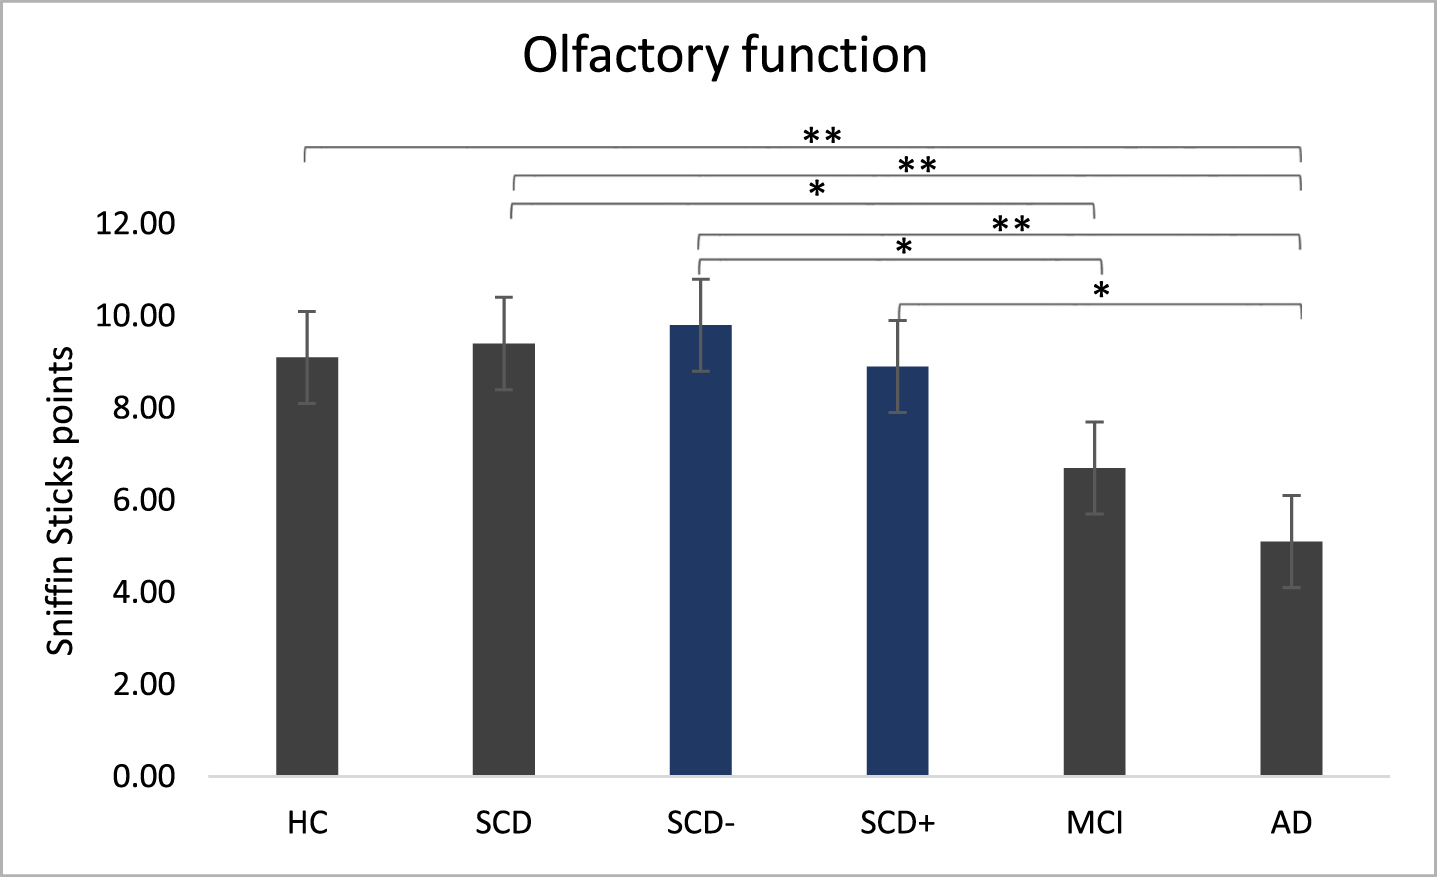
The Sniffin’ Sticks test indicated significant differences in olfactory function between the main groups (χ2(3) = 31.12, p < 0.001) and the subgroups (χ2(4) = 31.91, p < 0.001; Fig. 3).
Post-hoc tests for main groups showed significantly higher smell performance in HC than in AD (z = 4.32, p < 0.001). SCD patients outperformed AD (z = 4.81, p < 0.001) and MCI (z = 3.15, p = 0.01). The difference between HC and MCI failed to reach significance (z = 19.12, p = 0.051). Subgroup analysis indicated significantly higher smell performance in SCD– compared to MCI (z = 3.14, p = 0.017) and AD (z = 4.54, p < 0.001) as well as for SCD+ compared to AD (z = 2.98, p = 0.029). However, we found no differences between SCD+ and MCI or between SCD– and SCD+.
Fig. 3
Olfactory function. Sniffin’ Sticks performance in main groups and subgroups measured with Sniffin’ sticks test. Kruskal-Wallis were run separately for main group analysis (HC, SCD, MCI, AD) and for sub group analysis (SCD–, SCD+ added). **p < 0.001, *p < 0.05.
Taste performance
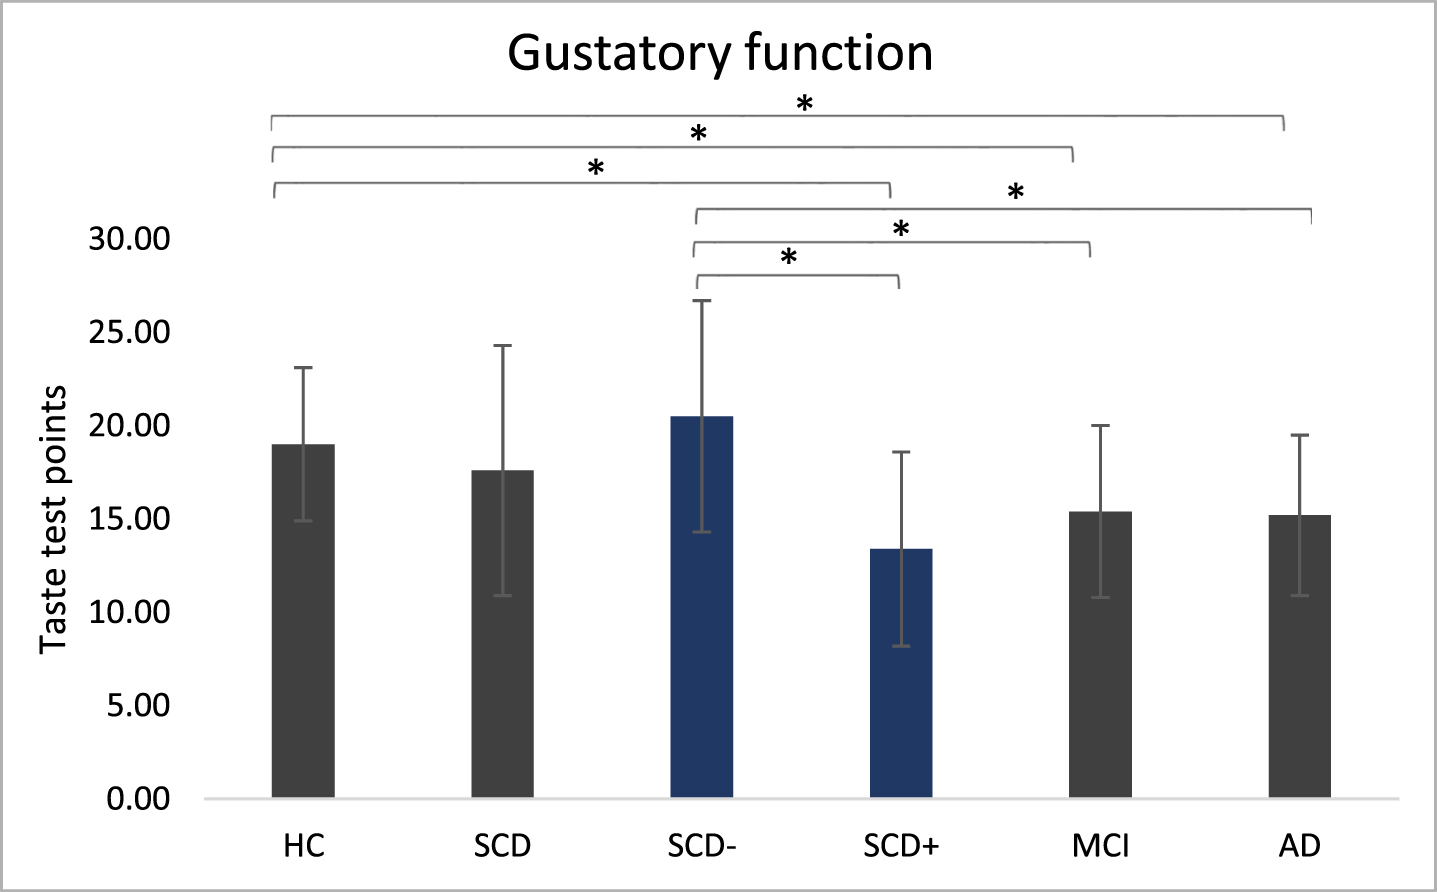
One-way ANOVAs for overall taste performance in main groups (F(3,76) = 2.75, p = 0.049, η2= 0.098) and in sub groups (F(4,75)=4.64, p = 0.002, η2= 0.198) were significant (Fig. 4). Post-hoc comparisons for main groups showed lower taste performance in MCI (95% - CI [0.56, 6.74], p = 0.021) and AD (95% -CI [0.70, 6.94], p = 0.017) compared to HC. Concerning subgroups, SCD+ performed worse compared to HC (95% -CI [1.42, 9.72], p = 0.009) and SCD– (95% -CI [2.48, 11.67], p = 0.003). SCD– showed higher taste performance compared to MCI (95% -CI [1.62, 8.68] p = 0.005) and AD (95% -CI [1.76, 8.87], p = 0.004).
Fig. 4
Gustatory function. Taste performance in main groups and subgroups measured with the taste test. ANOVAs were run separately for main group analysis (HC, SCD, MCI, AD) and for subgroup analysis (SCD–, SCD+ added). *p < 0.05.
Means of the total taste were added from trials of the left and the right side of the tongue (Table 3). For the separate sides of the tongue, Welch-ANOVAs revealed a significant effect in main groups only for the right side of the tongue, but not for the left one. For subgroups, both sides became significant (Table 4).
Table 4
Gustatory function on left and right side of the tongue
| Sample | HC | SCD | SCD– | SCD+ | MCI | AD | pmain | psub | |
| Taste total | 16.6 (±5.1) | 19.0 (±4.1) | 17.6 (±6.7) | 20.5 (±6.2) | 13.4 (±5.2) | 15.4 (±4.6) | 15.2 (±4.3) | <0.05 | <0.005 |
| Taste left | 8.0 (±2.7) | 9.2 (±2.5) | 8.1 (±3.2) | 9.7 (±3.0) | 5.7 (±1.7) | 7.3 (±2.7) | 7.7 (±2.4) | ns | <0.01 |
| Taste right | 8.6 (±2.9) | 9.8 (±2.3) | 9.5 (±3.9) | 10.8 (±3.6) | 7.7 (±3.8) | 8.0 (±2.5) | 7.5 (±2.3) | <0.05 | >0.01 |
Effect sizes and correlations
Effect sizes for Sniffin’ Sticks revealed highest Cohen’s d values (>1.0) between HC and MCI/AD and SCD and MCI/AD, but lower effect sizes for the comparison of HC and subgroups of SCD. Concerning taste, effect sizes for the comparison of HC and SCD– patients as well as for SCD– and SCD+ were higher than 1.0. In addition, SCD– versus MCI/AD showed effect sizes above 1.0. Differences and effects sizes for all group comparisons can be found in Supplementary Table 1.
Significant correlations were found between smell and taste for the total sample (rs = 0.354, p < 0.001). MMSE correlated significantly with smell (rs = 0.534, p < 0.001) and taste (rs = 0.225, p < 0.05) in the total sample. Including only main patient groups (SCD, MCI, and AD), the analysis revealed significant correlations between self-rated and psychophysically measured smell functioning (r = 0.353, p < 0.005). Psychophysically measured taste correlated with self-rated taste (rs = 0.357, p < 0.005) and with MMSE (rs = 0.502, p < 0.001). In SCD patients self-rated and measured taste was highly correlated (rs = 0.753, p < 0.001), while no correlation was found for self-rated and psychophysically measured smell. Self-rated taste correlated significantly with measured taste results in SCD– (rs = 0.637, p < 0.05), but not in SCD+. In MCI patients a significant correlation between both measures of smell was observed (rs = 0.561, p < 0.005) but no correlation for self-rated and psychophysically measured taste performance. HC and AD showed no significant correlations between those measures. We found no significant correlation between cognitive measures and gustatory or olfactory functions in HC, SCD, MCI, and AD.
Diagnostic capability (ROC)
ROC were analyzed for taste and smell in order to determine their diagnostic capability (Fig. 5) to distinguish HC from SCD/MCI/SCD+ as well as SCD+ from SCD–. The only significant diagnostic capability for smell is shown by the AUC in MCI patients versus HC (Table 5). Taste’s diagnostic capability became significant for the AUC in MCI and SCD+ compared to HC. Moreover, when relating SCD+ to SCD– the AUC reached significance. Both taste and smell tests failed to reach significant AUC in SCD compared to HC.
Fig. 5
Receiver operating curves (ROC).
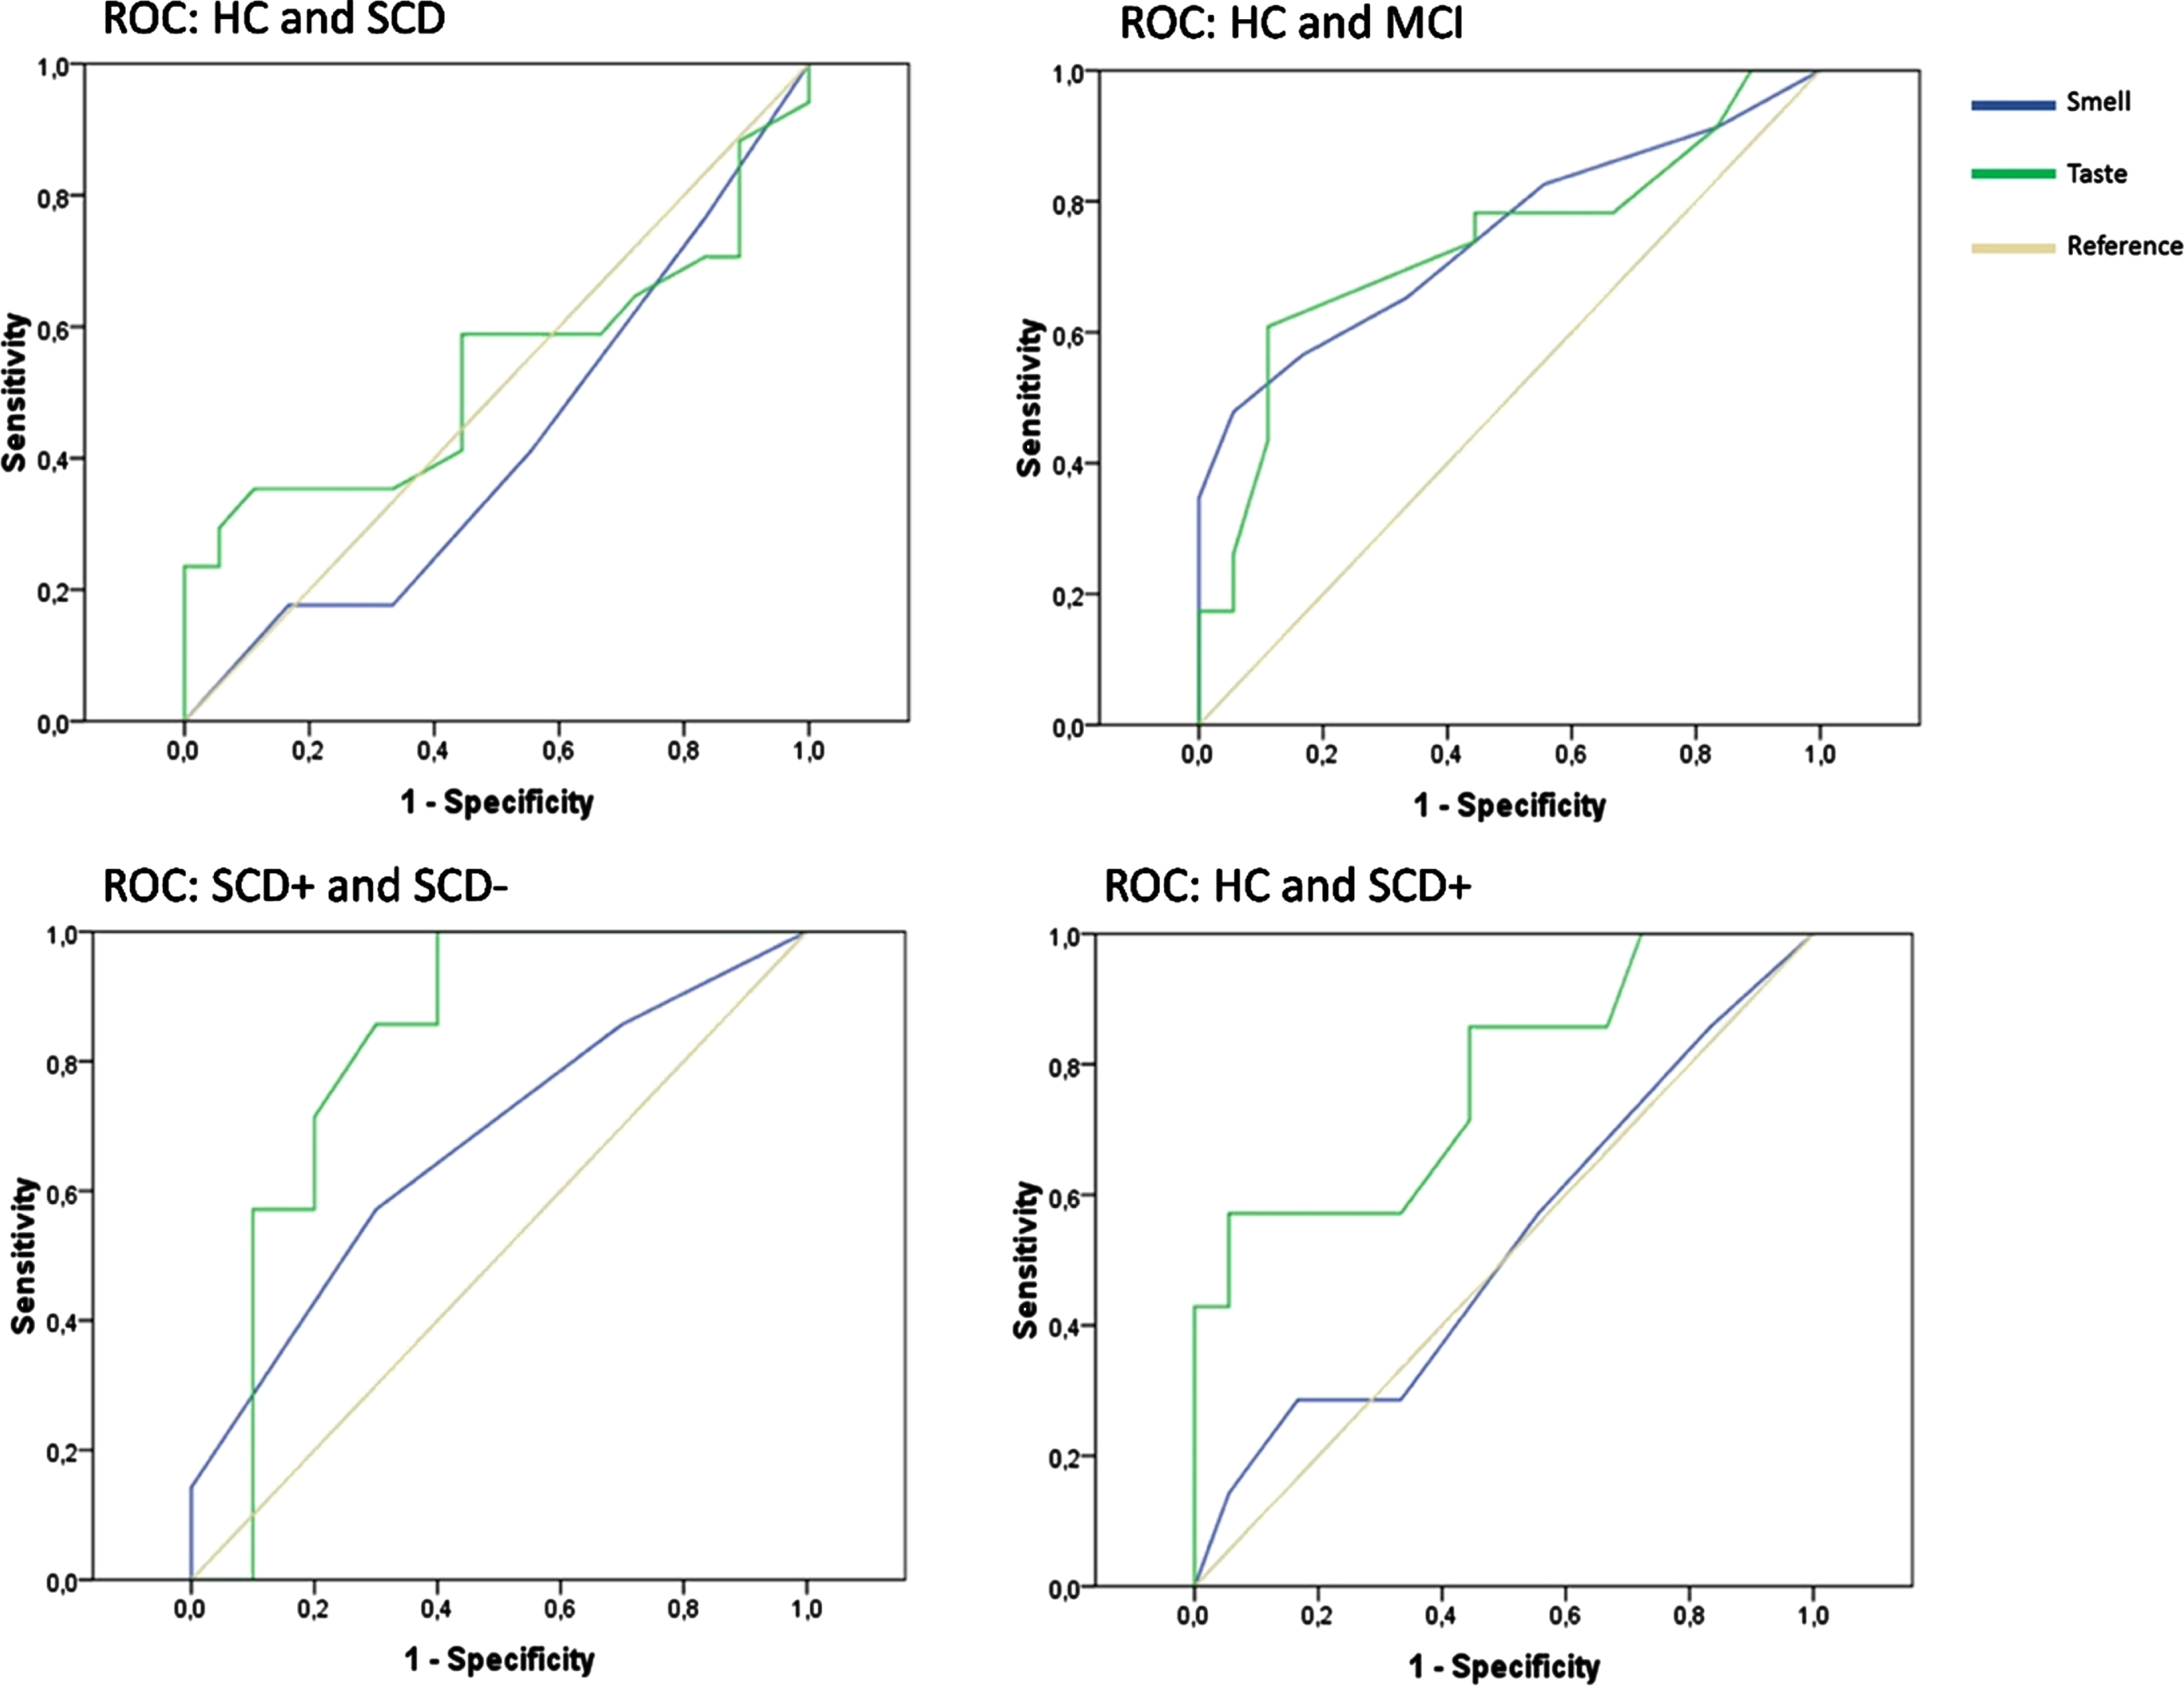
Table 5
Statistics for receiver operating curve analysis comparing taste and smell
| Patients | Reference | Test | AUC | p | Sensitivity | 1-Specificity | Cut-off | Youden |
| SCD | HC | Smell | 0.420 | >0.05 | ||||
| Taste | 0.533 | >0.05 | ||||||
| MCI | HC | Smell | 0.748 | 0.007 | 0.48 | 0.06 | 6.5 | 0.42 |
| Taste | 0.733 | 0.011 | 0.61 | 0.11 | 15.5 | 0.50 | ||
| SCD– | HC | Smell | 0.653 | >0.05 | ||||
| Taste | 0.636 | >0.05 | ||||||
| SCD+ | HC | Smell | 0.524 | >0.05 | ||||
| Taste | 0.774 | 0.037 | 0.57 | 0.06 | 13 | 0.52 | ||
| SCD– | Smell | 0.671 | >0.05 | |||||
| Taste | 0.821 | 0.028 | 1 | 0.40 | 21.5 | 0.60 |
Patients are either referenced to HC or to SCD–. Significant areas under the curve (AUC) above 0.700 are highlighted. For those, sensitivity, 1– specificity and Youden indexed cut-off values are reported.
DISCUSSION
This study investigated the gustatory and olfactory function in SCD patients with either higher or lower conversion risk to AD and compared it to cognitively normal controls, MCI, and AD patients. Higher risk SCD+, lower risk SCD– patients, and HC neither differed in MMSE nor in other neuropsychological measures of the CERAD-plus or self-rated smell or taste ability. In contrast, SCD+ patients performed worse in the gustatory test compared to SCD– or HC but similar to MCI and AD patients. None of these differences were seen in olfactory function. According to ROC statistics, the diagnostic capability of the taste test outperformed the smell test when distinguishing SCD patients with a higher risk to develop objective cognitive decline (SCD+) from those with a lower risk (SCD–) as well as HC. Smell seems rather sensitive in distinguishing MCI patients from HC.
Self-rated smell and taste perception
We found no group differences in the self-rated evaluation of olfactory and gustatory functions. Our sample rated their olfactory and gustatory functions lower than those investigated by Steinbach et al. [18]. Concerning group differences, HC in the study by Steinbach et al. rated their functions significantly better than MCI and AD patients, while our data showed no differences. A possible explanation could be that our participants were aware of the relation between smell/taste and MCI/AD because they were informed about the research question when they were asked for their written informed consent. Self-rated measures correlated with psychophysical measures when the total sample was analyzed. Similar to Steinbach and colleagues we found a correlation between self-ratings and measures for smell but not for taste in MCI patients. The lacking awareness of taste impairment was previously related to a higher risk to develop dementia [18]. In the present study an additional analysis revealed a significant relation between self-rated and measured taste in SCD– but not in SCD+. This might give evidence for a valid division into higher and lower risk groups and furthermore suggests that SCD patients with a higher risk to develop measurable cognitive impairment are not aware of their taste deficit.
Diagnostic capability of smell
We replicated the finding that smell perception differs between HC and AD patients [18]. In contrast to earlier studies showing that smell performance differed between HC and MCI patients [18], we found no statistically significant difference in means. Measuring smell in a memory clinic context by using only the identification subtest of the Sniffin’ Sticks might not allow for depicting subtle differences.
Correlations of the Sniffin’ Sticks performance with MMSE were only found when HC are neglected in the analysis. Hence, the assessed cognitive impairment is in line with measures of smell. However, olfactory functions were not able to differentiate between HC and SCD patients, which is in accordance with previous findings [21]. Splitting the SCD group into higher and lower risk patients did not result in differences in smell either, and there was only a significant diagnostic capability for MCI patients but not for SCD or SCD– /SCD+. Comparable to another study that gives evidence for decreased smell performance in converted SCD patients compared to non-converted ones [21], we showed a medium to big effect size between SCD– and SCD+ smell performance. Remembering the name of a specific odor (cherry, leather) could be a confounding bias in the Sniffin’ Sticks test. Whereas MCI are impaired in memory, the memory performance of SCD patient’s might not be influenced and smell failed to reach sufficient diagnosticsensitivity.
Diagnostic capability of taste
Similar to Steinbach et al. [18], taste did not differ between MCI and AD patients. Therefore, testing the gustatory function might have no additional predictive value compared to olfaction for these patient groups. Concerning our main aim, however, we found a difference between SCD– and SCD+, as well as between HC and SCD+. While the neuropsychological assessment did not differ between these three groups, SCD+ patients performed worse than SCD– and HC in the taste test. Moreover, the evaluation of the diagnostic capability showed significant results for taste in SCD+ and MCI. The highest probability in ROC analysis was reached when SCD+ was compared to SCD–. In line with this finding, Schiffman et al. [41] showed that the taste performance of healthy individuals with familial risk of AD worsened over a 1.5-year period. Our HC did not differ from SCD patients in gender, age, and education. Yet, there was no simple measure to identify SCD patients with higher conversion risk, as Sniffin’ Sticks, MMSE, and neuropsychological assessment did not differ between HC, SCD, and the respective subgroups. In contrast, taste was able to distinguish between those.
Subdividing the SCD group in a higher risk and a lower risk group also resulted in different GDS values as depressive symptoms lead to the allocation of a patient to the SCD– group. Therefore, the GDS showed higher values in SCD–, compared to HC. However, GDS did not correlate with taste performance in SCD main or subgroups indicating that depressive symptoms do not relate to taste performance.
Neural correlates of taste impairment in SCD
Just like olfaction, taste could be impaired in early stages of AD because taste is processed in regions that are impaired early in the pathology. Taste is processed in regions that are involved in different cortical pathways: thalamus, hypothalamus, frontal, opercular and insular taste cortex, the orbitofrontal cortex, cingulate gyrus, posterior parietal cortex, mammillary bodies, amygdala, hippocampus, and the limbic system [25, 43]. Neural regions for the presence of SCD that might be associated with taste processing are the insula, opercular regions, amygdala, and the cingulate cortex [29, 44–47]. Besides, a decrease in hippocampal volume in SCD has been shown [48, 49]. Interestingly, also the hippocampus seems to be involved in the processing of taste, as recently a subset of hippocampal cells was identified in rats that responded to taste [50]. Apart specific brain regions, the complex processing of taste also requires fine-tuned temporal patterns of activation [51]. Therefore, taste processing might require a highly sensitive network that is susceptible to disturbances due to early-stage AD pathologies. Although there are similar brain regions involved in both smell and taste, taste is processed more complex and interactions of both senses could determine the ability to distinguish between SCD+ and SCD– /HC for taste but not for smell. Furthermore, the prevalence of gustatory disorders in the general population is low (5%) compared to olfactory disorders [23, 24]. Hence, comparisons of olfactory functioning between impaired and healthy populations might be less sensitive than gustatory comparisons. In other words: As healthy individuals of older age are more frequently impaired in smell, too, our findings are of high importance as taste deteriorations and their existence may indicate a higher risk for underlying pathological development. Nevertheless, how neural pathologies in SCD patients affect taste performance partly remain to be elucidated. The decrease of taste function due to damage in gustatory areas and differences to smell performance have to be validated by using more detailed imaging techniques in SCD patients while performing taste perception tasks.
Limitation and perspective
This study investigated taste in SCD patients and gives a hint to the relation of taste performance to the individual risk of developing dementia. Nevertheless, our findings must be interpreted carefully as the sample size was small, especially when dividing SCD into subgroups. However, CIs and Cohen’s d indicate crucial effects, which is in line with previous findings [18].
The comparison of the performance levels in smell, taste and MMSE to the sample of Steinbach [18] indicated differences between both data sets. We found higher taste values in MCI and AD, smaller values in HC but also smaller variance in all groups. When we compared our smell data of HC, MCI, and AD patients, we found lower performance in our samples. This might be due to a bias in recruiting and exclusion procedures. Steinbach’s participants were younger and showed higher MMSE scores. Depressive symptoms could have influenced the data, but comparison is not possible as Steinbach et al. [18] did not report depression scores.
Another limitation complicating inferences from our data is the cross-sectional design. According to a review, the chance of progressing from SCD to objective cognitive impairment is 2.15 times higher compared to normal aging [52], but only 6.6% of SCD patients convert into MCI annually [53]. This would indicate that only 1 to 2 SCD patients of our group will develop a diagnosable MCI in a 1-year-follow-up. Therefore, large-scale longitudinal studies over decades are required to prove whether decreased taste is an early marker for progression toMCI or AD.
As the nature of smell and taste are different per se, their direct comparison is limited. As such, while the taste test used 32 test strips containing 4 qualities in different concentrations, the smell test included only 12 sticks examining 12 qualities. Maybe results would differ if both qualities were assessed to a similar extent. A more comprehensive olfactory measurement could reveal more nuanced differences between groups. Another way to validate our findings would be to investigate whether taste correlates with positive amyloid PET/CSF results or blood biomarkers [15, 54]. Clinical practice does not normally include such an invasive measure in SCD due to an unfavorable cost-benefit ratio. However, only the comparison of different potential diagnostic markers with validated methods such as Amyloid-PET or -CSF can provide valuable insights into how meaningful taste is.
Despite the fact that AD is associated with smell and taste loss, other neurodegenerative disorders may result in olfactory and/or gustatory deteriorations, too. In a large-scale prospective study [54] of 833 patients, 28.6% of patients with combined olfactory and gustatory dysfunction were diagnosed with Parkinson’s disease (PD) 15 years later. In fact, our sample might not only develop AD but also other types of dementia that are also associated with symptoms of cognitive decline. It is necessary to additionally examine the stability of our effects in other clinical cohorts and observe longitudinal gustatory functioning in SCD while relating it to prospective diagnosis.
As taste is impaired in COVID-19 patients and neurological cognitive impairments are currently discussed, this sample might present another scope in relation to taste performance, subjective cognitive decline and long-term consequences concerning their relation. These aspects might be taken into account for future research aims since this study has been conducted before the pandemic started.
The taste test can only be discussed as an additional predictive measure for differentiation between SCD– and SCD+. Nonetheless, investigating SCD is important and early diagnostic markers for AD are needed to prevent decline as early as possible. Pharmacological AD therapy aims to mitigate clinical symptoms and to maintain capabilities of daily living but does not change the disease’s progression [55]. Non-pharmacological intervention uses cognitive or physical training and targets social interaction to promote a healthy lifestyle in a preventive manner [56]. As pathologies begin years before symptoms manifest, such therapies have the highest effects when they begin as early as possible [57]. An intervention study in early stages of cognitive decline has shown that a multimodal supportive therapy combining pharmacological, physical, and nutritional aspects improved self-rated and measured cognition in SCD and MCI patients [58]. Nevertheless, concerning our small sample we advise against overinterpretation of diagnosis of SCD+ on the basis of gustatory functions. More research is needed to validate the stability of the reported results. Besides, the risk to develop cognitive impairment in SCD+ might be higher in relation to healthy individuals, but it needs to be avoided to intimidate patients without investigatingbiomarkers.
Conclusion
In conclusion, the taste test could be a superior predictive marker compared to smell because of its diagnostic capability of distinguishing HC and SCD patients with a higher risk of developing AD from patients with a lower risk and healthy ones. So far, there is not a comparable simple diagnostic tool to distinguish between those SCD patients who are more likely to develop objective cognitive decline and those who are less likely to. Further investigations of smell and taste capabilities might use a combination of both to provide comprehensive diagnostic information. However, validation against other biomarkers and further longitudinal studies are required to show the usefulness of taste for diagnosing higher risk SCD patients. For clinical practice, measuring self-rated taste and taste functioning could supply additional information to the predictive accuracy of neuropsychological tests and physiological biomarkers in order to assess the risk of developing objective cognitivedecline.
ACKNOWLEDGMENTS
The authors have no acknowledgments to report.
FUNDING
Funded by the Deutsche Forschungsgemeinschaft (DFG, German Research Foundation) – Projektnummer 491466077.
CONFLICT OF INTEREST
The authors have no funding to report.
SUPPLEMENTARY MATERIAL
[1] The supplementary material is available in the electronic version of this article: https://dx.doi.org/10.3233/ADR-220092.
REFERENCES
[1] | Jack CR , Bennett DA , Blennow K , Carrillo MC , Dunn B , Haeberlein SB , Holtzman DM , Jagust W , Jessen F , Karlawish J , Liu E , Molinuevo JL , Montine T , Phelps C , Rankin KP , Rowe CC , Scheltens P , Siemers E , Snyder HM , Sperling R , Elliott C , Masliah E , Ryan L , Silverberg N ((2018) ) 2018 National Institute on Aging-Alzheimer’s Association (NIA-AA) Research Framework NIA-AA Research Framework: Toward a biological definition of Alzheimer’s disease. Alzheimers Dement 14: , 535–562. |
[2] | Tondelli M , Wilcock GK , Nichelli P , de Jager CA , Jenkinson M , Zamboni G ((2012) ) Structural MRI changes detectable up to ten years before clinical Alzheimer’s disease. Neurobiol Aging 33: , 825–e25. |
[3] | Petersen RC , Smith GE , Waring SC , Ivnik RJ , Tangalos EG , Kokmen E ((1999) ) Mild cognitive impairment: Clinical characterization and outcome. Arch Neurol 56: , 303–308. |
[4] | Albert MS , DeKosky ST , Dickson D , Dubois B , Feldman HH , Fox NC , Gamst A , Holtzman DM , Jagust WJ , Petersen RC , Snyder PJ , Carrillo MC , Thies B , Phelps CH ((2011) ) The diagnosis of mild cognitive impairment due to Alzheimer’s disease: Recommendations from the National Institute on Aging-Alzheimer’s Association workgroups on diagnostic guidelines for Alzheimer’s disease. Alzheimers Dement 7: , 270–279. |
[5] | Jessen F , Amariglio RE , Buckley RF , van der Flier WM , Han Y , Molinuevo JL , Rabin L , Rentz DM , Rodriguez-Gomez O , Saykin AJ , Sikkes SAM , Smart CM , Wolfsgruber S , Wagner M ((2020) ) The characterisation of subjective cognitive decline. Lancet Neurol 19: , 271–278. |
[6] | Vega JN , Newhouse PA ((2014) ) Mild cognitive impairment: Diagnosis, longitudinal course, and emerging treatments. Curr Psychiatry Rep 16: , 490. |
[7] | Slot RER , Sikkes SAM , Berkhof J , Brodaty H , Buckley R , Cavedo E , Dardiotis E , Guillo-Benarous F , Hampel H , Kochan NA , Lista S , Luck T , Maruff P , Molinuevo JL , Kornhuber J , Reisberg B , Riedel-Heller SG , Risacher SL , Roehr S , Sachdev PS , Scarmeas N , Scheltens P , Shulman MB , Saykin AJ , Verfaillie SCJ , Visser PJ , Vos SJB , Wagner M , Wolfsgruber S , Jessen F , Bakardjian H , Benali H , Bertin H , Bonheur J , Boukadida L , Boukerrou N , Cavedo E , Chiesa P , Colliot O , Dubois B , Dubois M , Epelbaum S , Gagliardi G , Genthon R , Habert MO , Hampel H , Houot M , Kas A , Lamari F , Levy M , Lista S , Metzinger C , Mochel F , Nyasse F , Poisson C , Potier MC , Revillon M , Santos A , Andrade KS , Sole M , Surtee M , Thiebaud de Schotten M , Vergallo A , Younsi N , van der Flier WM ((2018) ) Subjective cognitivedecline and rates of incident Alzheimer’s disease andnon– Alzheimer’s disease dementia. Alzheimers Dement 15: , 465–476. |
[8] | Wolfsgruber S , Kleineidam L , Wagner M , Mösch E , Bickel H , Lühmann D , Ernst A , Wiese B , Steinmann S , König HH , Brettschneider C , Luck T , Stein J , Weyerer S , Werle J , Pentzek M , Fuchs A , Maier W , Scherer M , Riedel-Heller SG , Jessen F ((2016) ) Differential risk of incident Alzheimer’s disease dementia in stable versus unstable patterns of subjective cognitive decline. J Alzheimers Dis 54: , 1135–1146. |
[9] | Jessen F , Amariglio RE , Van Boxtel M , Breteler M , Ceccaldi M , Chételat G , Dubois B , Dufouil C , Ellis KA , Van Der Flier WM , Glodzik L , Van Harten AC , De Leon MJ , McHugh P , Mielke MM , Molinuevo JL , Mosconi L , Osorio RS , Perrotin A , Petersen RC , Rabin LA , Rami L , Reisberg B , Rentz DM , Sachdev PS , De La Sayette V , Saykin AJ , Scheltens P , Shulman MB , Slavin MJ , Sperling RA , Stewart R , Uspenskaya O , Vellas B , Visser PJ , Wagner M ((2014) ) A conceptualframework for research on subjective cognitive decline inpreclinical Alzheimer’s disease. Alzheimers Dement 10: , 844–852. |
[10] | Guo T , Landau SM , Jagust WJ ((2020) ) Detecting earlier stages of amyloid deposition using PET in cognitively normal elderly adults, Neurology 94: , e1512–e1524. |
[11] | Frisoni GB , Boccardi M , Barkhof F , Blennow K , Cappa S , Chiotis K , Démonet JF , Garibotto V , Giannakopoulos P , Gietl A , Hansson O , Herholz K , Jack CR , Nobili F , Nordberg A , Snyder HM , Ten Kate M , Varrone A , Albanese E , Becker S , Bossuyt P , Carrillo MC , Cerami C , Dubois B , Gallo V , Giacobini E , Gold G , Hurst S , Lönneborg A , Lovblad KO , Mattsson N , Molinuevo JL , Monsch AU , Mosimann U , Padovani A , Picco A , Porteri C , Ratib O , Saint-Aubert L , Scerri C , Scheltens P , Schott JM , Sonni I , Teipel S , Vineis P , Visser PJ , Yasui Y , Winblad B ((2017) ) Strategic roadmap for an early diagnosis of Alzheimer’s disease based on biomarkers. Lancet Neurol 16: , 661–676. |
[12] | Fletcher LCB , Burke KE , Caine PL , Rinne NL , Braniff CA , Davis HR , Miles KA , Packer C ((2013) ) Diagnosing Alzheimer’s disease: Are we any nearer to useful biomarker-based, non-invasive tests? GMS Health Technol Assess 9: , Doc01. |
[13] | Attems J , Jellinger KA ((2006) ) Olfactory tau pathology in Alzheimer disease and mild cognitive impairment. Clin Neuropathol 25: , 265. |
[14] | Sun GH , Raji CA , MacEachern MP , Burke JF ((2012) ) Olfactory identification testing as a predictor of the development of Alzheimer’s dementia: A systematic review. Laryngoscope 122: , 1455–1462. |
[15] | Doorduijn AS , de van der Schueren MAE , van de Rest O , de Leeuw FA , Fieldhouse JLP , Kester MI , Teunissen CE , Scheltens P , van der Flier WM , Visser M , Boesveldt S ((2020) ) Olfactory and gustatory functioning and food preferences of patients with Alzheimer’s disease and mild cognitive impairment compared to controls: The NUDAD project. J Neurol 267: , 144–152. |
[16] | Murphy C , Gilmore MM , Seery CS , Salmon DP , Lasker BR ((1990) ) Olfactory thresholds are associated with degree of dementia in Alzheimer’s disease. Neurobiol Aging 11: , 465–469. |
[17] | Serby M , Larson P , Kalkstein D ((1991) ) The nature and course of olfactory deficits in Alzheimer’s disease. Am J Psychiatry 148: , 357–360. |
[18] | Steinbach , Hundt , Vaitl , Heinrich , Förster , Bürger , Zahnert ((2010) ) Taste in mild cognitive impairment and Alzheimer’s disease. J Neurol 257: , 238–246. |
[19] | Devanand DP , Tabert MH , Cuasay K , Manly JJ , Schupf N , Brickman AM , Andrews H , Brown TR , DeCarli C , Mayeux R ((2010) ) Olfactory identification deficits and MCI in a multi-ethnic elderly community sample. Neurobiol Aging 31: , 1593–1600. |
[20] | Wang Q , Chen B , Zhong X , Zhou H , Zhang M , Mai N , Wu Z , Huang X , Haehner A , Chen X , Auber LA , Peng Q , Hummel T , Ning Y ((2021) ) Olfactory dysfunction is already present with subjective cognitive decline and deepens with disease severity in the Alzheimer’s disease spectrum. J Alzheimers Dis 79: , 585–595. |
[21] | Tahmasebi R , Zehetmayer S , Pusswald G , Kovacs G , Stögmann E , Lehrner J ((2019) ) Identification of odors, faces, cities and namingof objects in patients with subjective cognitive decline, mildcognitive impairment and Alzheimeŕs disease: A longitudinalstudy. Int Psychogeriatr 31: , 537–549. |
[22] | Saive AL , Royet JP , Plailly J ((2014) ) A review on the neural bases of episodic odor memory: From laboratory-based to autobiographical approaches. Front Behav Neurosci 8: , 240. |
[23] | Murphy C , Schubert CR , Cruickshanks KJ , Klein BEK , Klein R , Nondahl DM ((2002) ) Prevalence of olfactory impairment in older adults. JAMA 288: , 2307–2312. |
[24] | Welge-Lüssen A , Dörig P , Wolfensberger M , Krone F , Hummel T ((2011) ) A study about the frequency of taste disorders. J Neurol 258: , 386–392. |
[25] | Small DM , Voss J , Mak YE , Simmons KB , Parrish T , Gitelman D ((2004) ) Experience-dependent neural integration of taste and smell in the human brain. J Neurophysiol 92: , 1892–1903. |
[26] | Murphy C ((2008) ) The chemical senses and nutrition in older adults. J Nutr Elder 27: , 247–265. |
[27] | Lang CJG , Leuschner T , Ulrich K , Stößel C , Heckmann JG , Hummel T ((2006) ) Taste in dementing diseases and Parkinsonism. J Neurol Sci 248: , 177–184. |
[28] | Schiffman SS , Clark CM , Warwick ZS ((1990) ) Gustatory and olfactory dysfunction in dementia: Not specific to Alzheimer’s disease. Neurobiol Aging 11: , 597–600. |
[29] | Suto T , Meguro K , Nakatsuka M , Kato Y , Tezuka K , Yamaguchi S , Tashiro M ((2014) ) Disorders of taste cognition are associated with insular involvement in patients with Alzheimer’s disease and vascular dementia: Memory of food is impaired in dementia and responsible for poor diet. Int Psychogeriatr 26: , 1127–1138. |
[30] | Behrman S , Chouliaras L , Ebmeier KP ((2014) ) Considering the senses in the diagnosis and management of dementia. Maturitas 77: , 305–310. |
[31] | Martín ISM , Barato VP , Oliva SL , Rodríguez M , Yurrita LC , Cabañas MJC , Rojo SS , de la Calle L , Díaz EÁ , Santos YQ , Pascual PE , Nieto MV , Vilar EG ((2018) ) Body composition, dietary, and gustatory function assessment in people with Alzheimer’sdisease. Am J Alzheimers Dis Other Demen 33: , 508–515. |
[32] | Ogawa T , Irikawa N , Yanagisawa D , Shiino A , Tooyama I , Shimizu T ((2017) ) Taste detection and recognition thresholds in Japanese patients with Alzheimer-type dementia. Auris Nasus Larynx 44: , 168–173. |
[33] | Faul F , Erdfelder E , Lang AG , Buchner A ((2007) ) G* Power 3: A flexible statistical power analysis program for the social, behavioral, and biomedical sciences. Behav Res Methods 39: , 175–191. |
[34] | Winblad B , Palmer K , Kivipelto M , Jelic V , Fratiglioni L , Wahlund LO , Nordberg A , Bäckman L , Albert M , Almkvist O , Arai H , Basun H , Blennow K , De Leon M , Decarli C , Erkinjuntti T , Giacobini E , Graff C , Hardy J , Jack C , Jorm A , Ritchie K , Van Duijn C , Visser P , Petersen RC ((2004) ) Mild cognitive impairment – Beyond controversies, towards a consensus: Report of the International Working Group on Mild Cognitive Impairment. J Intern Med 256: , 240–246. |
[35] | McKhann GM , Knopman DS , Chertkow H , Hyman BT , Jack CR , Kawas CH , Klunk WE , Koroshetz WJ , Manly JJ , Mayeux R , Mohs RC , Morris JC , Rossor MN , Scheltens P , Carrillo MC , Thies B , Weintraub S , Phelps CH ((2011) ) The diagnosis of dementia due to Alzheimer’s disease: Recommendations from the National Institute on Aging-Alzheimer’s Association workgroups on diagnostic guidelines for Alzheimer’s disease. Alzheimers Dement 7: , 263–269. |
[36] | Welsh KA , Butters N , Mohs RC , Beekly D , Edland S , Fillenbaum G , Heyman A ((1994) ) The consortium to establish a registry for Alzheimer’s disease (CERAD). Part V. A normative study of the neuropsychological battery. Neurology 44: , 609–609. |
[37] | Yesavage JA ((1988) ) Geriatric Depression Scale. Psychopharmacol Bull 24: , 709–711. |
[38] | Hummel T , Sekinger B , Wolf SR , Pauli E , Kobal G ((1997) ) “Sniffin” sticks’. Olfactory performance assessed by the combined testing of odor identification, odor discrimination and olfactory threshold. Chem Senses 22: , 39–52. |
[39] | Landis BN , Welge-Luessen A , Brämerson A , Bende M , Mueller CA , Nordin S , Hummel T ((2009) ) “taste Strips” – A rapid, lateralized, gustatory bedside identification test based on impregnated filter papers. J Neurol 256: , 242–248. |
[40] | Mueller C , Kallert S , Renner B , Stiassny K , Temmel AFP , Hummel T , Kobal G ((2003) ) Quantitative assessment of gustatory function in a clinical context using impregnated “taste strips.”. Rhinology 41: , 2–6. |
[41] | Hummel T , Konnerth CG , Rosenheim K , Kobal G ((2001) ) Screening of olfactory function with a four-minute odor identification test: Reliability, normative data, and investigations in patients with olfactory loss. Ann Otol Rhinol Laryngol 110: , 976–981. |
[42] | Schiffman SS , Graham BG , Sattely-Miller EA , Zervakis J , Welsh-Bohmer K ((2002) ) Taste, smell and neuropsychological performance of individuals at familial risk for Alzheimer’s disease. Neurobiol Aging 23: , 397–404. |
[43] | Sewards TV ((2004) ) Dual separate pathways for sensory and hedonic aspects of taste. Brain Res Bull 62: , 271–283. |
[44] | Nestor PJ , Fryer TD , Smielewski P , Hodges JR ((2003) ) Limbic hypometabolism in Alzheimer’s disease and mild cognitive impairment. Ann Neurol 54: , 343–351. |
[45] | Yang Y , Zha X , Zhang X , Ke J , Hu S , Wang X , Su Y , Hu C ((2021) ) Dynamics and concordance abnormalities among indices of intrinsic brain activity in individuals with subjective cognitive decline: A temporal dynamics resting-state functional magnetic resonance imaging analysis. Front Aging Neurosci 12: , 584863. |
[46] | Sambuchi N , Geda YE , Michel BF ((2019) ) Cingulate cortex in pre-MCI cognition. Handb Clin Neurol 166: , 281–295. |
[47] | Von Gunten A , Fox NC , Cipolotti L , Ron MA ((2000) ) A volumetric study of hippocampus and amygdala in depressed patients with subjective memory problems. J Neuropsychiatry Clin Neurosci 12: , 493–498. |
[48] | Saykin AJ , Wishart HA , Rabin LA , Santulli RB , Flashman LA , West JD , McHugh TL , Mamourian AC ((2006) ) Older adults with cognitive complaints show brain atrophy similar to that of amnestic MCI. Neurology 67: , 834–842. |
[49] | Caillaud M , Hudon C , Boller B , Brambati S , Duchesne S , Lorrain D , Gagnon JF , Maltezos S , Mellah S , Phillips N , Belleville S ((2020) ) Evidence of a relation between hippocampal volume, white matter hyperintensities, and cognition in subjective cognitive decline and mild cognitive impairment. J Gerontol B Psychol Sci Soc Sci 75: , 1382–1392. |
[50] | Herzog LE , Pascual LM , Scott SJ , Mathieson ER , Katz DB , Jadhav SP ((2019) ) Interaction of taste and place coding in the hippocampus. J Neurosci 39: , 3057–3069. |
[51] | Lemon CH , Katz DB ((2007) ) The neural processing of taste. BMC Neurosci 8: , 1–8. |
[52] | Parfenov VA , Zakharov VV , Kabaeva AR , Vakhnina NV ((2020) ) Subjective cognitive decline as a predictor of future cognitive decline a systematic review. Dement Neuropsychol 14: , 248–257. |
[53] | Mitchell AJ , Beaumont H , Ferguson D , Yadegarfar M , Stubbs B ((2014) ) Risk of dementia and mild cognitive impairment in older people with subjective memory complaints: Meta-analysis. Acta Psychiatr Scand 130: , 439–451. |
[54] | Teunissen CE , Verberk IMW , Thijssen EH , Vermunt L , Hansson O , Zetterberg H , van der Flier WM , Mielke MM , del Campo M ((2022) ) Blood-based biomarkers for Alzheimer’s disease: Towards clinical implementation. Lancet Neurol 21: , 66–77. |
[55] | Cummings JL , Doody R , Clark C ((2007) ) Disease-modifying therapies for Alzheimer disease: Challenges to early intervention. Neurology 69: , 1622–1634. |
[56] | Mendiola-Precoma J , Berumen LC , Padilla K , Garcia-Alcocer G ((2016) ) Therapies for prevention and treatment of Alzheimer’s disease. Biomed Res Int 2016: , 2589276. |
[57] | Viña J , Sanz-Ros J ((2018) ) Alzheimer’s disease: Only prevention makes sense. Eur J Clin Invest 48: , e13005. |
[58] | Bredesen DE , Amos EC , Canick J , Ackerley M , Raji C , Fiala M , Ahdidan J ((2016) ) Reversal of cognitive decline in Alzheimer’s disease. Aging (Albany NY) 8: , 1250. |

