


Introduction and Aims
The expansion of insulating debris mantles across glacier ablation zones feeds back negatively on melt rates. This is important for forecasting the glacier response to climate change on a decadal scale and its impacts on the runoff of mountain regions (Reference Bozhinskiy, Krass and PopovninBozhinskiy and others, 1986). Debris-covered glaciers are typical landforms of the Pamirs, Karakoram and Himalaya. With the current warming climate, the number of debris-covered glaciers and also the magnitude of debris cover on single glaciers seems to be increasing in most of the world’s mountain regions. Several studies have been devoted to debris-covered glaciers, to improve understanding of both their special behaviour and their role in runoff from mountain regions (Reference Nakawo, Raymond and FountainNakawo and others, 2000). More data are still needed concerning fluctuations of debris-covered glaciers, their dynamics, energy exchanges and mass balance. It is necessary to collect these data from different glacier regions with different lithological settings, meteorological conditions and debris patterns.
As a contribution to this topic, new data on a large debris-covered glacier located in the Karakoram Range are presented. The study area is Baltoro glacier (Fig. 1), one of the largest debris-covered glaciers in the Karakoram Range. During summer 2004 a comprehensive dataset on the glacier dynamics, geometry, morphology and on energy and mass exchange was collected by an Italian–German scientific team in the framework of the latest Italian expedition to the K2 area, named ‘K2 2004 – 50 years later’, organized to celebrate the 50th anniversary of the first ascent of K2.

Fig. 1. (σ) Map of Baltoro glacier. The solid lines indicate the main mountain ridges, the dashed lines the glacier boundaries, the black points the stake positions, the star the location of the stake farm, and AWS1 and AWS2 the two automatic weather stations. (b) A photograph of Baltoro (Concordia area) taken in summer 2004 (photo by C. Mayer).
The research involved the collection of topographic and dynamic data, used to quantify and to describe the glacier evolution during the last 50 years (since the last Italian scientific expedition in 1954), and the calculation of glaciological and meteorological parameters, i.e. buried ice ablation rates for different debris thicknesses, thermal resistance of the debris cover and degree-day factors.
The dynamic and topographic data (glacier surface velocity, glacier longitudinal and transversal topographic profiles, etc.) are described in more detail by Reference Mayer, Lambrecht, Belo`, Smiraglia and DiolaiutiMayer and others (2006). In this contribution we focus on the analysis and interpretation of the meteorological and glaciological data.
The basin of Baltoro glacier is located on the south side of the Karakoram Range (Fig. 1), lying in the region 35835’– 35856’ N, 76804’–76846’ E. Its elevation extends between 3370 and 8611 m a.s.l. and it covers about 1500 km2. The main part of the basin extends in the east–west direction and the maximum glacier length is about 62 km. The highest peak of the Karakoram, K2 (8611 m a.s.l.), is situated on the watershed between the Indus basin, of which Baltoro glacier is a tributary, and the Tarim basin (Reference Desio, Marussi and CaputoDesio and others, 1961).
On Baltoro, debris has covered most of the ablation zone for more than a century (according to historical data reported by Reference ConwayConway (1894) and Reference De FilippiDe Filippi (1912)) and the complex relations between debris and ice ablation have been active for a long time.
The glacier is debris-covered below about 5000m a.s.l., initially by medial moraines, then gradually increasing to a uniform cover across the entire surface. Near the terminus, the debris thickness exceeds 1 m (Reference Mayer, Lambrecht, Belo`, Smiraglia and DiolaiutiMayer and others, 2006).
Baltoro glacier has undergone a long series of scientific investigations since the first observations by W.M. Conway in 1892 (Reference ConwayConway, 1894). Many studies have been made of its general geographical and morphological characteristics (Reference Dainelli and MarinelliDainelli and Marinelli, 1928; Reference MasonMason, 1930; Reference VisserVisser, 1934; Reference Savoia-Aosta and DesioSavoia-Aosta and Desio, 1936; Reference Desio, Marussi and CaputoDesio and others, 1961). It has also been investigated within the context of the surge-type phenomena of some of its tributaries (Reference DesioDesio, 1954; Reference HewittHewitt, 1969, Reference Hewitt1998; Reference Wake and SearleWake and Searle, 1993; Reference Pecci and SmiragliaPecci and Smiraglia, 2000; Reference Diolaiuti, Pecci and SmiragliaDiolaiuti and others, 2003). However, little attention has been paid so far to the debris cover and its effects on ablation.
In the Karakoram and Himalaya ranges, ablation conditions have been studied before (e.g. Reference Mattson and GardnerMattson and Gardner, 1989; Reference Young and SchmokYoung and Schmok, 1989; Reference Mattson, Gardner and YoungMattson and others, 1993; Reference Young and HewittYoung and Hewitt, 1993), but no previous research on the energy exchange between ice, debris cover and the atmosphere has been done at Baltoro glacier.
The data collected during the 2004 expedition have been processed and analyzed, in order to evaluate the effects of the debris on buried ice ablation. During the 1 month field trip, data were acquired on the supraglacial conditions from the glacier snout to the upper regions, close to the equilibrium line. More than 60 km of glacier length have been sampled in order to obtain information representative of the ablation zone.
The evaluation of ablation rates as a function of debris thicknesses for glaciers in the Karakoram is important not only as a topic of high scientific interest but also for water management. The large glacier system of Baltoro makes an important contribution to Pakistan’s water supply during the dry season (Reference Hewitt, Wake, Young and DavidHewitt and others, 1989). Therefore the quantification of glacier ablation and of glacier energy exchange in relation to different climate conditions is important for forecasting the seasonal runoff (Reference Becker and BugmannBecker and Bugmann, 1997).
Data Collection and Results
The data collected during the field trip to Baltoro glacier have been used for an in-depth analysis of the meteorological and supraglacial conditions on this large debris-covered glacier.
Meteorological data
The supraglacial meteorological conditions on high-elevation glaciers are not well known, and few continuous, quantitative data exist in the literature. For Baltoro glacier, the longest meteorological dataset before the 2004 expedition was that collected by A. Desio in 1954. It is limited to sky conditions, air temperature, precipitation, wind speed and wind direction on a non-continuous basis (Reference Desio, Marussi and CaputoDesio and others, 1961; Reference Petrucco and DesioPetrucco, 1991).
The data collected during the 2004 expedition represent a unique dataset which is extremely useful for evaluating the energy exchange at the air–debris–glacier interfaces and for calculating lapse rates over a large glacier area.
Two automatic weather stations (AWSs) were set up at different elevations to collect standard meteorological data which have been used, for example, to calculate local lapse rates. The first AWS was installed on a moraine ridge at Urdukas (4022m a.s.l.), close to the left glacier margin. All the sensors were situated on a 2 m high tripod, except for the wind-speed and wind-direction instrument which was located 4 m above the ground. The second AWS, positioned at K2 Base Camp (5033m a.s.l.) on Godwin Austen Glacier, had a similar set-up to the Urdukas station. This station collected data from 8 to 26 July 2004, whereas Urdukas station has been running continuously since 18 June 2004. Calibrated Kipp & Zonen sensors were used for radiation measurements.
The AWS at Urdukas was also installed for future monitoring. It is still working and will provide continuous data useful for reconstructing supraglacial energy transfer and mass exchanges.
The two AWSs were about 24 km apart. The meteorological parameters (air temperature, wind speed and direction, air pressure, humidity, precipitation, long- and shortwave radiation) have been collected hourly at Urdukas AWS and every 5 min at Base Camp AWS.
The mean hourly values of air temperature measured at the two AWSs have been compared. The correlation between the two datasets is high (r = 0.90), with average differences of 7.48˚C for the hourly mean values. This is equal to a mean lapse rate of 0.0075˚C m−1, with a standard deviation of 0.0018˚C m−1. The lapse rate (Fig. 2) shows higher values during the evening and night (up to 0.0098˚C m−1) and, in general, values less than 0.0057˚C m−1 during the day (in some circumstances a correlation with the wind speed can be observed). Compared with other investigations, the lapse rates found on Baltoro glacier are in a similar range, with a slightly higher mean value (0.0075˚C m−1 vs 0.0054˚C m−1; Reference Fujita and SakaiFujita and Sakai, 2000). However, the daily variations show a different pattern than the Fujita and Sakai study. In contrast to the typical diurnal variation at Baltoro, they found higher lapse rates during the day, with constant low values during the night.

Fig. 2. Hourly lapse rate (calculated from temperature data sampled from 8 to 26 July 2004 at the Urdukas and Base Camp AWSs) on Baltoro glacier. The thin black line represents the lapse rate, and the thick grey line is the 24 hour running mean. Dates are dd/m/yy.
A comparison between the mean hourly values of the air pressure measured at the two AWSs has been performed, which shows an even higher correlation (r = 0.95).
The average of the hourly air-pressure differences between the two AWSs is 62.33 hPa, equal to a lapse rate of 0.0617 hPa m−1. The air-pressure average measured at Urdukas is 620.69 hPa, whereas the Base Camp average is 558.36 hPa.
The mean hourly values of relative humidity (%) for the two datasets (Fig. 3) show the same characteristics (r = 0.83), where the average of the data collected at Urdukas is 53.6% and at Base Camp is 70.7%. This confirms a higher relative moisture content of the air at Base Camp, which could be due to the generally lower temperatures, or a potentially higher absolute moisture content due to evaporation and sublimation from the ice surface.

Fig. 3. Comparison between the mean hourly values of relative humidity (%) measured at the Urdukas and Base Camp AWSs. Dates are dd/m/yy.
The total amount of precipitation measured during the overlapping period of observations of the two AWSs (8– 27 July 2004) was 17.2 mm at Urdukas and 10.8 mm at Base Camp. At Urdukas the amount of precipitation for the period 18 June–1 August 2004 was 85.4 mm.
In Figure 4, a comparison is shown between the mean daily values of wind speed (m s−1) measured at the Urdukas and Base Camp AWSs. The data of the two stations are quite different (r = 0.36) because of the different characteristics of the two sites. The Urdukas AWS is exposed to the general wind system above the glacier, while the Base Camp AWS is mainly affected by local glacier winds. The average hourly values over the whole sampled period were 2.4 ms−1 at Urdukas and 2.1 ms−1 at Base Camp. The maximum hourly values are 10.5 ms−1 at Urdukas and 7.7 ms−1 at Base Camp. Higher wind speeds were generally observed at Urdukas during the day and at Base Camp during the night.

Fig. 4. Comparison between the mean daily values of wind speed (m s−1) measured at the Urdukas and Base Camp AWSs. Dates are dd/m/yy.
The comparison between the mean daily values of incoming shortwave radiation (SWin (W m−2)) measured at the Urdukas and at Base Camp AWSs is displayed in Figure 5a. The correlation between the two datasets is meaningful (r = 0.91). The average values of the measurements were 258.8Wm−2 at Urkudas, and 282.8Wm−2 at Base Camp. The maximum values were 1214 and 1237 Wm−2, respectively.

Fig. 5. (σ) Comparison between the mean daily values of incoming shortwave radiation (SWin (W m−2)) measured at the Urdukas and Base Camp AWSs. (b) Comparison of the hourly incoming shortwave radiation data (Wm−2) measured during 3days (24–26July), 2 of them with clear-sky conditions. Dates are dd/m/yy.
In order to study the radiation differences between the two sites under clear-sky conditions, the last 3 days of the observation period (i.e. 24–26 July) were analyzed (Fig. 5b). During the early morning (before 0900 h) and in the evening the incoming shortwave radiation is higher at Urdukas than at Base Camp, due to shading from the steeper, higher rock walls. Under clear-sky conditions after 0900 h, the shortwave radiation differences (Base Camp– Urdukas) become positive until 1500 h, with a maximum between 1000 and 1200 h. These differences are due to the AWS location (overall altitude and shading slopes).
Ablation data
Ablation has been evaluated at 33 3 m long PVC stakes, drilled into the ice along the whole glacier ablation zone taking into account both different elevation and different debris thickness. The stakes were arranged in one longitudinal (mainly east–west) and three transversal (south–north) profiles (Fig. 1). The stake positions were measured twice with differential global positioning system (on the way up and on the way down) with different time periods between the measurements. Moreover, a specially designed ablation experiment was carried out in an area where melt rates were expected to show a large variation (Gore, in the central part of the glacier at 4178 ma.s.l.). Twenty-three bamboo stakes were drilled into the ice at locations with different aspect angle, slope and debris cover, in order to obtain statistical information on melt rates under the varying conditions on the glacier. This network, named ‘the stake farm’, covered an area of a few hundred square metres across a small valley. The measurement period was 4– 14 July 2004, and the stakes were measured as often as possible. A newly developed automatic ablation sensor (AAS; Reference Bøggild, Olesen, Ahlstrøm and JørgensenBøggild and others, 2003) was installed (at a location with a debris thickness of 4 cm), in order to monitor the daily variation of ablation. This sensor works on the basis of measuring the pressure of a liquid column from the ice surface to a depth where the sensor is installed. The absolute error of the sensor is <1mm. However, small-scale spatial variations of surface ablation are on the order of some centimetres, and are averaged with the method applied. The same instrument also sampled air-temperature data on an hourly basis at the location of the pressure sensor. The ablation rates obtained from the 56 stakes were analyzed with respect to the different elevations (Fig. 6) and the debris thicknesses (Fig. 7). The data shown in Figure 6 indicate a general decrease in ablation with increasing elevation. The variation of the ablation rate at the stake farm, as indicated in Figure 6, demonstrates the possible bandwidth along the ablation-rate vs elevation function for the investigated section of Baltoro glacier. Here, surface conditions are rather similar, changing only slightly between Urdukas and the highest stakes. For areas with less debris cover, the expected bandwidth would be less due to the more homogeneous ablation conditions. For the investigated area, the variation of the ablation rate with changing debris thickness and local surface conditions is larger than the effect of elevation, as can be seen by the variability of ablation rates at the stake farm.

Fig. 6. Ablation rate vs elevation on Baltoro glacier. The vertical bar indicates the measured variation of ablation rates at a specific elevation at the stake farm.

Fig. 7. Variation of measured mean daily ice ablation vs debris thickness on Baltoro glacier compared to other field data. The data from Reference Mattson and GardnerMattson and Gardner (1989) are generally higher because the mean elevation of their area of investigation was 500m lower than on Baltoro glacier.
In Figure 7, a general decrease in the ablation rate with thicker debris cover is detectable. This result agrees with the findings of previous investigations (Reference ØstremØstrem, 1959; Reference FujiiFujii, 1977; Reference Fujii and HiguchiFujii and Higuchi, 1977; Reference Nakawo and TakahashiNakawo and Takahashi, 1982; Reference Mattson and GardnerMattson and Gardner, 1989; Reference Mattson, Gardner and YoungMattson and others, 1993; Reference Adhikary, Seko, Nakawo, Ageta and MiyazakiAdhikary and others, 1997; Reference Rana, Nakawo, Fukushima and AgetaRana and others, 1997; Reference Kayastha, Takeuchi, Nakawo and AgetaKayastha and others, 2000). The strong scatter of ablation rates is due to elevation to a minor degree (generally lower ablation at higher elevations). However, the elevation effect is hard to eliminate, because of the large number of superimposed effects on the ablation rate (debris thickness, aspect, slope, etc.).
Due to the rather thick debris cover of Baltoro glacier, the focus of the investigations was on ablation conditions of debris thicknesses of several centimetres. Detailed studies of the ‘critical debris thickness’ have not been carried out.
Stake-farm data collected at Gore (4178m a.s.l.) were analyzed separately. In Table 1, results from the stake-farm measurements are shown. It should be noted that stakes with the same debris thickness but with different slope and aspect showed different ablation rates.
Table 1. Measured ice ablation at the stake farm, debris thickness, slope aspect and slope angle. The measurement period was 11 days

The ablation rates at the 23 stakes vary from 6 to 3 cmd−1, and the debris thickness from 18 to 0 cm. Ablation rates at the stake farm show a similar variation to those along the glacier. This demonstrates that ablation in this area is representative for larger parts of the ablation zone of Baltoro glacier.
Three stakes were placed on an ice pinnacle (penitente), in order to observe the ablation on debris-free ice. On the crest and flat area of the ice pinnacle, the ablation was 6 cm d−1, falling to 5 and 4 cm d − 1 on the southwest and west slopes respectively. At the other stake sites with thin debris, the ablation rate reached values from 6 to 4cmd−1, similar to the debris-free ice ablation values.
The ablation data acquired by the AAS (Reference Bøggild, Olesen, Ahlstrøm and JørgensenBøggild and others, 2003) installed at the stake farm with a debris cover of 4 cm allowed us to quantify the ablation rate at the site continuously and to compare it with the rates measured at the ablation stakes. The ablation rate at the ablation sensor was 3.5 cmd−1, whereas a mean ablation rate of 4cmd−1 resulted from the measurements of all stakes with the same debris thickness at the stake farm.
Debris temperature data
At several locations along the stake network, thermistors were used to monitor the temperature variations at the ice surface and in the debris cover. The debris temperature at different thicknesses close to the ablation stakes was measured by 20 single-channel 8-bit data loggers (Gemini Tinytag Plus). These 10kO negative thermal coefficient (NTC) thermistors operate over a –30 to +50˚C range. This configuration achieved a temperature resolution of about 0.25˚C at 0˚C, gradually degrading to about 0.4˚C towards the full-scale values. Each data logger was capable of storing 16000 temperature samples and they were programmed to record instantaneous measurements every 5 min.
The debris temperature data sampled were processed in order to obtain the debris surface temperature.
In Figure 8, the debris temperature data acquired at different thicknesses at the same site at Urdukas, close to an ablation stake on a slope with northern orientation, are shown. The measured values allow us to calculate the temperature gradient in the debris layer.

Fig. 8. Debris temperatures for different debris depths at Urdukas stakes. T1 is 36cm from the surface at the buried ice contact, T2 20 cm and T3 13 cm from the surface. Dates are dd/m/yy.
The debris surface temperatures were estimated on the basis of the measured debris temperatures at the different debris depths, assuming linear conduction through the debris layer. In Figure 9a, the simulated debris surface temperature (T s), the measured air temperature (T a) and incoming shortwave radiation are displayed for stake U3 of the Urdukas profile.

Fig. 9. (σ) Estimated debris surface temperature compared with the air temperature (calculated using Urdukas data and the calculated lapse rate) and incoming shortwave radiation (SWin (W m−2)) at Baltoro longitudinal profile 2 (mean altitude 4162.1 m). Dates are dd/m/yy. (b) Estimated surface temperature for different debris thicknesses (U3: 36cm; BLO02: 11 cm; BLO06: 10cm; Concordia: 4 cm; stake farm: 2 cm; BLO04: 1 cm) at different sample sites along the longitudinal profile from Urdukas to Concordia. Apart from Urdukas (U3, with north orientation), all the sites were located on flat surfaces.
The simulated surface temperatures depend on the debris thicknesses, as shown in Figure 9b. Thicker debris layers resulted in higher surface temperatures during the same day.
The surface temperatures, calculated in this manner, have been applied to calculate the debris thermal resistance R (according to Reference Kayastha, Takeuchi, Nakawo and AgetaKayastha and others, 2000).
A linear variation of temperature in the debris layer was assumed. If the physical properties in the debris layer are constant with depth, the heat flux depends linearly on the surface temperature for steady-state conditions. Then the heat flux is proportional to the inverse thermal resistance of the debris layer for a given surface temperature:
where Ts is the debris surface temperature relative to melting (08C) and R is the effective thermal resistance of the debris layer (m28CW−1). In other words, the inverse thermal resistance corresponds to thermal conductivity per unit depth.
The energy available for ice ablation is calculated from the heat flux QM through the debris cover:
where Lf is the latent heat of phase change of ice (334 x 103J kg−1), p I is density of ice (900 kg m−3) and a is ablation rate in ice thickness (ms−1).
The results obtained are shown in Figure 10. The thermal resistance of the debris layer was calculated from the field measurements at six sites on Baltoro along the longitudinal profile from Urdukas (4000 m a.s.l.) to Concordia (4460 ma.s.l.). The diagram shows a strong correlation between the thermal resistance and the debris thickness (r = 0.96).

Fig. 10. Thermal resistance R calculated for different debris thicknesses using the estimated surface temperatures.
Degree-day factor
The positive degree-days (PDDs) were calculated following Reference BoydBoyd (1975) and Reference BraithwaiteBraithwaite (1985) by summing up all positive daily mean temperatures for the period of ablation measurements.
The total PDD sum calculated over the entire period ( 5−12 July 2004) at the AAS was 114˚C. The total ablation value recorded by the instrument for the same period was −0.350 m. In order to show the correlation (r =- 0.98) between the two datasets, the hourly cumulated degrees and ablation values are displayed in Figure 11 (the latter taken as positive to allow a better comparison).
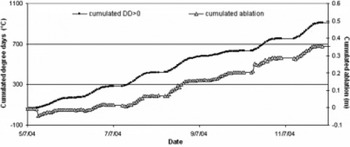
Fig. 11. Comparison between the cumulated hourly positive degrees and the cumulated ablation data measured by the automatic ablatometer. The debris thickness covering the ice was 4 cm. The ablation values are displayed as being positive to illustrate the strong correlation (r = –0.985) between the two datasets. Dates are dd/m/yy.
The good agreement between the cumulated positive degrees and the cumulated ablation measured with the automatic ablatometer (Fig. 11) suggested calculating the degree-day factor K (according to Reference Kayastha, Takeuchi, Nakawo and AgetaKayastha and others, 2000) using the temperature data measured at the two AWSs, the calculated local lapse rate and the ablation rates. This method has been applied extensively in the Alps (originally by Reference Finsterwalder and SchunkFinsterwalder and Schunk, 1887), but only limited studies have been carried out for the Himalayan regions (Reference Singh and KumarSingh and Kumar, 1996; Reference Singh, Kumar, Ramasastri and SinghSingh and others, 2000).
The K factor can be determined by:
where A is the total ablation (mm), T a is the mean daily air temperature (°C), T 0 is the reference temperature (usually 0°C) and nday is the number of days for the reference period.
The K factor was calculated for all 56 stake positions by applying the local lapse rate of the air temperature to obtain the PDD sum at each stake. The relation between the calculated K factor and the debris thickness is shown in Figure 12. The calculated K factor (mmd- 1 °C−1) decreases with increasing debris thickness, as expected, and increases as the ablation increases. The maximum value of the Kfactor is 7.73 mm d−1 °C−1 reached for 0.01 m of debris cover, and the lowest value is 1.13 mmd−1 °C−1 with 0.4 m of debris. On bare ice, the K factor obtained is a range of values between 1.3 and 5.8 mmd- 1 °C−1. This variation is due to altitudinal and aspect factors.

Fig. 12. Variation of calculated K factors vs debris thickness on Baltoro glacier for all 56 installed ablation stakes.
On three areas of Baltoro, the ablation was measured for a longer time-span (19 June-1 August 2004) than the period for which the Kfactor was determined on the basis of the air-temperature data from Urdukas AWS. These sites are Godwin Austen Glacier (‘Baltoro north’; mean altitude 4649 m), the upper southeast sector of Baltoro (‘Baltoro south’; mean altitude 4635 m) and the area located at Concordia (mean altitude 4537 m). The calculated Kfactors at these sites are 3.5, 3.1 and 4.5 mm d−1° C−1, respectively. The total ablation estimated on the basis of the calculated K factors is 0.56, 0.50 and 0.84 m, respectively.
The total ablation estimates on the three glacier sectors seem to be consistent with the vertical ablation gradient. The ablation at Baltoro north, Baltoro south and Concordia was also simulated for the AAS acquisition period at Gore (4178 ma.s.l.; K factor 3.07 mmd−1 °C−1), and the data obtained (0.35, 0.19, 0.13 and 0.11 m at AAS, Concordia, Baltoro north and Baltoro south, respectively) were found to be in agreement.
Discussion
The large glacier extent allowed us to analyze the relations among ice ablation, debris temperature and supraglacial meteorological conditions on a representative area of debris-covered glacier, but it also constituted a limitation on the data collection, which had to be performed on a large surface. Because conditions changed over time, and the distances between sites were large, it was not possible to make measurements under the same conditions each time.
The local lapse rates calculated using the data collected at the two AWSs and the differences found between the meteorological parameters (air temperature, precipitation, radiation, wind, relative humidity and air pressure) suggest the need for more detailed information along the glacier surface with smaller spatial ranges. Moreover, the differences in altitude, debris thickness, grain-size, lithology and moisture that characterize this large debris-covered glacier complicate the data analysis. Another limiting factor on this glacier is the lack of previous studies concerning data on ice ablation and supraglacial micrometeorology because this is a remote, inaccessible area.
The relation between ablation and debris thickness found on Baltoro is in agreement with the available literature, as evidenced by Figure 7. Previous studies have demonstrated the effect of debris-cover thickness on the ablation rate; debris has a strong influence on the surface energy balance and melting of the underlying ice (Reference Bozhinskiy, Krass and PopovninBozhinskiy and others, 1986). Thermal conductivity and albedo are the main physical characteristics of a debris layer that control heat conduction to the ice–debris interface. This barrier to heat transfer causes the ablation rate to decrease with increasing debris thickness once a critical thickness is exceeded (Reference ØstremØstrem, 1959; Reference Fujii and HiguchiFujii and Higuchi, 1977; Reference Mattson and GardnerMattson and Gardner, 1989; Reference Mattson, Gardner and YoungMattson and others, 1993; Reference Rana, Nakawo, Fukushima and AgetaRana and others, 1997). The moisture conditions seem important in controlling debris conductivity (Reference MattsonMattson, 1986, Reference Mattson2000), so rainfalls affect the rate of heat transfer to the debris–ice interface. The lithology as well as the thickness of the debris can cause variations in ice melt. For the same thickness, ablation beneath dark-coloured schist is generally higher than beneath lighter-coloured granite because of differences in absorbed solar radiation (Reference Inoue and YoshidaInoue and Yoshida, 1980). On Baltoro glacier, the debris-cover lithology is complex and represented mainly by mixed granite, gneiss, schist and marble (Reference DesioDesio, 1969; Reference SearleSearle, 1991).
We have focused on the detailed investigation of the main debris thickness distribution in order to reach conclusions about the overall melt conditions on Baltoro glacier. The data collected at the stake farm present some peculiarities due to the different slope, aspect and hydrological conditions characterizing the stake locations. For the same debris thickness at different stakes (Table 1), the daily ablation rates are quite different (e.g. with a debris thickness of 0.01 m the ablation rate varied from 0.04 to 0.05 and 0.06 m d−1). For debris thicknesses of <0.1 m, the topographical components (e.g. aspect and slope) are almost as important as the absolute debris thickness, so mass-balance calculations over debris-covered glacier tongues need to take these factors into account. Nevertheless the average ablation, using all the stake data, was 0.04 md−1, the debris thickness average was 0.04 m, and the ablation measured at the AAS with a cover 0.04m thick was 0.035md−1. This behaviour reveals both the influence on the ablation rates of other geographical factors (e.g. slope and aspect) and the fast changes affecting the glacial surface. Over short time-spans, these changes (due to glacier surface velocity and debris rearrangement) reduce the differences between small debris thicknesses, and result in more homogeneous ablation data. This result differs from those obtained in the literature, but previous authors performed their experiments on the debris-covered ice in stable surface conditions, whereas real conditions on the glacier are influenced by dynamic features (e.g. artificial plots used by Reference Mattson, Gardner and YoungMattson and others, 1993). The observed ablation behaviour also suggests processing and analyzing ablation data on debris-covered glaciers using a statistical approach to reconstruct real supraglacial conditions which change continuously. This approach is necessary to determine the overall ablation.
We estimate the debris surface temperature data, which are necessary when investigating energy fluxes through supraglacial debris covers and their effects on the ablation rate (Reference Nakawo and YoungNakawo and Young, 1981), by processing the values measured by thermistors at different debris depths. This is the most common approach (Reference Conway and RasmussenConway and Rasmussen, 2000), which assumes a linear variation of temperature in the debris layer to calculate the surface value. This procedure is affected by several uncertainties (i.e. the system may not be purely conductive, conductivity may not be constant, moisture variations with depth may complicate the temperature profile, and the vertical positions of the probe may be approximated or not well known) that can influence the field measurements and their reliability for modelling glacier ablation and runoff. Nevertheless, this was the only way to secure the thermistors from external disturbance on Baltoro. The surface temperatures evaluated on the basis of the debris temperature at different thicknesses seem to be somewhat underestimated but they are generally in good agreement with the air-temperature and incoming shortwave radiation data (Fig. 9a). They are dependent on the glacier debris thicknesses (Fig. 9b); calculated R values are in good agreement with those expected for corresponding debris thicknesses.
For the overall melt on Baltoro glacier, mean daily temperature data from Srinagar (1545 ma.s.l.) have been used for a rough calculation. Using a general lapse rate to transfer the data to the glacier elevation and applying our calculated degree-day factors for the different altitude bands, the long term meltwater production in the area from 3900m upwards is about 1.3 km3 a−1. Ablation below 3900 m is not considered because the large debris thicknesses make it very difficult to estimate melt rates. This meltwater production is of the same order of magnitude as the estimated cumulative precipitation over the Baltoro catchment area, which is 1.8 km3 a−1 (Reference Mayer, Lambrecht, Belo`, Smiraglia and DiolaiutiMayer and others, 2006).
Conclusions
The results presented in this contribution represent a first step in research aimed at describing and analyzing the complex relations between the supraglacial conditions of this large debris-covered glacier and climate. The data collected on Baltoro glacier at the two AWSs allowed us to reconstruct the supraglacial meteorological conditions and to determine the local temperature lapse rate (0.0075˚C m−1). The meteorological conditions have been used to investigate the measured ablation and to compute the PDDs at each stake altitude for the K factor processing. This last parameter was applied to the whole temperature dataset to simulate the total ablation that occurred on some glacier sectors. The results vary between 0.5 m (at 4649 ma.s.l.) and 0.8 m (at 4537 m a.s.l.) for the observation period. Debris cover reduces the ablation over a large part of the glacier. The variation in degree-day factor for different debris thicknesses was found to be 1.1–7.7mmd−1 ˚C−1. The method we have outlined is capable of estimating the ice ablation and its distribution over the main part of the glacier.
The debris temperature samples at different depths allowed the calculation of debris surface temperatures, which are in agreement with air temperatures and incoming shortwave radiation data, and permitted the evaluation of the debris thermal resistance R.
The meaningful relation between debris surface temperature and the debris thicknesses supports the further application to remote-sensing data (e.g. Advanced Spaceborne Thermal Emission and Reflection Radiometer (ASTER)) for detecting the pattern of the debris thickness and for evaluating the glacier energy balance that will be the next step in the research. Calculated overall melt is of the same order of magnitude as the estimated drainage precipitation, which indicates that the methods used for our analysis are appropriate for this purpose. A final answer to the question whether Baltoro glacier is in equilibrium cannot be given at this early stage.
Acknowledgements
This study was carried out within the framework of the Ev-K2-CNR ‘Scientific and Technological Research in Himalaya and Karakorum’ Project and in the framework of the scientific-mountaineering project ‘K2 2004 – 50 years later’ (glaciology research group, leader C. Smiraglia). The research was made possible by contributions from the IMONT (Italian Mountain Institute) and from the 2003 MIUR (Ministero Istruzione, Università Ricerca) project (national leader P.R. Federici; local leader C. Smiraglia). The mobility of the Italian–German researchers involved in the project has been supported by the Vigoni-DAAD project 2005. We thank A. Tamburini, G. Peretti and L. Bonetti for assisting with the fieldwork, and E. Vuillermoz for helping with the Base Camp AWS management and the meteorological data processing. We also thank E. Mosley-Thompson (scientific editor), H. Brecher and the referees for their careful reviews and suggestions. This paper is dedicated to Silvana Da Polenza.


