


1. Snow Viscosity
Switzerland underwent an extreme avalanche period in February 1999. During this intense 1 month period, over 3000 avalanches occurred; 1000 of these caused damage to residential areas, agricultural land and power and transportation lines. Avalanche fracture heights of ≥ 5 m were observed, indicating avalanche return periods of well over 100 years. A total of 17 people were killed, 12 alone in Evolene, canton Valais.
Although tragic enough, the damage could have been greater had a new avalanche warning system not been in operation (Reference Russi, Ammann, Brabec, Lehning and MeisterRussi and others, 1998). An integral part of this warning system is the numerical modeling of the snowpack in order to augment information obtained from direct human observations and a large network of fully automated weather stations (Reference Lehning, Bartelt, Brown and HestnesLehning and others, 1998). The model provides avalanche forecasters with supplementary information in cases where digging snow pits is impossible (bad weather), too time-consuming or simply too dangerous. The simulation program is described in Reference Lehning, Doorschot and BarteltLehning and others (2000).
Warning specialists are primarily interested in knowing new-snow amounts and snowpack-settling rates after snowfall periods. This information is used directly to judge avalanche hazard. New-snow mass is determined indirectly by automatically measuring the location of the snowpack surface. However, the settlement of the snowpack must be theoretically calculated and then subtracted from this measured location in order to determine the true amounts of new snow. Since elastic deformations are small, the snow elasticity is of minor importance. The deformation rate is controlled by the amount of viscous deformation, i.e. the snow viscosity.
In this paper we briefly describe a new triaxial testing device that we use to perform short- (several minutes) and long-term (several days) creep tests in both tension and compression (see Fig. 1). Over 100 experiments using snow samples within the density range 180 kgmȡ3≤ p ω400 kgmȡ3 were performed during winters 1997/98 and 1998/99.

Fig. 1. The triaxial apparatus with snow sample.
Although triaxial tests have been performed in the past by Salm (Reference Salm and Oura1967, Reference Salm1971,Reference Salm1975,Reference Salm1977), the test results have not been used to develop instationary microstructure-based constitutive relations which are valid for large deformations and strains. The work of Salm was used to formulate a macroscopic failure criterion for snow, based on conserved energy levels atfracture. He clearly showed that the fracture strength of snow is dependent on strain history, but was not able to correlate fracture strength to snow microstructure.
Later, Reference Mahajan and BrownMahajan and Brown (1993) proposed a constitutive law for snow, based on the dislocations of the grain bonds. However, this theory was limited to small strains. Two further deformation mechanisms, superplastic straining of the necks and inter-particle sliding between the grains, were also postulated to contribute to the overall material behavior. This constitutive model has been used in our operational snowpack simulation program with some success (Reference Lehning, Bartelt, Brown and HestnesLehning and others, 1998, Reference Lehning, Doorschot and Bartelt2000). We have found that the introduction of the superplastic straining mechanism leads to too large and unrealistic snowpack settlements when compared to actual field measurements. Nonetheless, an important contribution of the work of Mahajan and Brown was to identify how microstructural processes can be extrapolated from macroscopic tests, such as triaxial experiments.
In th∊ following, we first describe the triaxial apparatus. We then present the results of single-cycle creep tests in compression. In the conclusions we summarize the 100 test results and show how snow viscosity varies with density and applied strain rate. We then use this information to identify the stress state of the snow bonds and compare our measurements with the theoretical predictions of Reference Mahajan and BrownMahajan and Brown (1993).
2. The Triaxial Apparatus
2.1. Design
The design of our new triaxial apparatus deviates from standard triaxial testing devices used in soil mechanics in four ways:
-
1. The creep tests are not load-controlled but deformation-controlled. Since all finite-element programs are based on determining the state of stress from the material strains or deformation, this simplifies the interpretation of the experimental results when formulating constitutive laws.
-
2. The lateral pressure is not applied by a fluid but by compressed air. A fluid produces a hydrostatic pressure which has a gradient from the top to the bottom of the sample. For snow, this is not acceptable since the maximum lateral pressure is only 30 kPa.
-
3. The loading frame and the load cell are both inside the pressure cell in order to avoid measuring any friction in the loading system.
-
4. The sample volume change is recorded by measuring the pore-air volume that is pressed out of the sample during compression. The determination of the volume change in a compressed-air triaxial apparatus is difficult since the samples must be airtight. Our specially designed volumetric measurement system will be explained later.
2.2. Mechanical system
The mechanical system is shown in Figure 2. The deformation-controlled testing device is driven by a step motor which propels a geared screwed spindle over a shaft coupling. The loading frame can be moved up and down at different rates. One step of the motor is equivalent to a micrometer feed. The 22 kg pressure cell is equipped with a counterweight lifting tackle and is sealed against the base plate with an O-ring. The cell is airtight.
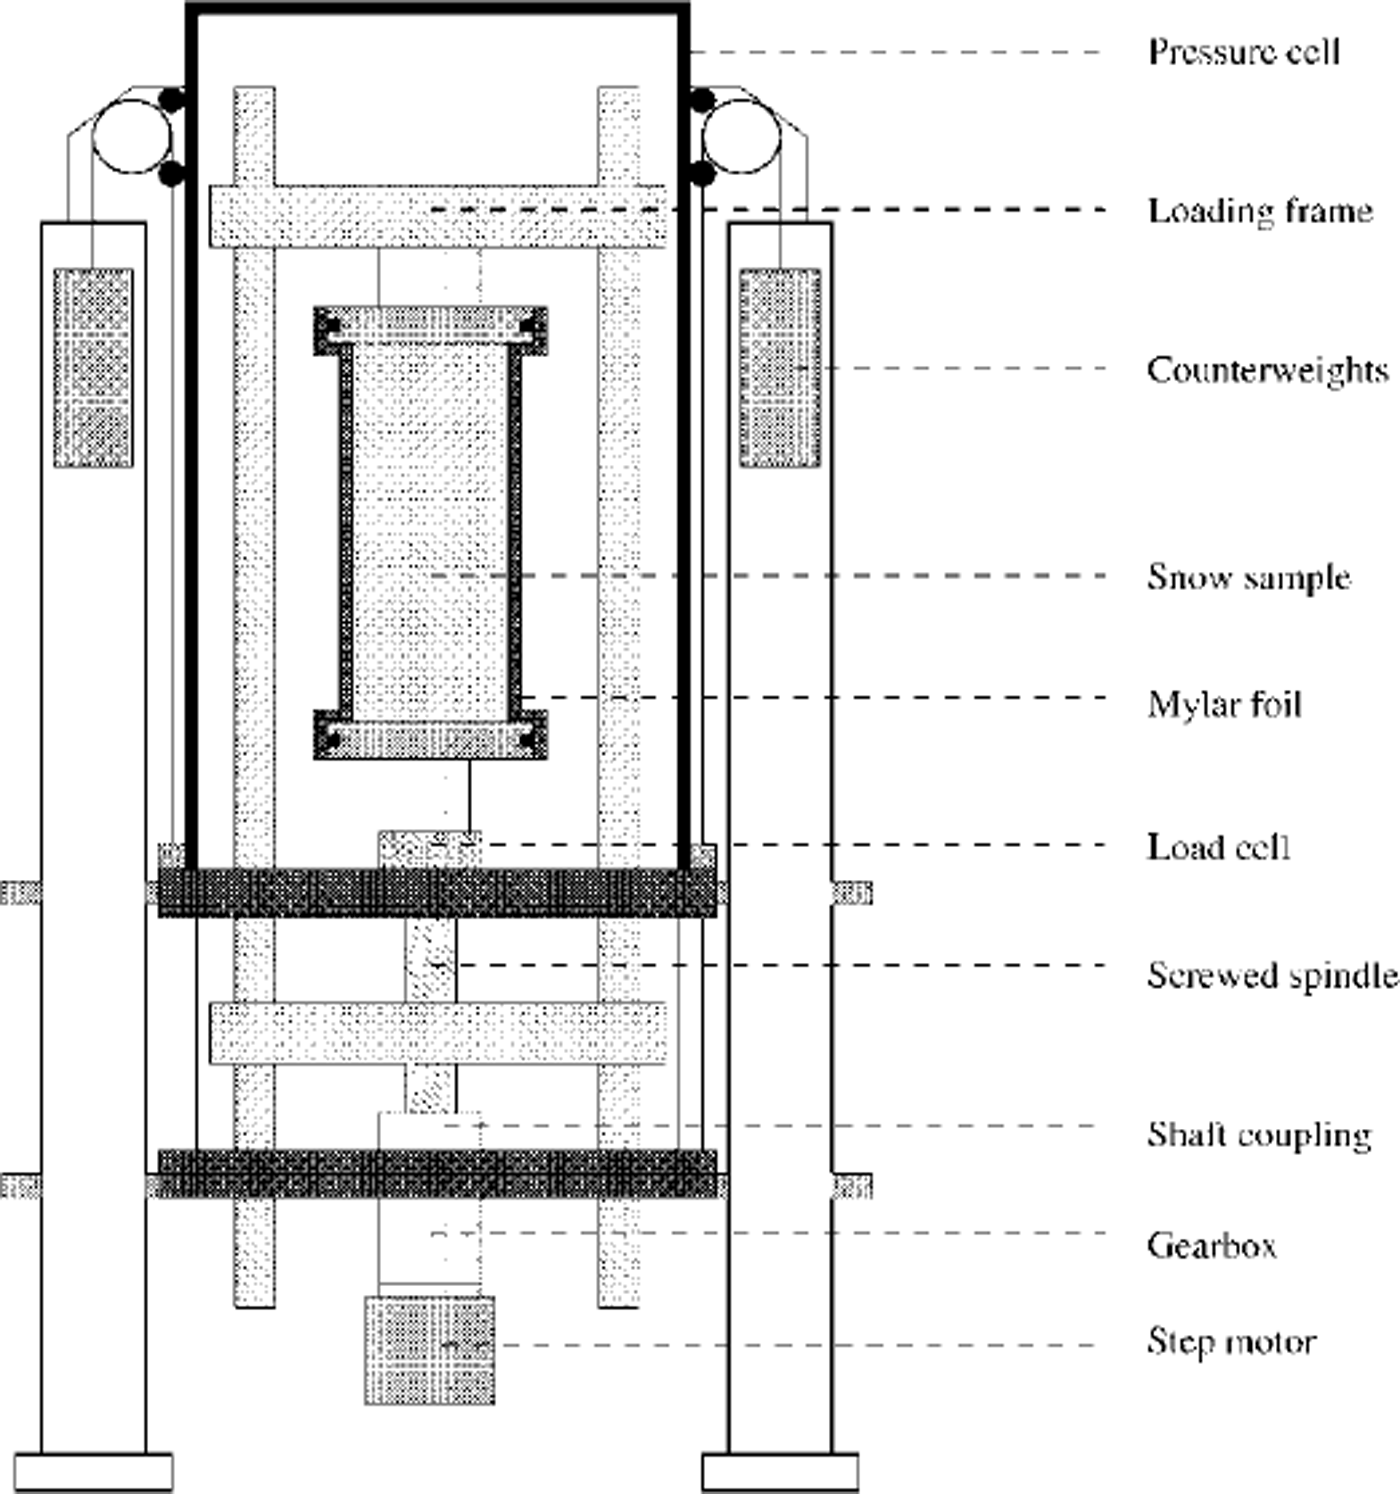
Fig. 2. The mechanical system.
The lateral pressure is produced by an air-pump that delivers a maximum of 30 kPa. The separation between snow sample and lateral pressure is guaranteed by a 12 μm thick gas-tight Mylar foil, which is glued at the top and bottom of the sample to two PVC rings. These rings are attached to the loading plates when the sample is installed in the testing device. The mechanical specifications, including the sample size, are shown inTable 1.
Table 1. Specifications of triaxial apparatus
2.3. Control system
The control of the machine and the entire data recording occurs automatically using two control units, an amplifier and a personal computer (PC) equipped with an analog-to-digital transformer. The step motors of the loading frame and the volume-change measuring device both require a control unit. The data from all the measurement transducers are passed to the amplifier unit, to the control units and then to the PC. The air-pump for the lateral pressure is governed by a pressure regulator, which compares the actual to the prescribed value. The user-friendly PC program LAB-VIEW is used to input test specifications as well as to visualize the test results. Different deformation cycles (up, down, wait and stop), strain, strain rate and lateral pressure are set in an input menu before the test is started. The measured data (resisting force, volume change, temperature) can be monitored graphically during the tests.
Fail-safe switches are included in the control system so that the measured values stay within a realistic range. This prevents the machine and load cell from being damaged during a test.
2.4. Volume-change measuring device
A constant strain rate is applied to the snow sample as the tests are carried out in deformation control mode. The resisting force is measured by a load cell installed below the sample inside the pressure cell (see Fig. 2). The load cell is easily exchangeable. A cell which can measure up to 2 kN is currently being used.
The relative displacement between the top and bottom loading plates is recorded and defines the axial deformation of the sample.
To check the air pressure in the two separated systems (pore-air system and lateral-pressure system) there are three transducers. One measures the lateral pressure relative to the pressure in the pore air of the sample. This value is used by the pressure regulator to govern the air-pump. A second transducer measures the lateral pressure relative to the atmospheric pressure. The third transducer measures the absolute pore-air pressure relative to a vacuum, and controls the volume-change measuring device. The temperature inside the pressure cell is recorded using three temperature sensors: one on the top load plate, one on the bottom load plate and one free in the air that surrounds the sample.
The volume-change measurement system is displayed in Figure 3. The volume change over time caused by the deformation of the snow sample is measured by capturing the displaced pore air.

Fig. 3. Triaxial control system.
In this pore-air system a drop of antifreeze is placed in a small Plexiglas tube. This drop is positioned between two light barriers. In the beginning, both barriers are interrupted. When the snow sample is deformed, air flows out and the drop is pushed to either the left or the right of the light barriers. As soon as one barrier is free, a piston, which is connected to the pore-air system, is activated to bring the drop back to its original position. This process goes on step by step. The position of the piston, which is driven by a step motor, corresponds to the actual volume change.
At the end of the pore-air system a transducer measures the absolute pressure and compensates small pressure changes.
3. First Results
During the time period February-June 1998, >60 triaxial tests were performed on three snow types with different microstructure and density. Between January and May 1999, >40 triaxial tests were carried out. The densities varied between 180 and 440 kg m–3. The tests all contained one deformation cycle followed by a relaxation period. The tests were performed with different applied strain rates. In Figure 4 an example of a typical triaxial creep test is presented. The measured stress shows a steep rise in magnitude at the beginning of the experiment. A partly elastic behavior can be identified. Afterwards the curve flattens because the sample is creeping under constant applied strain rate. As soon as the applied deformation stops, i.e. strain rate is equal to zero, relaxation begins and the stress decreases very quickly. Figure 5a shows the large influence that small changes in density have on the resulting stress: high-density samples can resist high stresses. Except for density the test conditions were unchanged. Figure 5b shows the influence of strain rate on the resulting stress: high strain rates create high stresses. The results are from a series of tests where only the strain rate was varied.

Fig. 4. (a) Measured axial stress σa of a compressive creep test. A snow sample with density p = 255 kg m–3 , side pressure oT = 2.5kPa is loaded with a strain rate
![]() (b) Comparison between measurements and simulation. A simple density-dependent Maxwell law matches the measurements well. The simulation results are denoted with a cross. The temperature of the tests was T = –12.5˚C.
(b) Comparison between measurements and simulation. A simple density-dependent Maxwell law matches the measurements well. The simulation results are denoted with a cross. The temperature of the tests was T = –12.5˚C.
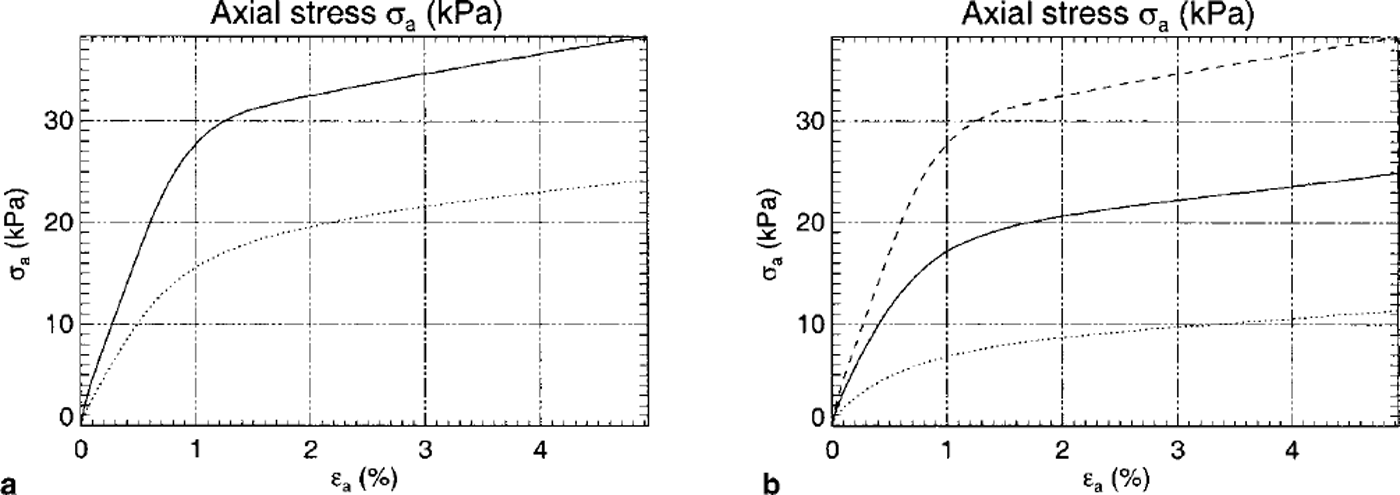
Fig. 5. (a) The influence of snow density on viscoelastic behavior. The larger the density, the larger the viscosity. Top curve: p = 255 kg m–3 . Bottom curve: p =214 kg m–3 . (b) The influence of applied strain rate on snow stress-strain behavior. Top curve:
![]() Middle curve:
Middle curve:
![]() Bottom curve:
Bottom curve:
![]() . In both cases the temperature of the tests was T=-12.5˚C.
. In both cases the temperature of the tests was T=-12.5˚C.
4. Discussion and Conclusions
The test series was analyzed using the classic rheological viscoelastic models of Maxwell, Kelvin and Burgers (see Reference MellorMellor, 1975). This is the first step in formulating more complex and accurate constitutive relations. The goal was, first, to qualitatively characterize snow as a viscoelastic material, and then in a second step to introduce laws that account for snow microstructure and densification.
As an example, consider Figure 4b which shows a measured stress curve compared to a Maxwell model in which the viscosity is density-dependent. The Maxwell model, which is presently being employed in our snowpack model, can only be used to model the loading phase of the tests; it cannot model the relaxation phase.
A summary of the ≥ 100 tests is provided in Figure 6. This graph displays the Maxwell snow viscosity as a function of the snow density. The experimental results clearly show an important and previously undocumented phenomenon: snow of a given density exhibits higher viscosity at lower strain rates. Previous experimental results have shown an increase in viscosity only when the density increases (Reference MellorMellor, 1975).This material behavior is also demonstrated by ice at higher stress (Reference SandersonSanderson, 1988). In snow, such stresses exist at the inter-granular bonds of the ice-crystal lattice. Thus, we believe we have detected a microstructural phenomenon in our tests. This is an important result since it shows how the influence of snow microstructure can be introduced in macrostructural constitutive laws. Furthermore, it explains the inability of existing viscosity formulations to model simple settlement experiments (Reference Bartelt, Christen, Hutter, Wang and BeerBartelt and Christen, 1999). These laws have no strain-rate effect. In order to show exactly how the influence of snow microstructure can be introduced into a constitutive model, we first define the dimensionless parameter ση,
where σs is the applied snow stress, ρs and Pi are the density of snow and ice, respectively, and a, is the ice stress which we define, in general, according to any constitutive law for ice, for example,
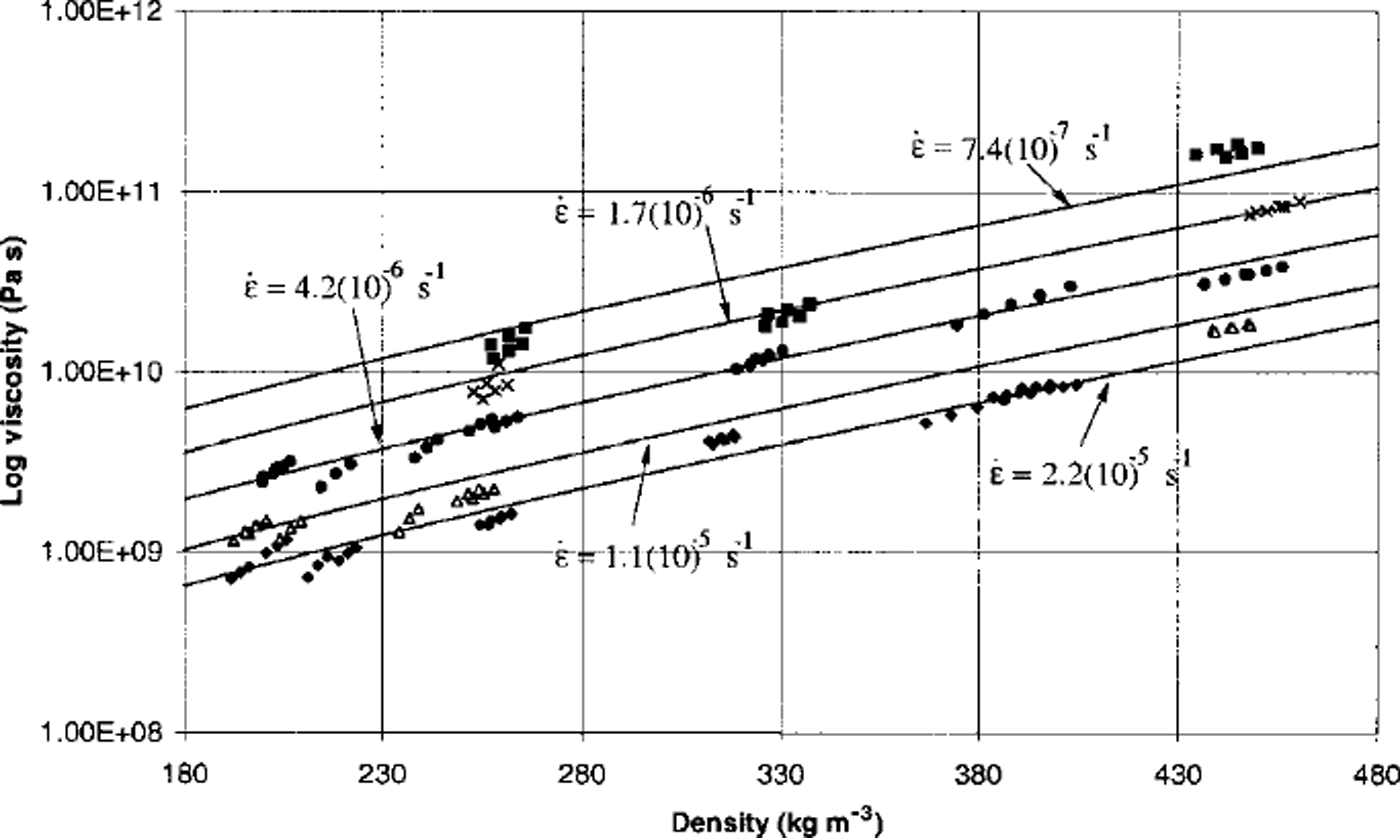
Fig. 6. Comparison between experimentally determined viscosity and constitutive model. Note the good agreement for all strain rates. Experimentally applied strain rates: diamonds ∊ = 2.2 × l0–5s–1 , triangles ∊ = 1.1 × l0–5s–11 , circles ∊ = 4.2× 10⁻⁶s–1, crosses ∊ = 1.7 × l0–6s–1 , squares ∊ = 7.4× 10⁻⁷s–1
In our case we are using the viscosity, Vi, of Barnes which is based on experiments (Reference SandersonSanderson, 1988). Physically, the parameter ση indicates how much ice mass is actually resisting deformation. In our experiments we found 0.02 < an < 0.20 (see Fig. 7). In other words, 2–20% of the total ice in the crystal lattice contributes to the mechanical resistance of snow. This information can be compared to theoretical predictions. Reference Mahajan and BrownMahajan and Brown (1993) derived the dimensionless microstructural parameter (which we have termed βη),
using a spherical grain-bond model. N3 is the snow coordination number, rb and rg are the bond and grain radius, and the parameter /3 relates the stress state of the bonds or necks, σn, to the applied macroscopic snow stress, σs,
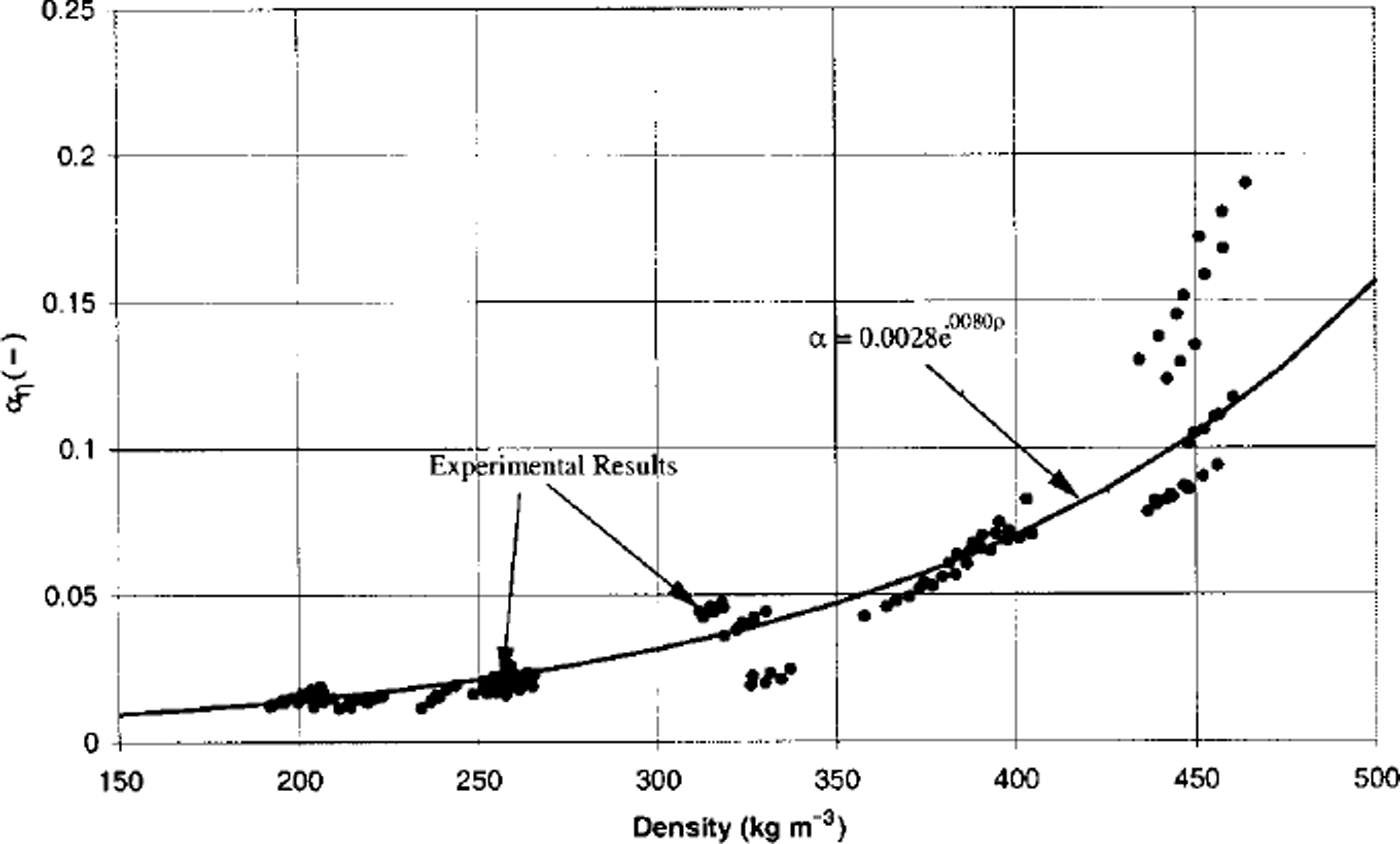
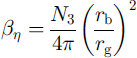
Fig. 7. The parameter σv indicates the percentage of the ice lattice that is resisting deformation. The thick curved line is an exponential fit to the test results: a, = 0.0028 6 00080f>. The experimental results indicate a, lies in the range 2–20%.
The parameter βη is derived based on the idea that dislocation straining of the ice necks is the primary deformation mechanism in the ice lattice, relative to superplastic straining and inter-particle sliding. The parameter /3 is plotted in Figure 8. These are the series of straight lines that intersect the exponential fit to the experimental results. The fact that both the experimental a, and theoretical (3, values have the same order of magnitude reflects the validity of the theory. As snow metamorphism advances, it is expected that the rb/rg ratios increase with increasing density. The experimental results show that rb/rg ratios are not constant over time.
Fig. 8. A comparison between αη and A 6 The straight lines are the theoretical predictions of Mahajan and Brown for constant r b / r g ratios. The lower line r b / r g = 0.2; upper line r b / r g = 0.5. Note the good agreement between theory and experiment for low-density snow.
The ratio
indicates how much of the mechanical resistance of the sample is being controlled by dislocation straining of the ice bonds. We measured rb, rg and N3 using stereological thin sections and found n ≈ 0.8 and higher for both high- and low-density snow. We can therefore conclude from our analysis that dislocation straining of the ice bonds for the densities and strain rates considered in our triaxial tests is the dominant mechanism of deformation. For high-density snow, high values of rb/rg are required to match the experimental results, so the constitutive theory of Mahajan and Brown does not seem to apply.
Another important conclusion that can be drawn from the results is that new-snow bond-to-grain ratios are in the range 0.1 ≤ rb / rg ω0.2. This information is used to establish the initial microstructural conditions for our operational avalanche-forecasting models.
Finally the test results indicate very clearly that a constitutive law for snow viscosity, Vs, can be formulated in terms of ηi, the ice viscosity:
A comparison between the constitutive law and the experimental results is shown in Figure 6. This constitutive formulation has two advantages: the strain-rate effect so apparent in the experiments is included via the ice viscosity law ηi, and the microstructural parameters are included via the parameter βη.
Acknowledgements
We thank the Swiss National Science Foundation for financial support for this project. We also thank B. Salm for his helpful advice.


