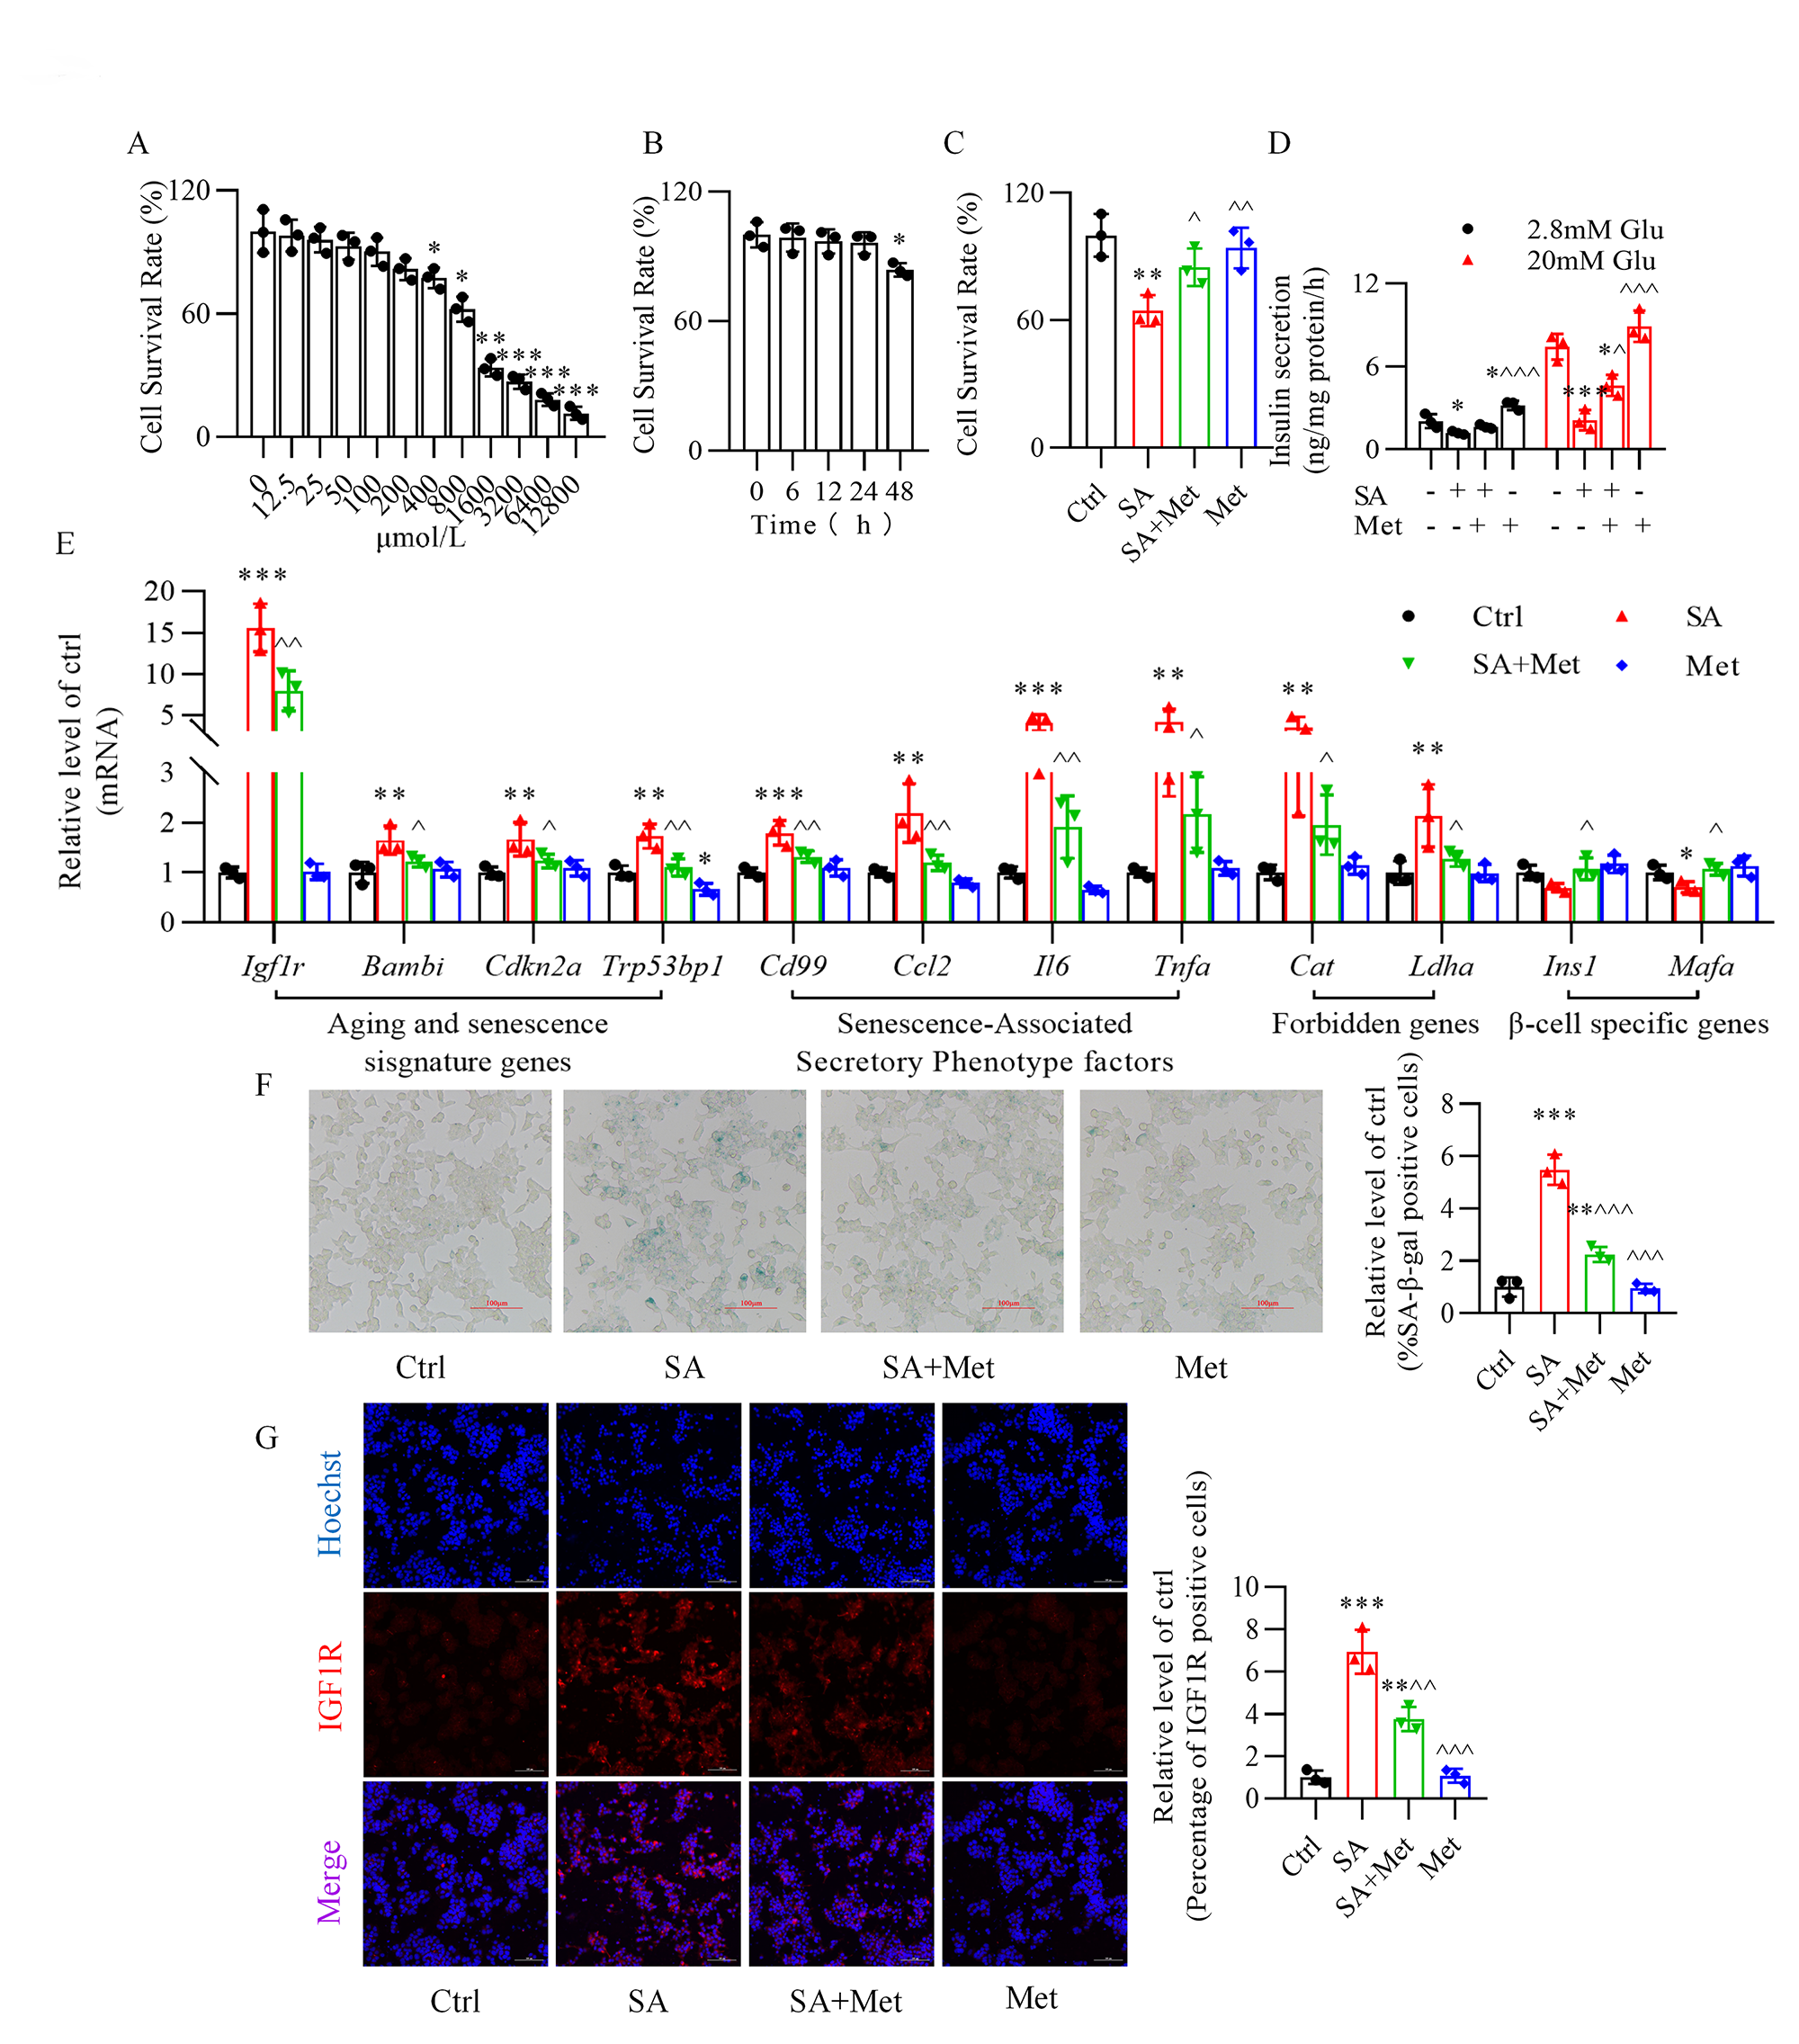
Fig. 1.Metformin protects against stearic acid-induced senescence in
mouse -TC6 cells. (A) Cytotoxic effect of metformin on the survival
rate of -TC6 cells at various concentrations (0, 12.5, 25, 50, 100, 200,
400, 800, 1600, 3200, 6400, and 12800 µmol/L). p 0.05,
p 0.01, p 0.001 vs. 0 mmol/L
group. (B) Cytotoxic effect of 50 µmol/L metformin on -cell
viability at various times (0, 6, 12, 24, and 48 h). p 0.05
vs. 0 h group. (C,D) Protective effect of metformin on the cell
survival rate and glucose-stimulated insulin secretion in stearic acid-treated
-TC6 cells. (E) Changes in expression of senescence-related genes after
treatment of -TC6 cells with metformin in the presence or absence of
stearic acid. (F) Effect of metformin on -galactosidase activity with or
without stearic acid treatment. (G) Immunofluorescence analysis shows the
expression of insulin-like growth factor-1 receptor (IGF1R) in -TC6
cells treated with metformin in the presence or absence of stearic acid. Hoechst,
blue; IGF1R, red. For C–G, p 0.05, p 0.01, p 0.001 vs. Ctrl group;
p 0.05,
p 0.01,
p 0.001
vs. SA group. Ctrl, control group; SA, stearic acid; Met, metformin. For
F and G, scale bar: 100 µm. Each independent experiment was repeated three
times.