
More Information
Submitted: March 08, 2023 | Approved: March 27, 2023 | Published: March 28, 2023
How to cite this article: Pan W, Kulisa P, Bou-Saïd B, El Hajem M, Simoëns S, et al. A proposal of risk indicators for pathological development from hemodynamic simulation: application to aortic dissection. J Cardiol Cardiovasc Med. 2023; 8: 029-038.
DOI: 10.29328/journal.jccm.1001150
Copyright License: © 2023 Pan W, et al. This is an open access article distributed under the Creative Commons Attribution License, which permits unrestricted use, distribution, and reproduction in any medium, provided the original work is properly cited.

A proposal of risk indicators for pathological development from hemodynamic simulation: application to aortic dissection
Wenyang Pan1, Pascale Kulisa2*, Benyebka Bou-Saïd1, Mahmoud El Hajem2, Serge Simoëns2 and Monica Sigovan3
1University of Lyon, CNRS, INSA Lyon, LaMCoS, UMR5259, 69621, Villeurbanne, France
2University of Lyon, INSA Lyon, Ecole Centrale de Lyon, Claude Bernard University Lyon 1, CNRS, LMFA, UMR5509, 69621, Villeurbanne, France
3Claude Bernard University Lyon 1, CREATIS, CNRS UMR 5220, INSERM U1206, INSA-Lyon, 69100 Villeurbanne, France
*Address for Correspondence: Pascale Kulisa, University of Lyon, INSA Lyon, Ecole Centrale de Lyon, Claude Bernard University Lyon 1, CNRS, LMFA, UMR5509, 69621, Villeurbanne, France, Email: pascale.kulisa@ec-lyon.fr
Cardiovascular diseases are the leading cause of mortality in the industrialized world. Among these diseases, aortic dissection affects the aorta wall and is a surgical emergency with a low survival rate. This pathology occurs when an injury leads to a localized tear of the innermost layer of the aorta. It allows blood to flow between the layers of the aortic wall, forcing the layers apart and creating a false lumen. Endovascular treatment seeks to obliterate the entrances to the false lumen with a covered stent. There are very few studies on the postoperative demonstration of blood flow phenomena in the aortic dissection endovascular treatment. It is crucial to study the hemodynamics of blood in the aorta after an intervention because the new geometrical configuration of the aorta with a stent leads to modifications in blood flow. For the surgeons, the procedure can only be performed empirically, using MRI-4D images to view the postoperative flow of the patient’s blood in the aorta with the stent.
This paper aims to present a numerical tool developed from the open-source software FOAM- Extend®, allowing for multiphysics numerical simulations. Using MRI data, a bio-faithful model of the patient-specific case was built. Numerical simulations were performed to predict preoperative and postoperative (endovascular treatment) hemodynamics. The modifications of the flow in the aorta were analyzed focusing on the postoperative perfusions. The results were compared with the corresponding MRI data and have a good qualitative agreement. Biomarkers are calculated to localize possible zones of post-operative pathological developments and recommendations may be suggested to the surgeons.
Cardiovascular disease is the world’s largest cause of death and is estimated that 17.9 million people are killed every year. The importance of cardiovascular diseases is expected to increase with the aging of the population (demographics), obesity (epidemiological factors), and the intensification of treatment (screening, early detection, etc.) [1,2]. Among these diseases, aortic dissection (AD) is relatively little known and difficult to treat, with a survival rate for the more serious cases not exceeding ten percent. Aortic dissection affects about three to six people per 100000 (International Registry of Acute Aortic Dissection, IRAD) [3] and AD occurs most frequently between the ages of 50 to 70 years old and affects males in approximately two-thirds of cases [4,5]. The main risk factors are high blood pressure, as well as pre-existing pathologies affecting the wall properties. When this condition occurs in the aorta, it is characterized by the emergence of blood inside the wall of the aorta [6,7], see Figures 1,2. Dissection corresponds to a localized tear in the inner layers of the aortic wall, called the entry site, through which the blood under pressure penetrates and separates the various layers of the aorta. Dissection of these layers may extend over a long portion of the ascending aorta, aortic cross, or descending aorta and iliac arteries [8]. It constitutes a surgical emergency.
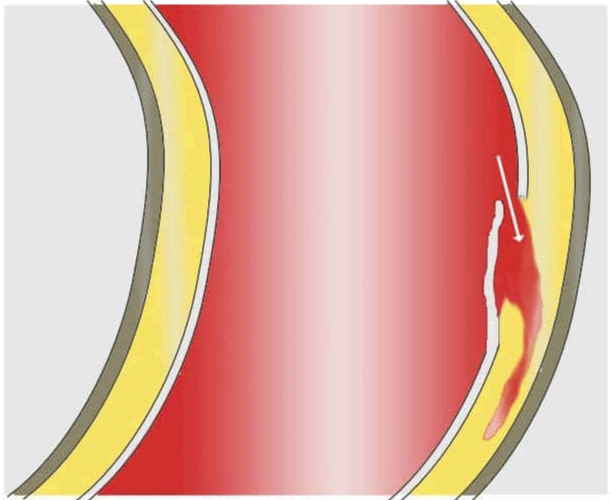
Figure 1: Diagram of an aortic dissection formation. (Image: Wikimedia Commons J.Heuser©).
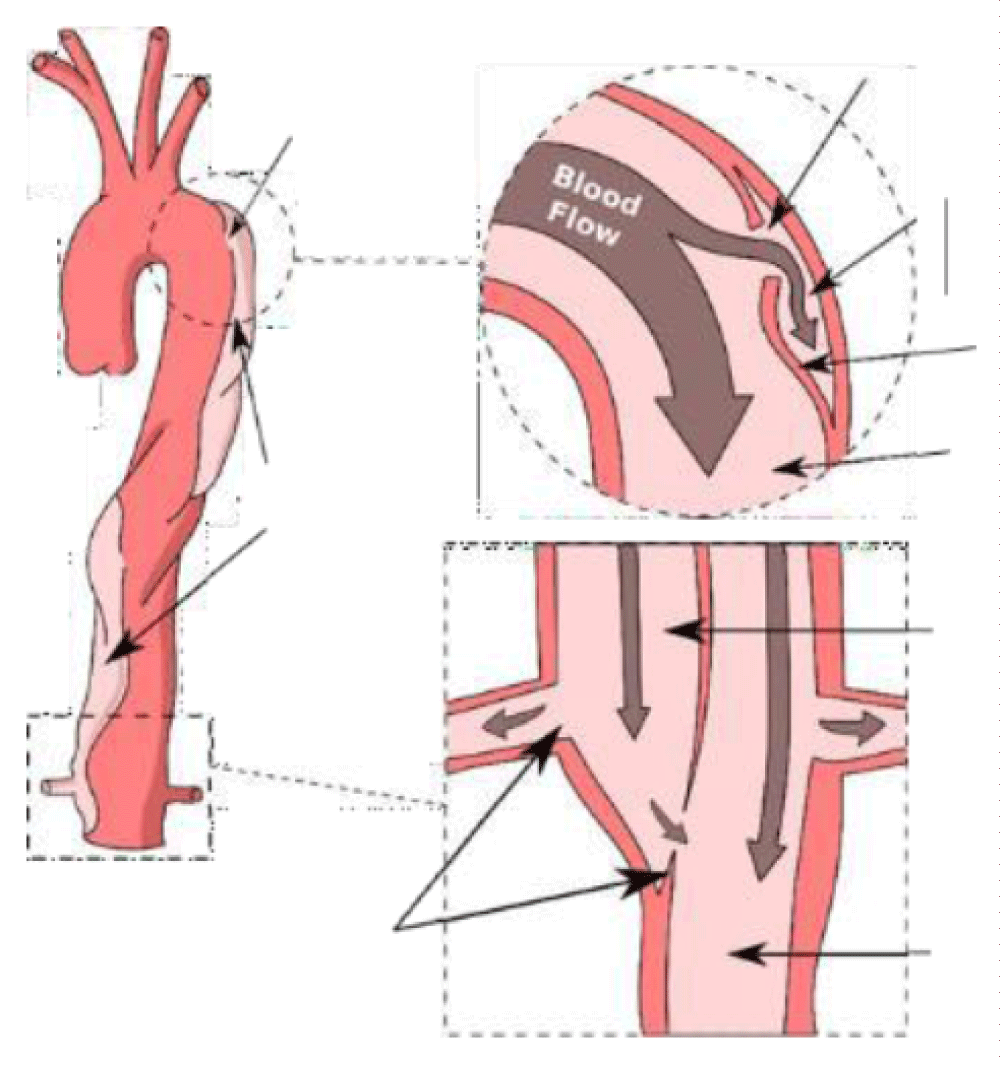
Figure 2: Aortic dissection with examples of entry and exit sites.
Surgery may be needed when AD reaches a critical state. Endovascular Aortic Repair (EVAR) is a minimally invasive treatment for AD. Endovascular treatment seeks to obliterate the entrance to the false lumen with a stent. It is performed surgically by making a small open incision in the femoral artery and sliding the stent graft along the femoral artery to the level of the aortic dissection to redirect blood flow by obliterating the entrance to the false lumen (Figure 3) [9,10].
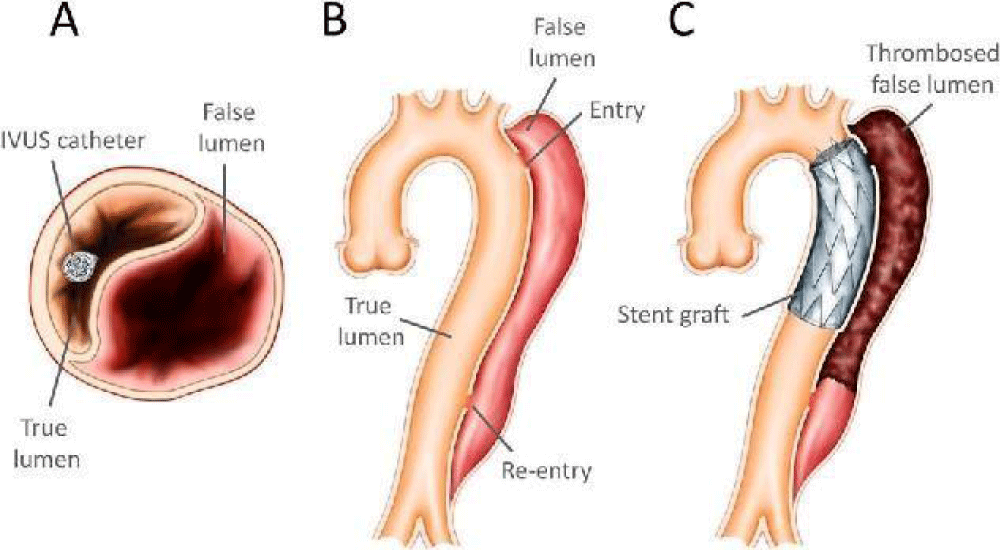
Figure 3: Diagram of an endovascular procedure: the stent is gradually deployed in a descending aortic dissection: (A) The presence of the IVUS (intra-vascular ultrasound) catheter in the true lumen; (B) Primary intimal rupture over the descending aorta; (C) Stent graft covering primary intimal tear. (Image: [9]).
Despite the advantages of this technique, such as shorter hospital stays, smaller incisions, faster recovery, and lower morbidities and mortality, the long-term development of endoprosthesis and the complications resulting from their installation have not been fully controlled. The complications generated by their implementation remain a subject of discussion and lifelong computerized tomography (CT) surveillance is mandatory annually [11]. In addition, the CT images are carried out before the intervention and therefore do not consider the deformation of the vascular structure by the prosthesis. These tools do not allow for anticipation of events that may unfold during treatment, which can lead to both poor sizing (length, diameter) and poor positioning of the stent but also postoperative mal perfusions. It is difficult for the surgeon to know beforehand the place where the stent will be the most effective (entry site, entry, output sites, etc.). Therefore, the positioning of the stent is an essential element for the success of the operation. This position leads to a new flow distribution that should be specified for the clinician. The proposed approach within the framework of computer-assisted surgical procedures is to propose an operational solution for the prediction of possible disturbances of flow after surgery and to quantify these disturbances by the means of biomarkers.
It is necessary to figure out the mechanical behavior of the aortic wall and the patient’s hemodynamic characteristics to build a realistic bio-faithful model. Many researchers [12-14] have been interested in numerical simulations of hemodynamics for several years, allowing the location of dissections to be correlated with the area of regions where blood flow is disturbed.
Rheology and nature of the blood flow
Blood rheological properties are crucial to the study of vascular mechanics. The response of the blood during a cardiac cycle can consist of two phases: a first systolic phase with high shear and therefore low-level blood viscosity, and a second diastolic phase with the lowest shear and an increase in blood level viscosity. Blood is composed of cells (red blood cells (RBC), white blood cells, and platelets) suspended in an aqueous solution (plasma). The RBC being the main component, the blood rheology depends on their properties: high deformability and aggregation [15,16]. Therefore, blood rheology exhibits non-Newtonian rheological properties like viscoelasticity, thixotropy, and shear thinning. These microscopic effects of blood play a key role in capillaries and arterioles (10 µm ≤ diameter < 300 µm) [17]. However, for large diameter vessels (diameter ≥ 300 μm) like abdominal aorta or iliac arteries, with a strain rate beyond 100 s-1, the viscosity is constant and non-Newtonian properties could be neglected [18]. Even if new results tend to show some modifications of the flow due to shear thinning [19] no proof exists demonstrating the modification of large stress locations responsible for tears. Yet, with unsteadiness, the strain rate may reach low values (< 100 s-1) during diastole, even in large arteries, near bifurcations, or in pathological arteries (recirculation zones downstream of stenosis). In that case, non-Newtonian behavior of blood may be significant [20].
The second hypothesis concerns the laminar-turbulent nature of the blood flow. Transitional laminar-turbulent flow is expected in large vessels in the vicinity of the heart (root sinus, ascending aorta to thoracic aorta where Reynolds number is moderate to high). Downstream to the thoracic aorta, the flow is considered laminar in the abdominal aorta [21] where the time-averaged Reynolds number is around 600 ranging from 400 to 1100, near the aortic bifurcation. In the common iliac arteries, the range of Reynolds number is lowered from 390 to 620, according to [22]. Similarly, pathological arteries with a stenotic section may lead to turbulent flow generally occurring during the systolic phase of the cycle [23]. Yet, under pathologic conditions [24] concludes that no turbulence occurs until stenosis exceeds 50% area reduction.
Hemodynamical flow
The role of hemodynamics in aortic dissection formation is well-recognized in the literature. Authors [12,25,26] have shown the existence of preferential sites for aortic dissection formation and have found that low and oscillating parietal stress favors dissection development by its impact on the shape and structure of endothelial cells. The improvement of medical imaging techniques [27-31] allow for providing more precise information on the rheological behavior of blood. In addition to the use of ultrasound imaging, which is often hampered by the organs covering the arterial vessels, the radiologist now has multiple magnetic resonance angiography (MRA) sequences that can be applied to most arterial sites and that enable a dynamic exploration of the main vascular pathologies. The work of [31] presented in Figure 4 shows the kind of studies that are now available with the new dynamic imaging techniques, called 4D MRI, for obtaining flow rates and velocity profiles at different moments of the cardiac cycle.
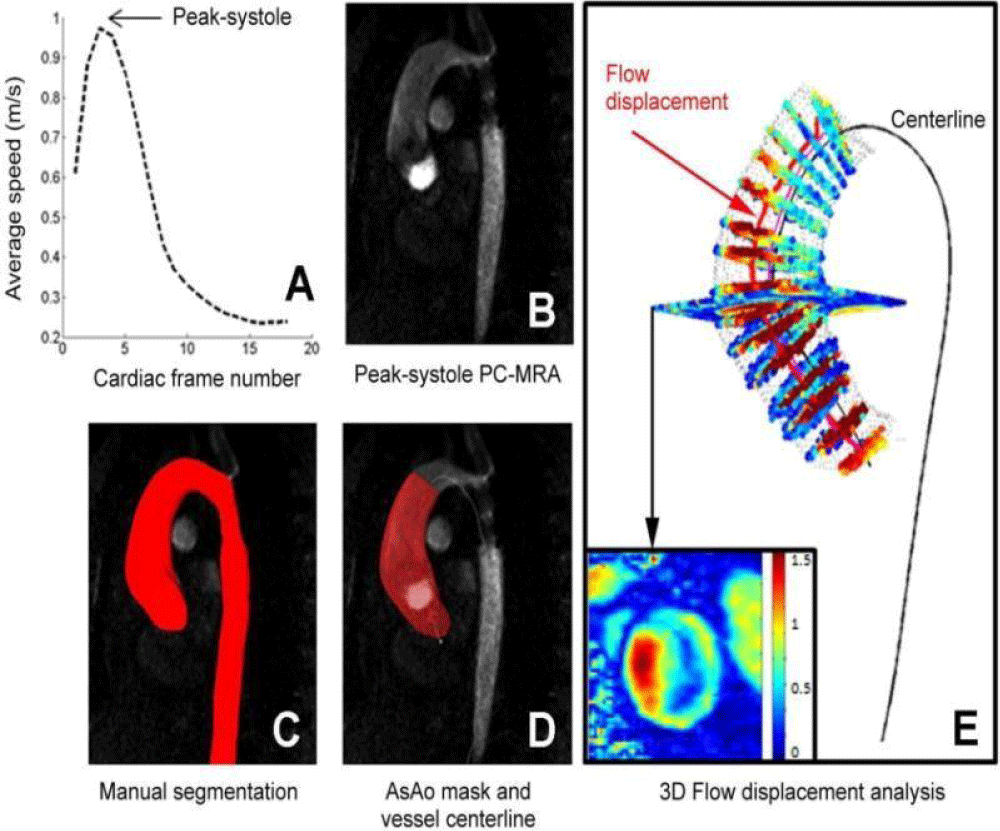
Figure 4: 3D flow analysis: (A) detection of the systolic peak, (B, C, D) manual segmentation at peak systolic and calculation of the centerline, (E) an example of 3D flow results obtained in the thoracic aorta [31].
In addition, in some studies, CFD simulations performed for measured flow conditions are primarily compared with in vivo 4D MRI measurements. For example, a comparison with a Newtonian flow model in an acute type B dissection located at the aortic isthmus is shown in Figure 5. It illustrates an impressive similarity in the results. In some cases, CFD simulations could help to determine which surgical procedure is most suitable to reform flow in the aortic dissection while also preserving blood flow. Additionally, numerical modeling based on medical imaging can provide guidance to clinicians by indicating possible complications based on simulation results, expecting potential success in improving flow with AD pathology before surgery.
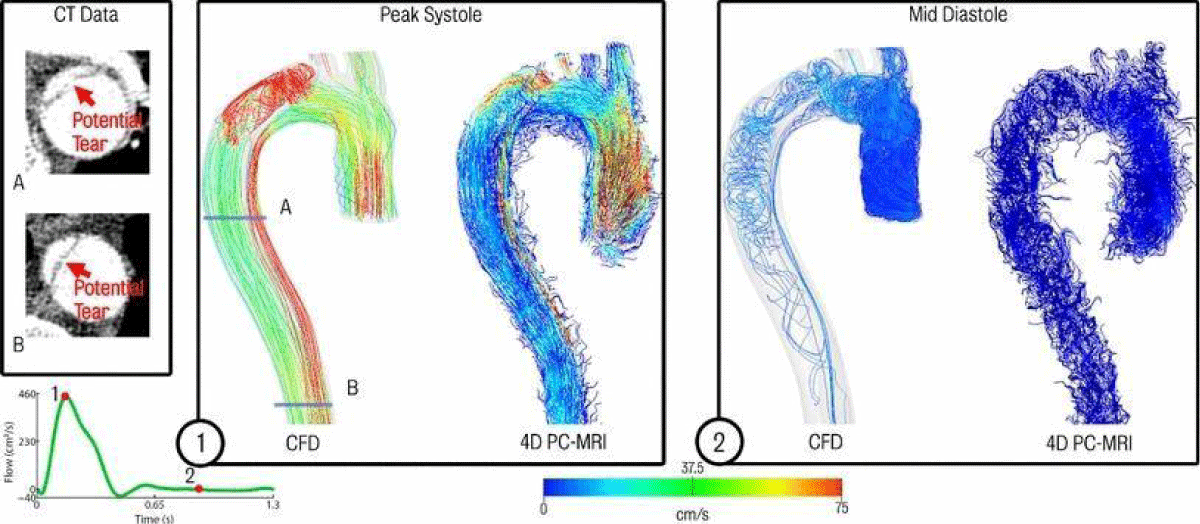
Figure 5: Comparison of CFD data and acquired 4D PC-MRI flow data at peak systole and mid diastole. Also shown are the CT image data at two locations showing suspected secondary tears which were not apparent in the 4D PC-MRI data [13].
Many mathematical and numerical models have been developed to simulate blood flow through individual large arteries. Blood flow properties in single large arteries are derived analytically or numerically from these mathematical models, using finite element, finite volume, or finite difference methods. Most non-Newtonian fluid models used are generalized Newtonian models, which do not account for time-dependent elastic or thixotropic effects.
Numerical modeling
CFD simulations based on patient-specific models may be able to provide insight into the biomechanical behavior of blood flow in aortic dissection, to predict quantitative analysis of hemodynamic patterns and clinical progression of aortic dissection [32]. Using CFD, it is possible to assess certain hemodynamic parameters that are difficult to quantify in-vivo. In this work, the fluid-structure virtual representation and interaction (fully unsteady incompressible three-dimensional Navier-Stokes equations + structure models) were solved with the open-source FOAMExtend® software. This solver uses a partitioned approach with strong fluid-structure coupling.
Dynamic flow measurements by 4D MRI were performed at the Hôpital de la Croix-Rousse (Lyon, France). The DICOM images were used for the reconstruction of the 3D bio-faithful model and processed by the commercial software Simpleware ScanIP 2017 (Synopsis, CA, USA). A polyhedral the mesh was created using the commercial program Star-CCM+© for this investigation (Figure 6).
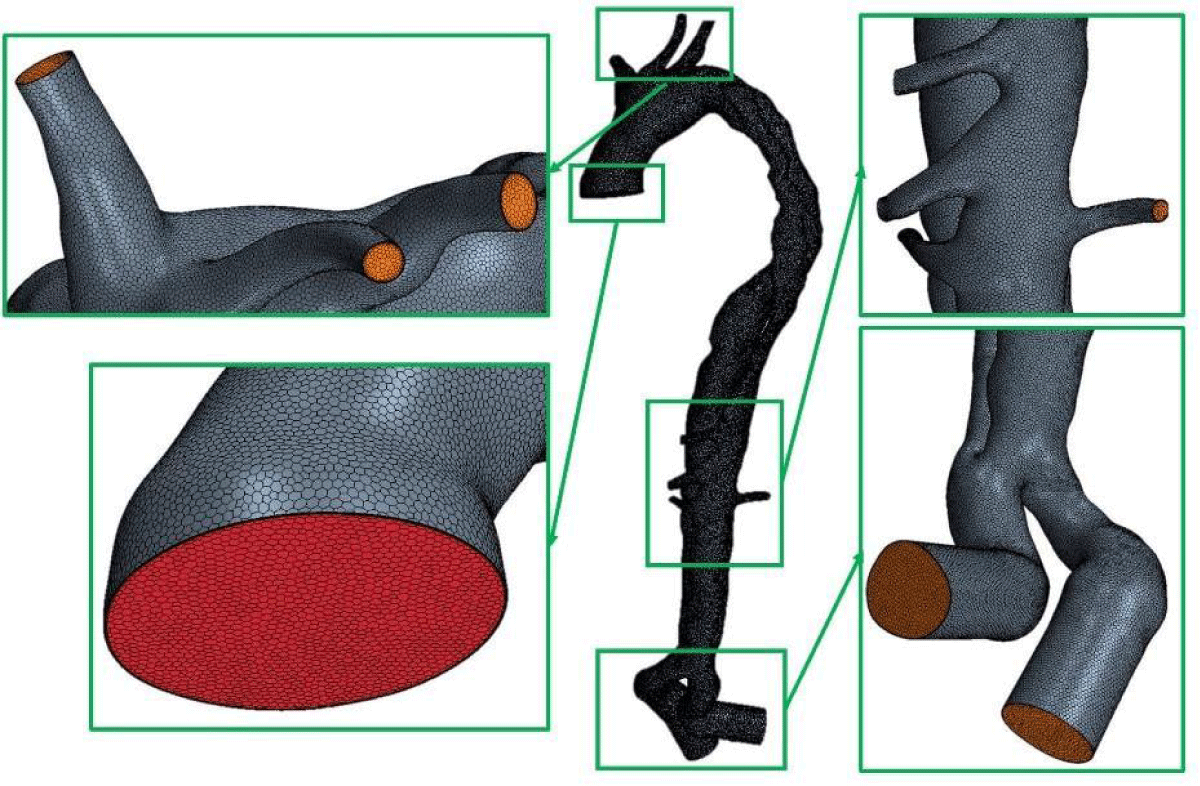
Figure 6: Polyhedral mesh generated with the commercial software Star-CCM+© (1642729 cells).
After completing the simulations (convergence was obtained after 8 cardiac cycles), ParaView©, an open-source program for post-processing CFD/FSI simulations, was used to assess the following values:
- The velocity field is used to identify the direction of blood flow from True Lumen (TL) to False Lumen (FL) (drawing the streamline that shows the direction in which a massless fluid element will move at any point in time).
- For CFD simulation, the wall shear stress (WSS) is defined as the magnitude of traction owing to the viscous portion of the Cauchy stress tensor τW.
Time-Averaged Wall Shear Stress (TAWSS) is the average WSS magnitude during one cardiac cycle [33]. It is defined as:
(1)
Where T is a cardiac cycle’s duration, and τw is WSS. TAWSS is an interesting metric to study because it can be used to look at the WSS distribution on the artery and identify areas with low WSS. Generally, TAWSS for the arterial system is between 10 to 70 dym/cm2 [34]. Work by [35] has shown that low shear stress (<4 dyn/cm2), common in areas prone to atherosclerosis, promotes an atherogenic phenotype and thrombus formation.
- Oscillatory Shear Index (OSI) was developed to account for the wall shear stress vector’s cyclic deviance from its primary axial alignment [33,36] and it is defined as:.
(2)
OSI is an excellent predictor of plaque’s initial placement [37]. This variable’s value fluctuates between 0 and 0.5. The higher the OSI, the greater the change in shear stress direction.
- The relative residence time (RRT) is a criterion for disturbance of blood flow [33]. It is proportional to the magnitude of the TAWSS:
RRT = [(1 − 2 × OSI) × TAWSS]−1 (3)
RRT is suggested as a robust single metric for low and oscillating shear in low and oscillating conditions. The residence duration of the particles along the wall is closely related to the RRT [38]. A high RRT has been identified as being essential in the development of atherogenesis and in-stent restenosis [39]. When RRT < 1, the zones are submitted to high shear; when RRT > 1, the zones are subjected to both low and oscillating shear stress and the associated areas with only low WSS. Post TEVAR, analysis of RRT may indicate thrombosis establishment [40].
Dynamic flow measurements by 4D MRI were performed at the Hospices Civils de Lyon on several patients with aortic dissection pathology. First, measurements in 2D PC-MRI with 3D velocity encoding were made by the surgeon. The slice planes were selected to calculate flow rates at the ascending, supra-aortic, and descending thoracic aorta. As a result, the 4D flow MRI acquisition includes a dynamic sequence to cover the entire thoracic aorta with the aortic dissection over 20 cardiac phases. The images (DICOM) from MRI were exploited for the reconstruction of the 3D model that was used in our numerical simulations (Figure 7).
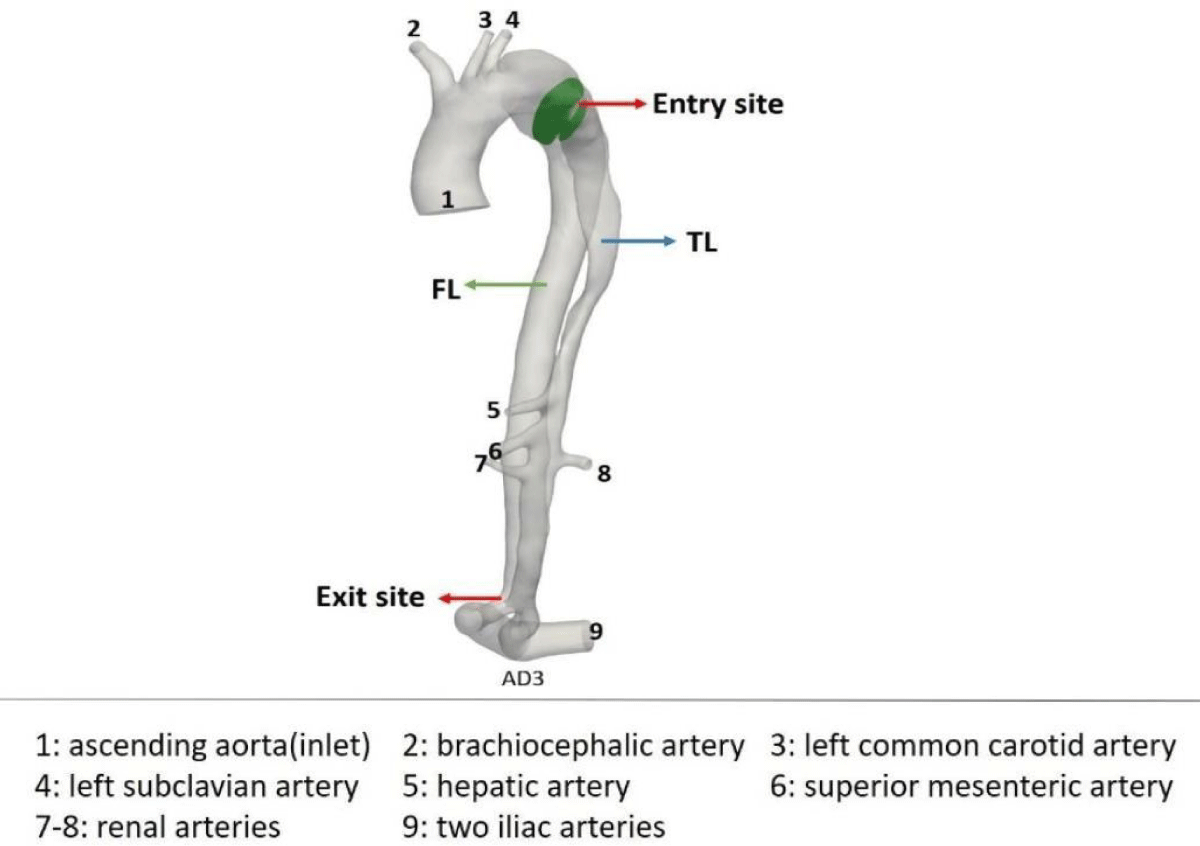
Figure 7: Bio-faithful AD case.
For the presented chosen case, due to the particular shape of the aortic dissection and the blood flow (helical flow) between the TL and the FL in vivo (Figure 8), the surgeon placed a stent inside the FL when performing interventional procedures. The surgeon observed a helical flow in the stent in vivo with 4D-MRI. Therefore, it is interesting to perform postoperative numerical simulations for this case and to compare them with preoperative simulations.
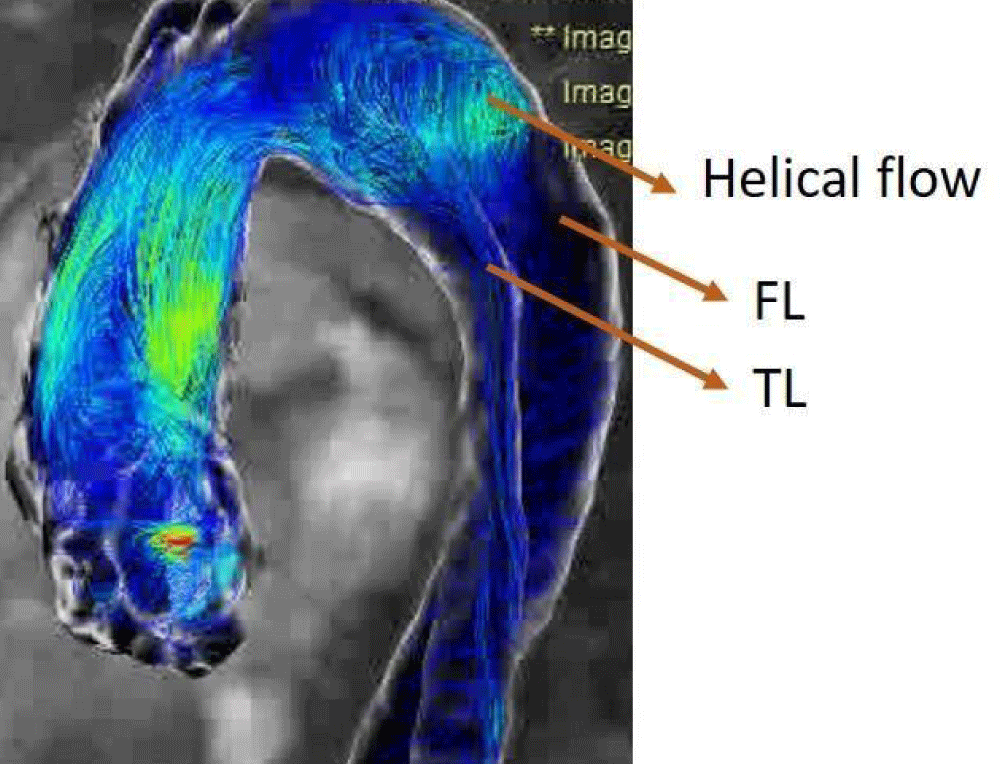
Figure 8: 4D-MRI flow data with the helical flow.
For the numerical simulation in preoperative and postoperative conditions, a reconstruction of the bio-faithful model with the patient-specific case MRI data (Figure 9) was performed and the model was meshed using the StarCCM+ software (Figure 6, Figure 9). Next, the patient-specific velocity field for the ascending (inlet) aorta was built up with the flow measured by MRI.
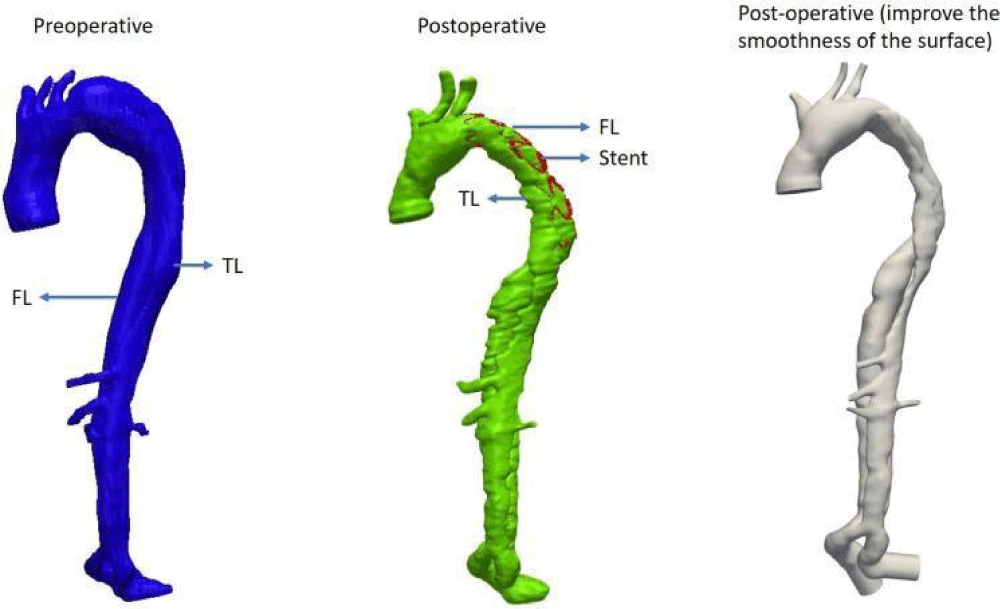
Figure 9: Reconstruction of the bio-faithful model with MRI data.
The Windkessel model parameters used, Rp, Rd, and C, first set based on data from [41,42] for the three supra-aortic trunks, the four arteries on the descending aorta, and the two iliac arteries were used, and then manually adjusted based on dynamic imaging data. This realignment of the parameters allows adaptation to the patient-specific data, providing patient-specific resistance and compliance values Table 1.
| Table 1: Windkessel model parameters applied to a fluid model output and adjusted with MRI data. | |||
| Rp ×106m−1 · s−1 |
Rd ×106m−1 · s−1 |
C ×10−7m · s2 |
|
| Brachiocephalic artery | 0.0525 | 0.834 | 8.63 |
| Left common carotid artery | 0.147 | 2.232 | 3.1 |
| Left subclavian artery | 0.072 | 1.2135 | 8.0 |
| Hepatic artery | 0.1387 | 0.78 | 5.15 |
| Superior mesenteric artery | 0.1387 | 0.78 | 5.15 |
| Renal arteries (Right&Left) | 0.314 | 0.692 | 5.725 |
| Iliac arteries (Right&Left) | 0.035 | 0.5 | 14.4 |
Figure 10 shows a comparison between the blood flow rate recorded with PC-MRI and the blood flow rate produced with the CFD model at four distinct locations: ascending aorta (inlet), brachiocephalic artery, left common carotid artery, and left subclavian artery. Overall, the anticipated waveforms match with those seen in vivo and there is an excellent synchronization between the two waves in each of the four sites studied.
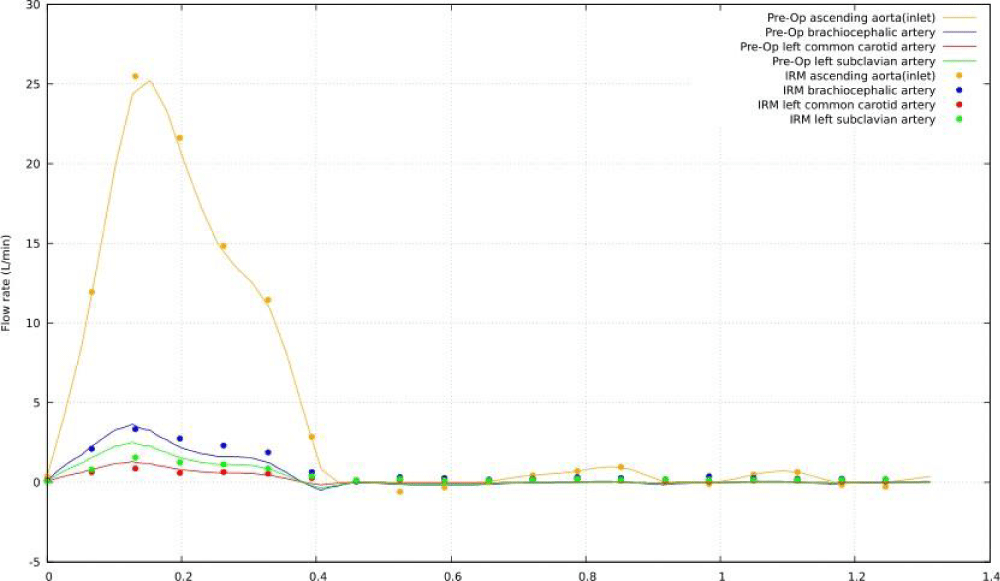
Figure 10: Comparison of MRI data and CFD simulation of preoperative flow rates.
The flow streamlines with preoperative 4D-MRI data and CFD simulations are compared (Figure 11). The same flow phenomena between in vivo and CFD simulation are observed, even if at peak systole, the velocity in TL of CFD simulation is more significant than the MRI data.
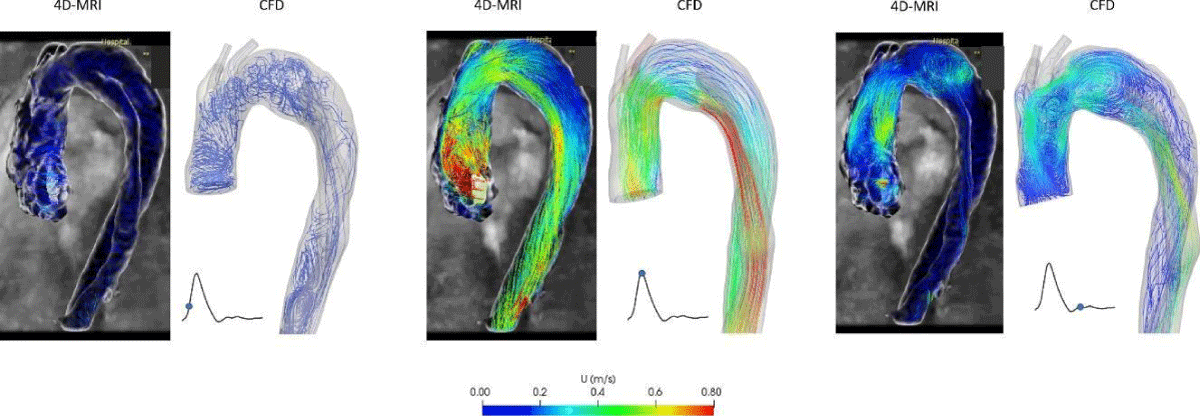
Figure 11: Comparison of the flow streamlines between 4D-MRI data and CFD simulation of preoperative.
As shown in Figure 12, the velocity magnitude 2D map on different sections of the aorta was extracted from numerical simulations at various times during the peak systole of the patient (t = 0.13s), throughout the flow decay (t = 0.2s), at the end of the systole (t = 0.3s), and the beginning of diastole (t = 0.45s). Compared with 4D-MRI results in the corresponding time, the velocity distribution has the same trend in each section, with an interesting agreement.
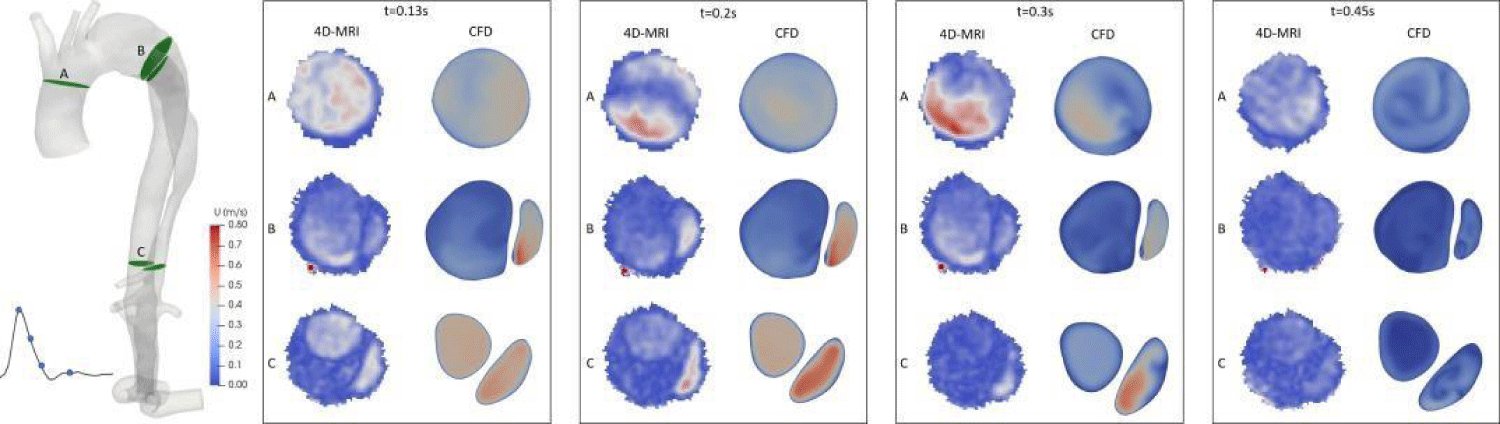
Figure 12: Velocity magnitude 2D maps on several sections along the aorta and compared with 4D-MRI.
With streamlined plots, it is possible to conduct another detailed analysis of the hemodynamics along the true and false channels. The rise to systole, Figure 13, comes with a flow with significant levels of speed. The feeding of the false channel (green) is clearly visible. Note that the confluence of the two channels takes place after the bifurcation towards the iliac arteries and therefore their perfusion is not symmetrical. The true channel only supplies the right iliac. The false channel feeds both the true and the false channels.
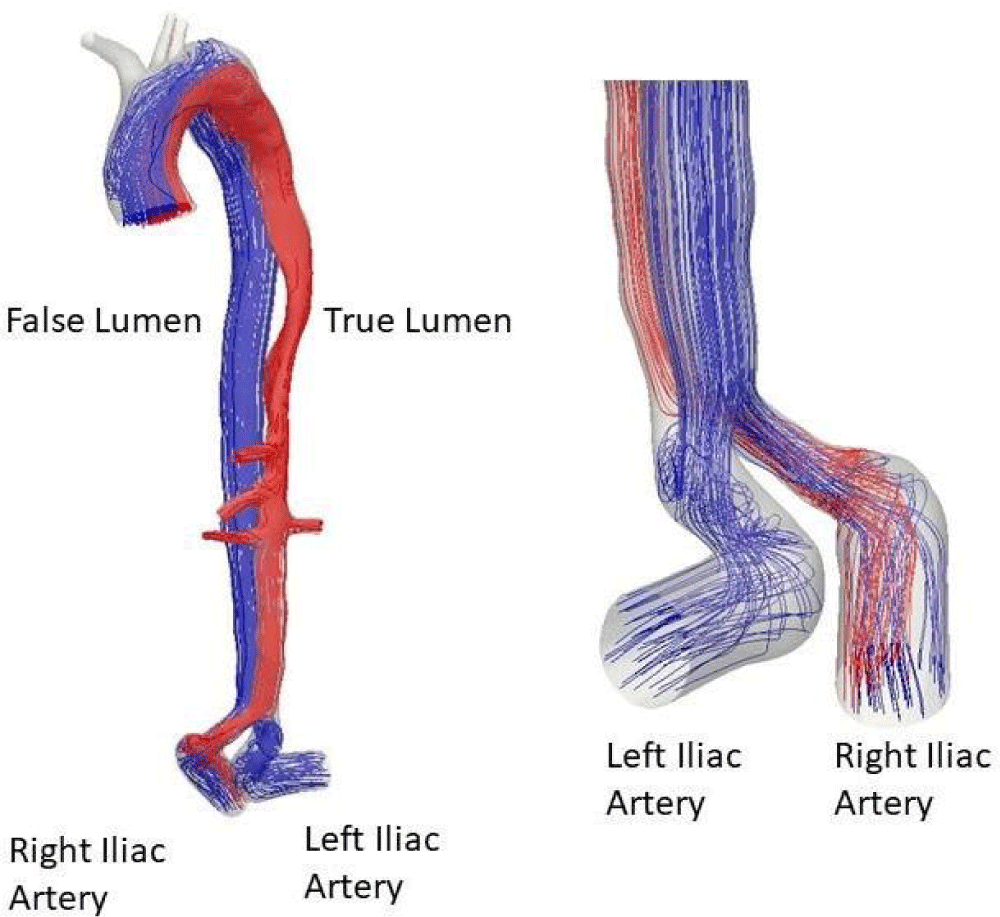
Figure 13: Streamlines at systole.
At diastole, reflux sets in the iliac arteries Figure 14 (a). The same method is applied to understand how the arteries are perfused. It may be observed that the two iliac arteries feed both the true and the false channels (b). In the false channel, the reflux rises to the tear of the dissection (c), then descends again in the true channel (d) and contributes to the perfusion of the celiac, mesenteric and renal arteries.
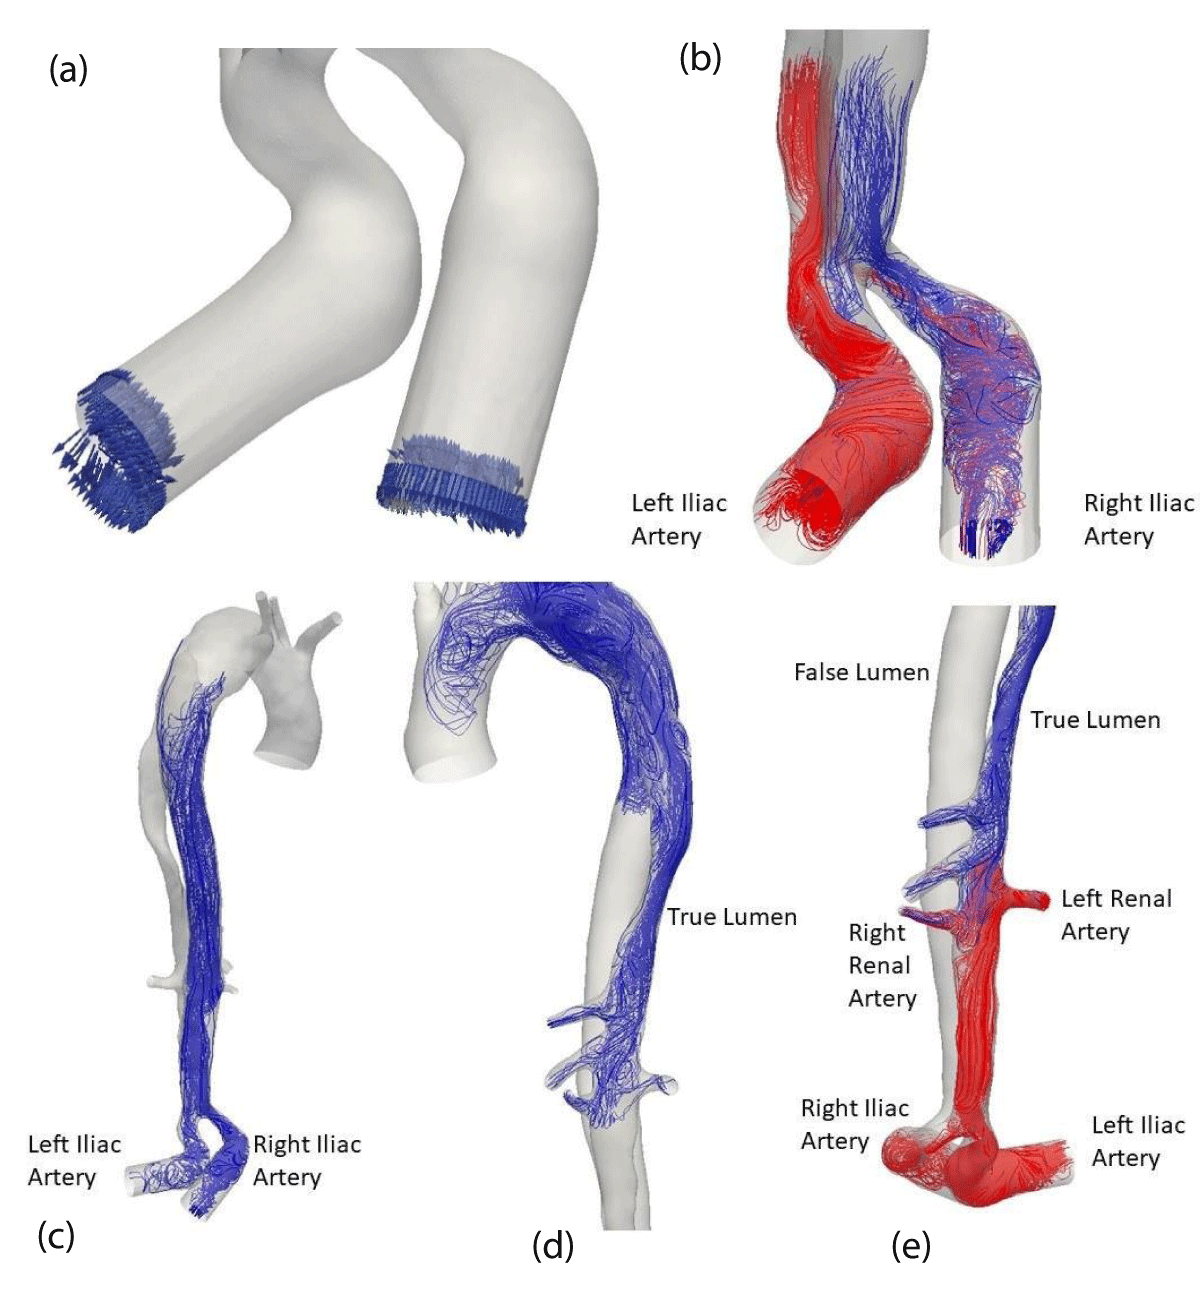
Figure 14: Streamlines at diastole.
At the end (e), the renal arteries are irrigated: during the systolic phase by the true channel and then during the diastolic phase by the true and the false channel. The situation is different for the celiac trunk and the mesenteric artery. They are well irrigated by the true channel at systole but only by reflux from the false channel at diastole.
One of the most important outcomes of these simulations is the prediction of wall shear stress, which is usually evaluated using a variety of indices, such as the time-averaged wall shear stress (TAWSS), oscillatory shear index (OSI), and relative residence time (RRT). The distribution of the wall shear stress produced via CFD simulation is discussed below.
In the aortic branches and the distal TL, elevated TAWSS values can be seen (Figure 15). Due to the pathological thoracic aorta’s higher hydrodynamic resistance, there is more flow in the three branches than would usually be anticipated in a healthy aorta. Therefore, the branches have higher TAWSS scores. Despite the decreased flow rate via the distal TL, its geometric constriction increases local velocities, resulting in higher TAWSS values. Also, higher values of TAWSS greater than 5Pa can be observed in the postoperative analysis, not only due to the advanced age of the patient (78 years) but also due to the placement of the stent in the LF, which is narrower than the normal thoracic artery. The false lumen is subject to the development of calcification plaque. Therefore, the distribution and fluctuation of wall shear stress characteristics throughout the cardiac cycle is essential to assess risk areas with preoperative and postoperative measurements.
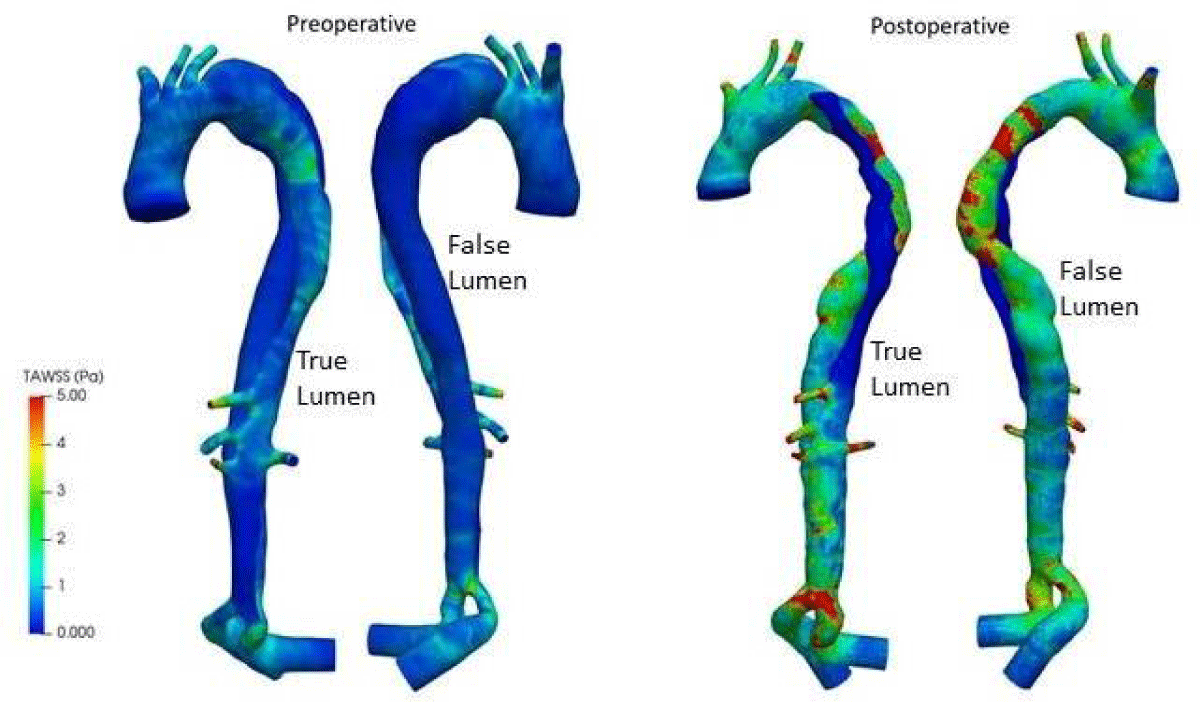
Figure 15: TAWSS distributions for preoperative and postoperative.
The oscillatory shear index (OSI), shown in Figure 16, measures the flow’s oscillatory character. This index fluctuates significantly throughout the domain, except in the distal and proximal TL. It continuously shows high values, indicating a significant variation in directionality compared to the average flow. In the postoperative results, it can be observed a section upstream of the TL with extremely high OSI values, indicating that blood flows from the FL to the exit of dissection, and backflows into the FL, then generating oscillations in TL. Since WSS is one of the potential factors [35] in the formation of atherosclerotic plaque, high WSS is related to plaque rupture in atherosclerotic cases, while low shear stress is associated with acceleration of plaque progression. Real-time postoperative monitoring of the patient is necessary.
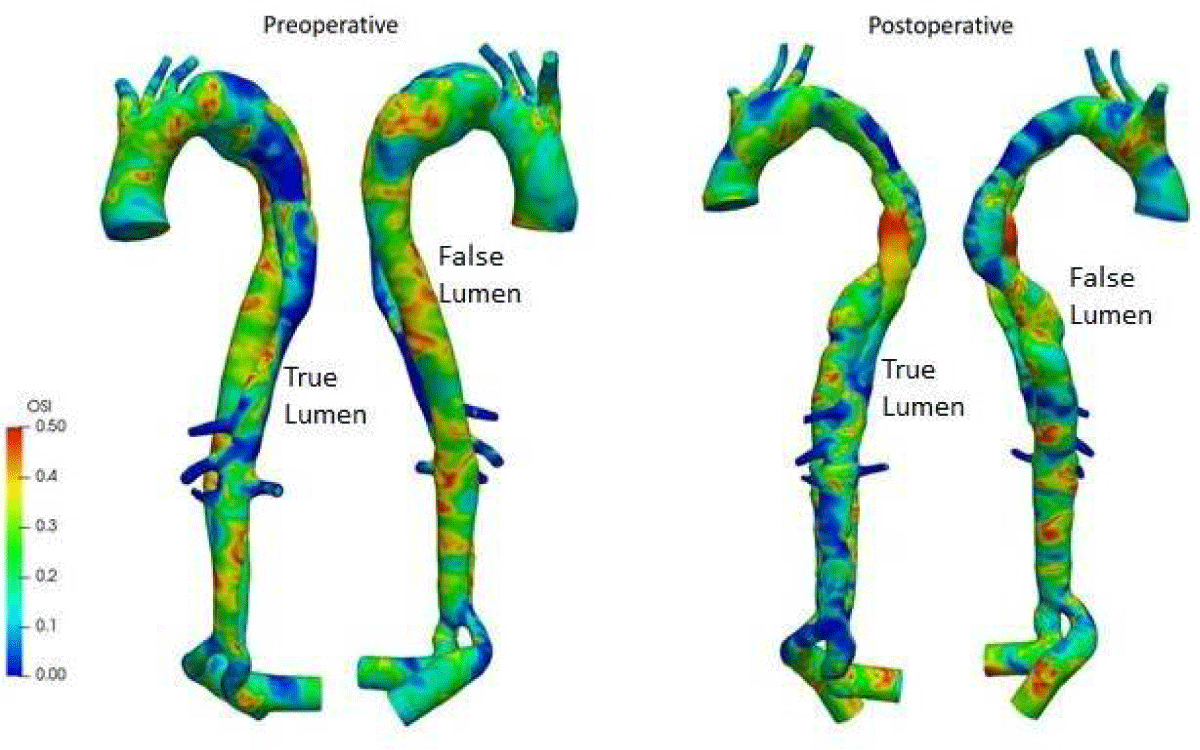
Figure 16: OSI distributions for preoperative and postoperative.
The relative residence time (RRT) is a surrogate for disturbed blood flow, characterized by low magnitude and strong oscillatory wall shear stress. The RRT distribution (high values) is a useful tool for detecting potential atheromatic plaque localization areas. Figure 17 shows that RRT high values are significant throughout the domain of FL in preoperative, leading to an aneurysm pathology if not treated quickly. And postoperatively, it can be noted that the domain of high RRT values has disappeared in FL. However, due to the irregular small amount of blood flow in the region upstream of the TL, the value was high.
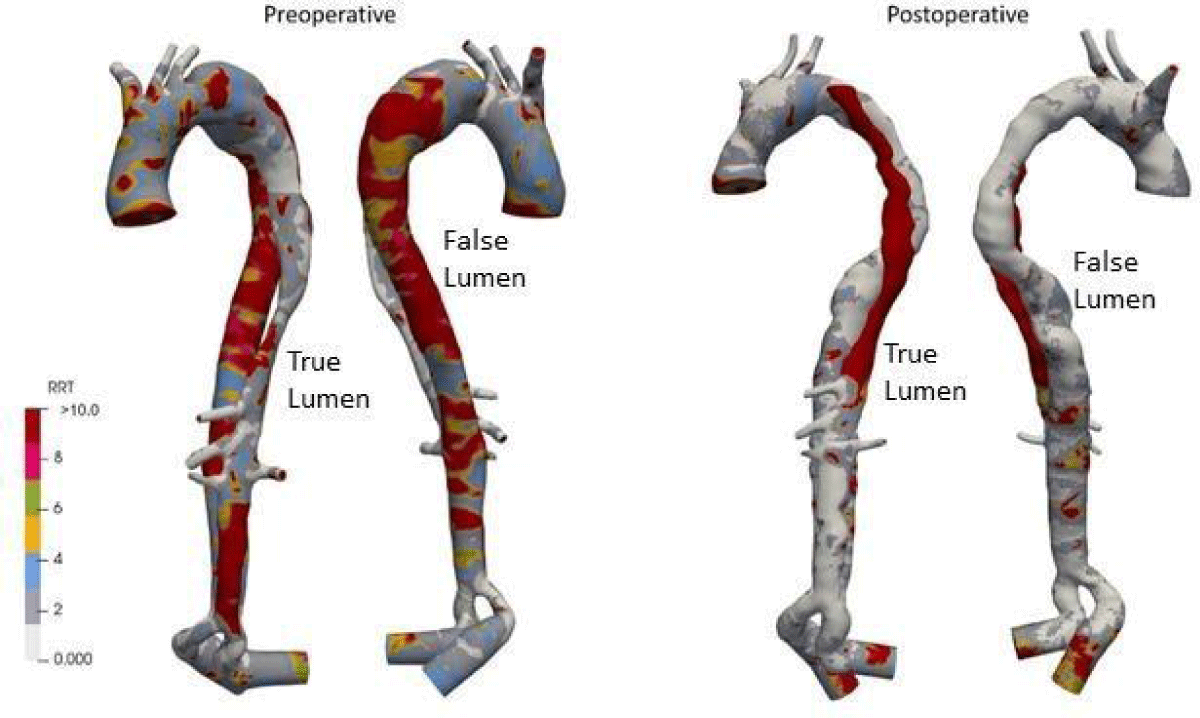
Figure 17: RRT distributions for preoperative and postoperative.
The helical structures of blood flow can be evaluated in terms of localized normalized helicity (LNH) that describes the cosine of the angle between the local vorticity 𝜔⃗→(𝑟→, 𝑡) and local velocity 𝑢⃗→(𝑟→, 𝑡) vectors [43].
𝜔⃗→(𝑟→, 𝑡) = ∇ × 𝑢⃗→(𝑟→, 𝑡) (4)
(5)
Due to the presence of a helical flow observed for this patient both preoperatively and postoperatively from 4D MRI, LNH (with a threshold of LNH = ± 0.8) is used to identify if there were any elevated helical structures in the overall flow at the onset of systole, at peak of systole, at a deceleration of systole and at mid-diastole, (Figure 18) left the helical structure in blue, right in red.
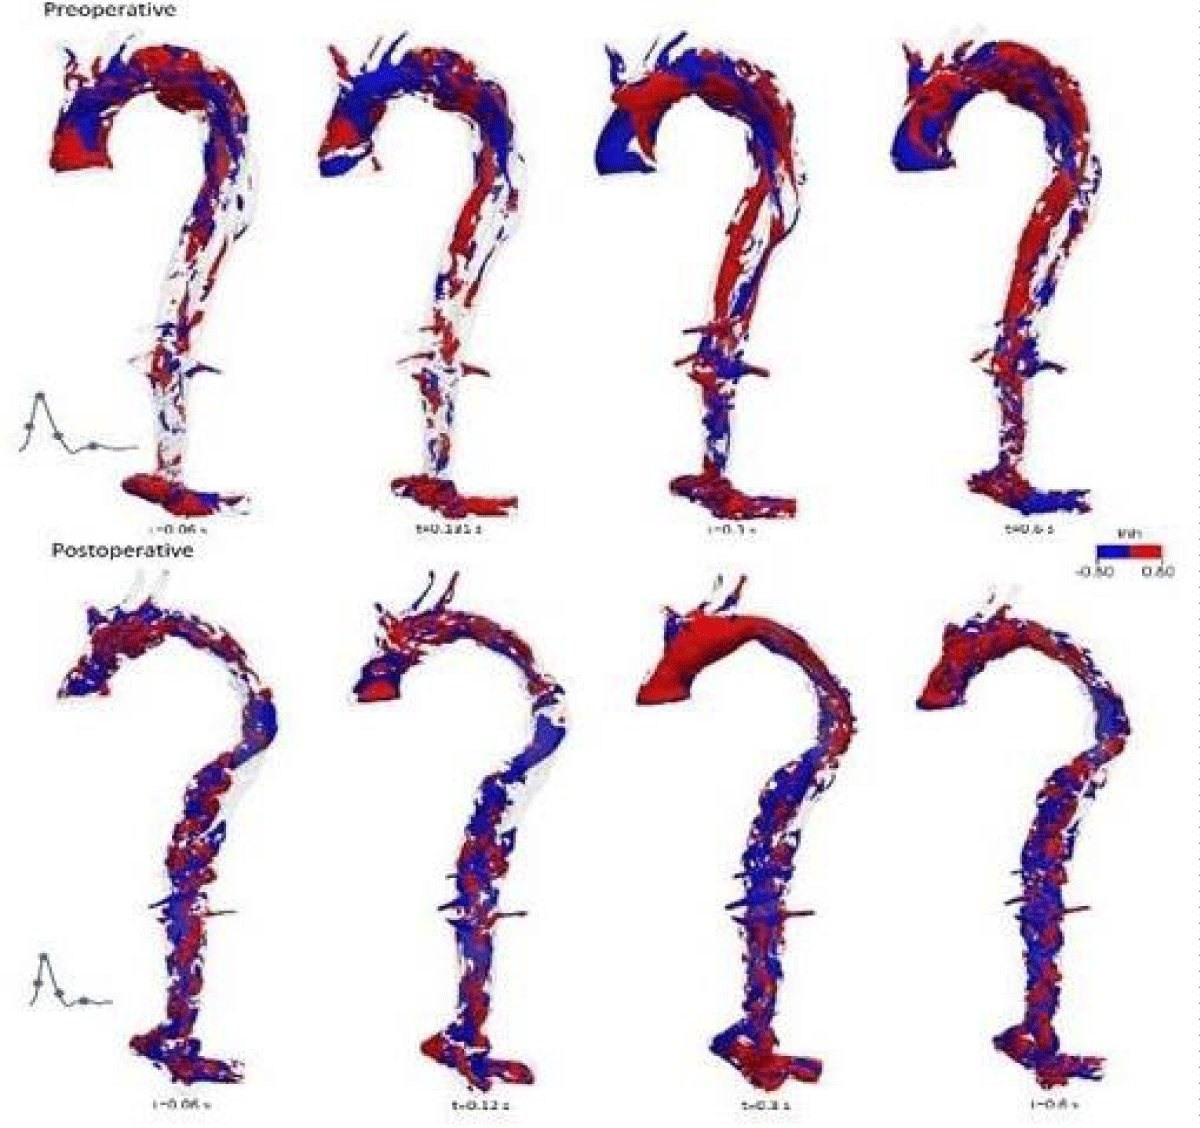
Figure 18: LNH distributions for preoperative and postoperative.
Preoperatively, the presence of counter-rotating helical structures upstream of the ascending aorta, in the bulge area (the entrance to the dissection) and in the region of the two common iliac arteries, are unveiled during the cardiac cycle. There are helical structures found along the descending thoracic aorta during the deceleration of systole and diastole.
For postoperative, LNH showed that helical structures distributed almost the entire aorta during the cardiac cycle and were distributed approximately equally between clockwise (red) and counterclockwise (blue) structures. Indeed, the postoperative patient has a narrower diameter than the arterial size of the preoperative patient, indicating the existence of a more stable and helical flow pattern due to vascular remodeling despite the higher blood flow.
The purpose of this research was to assess and verify patient-specific preoperative and postoperative simulations of AD using qualitative and quantitative comparisons to in vivo data obtained by 4D-MRI. The findings of these simulations must be biologically right to offer valuable insights. It means securing model parameters from patient-specific data, such as geometry and input and outflow boundary conditions. The use of 3D inlet velocity profiles and 3-element Windkessel outlet models has been shown to produce the most physiologically accurate CFD model results.
A patient-specific AD bio-faithful CFD model has been created to investigate dissection’s hemodynamics and obtain a mechanical knowledge of critical anatomical characteristics associated with different disease progressions (atherosclerosis, aneurysm, etc.). The results were compared with the corresponding MRI data and have a good qualitative agreement.
Fluid dynamic markers significantly impact AD’s long-term progression. CFD models may be used to accurately predict hemodynamic indicators such as WSS and other important biomarkers that are difficult to measure experimentally and impossible to assess in vivo.
It can be concluded that numerical tools are a promising option for analyzing hemodynamics in AD.
Ethics statement
Written informed consent was obtained from all included patients to the work on their anonymous image data.
- Tsao CW, Aday AW, Almarzooq ZI, Alonso A, Beaton AZ, Bittencourt MS, Boehme AK, Buxton AE, Carson AP, Commodore-Mensah Y, Elkind MSV, Evenson KR, Eze-Nliam C, Ferguson JF, Generoso G, Ho JE, Kalani R, Khan SS, Kissela BM, Knutson KL, Levine DA, Lewis TT, Liu J, Loop MS, Ma J, Mussolino ME, Navaneethan SD, Perak AM, Poudel R, Rezk-Hanna M, Roth GA, Schroeder EB, Shah SH, Thacker EL, VanWagner LB, Virani SS, Voecks JH, Wang NY, Yaffe K, Martin SS. Heart Disease and Stroke Statistics-2022 Update: A Report From the American Heart Association. Circulation. 2022 Feb 22;145(8):e153-e639. doi: 10.1161/CIR.0000000000001052. Epub 2022 Jan 26. Erratum in: Circulation. 2022 Sep 6;146(10):e141. PMID: 35078371.
- Vaduganathan M, Mensah GA, Turco JV, Fuster V, Roth GA. The Global Burden of Cardiovascular Diseases and Risk: A Compass for Future Health. J Am Coll Cardiol. 2022 Dec 20;80(25):2361-2371. doi: 10.1016/j.jacc.2022.11.005. Epub 2022 Nov 9. PMID: 36368511.
- Myrmel T, Larsen M, Bartnes K. The International Registry of Acute Aortic Dissections (IRAD) - experiences from the first 20 years. Scand Cardiovasc J. 2016 Oct-Dec;50(5-6):329-333. doi: 10.1080/14017431.2016.1240829. Epub 2016 Nov 2. PMID: 27806642.
- Levy D, Goyal A, Grigorova Y, Farci F, Le JK. Aortic Dissection. 2022 Dec 11. In: StatPearls [Internet]. Treasure Island (FL): StatPearls Publishing; 2023 Jan–. PMID: 28722992.
- Sen I, Erben YM, Franco-Mesa C, DeMartino RR. Epidemiology of aortic dissection. Semin Vasc Surg. 2021 Mar;34(1):10-17. doi: 10.1053/j.semvascsurg.2021.02.003. Epub 2021 Feb 5. PMID: 33757630.
- Lombardi JV, Hughes GC, Appoo JJ, Bavaria JE, Beck AW, Cambria RP, Charlton-Ouw K, Eslami MH, Kim KM, Leshnower BG, Maldonado T, Reece TB, Wang GJ. Society for Vascular Surgery (SVS) and Society of Thoracic Surgeons (STS) reporting standards for type B aortic dissections. J Vasc Surg. 2020 Mar;71(3):723-747. doi: 10.1016/j.jvs.2019.11.013. Epub 2020 Jan 27. PMID: 32001058.
- Wik: https://en.wikipedia.org/wiki/Aortic_dissection (image: J.Heuser©)
- Murillo H, Molvin L, Chin AS, Fleischmann D. Aortic Dissection and Other Acute Aortic Syndromes: Diagnostic Imaging Findings from Acute to Chronic Longitudinal Progression. Radiographics. 2021 Mar-Apr;41(2):425-446. doi: 10.1148/rg.2021200138. PMID: 33646901.
- Uchida T, Sadahiro M. Thoracic Endovascular Aortic Repair for Acute Aortic Dissection. Ann Vasc Dis. 2018 Dec 25;11(4):464-472. doi: 10.3400/avd.ra.18-00127. PMID: 30637000; PMCID: PMC6326065.
- Cosset B, Boussel L, Davila Serrano E, Millon A, Douek P, Farhat F, Sigovan M. Hemodynamic Changes Before and After Endovascular Treatment of Type B Aortic Dissection by 4D Flow MRI. Front Cardiovasc Med. 2022 May 25;9:873144. doi: 10.3389/fcvm.2022.873144. PMID: 35694668; PMCID: PMC9174570.
- Ten Bosch JA, Rouwet EV, Peters CT, Jansen L, Verhagen HJ, Prins MH, Teijink JA. Contrast-enhanced ultrasound versus computed tomographic angiography for surveillance of endovascular abdominal aortic aneurysm repair. J Vasc Interv Radiol. 2010 May;21(5):638-43. doi: 10.1016/j.jvir.2010.01.032. Epub 2010 Apr 2. PMID: 20363153.
- Zhu Y, Mirsadraee S, Rosendahl U, Pepper J, Xu XY. Fluid-Structure Interaction Simulations of Repaired Type A Aortic Dissection: a Comprehensive Comparison With Rigid Wall Models. Front Physiol. 2022 Jun 14;13:913457. doi: 10.3389/fphys.2022.913457. PMID: 35774287; PMCID: PMC9237394.
- Dillon-Murphy D, Noorani A, Nordsletten D, Figueroa CA. Multi-modality image-based computational analysis of haemodynamics in aortic dissection. Biomech Model Mechanobiol. 2016 Aug;15(4):857-76. doi: 10.1007/s10237-015-0729-2. Epub 2015 Sep 28. PMID: 26416312; PMCID: PMC4945697.
- Pan W, Kulisa P, Escriva X. Computer aided surgery: Application to aortic dissection. Annals of Vascular Medicine & Research. 2020; 7(5):1120.
- Robertson AM, Sequiera A, Owens RG. Rheological models for blood. Cardiovascular Mathematics. 2009; 1. Chap. 6 Formaggia L, Quarteroni A, Veneziana A Eds.
- Walker AM, Johnston CR, Rival DE. On the characterization of a non-Newtonian blood analog and its response to pulsatile flow downstream of a simplified stenosis. Ann Biomed Eng. 2014 Jan;42(1):97-109. doi: 10.1007/s10439-013-0893-4. Epub 2013 Aug 23. PMID: 23975383.
- Pries AR, Neuhaus D, Gaehtgens P. Blood viscosity in tube flow: dependence on diameter and hematocrit. Am J Physiol. 1992 Dec;263(6 Pt 2):H1770-8. doi: 10.1152/ajpheart.1992.263.6.H1770. PMID: 1481902.
- Berger SA, Jou LD. Flow in stenotic vessels. Annual Rev Fluid Mech. 2000; 32: 347.
- Moravia A, Simoëns S, El Hajem M, Bou-Saïd B, Kulisa P, Della-Schiava N, Lermusiaux P. In vitro flow study in a compliant abdominal aorta phantom with a non-Newtonian blood-mimicking fluid. J Biomech. 2022 Jan;130:110899. doi: 10.1016/j.jbiomech.2021.110899. Epub 2021 Dec 7. PMID: 34923186.
- Yilmaz F, Gundogdu MY. A critical review on blood flow in large arteries; relevance to blood rheology, viscosity models, and physiologic conditions. Korea-Aust Rheol J. 2008; 20(4):197.
- Ku DN. Blood Flow in Arteries. Annu Rev Fluid Mech. 1997; 29: 399-434.
- Nichols W, O’Rourke M, Vlachopoulos C. McDonald's Blood Flow in Arteries: Theoretical, Experimental and Clinical Principles, 6th Ed: Hodder Arnold 2011.
- Moore WS. Vascular and endovascular surgery: A comprehensive review. Elsevier Ed, 2012.
- Ahmed SA, Giddens DP. Pulsatile poststenotic flow studies with laser Doppler anemometry. J Biomech. 1984;17(9):695-705. doi: 10.1016/0021-9290(84)90123-4. PMID: 6238968.
- Seta F, Cohen RA. The endothelium: paracrine mediator of aortic dissection. Circulation. 2014 Jun 24;129(25):2629-32. doi: 10.1161/CIRCULATIONAHA.114.010609. Epub 2014 May 7. PMID: 24807873; PMCID: PMC4100940.
- Osswald A, Karmonik C, Anderson JR, Rengier F, Karck M, Engelke J, Kallenbach K, Kotelis D, Partovi S, Böckler D, Ruhparwar A. Elevated Wall Shear Stress in Aortic Type B Dissection May Relate to Retrograde Aortic Type A Dissection: A Computational Fluid Dynamics Pilot Study. Eur J Vasc Endovasc Surg. 2017 Sep;54(3):324-330. doi: 10.1016/j.ejvs.2017.06.012. Epub 2017 Jul 14. PMID: 28716447.
- Hope MD, Hope TA, Meadows AK, Ordovas KG, Urbania TH, Alley MT, Higgins CB. Bicuspid aortic valve: four-dimensional MR evaluation of ascending aortic systolic flow patterns. Radiology. 2010 Apr;255(1):53-61. doi: 10.1148/radiol.09091437. PMID: 20308444.
- François CJ, Markl M, Schiebler ML, Niespodzany E, Landgraf BR, Schlensak C, Frydrychowicz A. Four-dimensional, flow-sensitive magnetic resonance imaging of blood flow patterns in thoracic aortic dissections. J Thorac Cardiovasc Surg. 2013 May;145(5):1359-66. doi: 10.1016/j.jtcvs.2012.07.019. Epub 2012 Jul 26. PMID: 22841438; PMCID: PMC3514600.
- Millon A, Bros S, Boussel L. A new carotid 3d mri sequence for stenosis measurement and plaque characterization at the same time. European Journal of Vascular and Endovascular Surgery. 2014; 48(3):342.
- Sherrah AG, Grieve SM, Jeremy RW, Bannon PG, Vallely MP, Puranik R. MRI in Chronic Aortic Dissection: A Systematic Review and Future Directions. Front Cardiovasc Med. 2015 Feb 19;2:5. doi: 10.3389/fcvm.2015.00005. PMID: 26664877; PMCID: PMC4671340.
- Sigovan M, Dyverfeldt P, Wrenn J, Tseng EE, Saloner D, Hope MD. Extended 3D approach for quantification of abnormal ascending aortic flow. Magn Reson Imaging. 2015 Jun;33(5):695-700. doi: 10.1016/j.mri.2015.02.020. Epub 2015 Feb 23. PMID: 25721998; PMCID: PMC4426228.
- Midulla M, Moreno R, Negre-Salvayre A, Beregi JP, Haulon S, Loffroy R, Dake M, Rousseau H. Impact of Thoracic Endografting on the Hemodynamics of the Native Aorta: Pre- and Postoperative Assessments of Wall Shear Stress and Vorticity Using Computational Fluid Dynamics. J Endovasc Ther. 2021 Feb;28(1):63-69. doi: 10.1177/1526602820959662. Epub 2020 Oct 7. PMID: 33025866.
- Sengupta S, Zhu Y, Hamady M, Xu XY. Evaluating the Haemodynamic Performance of Endografts for Complex Aortic Arch Repair. Bioengineering (Basel). 2022 Oct 18;9(10):573. doi: 10.3390/bioengineering9100573. PMID: 36290541; PMCID: PMC9598215.
- Chiu JJ, Chien S. Effects of disturbed flow on vascular endothelium: pathophysiological basis and clinical perspectives. Physiol Rev. 2011 Jan;91(1):327-87. doi: 10.1152/physrev.00047.2009. PMID: 21248169; PMCID: PMC3844671.
- Bassiouny HS, Zarins CK, Kadowaki MH, Glagov S. Hemodynamic stress and experimental aortoiliac atherosclerosis. J Vasc Surg. 1994 Mar;19(3):426-34. doi: 10.1016/s0741-5214(94)70069-9. PMID: 8126855.
- Ku DN, Giddens DP, Zarins CK, Glagov S. Pulsatile flow and atherosclerosis in the human carotid bifurcation. Positive correlation between plaque location and low oscillating shear stress. Arteriosclerosis. 1985 May-Jun;5(3):293-302. doi: 10.1161/01.atv.5.3.293. PMID: 3994585.
- Chiastra C, Morlacchi S, Gallo D, Morbiducci U, Cárdenes R, Larrabide I, Migliavacca F. Computational fluid dynamic simulations of image-based stented coronary bifurcation models. J R Soc Interface. 2013 May 15;10(84):20130193. doi: 10.1098/rsif.2013.0193. PMID: 23676893; PMCID: PMC3673154.
- Himburg HA, Grzybowski DM, Hazel AL, LaMack JA, Li XM, Friedman MH. Spatial comparison between wall shear stress measures and porcine arterial endothelial permeability. Am J Physiol Heart Circ Physiol. 2004 May;286(5):H1916-22. doi: 10.1152/ajpheart.00897.2003. Epub 2004 Jan 8. PMID: 14715506.
- Hoi Y, Zhou YQ, Zhang X, Henkelman RM, Steinman DA. Correlation between local hemodynamics and lesion distribution in a novel aortic regurgitation murine model of atherosclerosis. Ann Biomed Eng. 2011 May;39(5):1414-22. doi: 10.1007/s10439-011-0255-z. Epub 2011 Jan 29. PMID: 21279441.
- Xu H, Li Z, Dong H, Zhang Y, Wei J, Watton PN, Guo W, Chen D, Xiong J. Hemodynamic parameters that may predict false-lumen growth in type-B aortic dissection after endovascular repair: A preliminary study on long-term multiple follow-ups. Med Eng Phys. 2017 Dec;50:12-21. doi: 10.1016/j.medengphy.2017.08.011. Epub 2017 Sep 7. PMID: 28890304.
- Bonfanti M, Balabani S, Greenwood JP, Puppala S, Homer-Vanniasinkam S, Díaz-Zuccarini V. Computational tools for clinical support: a multi-scale compliant model for haemodynamic simulations in an aortic dissection based on multi-modal imaging data. J R Soc Interface. 2017 Nov;14(136):20170632. doi: 10.1098/rsif.2017.0632. PMID: 29118115; PMCID: PMC5721167.
- Arthurs CJ, Xiao N, Moireau P, Schaeffter T, Figueroa CA. A flexible framework for sequential estimation of model parameters in computational hemodynamics. Adv Model Simul Eng Sci. 2020;7(1):48. doi: 10.1186/s40323-020-00186-x. Epub 2020 Dec 2. PMID: 33282681; PMCID: PMC7717067.
- Marrocco-Trischitta MM, Sturla F. Blood flow helical pattern in type III arch configuration as a potential risk factor for type B aortic dissection. Eur J Cardiothorac Surg. 2021 Dec 27;61(1):132-139. doi: 10.1093/ejcts/ezab307. PMID: 34374753.