INTRODUCTION
Numerous investigators have reported on the risk factors contributing to knee instability, predominantly focused on injury to the anterior cruciate ligament (ACL).1 Greater knee joint laxity appears to negatively affect dynamic joint function and, therefore, reliable and valid measures of laxity are clinically valuable.2
Optimal anterior tibial translatory laxity testing requires an appropriate and known force to be applied at a consistent speed and perpendicular to the tibia.3 Previous researchers have used the KT1000 and KT2000 knee arthrometer devices to measure tibial translation and produce ACL laxity metrics.4 Despite their frequent use in ACL laxity research, the KT devices only demonstrated a modest level of inter-rater reliability.5 These devices are no longer being manufactured leaving clinicians and researchers seeking access to a reliable and valid knee arthrometer for measurement of tibial translation.
An alternative knee arthrometer measuring anterior tibial translation parameters (displacement and stiffness) is the GENOUROB, (GNRB®). The GNRB®’s automated and robotic nature is thought to apply specific translatory loads at consistent speed and direction.6
Previous studies have published results presenting conflicting measures of anterior tibial translation reliability using the GNRB®.7–9 Vauhnik et al9 reported relative reliability (95% limits of agreement) of the GNRB® device measuring translation at a test force of 134 N of 2 to 3 millimeters (mm). Additionally, Vauhnik et al9,10 reported intra- and inter-rater reliability of the GNRB® device was comparable to the KT1000 and KT2000 however, the overall inter-rater reliability remained low. Jenny et al.,7 using Bland-Altman Limits of Agreement, reported the GNRB® arthrometer demonstrated satisfactory levels of agreement with both stress radiographs (R2 = 0.06) and the gold standard, intraoperative navigation (R2 = 0.12) for tibial translation. More recently, Mouarbes et al.,3 investigating the reliability of the GNRB® device on healthy individuals, reported poor test-retest agreement. The current variability of reliability findings reported in the literature drives the need for additional reliability studies using this device.
An additional measurement feature of the robotic GNRB® arthrometer includes the ability to provide a measure of anterior tibial translatory stiffness calculated directly from the anterior laxity curve (anterior tibial displacement vs applied anterior translation force) during the GNRB®’s standardized laxity testing protocol.11 Anterior tibial translatory laxity, when discussed in terms of instrumented and manual testing, characterizes the magnitudes of anterior tibial displacement occurring as a result of passive posterior to anteriorly directed forces on the proximal tibia. However, in addition to measures of laxity, the important dynamic strain behaviors of the passive tissues resisting anterior tibial translation can be understood by measuring the force to displacement relationship across a range of controlled increasing forces applied to the posterior proximal tibia (stiffness). The GNRB device provides a measurement of this dynamic relationship between the changes in applied force and the changes in anterior tibial displacement. The changing resistance undergoing deformation from the application of a changing force is important in understanding the dynamic behaviors of the knee joint tissue resisting anterior tibial translation. This measurement of stiffness is thought to be a clinically significant biomechanical parameter of ligamentous resistance (beyond measures of displacement), due to its association with functional anterior knee instability.11 Nouveau et al11 demonstrated the clinical utility of serial anterior tibial translatory stiffness values with the GNRB® device in the assessment of ACL graft maturation following anterior cruciate ligament reconstruction (ACLR) and during rehabilitation interventions of individuals post-ACL reconstruction. If the stiffness differential value is more than 10um/N bilaterally, the authors suggest implementing an alternative rehabilitation protocol to allow optimal healing of the ACL graft and return to function. Once the slope differential re-stabilizes, the rehabilitation protocol progression can resume.11 The potential use of clinically assessing changes in anterior tibial translatory stiffness with the GNRB® device to guide and individualize rehabilitation protocols against undesirable ACL loading requires acceptable limits of reliability with repeated testing. These same stiffness measures following ACL injury and during ACL rehabilitation programs can also assist in the clinical decision making regarding individualized return to function and sport.11 Finally, reliable measures of anterior tibial translatory stiffness with the GNRB® device may have further utility towards identifying ligamentous insufficiencies within individuals demonstrating normal magnitudes of anterior tibial displacement (laxity). To the authors knowledge, no previous research has been reported on the reliability of serial measures of stiffness using the GNRB® device.
The purpose of this study was to investigate the reliability of the GNRB® knee arthrometer device in measuring both stiffness and laxity of the ACL, and to provide information on sample size calculation for future clinical trials.
METHODS
Study Design
This study followed a test-retest reliability cross-sectional study design with two experienced examiners performing all measurements using the GNRB® knee arthrometer device. Each investigator underwent training with a GNRB® representative as well as several weeks of practice sessions prior to testing.
Participants
Twelve university student and staff volunteers (6 females and 6 males aged 24 - 30 years), were recruited via flyer and email for the study from June through August 2019; the number of participants recruited was based on previous knee arthrometer reliability studies.5,7,9 Exclusion criteria included no current knee pain or history of ACL compromise. The IRB Committee at the University of St. Augustine for Health Sciences approved the study, and all subjects provided informed consent.
Methods
Data collection was performed across two sessions, two weeks apart. Both examiners performed measurements on each participant twice on the first test session (intra- and inter-rater reliability data collection), and once each on the second test session (intra-rater and test-retest data collection). Participants were instructed to limit formal lower extremity exercise at least 60 minutes prior to each testing session. Demographic data was collected before test session one and included: age, sex, and body weight. The GNRB® device was calibrated according to the manufacturer’s guidelines before each testing session.
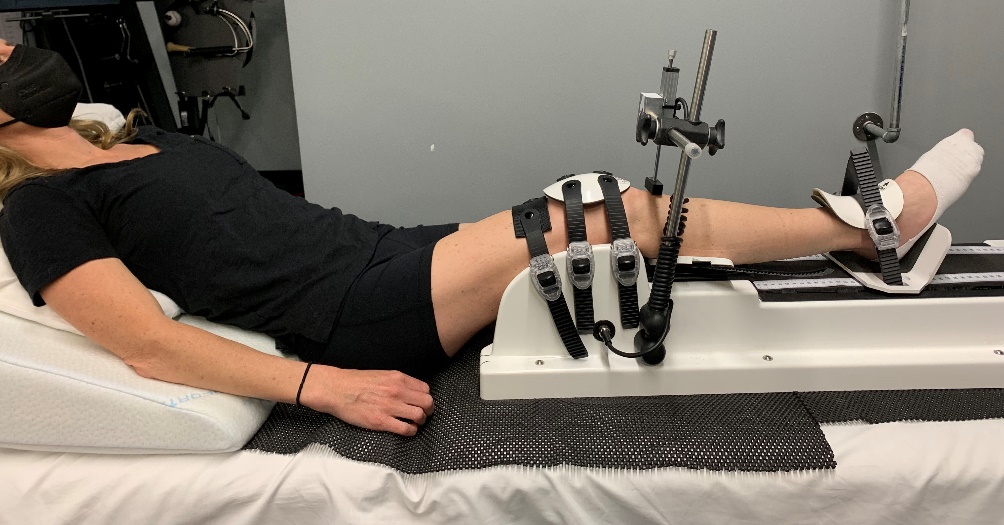
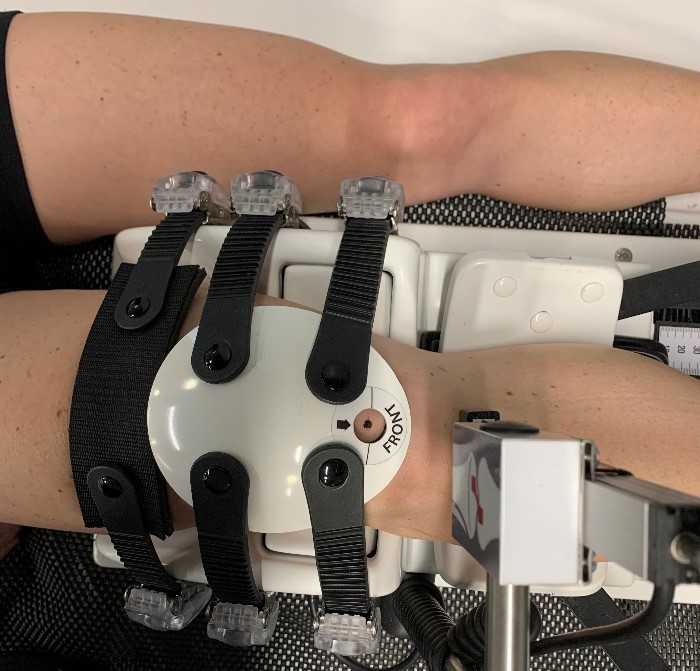
The order of testing by examiners was randomized. When participants arrived for testing, they were asked to sit resting in a chair for 10 minutes prior to each test session. Participants were then positioned supine on the examination table with arms resting on the table next to their torso. The trunk was supported in an inclined position 30 degrees relative to the examination table (Figure 1). To decrease potential bias or order effect, the leg to be tested first was determined with randomization via a coin toss. With the GNRB® device secure on the table, the lower limb was placed on the device in a neutral position between internal and external rotation. Temporary skin markings were made on the inferior pole of the patella, the center of the tibial tuberosity, and along the medial and lateral tibiofemoral joint lines of the participants’ knee. The knee was positioned to ensure the marking on the inferior pole of the patella was visible through the cut-out on the patellar pad of the GNRB® device (Figure 2). Both medial and lateral joint line-markings were then visually aligned with the intersection between the femoral stabilization component and the tibial anterior displacement component of the device. The displacement transducer of the device was positioned directly over the tibial tuberosity marking and perpendicular to the tibia (Figure 1). A goniometer was used to ensure the displacement transducer was perpendicular to the tibia. The participant’s foot was placed in a neutral position on the footplate of the GNRB® device. The footplate’s position was adjusted until the plantar aspect of the heel and midfoot were in contact with the footplate. The position of the footplate as indicated on the device was then recorded and used for consistency in all subsequent tests. Patellar stabilization force during the first testing session was achieved via the GNRB®’s patella pad software generated output. Tightening of the patellar straps continued until a minimum force of 60 N was achieved. The average patellar pad force across the three pulls was used in data analysis. All subsequent tests utilized patellar stabilizing force +/- 10 N of the recorded initial test values for each examiner. The patellar pad’s alignment was carefully adjusted in an attempt to distribute the posteriorly directed stabilizing force evenly across the patella. See Figure 1 for patient positioning in the GNRB® device.


The GNRB® device was programmed to perform three consecutive anterior tibial translation ramp forces to a maximum of 200N. During each applied ramp force, translation values at 134N and 200N and stiffness values were recorded. All procedures were immediately repeated on the participant’s contralateral limb. The skin markings were then completely removed, and the participant was positioned seated, resting in a chair for ten minutes. The second examiner then performed the same procedure as described above. This sequence was repeated until each examiner tested each subject’s knees twice for the assessment of intrarater reliability.
The second testing session occurred two weeks later. The footplate position and the patella stabilization force recorded from test session one were used for consistency in test session two. Each examiner tested each participant once using the same procedure as described for session one, with the time of day consistent between sessions. The results of the second testing session were used in the test-retest analysis.
Statistical Analyses
The average patellar pad force, anterior translation, and stiffness values across the three anterior tibial translatory ramp forces for each knee calculated by the GNRB® software were used in data analysis. Testing for normality was completed, and reliability analyses were performed on data for all participants using intraclass correlation coefficients (ICC). A two-way random-effects model based on the mean of the three repeated measurements of the first measurement session and absolute agreement assessed the inter-rater repeatability. A two-way mixed-effects model, based on the mean of the three repeated measures, was used to assess intra-rater repeatability and test-retest repeatability. Standard deviation/mean *100 was used to calculate the coefficient of variation. Standard error of measurement (SEM), calculated as: √((Σ deviations2)/degrees of freedom), was used to assess the degree to which repeated measures of the GNRB® outputs varied for participants (within-participant deviation). Estimation of the minimum detectable change (MDC), representing the minimum differences in the measurements of anterior laxity and stiffness considered true changes were established using MDC = SEM * 1.96 * √2.
Sample size calculations for both crossover and parallel design studies were performed using various magnitudes of change in anterior laxity parameters. Anterior tibial displacement (mm of movement) at both 134N and 200N of applied force and calculated slope (mm displacement vs force N) values with α = 0.05 and β = 0.80, 0.90, and 0.95 were evaluated. Calculations were completed using 2x(Zα+ Zβ)2 x σ2)/d2 for a parallel design and (Zα+ Zβ)2 x σ2)/d2 for a crossover design. For example, a parallel design powered at 0.90 would require 19 participants to detect an absolute change in anterior proximal tibial displacement of 1mm assessed at a test force of 134N.
RESULTS
Twelve participants (6 males and 6 females aged 24-30 years) completed the study (24 limbs measured). The average body mass index of participants was 25.0 (SD 3.24) kgm2. IBM SPSS Statistics for Windows, version 26 (IBM Corp., Armonk, N.Y., USA) software was used in the statistical analysis.
Moderate to good intratester reliability was found by comparing test one and two for each examiner; ICC values 0.72 – 0.83. Table 1 presents measures related to intrarater reliability between the means of the first test and repeated test during session one.
Good intertester reliability was found by comparing test one measures for each examiner; ICC values 0.76 – 0.81. Table 2 presents measures related to interrater reliability between the means of the first test for each examiner during session one.
Test-Retest Repeatability also demonstrated good reliability (ICC 0.77 - 0.83) for both laxity and stiffness measures. Table 3 presents the test-retest repeatability measures between the mean of the first test of session one (Trial 1) and session two (Trial 2).
Sample size calculations for both crossover and parallel design studies, using various magnitudes of change in laxity parameters related to anterior tibial translation are presented in Table 4. Tibial displacement (mm of movement) at both 134N and 200N of applied force and the calculated slope (mm displacement vs force N) values with α = 0.05 and β = 0.80, 0.90, and 0.95 were evaluated (see Tables 4 and 5). Calculations were completed using 2x(Zα+ Zβ)2 x σ2)/d2 for a parallel design and (Zα+ Zβ)2 x σ2)/d2 for a crossover design. For example, a parallel design powered at 0.90 would require 19 participants to detect an absolute change in anterior proximal tibial displacement of 1 mm assessed at a test force of 134N.
DISCUSSION
The results of this study suggest that intrarater, interrater, and test-retest relative reliability were similar across measures of anterior tibial translation and stiffness with ICC values ranging from .72 to .83. (Tables 1, 2, 3). The 95% confidence levels of the ICCs were fairly wide (.54 to .91), suggesting relative reliability ranges from moderate to good. Thus, this study supports previous research findings that concluded the GNRB® device is thought to be useful in diagnostic knee assessment, baseline clinical measurement, and treatment planning related to knee laxity status.3,7,9,10
Specific to measures of anterior tibial displacement, the ICC values found in this study, were higher than those of Vauhnik et al.10 and Mouarbes et al.,3 who reported values between raters and test-retest protocols ranging from 0.22 to 0.42 and 0.41 to 0.49, respectively. At a testing force of 134 N results showed a mean anterior tibial displacement value of 3.6 mm, which is less than the reported values by Vauhnik et al9 (5.6 to 6.5 mm) but in closer agreement with Mouarbes et al3 (3.2 mm) using consistent but lower patellar stabilizing forces. The calculated SEMs for intrarater, interrater, and test-retest were found to be narrow in this study, ranging from 0.48 to .62 mm, suggesting a moderate level of measurement variability. At 200 N of force, the mean anterior displacement increased to 5.32 mm, while SEM values remained narrow, ranging between 0.66 to 0.78 mm. Interestingly, the MDC values at 134 N and 200 N were found to be 2.1 mm/N and 2.5 mm/N respectively. The MDC values can be a clinically significant metric when looking to compare the minimally detectible change between testing sessions of one limb. For instance, a patient who has undergone ACL reconstruction (ACLR) where the contralateral limb cannot be used as comparison (due to previous injury or to disuse during convalescence), the MDC could have utility for detecting laxity changes that occur from early post injury to late rehab beyond the slight ligamentous adaptation/laxity typically expected.
Like the GNRB’s measurement of anterior tibial displacement, there was a moderate level of variability found during repeated testing regarding its calculated mean values of stiffness, (resistance to anterior tibial translation) with wide ICC confidence intervals (0.57 to 0.90). The SEM for the value of the mean slope from the force displacement curve in this study ranged from 3.47 mm/N (test-retest) to 3.76 mm/N (intrarater), suggesting the GNRB® device demonstrates a moderate level of overall measurement error.
Although not specifically analyzed in this study, a trend towards a decrease in the device’s patellar pad stabilization force (1- 2N) within each testing bout across the three robotically driven anterior tibial forces was visually observed during testing. It is unknown whether laxity and stiffness measures are sensitive to these small changes. Possible explanations for the change in patellar pad stabilization forces during testing surround functional shifting of the patellar stabilization straps, changes in activation of the patient’s musculature, and or increased compliance of peri-patellar soft tissues with the sequential repetitive loading.
The results of this study found the MDC for mean stiffness values to be 9.6mm/N. As stated, the MDC is potentially very useful in monitoring changes in anterior translation displacement, (laxity), but also particularly important in relation to assessing changes in anterior tibial translatory stiffness for individuals undergoing post-operative ACLR rehabilitation. A trend toward stiffness values decreasing, (or increasing) over the time course of an individualized rehabilitation program greater than the MCD would be significant as it suggests that the change is beyond the random variation observed with robotic ligament testing. Nouveau et al.9 suggested using a stiffness differential value as a marker to adjust therapeutic interventions during rehabilitation.9 However, the results of this study suggest, that while an important clinical relationship likely exists between decreasing anterior tibial translatory stiffness values assessed in robotic testing and decreasing resistance to anterior translation, the authors of this study suggest that any calculated change (stiffness differential) should take into account the MDC as well as the SEM values.
The basis for measurement error when utilizing the GNRB® device for anterior tibial displacement have been reported elsewhere.9,10 Main sources of error are thought to include incongruency between the flat surface of the displacement sensor and the non-flat tibial tuberosity, the alignment of the device relative to the knee joint itself, the position of the participant, and the consistency of patellar pad force.9 Based on findings of previous studies, several attempts were made in this study to minimize these previously reported errors. To address potential errors related to participant alignment, a 30-degree inclined rigid foam wedge under the torso was used to standardize participant position and maximize comfort to allow relaxation of the limb during testing. It is the opinion of the investigators that consistent patient positioning and implementing careful skin markings over key landmarks were both critical to maximizing measurement repeatability. Deviation of the transducer between trials from a perpendicular orientation would also offer a potential source of measurement error. To standardize the spatial orientation of the displacement transducer, a goniometer was used to align the transducer perpendicular to the tibial tuberosity.
The design of the GNRB® tightening straps on the patellar stabilization pad consists of a buckle/ratchet tightening system. Therefore, maintaining consistent patellar force between trials was challenging as one step on the ratchet increased or decreased the patellar pad force up to 10N in some participants. Vauhnik et al.9,10 and Mourabes et al.3 reported repeatability of the GNRB® was associated with the consistency of the patellar pad force. Alqahtani et al.12 found a significant difference in normative values of anterior tibial displacement when patellar pad forces varied by 11.2 N. Therefore, following the recommendations of Vauhnik et al.9,10 and Alqahtani et al.,12 this study’s protocol included a minimum of 60 N of patellar pad force and no greater difference than 10 N between trials. Post hoc analysis of the applied patellar pad forces in this study demonstrated consistent forces between all trials with a mean force of 61.4 N (SD 3.2N). Only twice were differences in patellar pad forces within subjects greater than 10 N. Further post hoc statistical analysis found no significant differences in patellar forces within participants or within examiners (p>0.05). The deliberate consistency of patellar pad forces may have played a role in higher reliability findings of this study in comparison to previous studies.3,9,10
The influence of BMI on displacement and stiffness measures was not directly analyzed in this study; however, it was noted that individuals with greater soft tissue thickness appeared to challenge the processes of achieving consistent application and strap tightening of the GNRB® device. Difficulty with adequately securing the thigh strap without pinching the subject’s skin may have resulted in less femoral stabilization and subsequently altered the measures of anterior excursion detected by the GNRB. Mouarbes et al.3 reported similar challenges with obese subjects attributing excessive soft tissue as a potential source of error. Further studies on the influence of strap tension and anthropometric variables may help understand its role in the measurement process across individuals with various levels and densities of the thigh and calf tissues.
Limitations
Despite referencing earlier research and attempting to limit error identified in previous studies, there were limitations. This study involved a small number of healthy, younger to middle-aged adults with no current or reported history of significant lower extremity injury. Therefore, interpretation of the results of this study may not be generalizable to other populations; additional studies with larger more diverse populations are needed.
Furthermore, although attempts were made to control against unwanted hamstring activation by maximizing patient comfort and the use of careful participant positioning, the investigators acknowledge the potential influence of hamstring activation on translatory measures. The use of surface electromyography (sEMG) to measure hamstring activation levels has been thought to be a valuable supplemental procedure by some researchers investigating anterior tibial displacement measures.9,11 The use of sEMG of the hamstring muscle group may be valuable in post-injury and post-surgical conditions where hamstring muscle activation is not easily controlled. This study investigated healthy participants with no knee injury or pain minimizing these patient relaxation and positioning challenges.
Many studies investigating reliability and changes in ACL laxity include testing forces ranging between 89N-250N. This study investigated forces of 134N and 200N to allow comparison of values obtained in previous research using similar forces.9,10,13 Nesseri et al.14 found the maximum load of 200N to be more sensitive to changes in ACL laxity over lower loads. Whereas Beldame et al.13 attempted loads higher than 200N and were only able to reach 250N in 84% of subjects due to patient report of unacceptable pain as forces increased. Although the forces used in this study are similar to many studies using knee arthrometer devices, they are well below peak anterior shear forces acting on the knee joint during function; anterior shear forces up to 1070N have been reported during activities such as jumping.14,15 Therefore, it is possible that the forces used in this study may not adequately represent those elicited with functional activities. Perhaps, additional studies looking at forces more closely related to those that occur across the knee with functional tasks, while still optimizing patient comfort, will be available in future knee arthrometer designs and may add value to the body of evidence.
Variations in anterior laxity assessment measures may be influenced by female sex hormone levels.16–19 This study did not include evaluation of hormone levels, which may have influenced measures between test re-test sessions in females. Although the time of day for each testing session was kept consistent, it is reasonable to hypothesize that variations in anterior tibial displacement parameters may have arisen in the two-week period between measures due to intrinsic changes in ligamentous and capsular knee tissues from the influence of female sex hormones.17,18 The current body of evidence is conflicted as to what role, if any, sex hormones such as estrogen and progesterone may have on ligamentous properties. Maruyama et al.18 found measures of anterior translatory stiffness did not appear to be related to hormonal changes during the menstrual cycle. In contrast, a recent systematic review by Hetzberg et al.,19 found knee laxity did vary significantly across phases of the menstrual cycle. Although the authors of this study recognize the possible influence of hormones on laxity values, post-hoc analyses (paired t-tests) revealed no statistical differences between test 1 and test 3 (test retest) for either males or females at 134N or 200N. Females did demonstrate increased laxity measures compared to males, with mean values of 0.63 mm and 0.75 mm greater for females compared to males at 134N and 200N respectively. However, the similar reliability values found across genders suggests female sex hormone changes between the two-week period did not strongly influence the laxity values obtained. It is the author’s opinion that future reliability studies involving measurements of absolute anterior tibial displacement parameters using the GNRB® device across the menstrual cycle may be of value in determining the potential effects of sex hormones on repeated measures of anterior tibial displacement and stiffness.
CONCLUSION
Anterior tibial translation and stiffness data appears to be reliably obtainable using the robotic GNRB® knee arthrometer device. Sample size calculations and minimally detectable change values may aid in clinical applications and future research studies. To improve reliability when measuring anterior tibial translatory laxity parameters, the authors recommend assessment using the average of three consecutive measurement trials, with strict control of alignment and consistent patellar stabilization pad force. Given the observed levels of measurement variability found in this study, the calculations of the sample size requirements and MDCs may help clinicians and future researchers evaluate changes in anterior tibial translatory laxity and stiffness values. Reliable stiffness and laxity measures following ACL injury and during ACLR programs may assist in the clinical decision making regarding individualized return to function and sport.
Conflict of Interest Statement
The authors report no conflicts of interest.