INTRODUCTION
Lacrosse is rapidly growing as a National Collegiate Athletic Association (NCAA) sport with the addition of 253 men’s and 416 women’s teams across all three divisions since the 1981-82 season.1 Men’s lacrosse has the largest growth of men’s teams by percentage of total NCAA members at 17.1%, with 15.1% growth since the 2000-01 season.1 In the same period, women’s lacrosse has the sixth-largest growth of women’s teams by percentage of total NCAA members at 33.4%. However, women’s lacrosse has the largest growth of women’s teams by percentage of total NCAA members since the 2000-01 season at 23.4%.1 In 2020-21, Division III recorded the highest number of men’s lacrosse teams at 246, while Division I and II had 73 and 72 teams, respectively.1 For women’s lacrosse in the same season, Division III had 292 participating teams while Division I had 118 and Division II had 111 teams.1
The nontraditional men’s and women’s lacrosse season for Division III consists of a maximum of 16 scheduled practices and either two scrimmages or a total of 120 minutes of competitive play.2 The season is limited to five weeks, with no more than four practices each week.2 Stress loads from the shorter fall season may differ from that of a traditional spring competitive season due to the length, which contains a condensed schedule with practices and games, as well as regular strength training workouts. The length of the nontraditional season may reflect the stress loads seen in preseason play before the start of the regular spring season. Preseason can be defined as the time of practice before the first regular-season competition during the championship season,3,4 which is during the spring for lacrosse. Preseason practice injury rates for women’s lacrosse players3–6 and men’s lacrosse players7 are nearly twice as high as in-season practice injury rates, suggesting early-season play poses an increased injury risk to athletes with most injuries occurring in the lower extremity.
Previous authors have documented the injury risk associated with decreased dorsiflexion range of motion (ROM) resulting in the potential development of several pathologies such as patellar tendinopathy or increased stress on the anterior cruciate ligament due to altered stress through decreased eccentric loading of the gastroc-soleus complex.8,9 Decreased dorsiflexion may occur due to a range of issues, including increased gastroc-soleus complex tightness, joint stiffness, or from lasting effects of ankle trauma.8 Regardless of underlying cause, decreased dorsiflexion ROM may alter stress loads throughout the lower extremity kinetic chain and contribute to the development of altered movement patterns.
Previous authors have documented changes in physiological, biomechanical, and performance measures over the course of a competitive athletic season in sports other than lacrosse.10–15 The changes over time may alter the kinetic chain and affect ROM or stability. Mobility changes may lead to compensatory patterns resulting in overuse injury or decreased proprioception and a lower quality of coordinated movement. If the stress of a season leads to changes in movement quality and are not identified and addressed, athletes may be at an increased injury risk as the season progresses. Since improving functional movement may reduce injury risk and improve performance, Functional Movement Screen™ (FMS™) score measurements may provide insight into injury risk and athletic performance.16 Functional movement includes the ability to perform quality novel movements that require mobility and stability across three planes of movement. The movements require coordination from the central nervous system to ensure that all required muscles have proper proprioceptive functions needed for coordinated movement. While injury risk is multifaceted, functional testing is often utilized in rehabilitative programs to provide objective measures of patients’ progress as well as determine potential limb asymmetries and the development of compensatory patterns in functional movements as these factors may increase injury risk.17 A concentrated, individualized training program focused on areas of deficit can improve functional mobility scores regarding the FMS™ scoring criteria.18 The FMS™ has been used as a potential predictor of injury in sports such as hockey, football, and soccer with varying results.19–23 A score of 14 or less has commonly been set as the cutoff for FMS™ scores for the best sensitivity and specificity for injury.24 However, different cutoff points based on maximum specificity and sensitivity have been found for men and women at ≤11 and ≤14, respetively.25 The inability to perform functional movements can lead to an increased risk of injury due to the loss of mobility, stability, or neuromuscular control.17 The Y-Balance Test (YBT) is a tool used to assess dynamic postural control in both the upper and lower extremities through motions that require mobility, stability, and neuromuscular control.17,26–30 The YBT classifies an asymmetry as greater than a 4 cm difference bilaterally.31 A difference greater than 4 cm between lower extremity limbs in the anterior direction has been reported to increase injury risk.28,32 The effect of a sport season on YBT performance has been observed in sports such as field hockey with no significant difference in reach distance from preseason to the postseason.33 While several factors play a role in injury risk, screening and implementing appropriate corrective exercises can aid in improving mobility, stability, or neuromuscular control.17
The effect of a sport season on movement pattern quality has been observed in various sports such as rugby, collegiate soccer, and volleyball.16,34 While no significant changes in FMS™ composite scores were reported,34 there were significant changes in individual FMS™ movement scores and a decrease of asymmetries and scores of 1 (1 = inability to complete movement).16 Australian football athletes with asymmetries present on the FMS screening were more likely to sustain an injury during the season, indicating that asymmetries may be risk factors for injury.35 Additionally, the ability of athletes to accurately assess their potential movement pattern quality limitations may be helpful in identifying abnormalities in functional movement prior to the development of injury. To the authors knowledge, no such study has observed the effects of a season on collegiate lacrosse athletes or the accuracy of athletes’ perceived movement pattern quality. Therefore, the purpose of this study was to examine the effects of a nontraditional lacrosse fall season on movement pattern quality and dynamic postural control in Division III collegiate lacrosse athletes. A secondary goal of this study was to observe how Division III lacrosse athletes perceived their movement pattern quality when compared to FMS scores.
METHODS
This cross-sectional study design allowed for the observation of data from preseason to postseason. The research design was utilized to test the hypothesis that functional mobility and stability would change over the course of a lacrosse fall season and that perceived movement pattern quality would be different than actual movement pattern quality. The use of the FMS™ for the dependent variables allowed data points on all major functional movements. Dorsiflexion ROM measurements allowed a quantifiable approach to documenting change in an important aspect of functional stability. The Y-Balance Test allowed for data points in both upper and lower extremity dynamic postural control.
Participants
Seventy-eight participants volunteered to participate in this study. Participants included Division III collegiate athletes from both men’s (n=50, age=19.4±1.2 years, height=182.6±6.2 cm, mass=82.4±8.5 kg) and women’s (n=22, age=19.7±1.2 years, height=165.1±6.9 cm, mass=64.1±8.7 kg) lacrosse teams at a single University. Inclusion criteria consisted of participating in the fall, nontraditional lacrosse season and being part of their University’s men’s or women’s lacrosse team. Exclusion criteria included having had orthopedic surgery within the 12 months prior to the fall lacrosse season that resulted in at least three months of time lost, any injury that required removal from lacrosse activity during the study period, the inability to complete the full YBT screen, and being under the age of 18 years old. Participants suffering from an injury resulting in any amount of time lost between the two timepoints for data collection during the fall lacrosse season, as well as athletes who did not complete the entire season, were removed from the study. Participants participated in their normal strength training with the same certified strength and conditioning coach throughout the fall season. Both teams completed a tiered system of training rotating the emphasis between lower body, upper body, and total body sessions. This study was approved by the host Institutional Review Board (#LHS1819011) prior to initiating recruitment. We educated participants on their ability to opt out of this study and provided informed consent prior to being included in the study.
Procedures
Materials used included the FMS Test KitTM (Functional Movement Systems, Chatham, VA), which has been shown to have a moderate to good intratester reliability.34,36–41 The FMS™ scoring criteria have been found to be reliable in assessing athletes’ movement patterns.34 Movement patterns were assessed by one examiner using the FMS™ screening during the first week of voluntary workouts with the team’s certified strength and conditioning coach and again during the last week of the nontraditional lacrosse season. The screening protocol outlined by Cook et al.42,43 was utilized. Time from the first voluntary workout to the last practice of the nontraditional season totaled eight weeks. The FMS screening was completed with shoes on. Each participant was allotted a 10-minute window to perform the screening. Participants were allowed three graded trials of each FMS movement: deep squat, hurdle step, in-line lunge, shoulder mobility, active straight leg raise, trunk stability, and rotary stability. Movement scores ranged from 0-3 based on the FMS™ scoring criteria. The examiner recorded the best score of the three trials. In movements that involved two sides, the lower score determined the score of the overall movement. The examiner rated movements as 0 if there was pain present, 1 if the movement could not be completed, 2 if the movement could be completed with compensatory patterns, or 3 if the movement was performed without compensation. In addition to the seven movements, three clearing tests were included to identify potential pain. Participants received a score of 0 on the associated movement if the shoulder clearing test, spinal extension clearing test, or spinal flexion clearing test produced pain. Scores from the FMS™ screening (individual and overall scores) were compared to cut points using the Move2Perform software (Move2Perform LLC, Evansville, Indiana, USA) including optimal, pass, and below for both males and females. The examiner obtained participants’ perceived movement pattern quality by having them rate their movement pattern quality from 0-3 in each movement of the FMS™ screen. A score of 0 was described as an inability to perform the movement as described or if pain was involved. A score of 1 indicated the movement could be done with significant limitations, 2 indicated the movement could be done with minimal limitations, and 3 indicated completion of the movement perfectly with no limitations.42,43 The examiner recorded perceived movement pattern quality scores immediately before the athlete completed the postseason FMS™ screening.
Dynamic postural control was assessed utilizing the Y Balance Test Kit (Move2Perform, Evansville, IN, USA), which has been shown to have good intrarater reliability and test-retest reliability ranging from 0.80 to 0.99 for all tests.28,44 One examiner assessed dynamic postural control during both the first and last week of the fall lacrosse season using the YBT. The YBT consisted of three portions: measurements of limb length, lower quarter screen (YBT- LQ), and upper quarter screen (YBT-UQ). YBT testing was performed bilaterally.
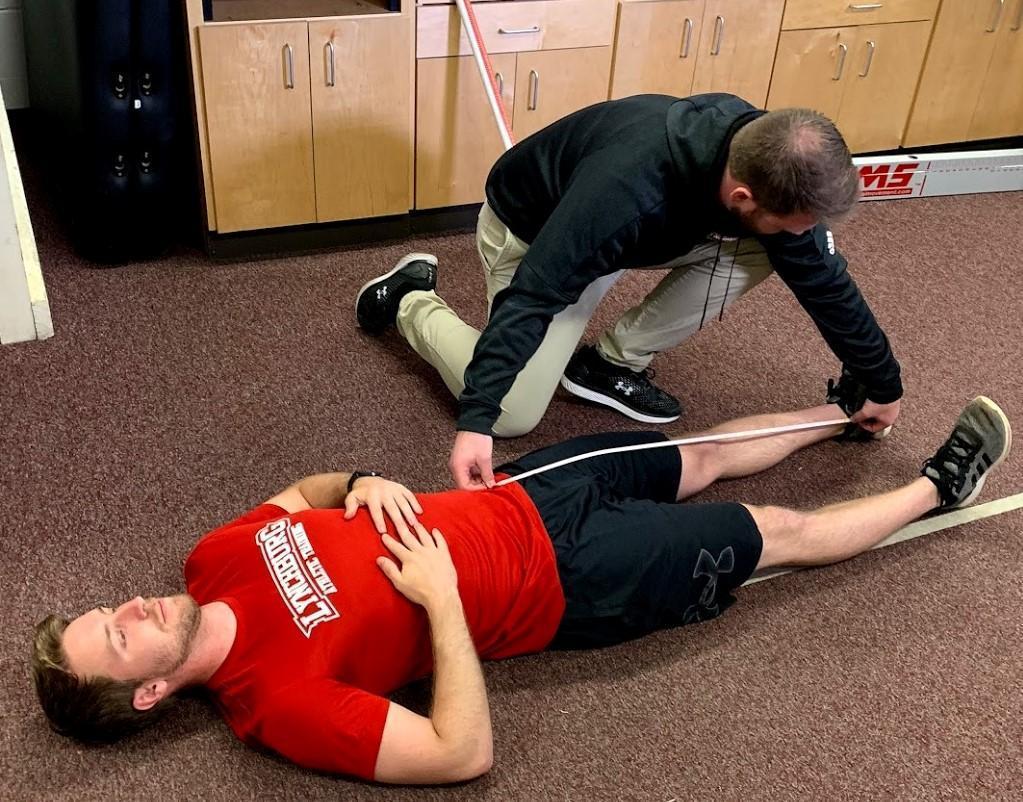
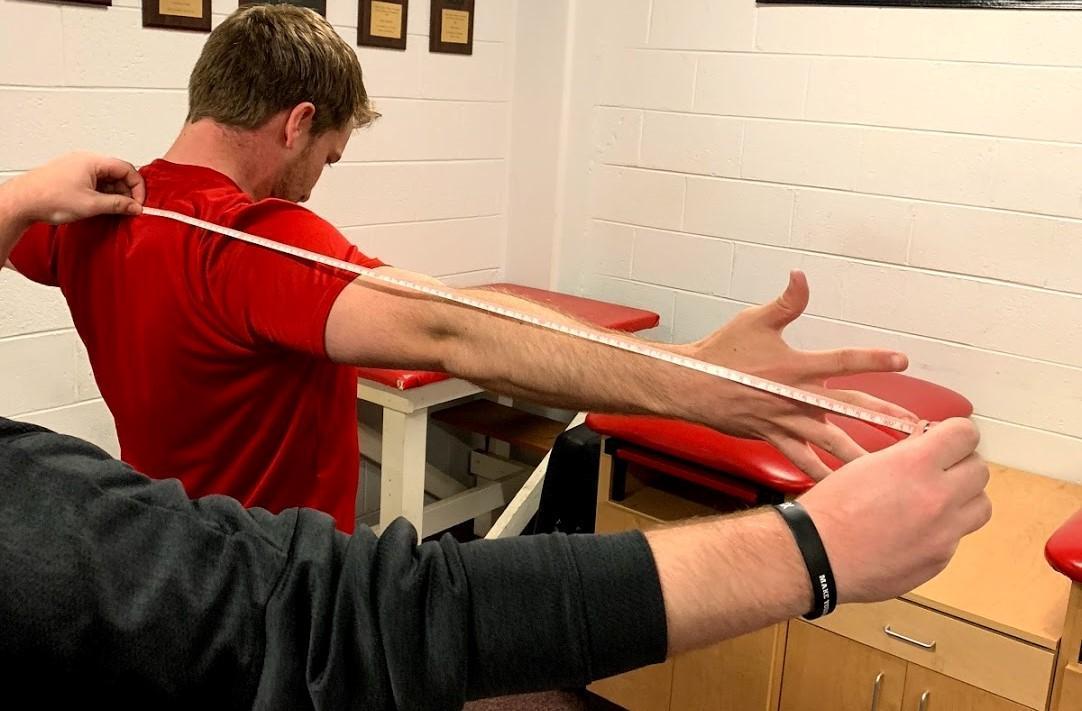
A tape measure was used to assess limb length in centimeters.31 The examiner assessed true leg length using the most distal portion of the anterior superior iliac spine and the most distal portion of the ipsilateral medial malleolus utilizing the tape measure method, which has been shown to have excellent intrarater reliability45 (Figure 2). The examiner measured arm length by using the spinous process of cervical spine 7 and the tip of the third digit of the right arm while in 90 degrees of shoulder abduction (Figure 3). Both measurements were recorded to the nearest half-centimeter. Each participant was read standard instructions on errors31 and allowed up to four errors in each direction. Errors included the participant placing the reaching foot or hand on the ground or on top of the block, quickly sliding the block beyond their reach, or failing to return to the start position without placing their foot or hand on the ground. Participants were read the corrective cues from the YBT manual when an error was performed.31 Participants completed the YBT-LQ portion first, with three practice trials being completed in each direction prior to three graded trials in the same direction before proceeding to the next direction. Participants performed the anterior direction first, posteromedial direction second, and posterolateral direction third for the lower quarter screen. Participants completed the medial direction first for the upper quarter screen, followed by the inferolateral and superolateral directions. In each screening, the stance limb was labeled as the limb being measured. The examiner scored each attempt to the nearest half-centimeter, with the highest score in each direction being recorded for analysis. Individual scores were used to assess individual changes over the course of the season.


Composite scores take limb length into account to provide comparable scores across individuals, allowing standardization of YBT-LQ and YBT-UQ scores. Composite scores were calculated by taking the sum of the three greatest direction scores over the product of three times the limb length (of either the UE or the LE as measured) and then multiplying by 100, to compare changes across participants utilizing the Move2Perform software (Move2Perform LLC, Evansville, Indiana, USA), as seen in the formula below.
Composite score=sum of the greatest reach in each direction3∗Limb Length∗100
Scores from the YBT screening31 were compared to cutoff points using the specific algorithm which is part of the Move2Perform software. Individual score categories for YBT reach distances, which are not normalized to account for limb length, and composite scores, which are normalized to account for limb length, include optimal, pass, and below. The categories compared participants’ scores with their peers in the Move2Perform system and classified their scores accordingly. Composite scores for the left and right YBT-UQ screen as well as the left and right YBT-LQ screen were combined and compared to sport and population-specific normative scores. For the lower quarter YBT, asymmetries were defined as differences greater than 4 cm between limbs in the anterior direction and a difference greater than 6 cm between limbs in the posteromedial and posterolateral directions.17 A difference greater than 4 cm between limbs determined an asymmetry in the upper quarter screen for all three directions.31
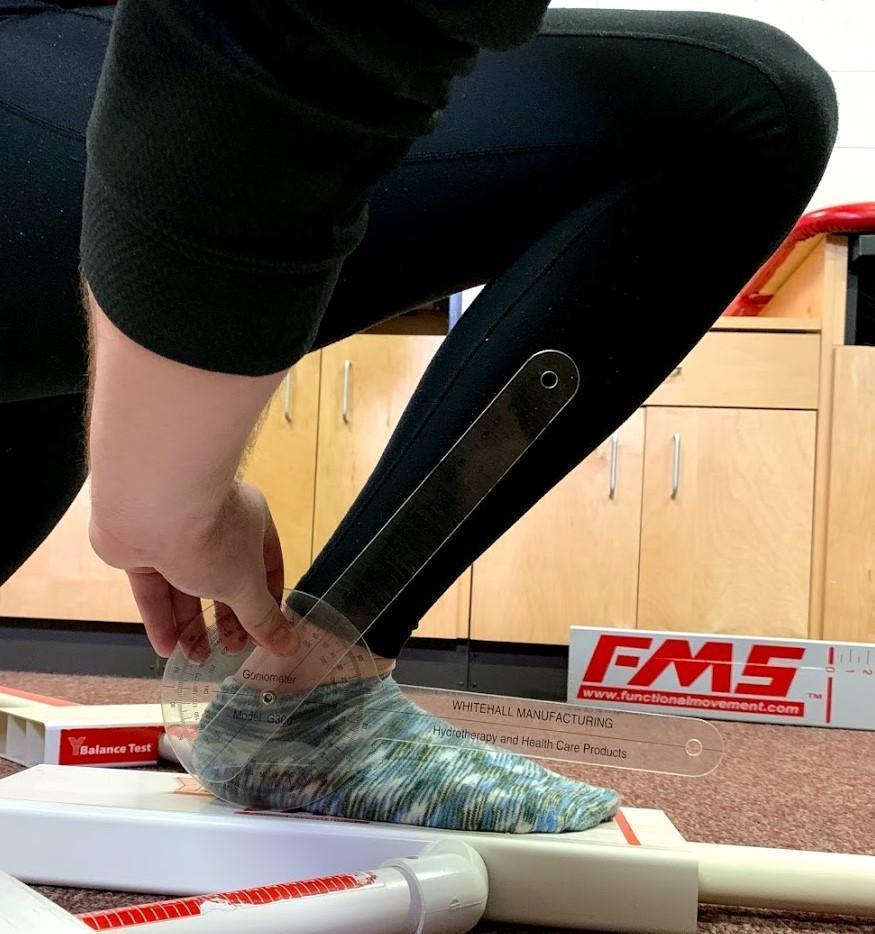
The examiner used a universal goniometer (Whitehall Manufacturing, Model G300, Industry, CA) to measure closed chain (weightbearing) active dorsiflexion ROM, which has been shown to have a standard error of measure ranging from 1.8-4.0°, with good to excellent intratester reliability.46,47 The examiner measured closed-chain dorsiflexion of both ankles using a goniometer in degrees. Each participant knelt on one knee while the measured foot was flat on the ground and the knee proximal to the measured foot was brought anteriorly.31 Participants were instructed to move the knee of the limb being measured forward as far as possible with the heel remaining in contact with the ground, as seen in Figure 1. Dorsiflexion measurements for the right and left were also compared to normative data.31 Dorsiflexion was analyzed by degrees measured, with greater than 35 degrees being considered acceptable and greater than 5 degrees bilateral difference being considered an asymmetry.
Statistical Analyses
IBM SPSS Statistics version 25.0 (IBM Inc, Armonk, NY) was used to analyze data. Data files were split by sex then FMS scores were analyzed using a Wilcoxon signed ranks test to compare FMS scores over time (preseason, postseason). Paired t-tests were used to analyze YBT scores and dorsiflexion ROM with the repeated measure being time (preseason, postseason) for each of the dependent variables (YBT scores, dorsiflexion ROM). Differences in perceived movement pattern quality scores were analyzed using chi-square. Chi-square analysis was used to determine if there was a significant difference in the number of participants below passing on the FMS threshold score from preseason to postseason with passing being scored as 1 and below passing scored as 0. Move2Perform category scores were entered into a Wilcoxon signed ranks test to be analyzed from preseason to postseason. A one-way chi-square was run to determine if there was a significant change in the number of participants with an asymmetry in the YBT screening or dorsiflexion measurements from preseason to postseason. The expected distribution for the chi-square analysis was the preseason distribution. For values that had less than the expected value of 5, a Fisher’s Exact Test was utilized. Simple linear regression was used to analyze the relationship between dorsiflexion and YBT-LQ composite scores. Pearson’s correlations were interpreted as weak = .25-.49, moderate = .50-.74, and strong= .75-1.48 Level of significance was set at p<0.05 for all statistical tests a priori.
RESULTS
Movement Pattern Quality
Male, female, and total median FMS scores with descriptive statistics are listed in Table 1 and perceived FMS scores with descriptive statistics are listed in Table 2. Time did not significantly change FMS composite scores from preseason to postseason for males (preseason=16, postseason=15; z=-0.34, p=0.74) or females (preseason=16, postseason=15; z=-1.83, p=0.07). However, left active straight leg raise significantly increased from preseason to postseason for males and right shoulder mobility and left active straight leg raise significantly increased for females (Table 1). No other unilateral comparisons were significant (p>0.05). Male perceived movement pattern quality was significantly higher than measured for 10 of 12 movements (p<0.05, Table 2). Female perceived movement pattern quality was significantly higher than measured for 4 of 12 movements (p<0.05, Table 2). There was no significant difference in the number of male (preseason=8, postseason=4; =2.38, p=0.12) or female (preseason=5, postseason=1; =2.15, p=0.14) participants who recorded a total FMS score below the injury risk cutoff of 14 at the end of the season, indicating injury susceptibility did not change.
The number of male participants who had an asymmetry in the hurdle step increased significantly from preseason (n=2) to postseason (n=9; 1=25.52, p<0.01). There was also a significant increase in male participants with an asymmetry in the inline lunge from preseason (n=10) to postseason (n=20; 1=12.50, p<0.01). Time significantly increased the number of male participants with asymmetries in the shoulder mobility movement from preseason (n=4) to postseason (n=21; 1=78.53, p<0.01). For the active straight leg raise in males, time significantly decreased the number of participants with an asymmetry from preseason (n=26) to postseason (n=8; 1=25.96, p<0.01). No significant changes were found in female asymmetry scores from preseason to postseason in any of the movements (p>0.05).
Dynamic Postural Control
Male and female preseason and postseason YBT scores with descriptive statistics are listed in Table 1. Male YBT scores significantly improved in the right leg from preseason (mean=102.47±9.24) to postseason (mean=105.64±10.86; t49=11.78, p<0.01, d=0.31, d CI95=-0.08, 0.71). Male left leg YBT scores also significantly improved from preseason (mean=102.41±9.24) to postseason (mean=104.32±9.69; t49=5.08, p=0.03, d=0.20, d CI95=-0.19, 0.59). Female YBT scores for the right leg significantly increased from preseason (mean=98.67±8.18) to postseason (mean=101.62±8.11; t21=8.69, p=0.01, d=0.36, d CI95=-0.23, 0.96). However, left leg YBT scores for females did not significantly change from preseason (98.19±9.18) to postseason (100.51±8.25, t21=3.02, p=0.10, d=0.27, d CI95=-0.33, 0.86). There were no significant changes preseason to postseason for upper extremity YBT scores (p>0.05) except for the right upper extremity improving for females from preseason (78.21±12.15) to postseason (81.21±11.55, t21=4.55, p=0.045, d=0.25, d CI95=-0.34, 0.85).
The number of female participants with an asymmetry in the posteromedial direction on the lower quarter screen significantly increased over the season from three participants to eight participants 1=4.70, p=0.03). The number of female participants with an asymmetry in the superolateral direction of the upper quarter screen decreased significantly from preseason (n=9) to postseason (n=4; 1=4.70, p=0.030). No other comparisons were significant (p>0.05).
Dorsiflexion ROM
Male and female preseason and postseason dorsiflexion active ROM means with descriptive statistics are listed in Table 3. Dorsiflexion ROM in male’s right ankle worsened from preseason (mean=34.36±7.70) to postseason (mean=30.26±6.35; t49=24.98, p<0.01, d=-0.58, d CI95=-0.98, -0.18). Left dorsiflexion in males ROM also decreased from preseason (mean=34.70±6.03) to postseason (mean=30.34±5.23; F49=34.21, p<0.01, d=-0.77, d CI95=-1.18, -0.37). Dorsiflexion ROM in females did not significantly change for the right ankle (t21=0.22, p=0.64, d=-0.02, d CI95=-0.61, 0.57) or left ankle (t21=0.74, p=0.40, d=-0.14, d CI95=-0.74, 0.45) from preseason to postseason. The number of males with a dorsiflexion asymmetry did not significantly change from preseason (n=11) to postseason (n=12; 1=0.12, p=0.73). The number of females with a dorsiflexion asymmetry also did not change from preseason (n=5) to postseason (n=5; 1=0.00, p=1.00). However, the number of participants with right dorsiflexion below the passing score of 35 degrees did significantly increase from preseason (n=24 for males, n=5 for females) to postseason (n=38 for males, n=20 for females) for both males 1=15.71, p<0.001) and females 1=58.24, p<0.001). The number of participants with left dorsiflexion below the passing score of 35 degrees also significantly increased from preseason (n=24 for males, n=2 for females) to postseason (n=45 for males, n=20 for females) for males 1=35.34, p<0.001) and females 1=178.20, p<0.001).
During preseason measurements for males, there was a statistically significant weak positive relationship (r=0.35) between right dorsiflexion ROM and right leg YBT composite scores (F1,48=6.63, p=0.013), with right dorsiflexion accounting for 12.1% of the variance in right leg YBT composite scores. The relationship improved to moderate positive (r=0.51) for postseason measurements (F1,48=16.45, p<0.001), with 25.5% of YBT composite score variance being attributed to dorsiflexion ROM. Left leg dorsiflexion ROM at preseason for males also had a statistically significant weak positive relationship (r=0.31) to left leg YBT composite scores (F1,48=5.18, p=0.03), though only 9.7% of the variance in the left YBT composite score was explained by left ankle dorsiflexion. Postseason measurements maintained a statistically significant weak positive relationship (r=0.43) between left ankle dorsiflexion and left YBT composite scores (F1,48=10.89, p=0.01), but the amount of variance attributed to dorsiflexion ROM increased to 18.5%. Female left dorsiflexion ROM also had a statistically significant weak positive relationship (r=0.49) with left YBT composite scores (F1,20=4.51, p=0.05) in preseason measurements, with 18.4% of left YBT composite score variance attributed to left dorsiflexion. While the weak positive relationship (r=0.38) remained in postseason measurements, it was not significant (F1,20=3.44, r2=0.147, p=0.08). Female right dorsiflexion did not have a significant relationship to YBT composite scores (p>0.05).
Move2Perform Categories
Median Move2Perform scores can be seen in Table 4. Move2Perform deficit categories did not significantly change from preseason (median=1.00) to postseason (median=1.00; z=-1.89; p=0.06) in males. Female Move2Perform deficit categories also did not significantly change from preseason (median=2.00) to postseason (median=2.00; z=-182 0.58, p=0.56).
DISCUSSION
The results of this study indicate no significant change in the FMS composite scores over time for males and females. These results support previous studies that have examined FMS composite score changes over the course of a rugby season.16,34 While Waldron et al34 found improvements in physical fitness during the early portion of the season, FMS scores did not significantly change (p>0.05), potentially demonstrating the difference between physical fitness and function. Mean FMS composite scores of soccer and volleyball athletes, as well as adolescent hockey athletes, increased over time but the increases were not statistically significant.16,49 The current findings do not support these results as no significant differences were found in FMS composite scores between the two-time points for either sex. However, findings support previous research and indicate that sex may not play a role in functional movement composite score change over time.16,49
When individual movements were assessed, significant differences were found in the right hurdle step, right shoulder mobility, and left active straight leg raise while the composite score difference was not significant. The difference in findings suggests that FMS individual scores should be assessed by limb and not just as composite scores. Sprague et al.16 also reported a change in the number of players with an asymmetry and score of one and noted a significant decrease in the frequency of asymmetries from preseason to postseason when all participants were included. However, it should be noted that the authors only assessed the number of participants with an asymmetry present in any of the five individual movements and not the change in the frequency in asymmetries. The use of these criteria would not account for the fact that one participant could have several asymmetries and therefore may not provide an accurate picture of changes over the season. The injury risk increase with only one asymmetry present was found to have a relatively low predictive specificity and sensitivity for lower extremity injury at 0.62 and 0.58, respectively.19 To the authors’ knowledge, no study has assessed the effect of more than one asymmetry on the risk of injury. The current study found significant differences in the frequency of asymmetries in the inline lunge and active straight leg raise from preseason to postseason, indicating individual score asymmetries should be assessed in addition to FMS composite scores in order to accurately assess functional movement abilities of athletes.
Significant differences were found in multiple movement scores and perceived scores in both males and females. Male participants were accurate in assessing the mobility of the right shoulder. All other movements were significantly overestimated by the male participants with the exception of trunk stability, which was significantly underestimated. The underestimation may be due to the fact that many athletes assess strength visually by observable muscle mass. If abdominal muscle mass is not visible, athletes may perceive this as indicating a lack of core strength, resulting in an underestimation. Females overestimated significantly in several movements but did not underestimate any and were accurate on 8 of the 12 categories. It is unclear whether this is due to the accuracy of their perception or the fact that they were more mobile and scored higher in each movement category. Neither group was accurate in assessing rotary stability or their ability to adequately perform a functional squat. Overestimations may be due to athletes not adequately understanding the demands of the functional movements and how they differ from their understood sense of success in their sport. If athletes are unable to accurately assess their movement quality, they may not be able to identify and address areas that are deficient.
Significant increases in the right arm and right leg YBT composite scores were observed (which accounted for limb length) over the course of a Division III fall lacrosse season in females. This increase indicates an increase in dynamic postural control and may therefore relate to decreased injury risk. The result contrasts previous findings in Division I field hockey athletes where there were no significant differences reported over time in any reach direction or limb (p>0.31).34 Hoch et al34 observed the effects of a 12-week competitive field hockey season while the current study looked at the effects of an eight-week fall lacrosse season. The discrepancy between findings may be due to the difference in competition level or from the difference in season length.
The YBT has been utilized as a tool for assessing injury risk in various populations.29,30,50 An asymmetry greater than 4 cm on the lower extremity posteromedial direction in soccer athletes has been found to have a 3.86 times increased risk of non-contact injury.50 The same asymmetry difference on the lower quarter screen anterior reach direction in basketball athletes resulted in a 2.5 times increase in the risk of injury.29 Results indicated that 40% (n=20/50) of males recorded a preseason asymmetry greater than 6 cm, the distance considered an asymmetry in the posteromedial and posterolateral directions31 of the lower quarter screen. At the postseason measurement, the number increased to 48% (n=24/50) of males. For females in the same reach direction, 14% (N=3/22) had an asymmetry of greater than 6 cm present at preseason compared to 36% (n=8/22) at the postseason measurements. Male participants also recorded higher percentages of anterior reach asymmetries greater than the previously suggested 4 cm threshold31 from 40% (n=20/50) at both preseason and postseason when compared to females at 18% (n=4/22) for preseason and 23% (n=5/22) for postseason. Findings indicate that males may be at an increased risk of suffering a non-contact injury both at the start of a season and after eight weeks of competitive play, while women may stay in the same risk category throughout a season. An additional risk factor for lower extremity injury may be a decrease in composite reach on the lower quarter screen.29 In our study, we found that both males and females increased their lower quarter scores over the season yet noted increased frequencies of asymmetries for both populations. Perhaps clinicians should consider various injury risk factors when assessing athletes, as one risk factor may potentially affect the risk of injury more than another.
Limited dorsiflexion ROM has been described as a risk factor for injury, with asymmetry being noted as an additional risk factor. Closed chain dorsiflexion below 45° degrees in an active weight-bearing lunge has been associated with the development of patellar tendinopathy in adult volleyball athletes9 and limited dorsiflexion has also been suggested as a risk factor for anterior cruciate ligament (ACL) sprains.8 When observing landing biomechanics, reduced dorsiflexion ROM decreased knee-flexion displacement and resulted in an increased ACL load due to greater ground reaction forces.8,51 The current findings place both male (right preseason ROM=34.36±7.70; left preseason ROM=34.70±6.03) and female (right preseason ROM=31.5±5.28; left preseason ROM=31.45±4.66) Division III lacrosse athletes at an increased risk for both patellar tendinopathy and ACL sprains. Decreases in male athlete dorsiflexion ROM were observed over the course of a season (right postseason ROM=30.26±6.30; left postseason ROM=30.34±5.23), indicating dorsiflexion should be monitored over the course of a season to ensure athletes do not increase their injury risk over a season due to limited dorsiflexion. While females did not change from preseason to postseason as male participants did, the mean dorsiflexion ROM for both groups was below 35 degrees and therefore they entered the season below passing.31 Dorsiflexion ROM in both groups decreased over the season yet increased the amount of lower quarter YBT score variance it accounted for.
Lehr et al.23 used the Move2Perform classifications, including playing level, YBT and FMS scores, dorsiflexion measurements, and injury history, to determine the relative risk of injury. Athletes in the “High-Risk” category, which consisted of moderate and substantial risk, were found to be 3.4 times more likely to become injured when compared to the “Low-Risk” group, which consisted of normal and slight risk.23 All participants included in this study were placed in the “High-Risk” category in both the preseason and postseason largely due to dorsiflexion ROM being below the risk threshold and low YBT upper and lower quarter screen scores.23 Competition level (i.e. DI vs. DIII) may play a factor in lower extremity function and stability. Dynamic postural control as measured by the YBT may not stay consistent across different levels of competition. Butler et al. found that dynamic balance was greater in professional baseball players compared to Division I collegiate and high school players.32 Their population differs in that participants of the current study were all Division III athletes. While the current findings suggest dynamic postural control changes from preseason to postseason in men but not women, the results may not be applicable to all NCAA divisions or other populations.
Practical Implications
Preseason screening of movement pattern quality is useful when assessing movement quality and neuromuscular control. However, since movement pattern quality changes over the course of a season, measurements should be conducted again during the season. Findings of the current study indicate several areas that should be addressed in order to accurately improve movement pattern quality and decrease injury risk with a focus on identifying poor movement quality. In females, the movement pattern quality of the right shoulder and left active straight leg raise should be assessed. Emphasis should be placed on the active straight leg raise for men due to the possible increase in left hip mobility resulting in possible asymmetry.
Female dorsiflexion should be assessed prior to the season for possible lack of ROM. Dorsiflexion in males should be assessed both before a season to identify possible dorsiflexion deficits, and throughout a season to ensure ROM does not decrease, leading to a possible increased risk of injury. As there are several factors that may result in decreased dorsiflexion ROM, it is important to identify the cause of the decrease in dorsiflexion when implementing appropriate corrective exercises to ensure the correct cause is addressed. Clinicians should focus on mobility in the gastroc-soleus complex to prevent muscle tightness at both preseason and during the season. Preseason posterior talar glides should also be performed to ensure that the joint capsule is not tight prior to the season, thus further limiting dorsiflexion ROM.52 Hip flexors and extensors may also be assessed periodically throughout the season to ensure proper movement of the lower extremity kinetic chain. In addition, clinicians should focus on maintaining lower extremity dynamic postural control in both males and females as a season progresses. Based on the findings of this study, preseason screenings of individual lower extremity movement, notably in the posteromedial and anterior directions, can aid clinicians in identifying and addressing potential injury risk factors via asymmetries. The current findings suggest that overall, lower quarter dynamic postural control increased over the course of the season. While male dorsiflexion concurrently decreased; this may be due to an increase in stability of the talocrural joint over the course of a season. Therefore, importance should be placed on ensuring athletes enter the season with dorsiflexion ROM above the specific at-risk categories to account for possible decreases in ROM as stability increases.
Limitations
One limitation of this study is the number of participants included. A larger sample size, especially for women, would have increased generalizability. Future research should focus on increasing sample size to improve statistical power, specifically on the upper quarter screen and dorsiflexion for females and recruiting athletes from multiple Division III athletic sponsoring universities, as well as Division I and II athletic sponsoring universities, to increase the generalizability of results. A second limitation was that all athletes were recruited from the same university. We also did not control for the time of day, nutritional status, or workout regimen when scheduling screening times, though both teams were coached by the same strength and conditioning coach. This may have resulted in participants performing mobility screens after a lifting session and being more fatigued, which could have affected our results. Factors such as injury history, nutrition, time of day, and strength and conditioning routines should be examined to determine how they might alter dynamic postural control measurements. Of note, all participants included in the current study were placed in the “High Risk” category by Move2Perform at both time points, a function of the Move2Perform algorithm. Finally, this study is the first to report and measure perceived mobility among athletes. The validity and reliability of the methods utilized to capture perceived mobility is unknown.
Future research should examine the relationship between dorsiflexion ROM and athletic performance. While dorsiflexion below the threshold of 35 degrees is a risk factor for injury on the YBT, the decreased ROM may be due to anatomical muscle changes to the gastroc-soleus complex. Therefore, clinicians should assess dorsiflexion range of motion throughout the season due to potential anatomical muscle changes as physical fitness increases over the early portion of a season.34 Although specific cut points have been established for different populations, researchers should examine the injury risk for collegiate athletes to determine the sport-specific cut points in an effort to better assess injury risk. Additionally, due to the multifaceted aspect of injury risk, these screenings may have an increased effectiveness when combined with other tests. Future research should look into the effect of the number of asymmetries present on the risk of injury. Lastly, 45 of 50 male and 20 of 22 female participants listed their dominant hand and leg as being the right side. Limb domination may be examined to determine if this plays a role in dynamic postural control.
CONCLUSION
The results of this study suggest that a nontraditional lacrosse season did not change overall movement pattern quality (composite scores) in men’s or women’s lacrosse players. However, clinicians should assess movement pattern quality in each individual movement as opposed to using composite scores. Clinicians should be aware that males are not accurate in assessing their own movement pattern quality and are therefore unlikely to individually address movement deficits. Clinicians should be aware of dynamic postural control changes over the course of a competitive season in both males and females. While lower extremity dynamic postural control in male lacrosse athletes may increase over the season, dorsiflexion ROM may decrease. Clinicians should focus on ensuring athletes maintain a dorsiflexion ROM above 40 degrees31 prior to the season beginning to allow for a decrease in ROM as talocrural joint stability increases. Clinicians should be aware of potential asymmetries in lower extremity stability, notably in the posteromedial and anterior directions, with no asymmetries in dorsiflexion ROM.
COI
The authors report no conflicts of interest
Funding Statement
No funding