Feature Extractors Evaluation Based V-SLAM for Autonomous Vehicles
Feature Extractors Evaluation Based V-SLAM for Autonomous Vehicles
Volume 5, Issue 5, Page No 1137-1146, 2020
Author’s Name: Mounir Amraoui1,a), Rachid Latif1, Abdelhafid El Ouardi2, Abdelouahed Tajer3
View Affiliations
1LISTI, ENSA Ibn Zohr University, Agadir, 80000, Morocco
2SATIE Paris-Saclay University, Orsay, 91405, France
3LISA, ENSA Cadi Ayyad University, Marrakech, 40140, Morocco
a)Author to whom correspondence should be addressed. E-mail: mounir.amraoui@edu.uiz.ac.ma
Adv. Sci. Technol. Eng. Syst. J. 5(5), 1137-1146 (2020); ![]() DOI: 10.25046/aj0505138
DOI: 10.25046/aj0505138
Keywords: V-SLAM, Feature Extraction, Detectors, Descriptors, Bio-inspired algorithms, Front-end processing

Export Citations
Visual Simultaneous Localization and Mapping known as V-SLAM, is an essential task for autonomous vehicles. It can be carried out using several sensors, in particular with on board cameras. To locate a vehicle, SLAM algorithms are based on two main tasks. The first task (front-end kernel) is intended to process images in order to provide features (called also landmarks or primitives) of the perceived environment. The second task (back-end kernel) is intended for localization and environment reconstruction.
This work focuses on the front-end task which uses extractors (detectors and descriptors) in a stereo-vision system. Several feature detectors and descriptors exist in the state of the art. The aim of this paper is to evaluate the possible combinations of detectors and descriptors to achieve a precise localization while considering the processing times. The study is extended to bio-inspired extractors. The evaluation is achieved with SLAM algorithms over well-known indoor and outdoor datasets. Experimental results highlight the performance of bio-inspired extractors and their potential integration in designing vision systems for real-time SLAM applications.
Received: 07 August 2020, Accepted: 08 October 2020, Published Online: 20 October 2020
1. Introduction
Simultaneous localization and mapping (SLAM) [1] are a complex task aiming to reconstruct a map during a vehicle motion in parallel while localizing its position. This problem can be solved by using complicated algorithms, where many threads should be executed simultaneously, since the need is to recognize at the same time the vehicle pose and process previously detected landmarks for pose estimation and mapping. It is known that in ordinary circumstances a map cannot be achieved without knowing the precise position, while to know it, a map with landmarks is needed. The pose recognition is done by using feature extractors, that are a combination between feature detectors and descriptors. A SLAM algorithm can use input data issued from one or many sensors, to estimate the robot position. However, for a higher accuracy, a fusion of different sensors data is required.
Vision SLAM systems use a camera to detect a maximum of key Points (KP). Some software approaches are then developed to improve the quality of detected features, by enhancing description and detection algorithms. Both these tasks are the main ingredient for back-end kernels (localization, mapping and building environment) of any real-time vision SLAM application.
Despite some weakness like sensitivity to light, vision SLAM systems need a powerful architecture for image processing. This could be improved based on a hardware software co-design.
Back-end and front-end algorithms, both dependent as shown in figure 1, are continuously object of improvement and will keep being, as well as all other researches related to the embeddability on heterogeneous architectures and parallel implementation. The works in [2, 3] are among many similar studies, an example where the SMG-SLAM and EKF-SLAM, were accelerated on a field-programmable gate array (FPGA).
Most of feature extractors are mainly based on existing algorithm but are solving their drawbacks or improving their weaknesses, to be more robust against environment changes.
There are many ways to determine a key-point, also called a landmark in image processing depending on its type, since it could be a corner, a blob, an edge or a ridge. However, a recent survey [4] related to advances on feature extraction and description algorithms, show that the most used method is the corner detection, due to its algorithmic moderated complexity and the improved calculation adopted formulas, which has an impact on the number of memory access and CPU usage. Corners, called interest points, can be obtained by intersection of at least two edges.
The corner detector is based on the edge detector. It is represented by a set of pixels that have rapid change in direction. Each of these pixels have at least two dominants and various directions of the corresponding point in a local area.
The quality of a corner detector can be evaluated by applying above criterions on the same corner, for multiple images and under different environment effects such as light changes, rotation, translation, and image resolution.
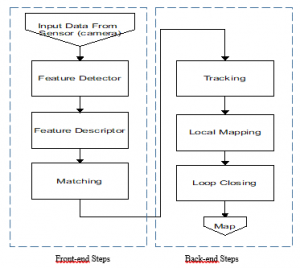
Figure 1: Front-End / Back-end main sequence for V-SLAM
As per [5] Harris represented by equation (1), was evaluated as the most stable, with the lower computational complexity compared to other corner detectors, such as Shi-Tomasi [6] and Forsner [7].
![]()
Where, in a given 2-dimensional grayscale image I, (window) are the image patch, ({\displaystyle (\Delta x,\Delta y)} is the shift and M is a Matrix structure tensor represented by:
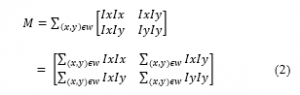
Hence based on [5], for lower threshold values Harris detects many features together with noisy data from the image, which is considered as a weakness. Since Harris cannot set multiple threshold values for each image feature detection, it needs to be enhanced.
To solve such issue an accelerated segment test model, mathematically simple, was developed and proved with better performance, since it can determine if the interest point is a corner or not, only by evaluating the point neighborhood. Based on this concept some very known detector was developed, such as Feature Accelerated Segment Test (FAST) [8], which is also considered as an enhancement of SUSAN [9] and Harris corner detectors.
There are other different approaches for corner detection, that can detect interest points using a genetic programming for automatic image operator synthesis, like the one developed by Trujillo and Olague [10] in 2011. This method can be competitive, but it is more used for object recognition and need to be trained based on a bag of features.
To perform the desired task in an optimal way, the representation of the complete initial image data must be reduced by eliminating redundant features. So, a descriptor is applied once the feature detection is done, to provide complementary attributes such as gradient, magnitude and orientation.
Several descriptors like SIFT, SURF, BRIEF, ORB or BRISK has been successfully applied for tracking and object detection tasks, but most of pervious evaluation works were related to the computational complexity of algorithms.
In this work, our contribution is a study of detectors and descriptors to select the suitable extractor combination dedicated to the V-SLAM. The study considers constraints of processing times and precision for autonomous vehicles. It is extended to bio-inspired extractors and their integration into a back-end V-SLAM system.
The following section is related to the state-of-the-art and the essential concepts, to highlight and explain the reasons behind each selection and present also advantages and drawbacks of the chosen feature descriptors and detectors. Then, the evaluation methodology will be presented in section 3. Section 4 shows the results related to the processing times and precision of the evaluated extractors. It presents also front-end experimental tests which lead us to select an extractor for a full SLAM evaluation (back-end evaluation). The last section gives a general holistic view point and a conclusion.
2. Related Work
2.1. Feature detectors
FAST: based on AST (Accelerated Segment Test) and stands for Feature Accelerated Segment Test, is a corner detector that exceeds the other detectors in both computational performance and repeatability as per [11]. This method consists on the examination of the intensity for a given central pixel p in a radius r circle following a mathematical representation, where the intensity value Ip of the corresponding pixel p and a threshold t are used in three intervals:
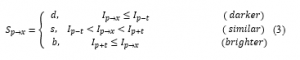
where, is the state, is the intensity of the pixel and t is a threshold.
There is a way to make this process faster by evaluating n successive pixels from the circle. Based on the brightness and darkness of these pixels, the evaluated pixel can be identified as a feature or not.
Authors in [11] has optimized the algorithm to achieve higher computational efficiency with improved processing speed, by defining the order in which the test is done and applying a non-maximum suppression (NMS), to pixels that have successfully verified the segment test. The idea is mathematically represented by:
![]()
In this equation, p refers the central pixel, t is a threshold and “pixel values” correspond to the N contiguous pixels in the corresponding circle.
The AST processing speed depends mainly on the pixel from which the evaluation is starting first. Therefore, the decision tree can be computed based on the distribution of the learnt set of the corner configuration for a given environment.
AGAST: Adaptive and Generic Accelerated Segment Test, is a corner detector developed by Elmar Mair et al. [12] where a binary decision tree is computed. This method is common and does not require any adaptation to new environments. However, it is more memory consuming due to the number of memory access to weight the various pixels. The decision tree is optimal for a given probability of similar pixels in the AST mask.
Also, the corner detector is automatically adapted to the environment by combining two trees, to make, with only one-pixel delay, the optimal decision tree for the image region. Hence, it results in a corner detector that does not need a training task, while maintaining the same corner repeatability and response as FAST.
By varying the nucleus (Ps), the decision tree can be balanced. The system is then represented as follow:
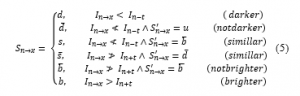
where, is the previous state, I is the pixel brightness and refers to an unknown state.
Therefore, when the environment switches at consecutive pixels from homogenous to structured, AGAST can be less efficient than FAST. However, it is not possible practically due to the mirroring effect of dissimilar pixels, also because a random brightness distribution does not exist on a natural image.
SURF: Stands for Speed Up robust Feature, it is inspired and developed based on SIFT [13]. The main motivation of this feature detector and descriptor is to overcome SIFT’s low processing time and computational complexity. SURF [14] has been reported to be up to a few times faster than SIFT without compromising the performance.
For a given pixel, SURF calculate first the Haar-wavelet responses in x and y-direction, around the key-point in a circular neighborhood of radius 6. Integral images are also used on big scales wavelets for fast filtering. The second step in the process is to calculate the main orientation of the feature descriptor, by making the sum of vertical and horizontal wavelet responses in a scanning area, then changing the scanning orientation by adding π/3, and re-calculating until to find the largest sum value.
STAR: It is distinguished from SIFT and SURF which find extrema at sub-sampled pixels that consequently reduces accuracy of feature localization at larger scales. This feature detector is a derivative from CenSurE (Center Surround Extrema) feature detector [15]. It was integrated to the well-known Open source Computer Vision library.
Aiming to create a multiscale detector with full spatial resolution, this detector uses a bi-level approximation of the Laplacian of Gaussians (LoG) filter. So instead of the simple circular shape, the mask is represented by a circle with 2 overlapping squares: 1 upright and 1 45-degree rotated, resulting in a polygon with thick borders, to be invariant to rotations and to enable the use of integral images for efficient computation (see figure 2). This configuration is computationally better compared to the other scale-space detectors and presents real-time implementation possibilities.
The masks shape used in feature detection for each method is given by Figure 2.
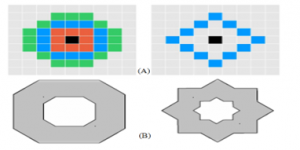
Figure 2: (A) shows the pattern for the 16-pixel mask (green), the 12-pixel masks (blue, square and diamond) and the 8-pixel used for AST mask (red), (B) is the Mask used by CenSurE (left) and STAR (right)
ORB: Stands for Oriented FAST and Rotated BRIEF (Binary Robust Binary Robust Independent Elementary Features) [16]. The ORB detector is developed based on FAST to find key-point then applies Harris corner detector measuring method to give the top N points among them. But since FAST does not compute the orientation, the authors in [16] came up with enhancing modifications.
The ORB detector creates a multiscale image pyramid, with versions of image at different resolutions, where each level in the pyramid contains a subsampled version than the previous level. Once this process is finished, FAST detector is used to detect key-points at each level, and therefore ORB is partial scale invariant.
2.2. Features descriptors
BRIEF: Stands for Binary Robust Independent Elementary Features. This feature descriptor as per [17] uses a binary subsequent matching, with Hamming distance method to compute the descriptors similarities. This algorithm is much faster and computationally efficient.
Due to the high sensitivity to noise, BRIEF performs a smoothing to the image before applying the actual descriptor, using a simple averaging filter.
The value of each contributing bit to the descriptor, is given by the comparison of intensity values of two points inside an image segment centered on the currently described feature. The value of this bit is equal to 1 if the first point intensity of this pair is higher than the second point intensity value, otherwise it is equal to 0.
A few sampling strategies were tested by the authors to select the point pairs, show that sampling according to the Gaussian distribution centered on the described feature point, results in best performances.
For BRIEF, the initial smoothing is done with a 9×9 pixels rectangular averaging filter, the image patch is a 48×48, and the proposed descriptor is 512-bit long. The size of the window can be modified to be fitted to the application.
ORB: The Oriented FAST and Rotated BRIEF descriptor, uses a modified version of BRIEF (Binary Robust Binary Robust Independent Elementary Features).
Since Standard BRIEF descriptor performs weakly on rotation, ORB drives BRIEF depending on the orientation of key-points (KP’s). The algorithm constructs a lookup table of pre-computed BRIEF patterns, to get a rotated version Sθ, where the angle is discretized by an incrementation of 12° degrees. then use the correct set of points Sθ to compute its descriptor.
BRISK: The Binary Robust Invariant Scalable Key-point (BRISK) [18], is a key point detector and descriptor inspired by AGAST [12] and BRIEF [17]. It uses AGAST for detection, which is an upgrading of FAST in term of processing time while preserving the similar detection performance.
To achieve scale invariance, the key-point is detected using a non-maxima suppression and interpolation across all scales space pyramid. To describe the features, authors have used symmetric patterns instead of using learned or random patterns.
For long-distance and to determine orientation, several sample point comparisons were used. The relative difference in intensity of the displacement vector is weighted and stored. These vectors are weighted. The computed average is used to find the major gradient direction of the patch.
FREAK: Fast Retina Key point [19], inspired from the biological human retina. The detection concept is based on summing the estimated local gradients over selected point pairs to provid the feature orientation.
To allow applying coarser discretization of rotation, a specific biologically inspired point sampling pattern is used which also results on saving memory space.
To reject false matches and accelerate the computation time, the feature description used is BREIF-based binary string. This allows a sampling pattern approach by comparing the most distinctive characteristics feature neighborhood to the point pairs carrying the information.
HOOFR: Hessian ORB-Overlapped FREAK [20] is a FREAK descriptor-based method combined with the ORB detector, with enhancements on the detection algorithm to speed up the process, improve memory allocation and reliability, the matching process timing is then reduced because the descriptor size is 256 instead of 512 compared to FREAK. HOOFR has three steps:
- The first step consists on extracting key points from training data and building the description: a matrix M is created using all possible pairs where each key-point has its own descriptor. The number of key-points is equivalent to rows and the size of descriptor is equivalent to the number of columns.
- The second step aims to define the variance value of the binary distribution, by computing the average for each column limited between 0 and 1. A mean value of 0.5 indicates the maximum variance desired to have a discriminant feature.
- Finally, the third step consist on processing all columns to maintain only 256 columns that have the greatest variances.
ZEON: Defined by H. Angrish [21] as a new technique combining features of, SURF [14], BRISK [17] and FREAK [19], to overcome each method drawback. The main purpose of this improvement is to increase the extraction robustness and accuracy. This new proposed technique is intended to use features of SURF and BRISK as well as the detection capabilities of FREAK as a first step. This will provide a certain edge and will not add massive time strains to the new method timing.
3. Evaluation Methodology
First, we will develop and set many combinations of different feature detectors and descriptors. All extractors will be evaluated in terms of processing time and accuracy for different set of images of well-known outdoor dataset, using different lighting condition and at different camera rates. Results from the first step will be analyzed to select only the best candidate that could be used in a real time SLAM system for automotive application. For this reason, we will consider the first three high score combinations taking into consideration the compromise between processing time and accuracy. At the end, we will make a full implementation of the selected extractors with a V-SLAM algorithm, to be able to evaluate the behavior of each extractor and define the most robust solution versus back-end constraints related to rotation, filtering, type of landmarks, lighting, sensor noise or ground truth. The evaluation methodology will also take indoor scenes.
4. Experimental Results
4.1. Front-End Evaluation
The adopted method for front-end process evaluation, is using a calibrated monocular camera to get image input, focusing on the number of detected features, the processing time of each extractor combination and the matching time.
To make an objective comparison, the same image is used where the calibration settings described in Table 1 are similar for each set of images given by KITTI benchmark [22].
The hardware configuration shown in Table 1.
Table 1: Hardware and software configuration
|
CPU: Intel i5 core ™ @ 2.60 GHZ GPU : NVIDIA GeForce GTX 1060 Max-Q 6GiB RAM: 12 GB |
|
| Scale factor | 1.6 |
| Initial threshold | 20 |
| Scale level | 8 |
| Min threshold | 7 |
| Max Feature | 1000 |
The number of features is set to a fix value number to limit the image maximum interest points that can be found by using a descriptor, 1000 is the highest number found during experiment, so it is set to be a reference value to make the comparison and to calculate the detector accuracy. All values are given after calculating the means. Figure 3 gives examples of proceeded images with their respective resolutions.
- Street: Image resolution: 1392 x 512 pixels. Labels: 1 Cars, 0 Vans, 0 Trucks, 0 Pedestrians, 0 Sitters, 0 Cyclists, 0 Trams, 0 Misc.
- Cars: Image resolution: 1392 x 512 pixels. Labels: 5 Cars, 2 Vans, 1 Trucks, 0 Pedestrians, 0 Sitters, 0 Cyclists, 0 Trams, 0 Misc.
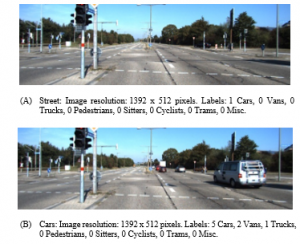
Figure 3: Outdoor images of KITTI dataset [22] used for evaluation.
Some extractors can be used, in the same time, as detectors and descriptors like ORB and SURF. Therefore, the description task is done in parallel with the detection task. From the other hand and since it is expected that the extractors will not have the same number of detected features, the processing time will be higher for the ones with high number of detections. So, the given value will consider the total processing time divided by the number of detected features as presented in Table 2 and Table 3.
Table 2: Processing time evaluation for different combinations of detectors-descriptors vs number of detected features using the image from figure 3 (A).
| Image (A): Street | |||
| Descriptor | Detector | Number of detected features | Total detection and description processing time per feature (ms) |
| FREAK | FAST | 956 | 0.046 |
| STAR | 643 | 0.12 | |
| ORB | 213 | 0.291 | |
| SURF | 684 | 0.409 | |
| AGAST | 950 | 1.065 | |
| ORB | FAST | 946 | 0.037 |
| STAR | 660 | 0.106 | |
| SURF | 967 | 0.278 | |
| ORB | 500 | 0.036 | |
| AGAST | 939 | 1.399 | |
| BRISK | FAST | 988 | 0.041 |
| STAR | 660 | 0.126 | |
| ORB | 402 | 0.239 | |
| SURF | 896 | 0.355 | |
| AGAST | 980 | 1.357 | |
| BRIEF | FAST | 951 | 0.035 |
| STAR | 660 | 0.12 | |
| ORB | 500 | 0.144 | |
| SURF | 973 | 0.197 | |
| AGAST | 944 | 1.292 | |
| ZEON | FAST | 3353 | 0.018 |
| STAR | 654 | 0.124 | |
| ORB | 371 | 0.396 | |
| SURF | 971 | 0.346 | |
| AGAST | 3382 | 0.374 | |
| SURF | FAST | 8115 | 0.049 |
| STAR | 660 | 0.127 | |
| ORB | 500 | 0.57 | |
| SURF | 1334 | 0.31 | |
| AGAST | 8217 | 0.177 | |
Table 3: Processing time evaluation for different combinations of detectors- descriptors vs number of detected features using the image from figure 3 (B)
| Image (B): Cars | |||
| Descriptor | Detector | Number of detected features | Total detection and description processing time per feature (ms) |
| FREAK | FAST | 960 | 0.05 |
| STAR | 741 | 0.09 | |
| ORB | 206 | 0.30 | |
| SURF | 691 | 0.47 | |
| AGAST | 957 | 1.39 | |
| ORB | FAST | 953 | 0.05 |
| STAR | 760 | 0.10 | |
| SURF | 969 | 0.25 | |
| ORB | 500 | 0.19 | |
| AGAST | 947 | 1.45 | |
| BRISK | FAST | 988 | 0.07 |
| STAR | 760 | 0.11 | |
| ORB | 414 | 0.21 | |
| SURF | 897 | 0.28 | |
| AGAST | 984 | 1.49 | |
| BRIEF | FAST | 956 | 0.04 |
| STAR | 760 | 0.09 | |
| ORB | 500 | 0.15 | |
| SURF | 973 | 0.25 | |
| AGAST | 952 | 1.57 | |
| ZEON | FAST | 982 | 0.06 |
| STAR | 753 | 0.11 | |
| ORB | 373 | 0.37 | |
| SURF | 862 | 0.38 | |
| AGAST | 980 | 1.37 | |
| SURF | FAST | 1000 | 0.06 |
| STAR | 760 | 0.13 | |
| ORB | 500 | 0.55 | |
| AGAST | 1000 | 0.40 | |
As shown in the above tables, it is clear that FAST as feature detector, is the most improved among all evaluated detectors because it provides the lower processing time with the maximum points of interest. Nonetheless, the total time is evaluated as the mean of the sum of all processing times needed for a feature detection and description for several iterations. Having a high number of detected features necessarily leads to a higher processing time needed for matching process. To evaluate this effect, the matching time and accuracy are then calculated according to the following formula:
![]()
Table 4 gives the time spent per feature to have the corresponding match, based on image (B) from figure 3.
Table 4: Matching time using Brut force for SURF, and Hamming distance for the remaining descriptors
| Descriptor | Detector | Number of matched Features | Matching time (ms) | % Acc |
| FREAK | FAST | 869 | 0.139 | 90.52% |
| STAR | 683 | 0.035 | 92.17% | |
| ORB | 193 | 0.049 | 93.69% | |
| SURF | 638 | 0.055 | 92.33% | |
| AGAST | 875 | 0.079 | 91.43% | |
| ORB | FAST | 891 | 0.061 | 93.49% |
| STAR | 720 | 0.064 | 94.74% | |
| SURF | 885 | 0.040 | 91.33% | |
| ORB | 471 | 0.038 | 94.20% | |
| AGAST | 885 | 0.046 | 93.45% | |
| BRISK | FAST | 896 | 0.138 | 90.69% |
| STAR | 702 | 0.103 | 92.37% | |
| ORB | 388 | 0.048 | 93.72% | |
| SURF | 852 | 0.068 | 94.98% | |
| AGAST | 897 | 0.113 | 91.16% | |
| BRIEF | FAST | 896 | 0.056 | 93.72% |
| STAR | 722 | 0.049 | 95.00% | |
| ORB | 482 | 0.038 | 96.40% | |
| SURF | 938 | 0.040 | 96.40% | |
| AGAST | 894 | 0.065 | 93.91% | |
| ZEON | FAST | 870 | 0.155 | 88.59% |
| STAR | 681 | 0.086 | 90.44% | |
| ORB | 348 | 0.054 | 93.30% | |
| SURF | 632 | 0.101 | 73.32% | |
| AGAST | 590 | 0.063 | 60.20% | |
| SURF | FAST | 845 | 0.187 | 84.50% |
| STAR | 658 | 0.120 | 86.58% | |
| ORB | 463 | 0.062 | 92.60% | |
| AGAST | 408 | 0.162 | 40.80% |
Based on above result, a complete evaluation is conducted for front-end vision SLAM system where, we can conclude that if we seek for speed and low processing time, BRIEF-FAST is the best descriptor-detector combination to be selected. However, if the priority is given to higher accuracy, the BRIEF-ORB, and BRIEF-SURF is those that must be chosen. Also, as it is seen, the FAST algorithm is better in terms of processing time and number of detected features than all actual known detectors. Therefore, any evaluation will depend strongly on the associated descriptor and matching process. However, from another side, ORB descriptor, is the best descriptor in term of accuracy.
Additionally, the evaluation of the bio-inspired FREAK descriptor has proven that it has the lowest matching time performance, beside good results on both accuracy and processing time.
To narrow down and make the choice of the most adapted combination for automotive application, we must look for a combination that fulfil both the minimum processing time and the highest accuracy, which will leave us with 3 extractor combinations as shown below in Table 5. The remaining combination will be ignored, because they do not fulfill requirement and could lead to incorrect final mapping results.
This choice can be justified by the fact that any automotive vision SLAM application must be real time. Therefore, a low processing time has the advantage, but it does not mean that the precision can be high. The best combinations are the ones shown in the Table 5.
Table 5: High score combination leading to a compromise between the maximum accuracy percentage and the minimum processing time
| Extractor | Total detection and description processing time per feature (ms) |
Matching time (ms) |
Total Processing time (ms) | % Acc |
| BRIEF-FAST | 0.04 | 0.056 | 0.096 | 93.72% |
| ORB-FAST | 0.05 | 0.061 | 0.111 | 93.49% |
| FREAK-STAR | 0.09 | 0.035 | 0.125 | 92.17% |
In a similar way to BRISK and BRIEF, FREAK uses also a binary string, but it has an optimized false matching algorithm which reduces the processing time during matching process, giving the advantage to be used for real time V-SLAM applications.
The second evaluation step is to apply the selected extractors to a full V-SLAM algorithm to evaluate the behavior considering back-end constraints (localization and mapping kernel).
4.2. Back-End Evaluation
For an objective evaluation, we implemented an algorithm based on ORB-SLAM2 and modify it to incorporate additional detectors and descriptors functional blocks. We used the already prepared class from OpenCV.
The matching method is based on the Brut force matcher which uses Hamming method to calculate distance. The intended stereo-vision system has three main parallel threads with an additional loop executed also in a separate thread.
The used datasets are an indoor sequence from Tum, fr2/desk [23] running at 10 FPS, and an outdoor sequence from the well-known KITTI dataset [24] running at 30 FPS. The reason behind this choice is because these datasets has a denser co-visibility graph and therefore the local map contains more key frames and points to evaluate object reconstruction and SLAM/odometry methods under different texture, illumination and structure conditions. The sequence is schematized in Figure 4. The obtained results are given by Figure 5.
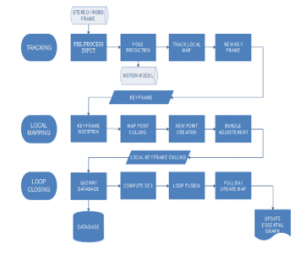
Figure 4: V-SLAM threads executed in parallel
where:
- Tracking: a separate thread where every frame is localized by extracting feature and matching it to the local map. A local Mapping loop is then applied.
- Local Mapping: minimize the reprojection error, optimize and manage the local map, by performing a bundle adjustment (BA) loop.
- Loop Closing: it enhances the pose-graph by correcting the accumulated drift, within large loops.
To allow the system to continue loop detection and creating the map, a fourth thread of Full bundle adjustment, also called Full BA [25] is launched when the optimization process is aborted, and loop closing is finished.
Once the full BA finishes, the updated subset of key frames and points are merge and optimized, with the non-updated key frames and points that where inserted while the optimization was running. This is done by propagating the correction of updated key frames.
Indoor mapping results are shown in Figure 6 with the resulting path compared to the ground truth, that is provided initially with the dataset. Camera calibration data are also provided by [23].

Figure 5: Dense point reconstruction from estimated keyframe poses: (a), sensor (camera) pose, (b) maps in TUM, fr2/desk. (c), KITTI_00 dataset tracked by the visual odometry system indicated in blue.
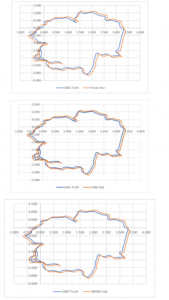
Figure 6: Pose-graph corresponding to indoor dataset, from up to down, for BRIEF-FAST, ORB-FAST, and FRAEK-STAR with comparison to ground-truth for TUM, fr2/desk
Bellow, the Figure 7 shows the evaluation using the outdoor dataset where the resulting path is compared to the ground truth given by [24].
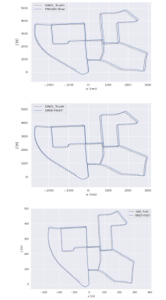
Figure 7: Pose-graph corresponding to outdoor dataset for BRIEF-FAST, ORB-FAST and FRAEK-STAR from up to down with comparison to ground-truth for KITTI dataset 00.
To compare both reconstructions, we used both metrics: the absolute trajectory error (ATE) and relative pose error (RPE) since they directly measure the difference between the ground-truth and the generated trajectory when using visual SLAM algorithms.
The estimated poses are associated to ground truth poses using the timestamps, then aligned using singular value decomposition. Finally, the difference between each pair of poses is computed. The output value is the mean, median, and the standard deviation of these differences, the RPE calculate the rotational errors. Results are given in Table 5 and Table 6 bellow.
Table 6: Translational and rotational errors calculated based on relative pose error (RPE) and absolute trajectory error ATE for 10000 pose pairs for TUM, fr2/desk indoor dataset.
| FPS = 10 | FREAK-STAR | ORB-FAST | BRISK-FAST | |
| Translational Error (m) | RMSE | 0.050 | 0.044 | 0.429 |
| Mean | 0.045 | 0.028 | 0.027 | |
| Median | 0.047 | 0.017 | 0.017 | |
| STD | 0.021 | 0.034 | 0.033 | |
| Min | 0 | 0 | 0 | |
| Max | 0.103 | 0.148 | 0.143 | |
| Rotational Error (deg) | RMSE | 9.85 | 3.73 | 3.618 |
| Mean | 3.52 | 1.5 | 1.51 | |
| Median | 0.014 | 0.011 | 0.010 | |
| STD | 9.206 | 3.394 | 3.285 | |
| Min | 0 | 0 | 0 | |
| Max | 35.629 | 18.801 | 18.223 |
Table 7: Translational and rotational errors calculated based on relative pose error (RPE) and absolute trajectory error ATE for KITTI-00 outdoor dataset.
| FPS = 30 | FREAK-STAR | ORB-FAST | BRISK-FAST | |
| Translational Error (m) | RMSE | 8.623 | 7.914 | 6.707 |
| Mean | 8.364 | 7.680 | 6.510 | |
| Median | 7.223 | 6.633 | 5.633 | |
| STD | 2.096 | 1.908 | 1.616 | |
| Min | 0.000 | 0.000 | 0.000 | |
| Max | 10.212 | 9.377 | 7.963 | |
| Rotational Error (deg) | RMSE | 0.538 | 0.505 | 0.429 |
| Mean | 0.294 | 0.278 | 0.250 | |
| Median | 0.264 | 0.250 | 0.227 | |
| STD | 0.451 | 0.422 | 0.349 | |
| Min | 0 | 0 | 0 | |
| Max | 14.079 | 12.562 | 10.161 |
Indoor dataset is considered as an environment with low lighting variations, where a robot is moving in a low speed. Additionally, the camera is held by a human, so the rotational effects are also much more important and unexpected. While the outdoor dataset is an environment that presents better other constraints like high speed, lighting changes and lower camera rotation, because it is fixed in the same position during the vehicle motion.
Considering above results, it is crystal clear that BRISK-FAST introduces the minimum rotational and translational error. Hence it has a better performance in term of trajectory precision in both shorter and longer distances.
From the other hand, FREAK-STAR extractor performance is acceptable for short distances and in environment with low variations, since it has the minimum standard deviation with lowest maximum translational error, but the rotation can be considered as a weakness compared to the ORB-FAST and BRISK-FAST extractors.
To summarize, even if all above three methods results are very close to each other, related to timing performance, a bio-inspired extractor based on FREAK has a low complexity since it uses a binary string like BRISK and BRIEF. It has an optimized matching algorithm reducing processing time. It is suitable to be implemented on a GPU or FPGA due to the number of threads that could be executed in parallel. For these reasons a parallel implementation will give the advantage to the bio-inspired algorithm and make it the more suitable for a real time Visual SLAM application.
5. Discussion and Conclusion
FAST is still till today the most adjusted feature detector despite of its known drawbacks. The reason behind this statement is that, as per above results, the other descriptors were outperformed in terms of processing time and the number of detected features. Hence, due to this fact any selection of a descriptor merged with FAST will lead to the minimum detection time. However, this descriptor used in a SLAM application must run together with a descriptor and a matching process, which is affecting the global timing performance, as also demonstrated in this paper.
The matching process is a task that must be considered when selecting the combination of detector/descriptor, since the algorithm could lose more time during this step especially when the dataset has much more Key-points that need to be matched. This is clearly shown during experiments done in the current work, where pros and cons of every detector/descriptor combination are analyzed.
Additionally, a proof of consistency, accuracy and speed is made in this study with regards to the bio-inspired extractors, that still need to be improved to have lower rotational and translational error and the processing time. A new descriptor called HOOFR [20] try to improve theses weaknesses and an evaluation of this descriptor combined with different detectors in a full SLAM system could be achieved as a perspective with a parallel implementation on a heterogeneous architecture. This could be a solution leading to promising results.
Conflict of Interest
The authors declare no conflict of interest.
Acknowledgment
This research is supported by Information Systems and Technologies Engineering Laboratory, LISTI. ENSA Ibn Zohr University, Agadir, Morocco and SATIE Paris-Saclay University, Orsay, France.
- H. Durrant-Whyte, T. Bailey, “Simultaneous localization and mapping: part I”, IEEE Robotics & Automation Magazine. 13 (2), 99-110, 2006. doi:10.1109/mra.2006.1638022. ISSN 1070-9932
- D. T. Tertei, J. Piat and M. Devy, “FPGA design and implementation of a matrix multiplier-based accelerator for 3D EKF SLAM,” 2014 International Conference on ReConFigurable Computing and FPGAs (ReConFig14), Cancun, 2014, pp. 1-6, doi: 10.1109/ReConFig.2014.7032523
- G. Mingas, E. Tsardoulias, L. Petrou “An FPGA implementation of the SMG-SLAM algorithm” Microprocessors and MicrosystemsVolume 36, Issue 3, May 2012, 190-204.
- E. Salahat, “Recent Advances in Features Extraction and Description Algorithms: A Comprehensive Survey” arXiv:1703.06376v1 [cs.CV] 19 Mar 2017.
- J. Sánchez, N. Monzón and A. Salgado “An Analysis and Implementation of the Harris Corner Detector”. Image Processing on Line. 8: 305–328, 2018. doi:10.5201/ipol.2018.229
- H. Kadhim, Araheemah, W. “A Comparative Between Corner-Detectors (Harris, Shi-Tomasi&FAST) in Images Noisy Using Non-Local Means Filter”. Journal of Al-Qadisiyah for Computer Science and Mathematics, 11(3), Comp Page 86-93, 2019.
- A.S. Eltanany et al., “Key Point Detection Techniques”. In: Hassanien A., Shaalan K., Tolba M. (eds) Proceedings of the International Conference on Advanced Intelligent Systems and Informatics 2019. AISI 2019. Advances in Intelligent Systems and Computing, 1058. Springer, Cham, 2020.
- E. Rosten “Machine learning for high-speed corner detection », in 9th European Conference on Computer Vision, Graz, Autriche, 7(13), 430-443, 2006.
- X. Chen, et al. Corner detection and matching for infrared image based on double ring mask and adaptive SUSAN algorithm. Opt Quant Electron 50, 194, 2018.
- L. Trujillo and G. Olague, “Automated design of image operators that detect interest points”. Evolutionary Computation. 16 (4): Archived from the original on 2011-07-17, 2008.
- R. Edward; R. Porter; T. Drummond “FASTER and better: A machine learning approach to corner detection”. IEEE Transactions on Pattern Analysis and Machine Intelligence. 32 (1): 105–119. arXiv:0810.2434, 2010. doi:10.1109/TPAMI.2008.275. PMID 19926902..
- E. Mair, G. D. Hager, D. Burschka, M. Suppa, and G. Hirzinger, “Adaptive and generic corner detection based on the accelerated segment test,” in Proceedings of the 11th European Conference on Computer Vision: Part II, Heraklio, 183–96, 2010.
- M. Safdari, P. Moallem and M. Satari, “SIFT Detector Boosted by Adaptive Contrast Threshold to Improve Matching Robustness of Remote Sensing Panchromatic Images,” in IEEE Journal of Selected Topics in Applied Earth Observations and Remote Sensing, 12(2), 675-684, Feb. 2019, doi: 10.1109/JSTARS.2019.2892360.
- X. Qu, “EVALUATION OF SIFT AND SURF FOR VISION BASED LOCALIZATION “International Archives of the Photogrammetry, Remote Sensing & Spatial InformationSciences . 41(B3), 685-692, 2016.
- M. Agrawal, K. Konolige, M.R. Blas, ” CenSurE: Center Surround Extremas for Realtime Feature Detection and Matching. In: Forsyth D., Torr P., Zisserman A. (eds) Computer Vision – ECCV 2008. ECCV 2008. Lecture Notes in Computer Science, 5305. Springer, Berlin, Heidelberg, 2008.
- E. Rublee, V. Rabaud, K. Konolige and G. Bradski, “ORB: An efficient alternative to SIFT or SURF,” 2011 International Conference on Computer Vision, Barcelona, 2011, pp. 2564-2571, doi: 10.1109/ICCV.2011.6126544.
- Calonder, M., Lepetit, V., Strecha, C., Fua, P.: BRIEF: binary robust independent elementary features. ECCV’10 Proceedings of the 11th European Conference Computer Vision: Part IV, (2010).
- S. Leutenegger, M. Chli and R. Y. Siegwart, “BRISK: Binary Robust invariant scalable keypoints,” 2011 International Conference on Computer Vision, Barcelona, 2011, pp. 2548-2555, doi: 10.1109/ICCV.2011.6126542.
- A. Ahmed et al., “Modeling and Simulation of Office Desk Illumination Using ZEMAX,” in 2019 International Conference on Electrical, Communication, and Computer Engineering (ICECCE), 1–6, 2019. doi: 10.1109/ICECCE47252.2019.8940756.
- D. Nguyen, A. El Ouardi, E. Aldea and S. Bouaziz, “HOOFR: An enhanced bio-inspired feature extractor,” 2016 23rd International Conference on Pattern Recognition (ICPR), Cancun, 2977-2982, 2016.
- Hitul Angrish. Navjot Kaur. Raman Chadha.” A Novel Technique to Detect Local Features in Digital Images” IJSTE – International Journal of Science Technology & Engineering 2(3), September 2015.
- A. Geiger and Philip Lenz and Christoph Stiller and Raquel Urtasun,” Vision meets Robotics: The KITTI Dataset”, International Journal of Robotics Research (IJRR), 2013, Geiger2013IJRR.
- F. Steinbruecker, J. Sturm and D. Cremers, In Workshop on Live Dense Reconstruction with Moving Cameras at the Intl. Conf. on Computer Vision (ICCV), 2011.
- A. Geiger and Philip Lenz and Raquel Urtasun “Are we ready for Autonomous Driving? The KITTI Vision Benchmark Suite”, Conference on Computer Vision and Pattern Recognition (CVPR), 2012.
- D. P. Frost, O. Kähler and D. W. Murray, “Object-aware bundle adjustment for correcting monocular scale drift,” 2016 IEEE International Conference on Robotics and Automation (ICRA), Stockholm, 2016, 4770-4776, doi: 10.1109/ICRA.2016.7487680.