
. Introduction
Luminescence dating is a basic technique that allows the determination of the timing of sediment deposition during the Late Quaternary. Two main minerals, quartz and K-feldspar, are used for this purpose. It has long been known that feldspars, in comparison with quartz, have a more complex chemistry and crystal structure, which translates into a more complicated process of dose rate determination. Many studies have assessed the internal dose rate for single grains of K-feldspar (Huot and Lamothe, 2012; Neudorf et al., 2012; Smedley et al., 2012; Trauerstein et al., 2014), but there are very few papers on the internal dose rate dedicated to quartz (Vandenberghe et al., 2003, 2004, 2008; Jacobs, 2004; Jacobs et al., 2006). It is generally assumed that the internal dose rate is negligible because radionuclides are located outside the quartz grains. Another aspect, however, is that alpha particles are less efficient in inducing luminescence. This reduces the effect of any radioactivity from within the quartz grains. Apart from the internal alpha dose rate, in our research, we also determine the internal beta dose rate. In earlier studies on coarse-grained quartz, the beta component was considered to be negligible. The reasons may be measurement challenges, the fact that the ranges of beta particles are large compared with the grain sizes (Guérin et al., 2012) or/and the fact that in most samples the other dose rate components are large in comparison to the internal beta dose rate.
We show that quartz also has internal radioactivity, whose magnitude can form a significant part of the total dose rate, especially for natural sediments characterised by low (about 0.8–0.9 Gy · ka−1, Moska et al., 2020), very low (0.4–0.6 Gy · ka−1, Kasse et al., 2007) and even lower (<0.2 Gy · ka−1, Beerten et al., 2020) external dose rates.
In this paper, we investigate the internal dose rate components (alpha and beta) for quartz grains separated from 42 sedimentary samples and postulate that the internal dose rate should not be neglected for low and very low dose rate sediments.
. Materials and Methods
Forty-two samples were selected from several different dating projects carried out at the Gliwice Luminescence Dating Laboratory (Moska et al., 2021). Most of the analysed samples were dune sediments, with a low concentration of natural radionuclides. A low concentration of natural radionuclides will result in low external dose rates of about 1 Gy · ka−1 or less. Comprehensive preparation of samples for measurement was performed along two paths: for internal and external dose rate determinations. Fig. 1 presents both approaches, where we had separated the internal, external and cosmic doses. This will be described in detail in the following sections.
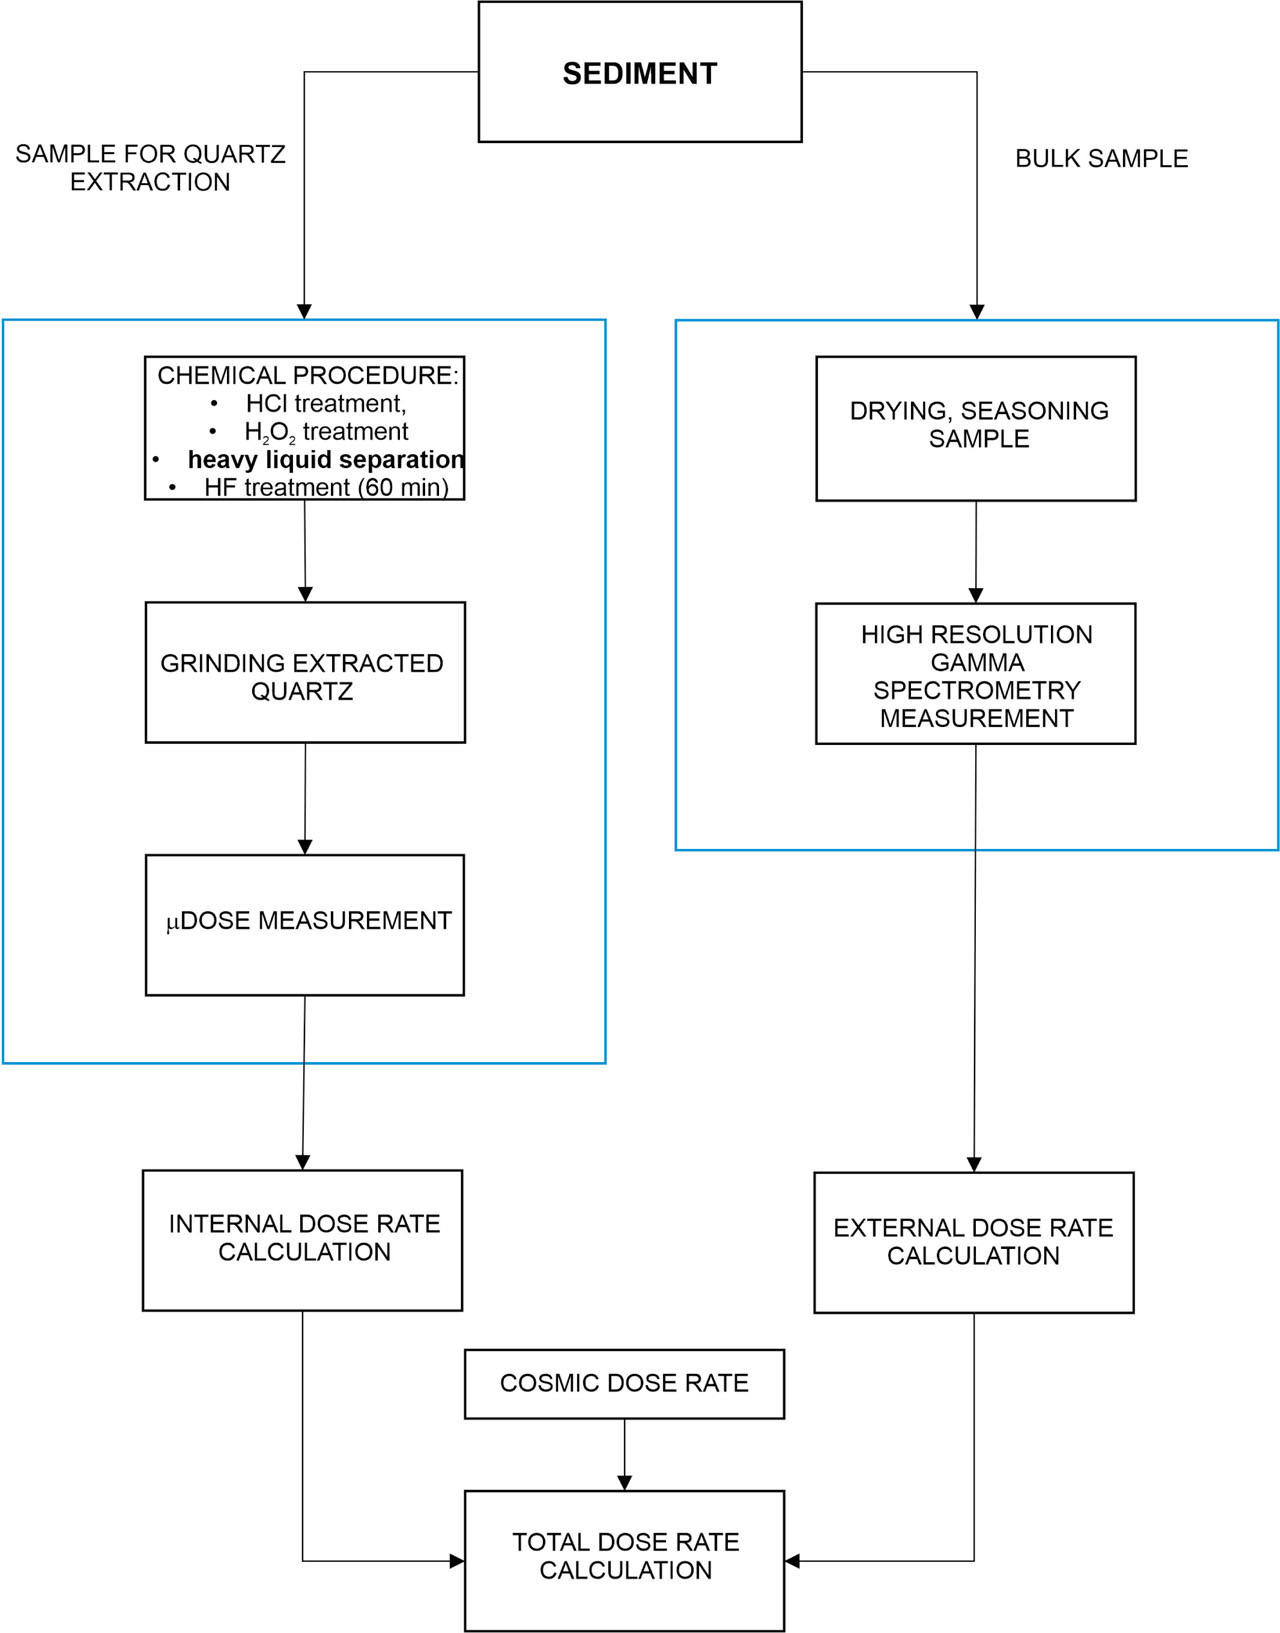
Determination of Internal Activity
The determination of the internal dose rates requires the extraction of pure quartz, thus chemical treatment is necessary. First, the material was immersed in 20% hydrochloric acid and 20% hydrogen peroxide to remove carbonates and organic material, respectively. Between these two steps, the samples were rinsed using distilled water. After initial preparation, the samples were sifted using 125–200 μm sieves. Next, quartz was separated using a heavy liquid – sodium polytungstate solutions of densities of 2.62 g · cm−3 and 2.75 g · cm−3. Finally, the grains were etched in 40% hydrofluoric acid for 60 min in order to remove the outer layer of about 10 μm, which absorbed the external alpha radiation dose (Aitken, 1985, 1998). To verify the quartz purity and to ensure that there was no feldspar contamination, samples were checked with a Motic BA 310Met polarising mineralogical-petrographic microscope equipped with reflected-transmitted light sources.
To assess the internal dose rates, the mass of analysed samples was adjusted to provide at least 3.00 g of ground quartz for measurement. To ensure that the amount of material was sufficient to measure the internal dose rate, at least 200 g of raw sample was needed. The extracted quartz grains were used for this purpose and for De determination.
Internal dose rate measurements were performed using two μDose systems (Tudyka et al., 2018). μDose allows the detection of alpha and beta particles as well as four types of decay pairs that arise from uranium and thorium decay chains. This system combines the advantages of alpha (Aitken, 1985) and beta (Bøtter-Jensen and Mejdah, 1988; Sanderson, 1988) counting measurement techniques with additional radioactive identification capabilities. Decay pairs are used to assess uranium and thorium decay chain specific activities, and the β residual count rate is used to estimate the 40K activity.
The systems were calibrated for 3.00 g samples using reference materials from the International Atomic Energy Agency (IAEA): IAEA-RGU-1, IAEA-RGTh-1, IAEA-RGK-1 and mixed reference material (1.00 g of each of the above-mentioned standards). The background level was estimated using a 3.00 g disc made from a plastic polymer with negligible radionuclide contamination. The extracted quartz was dried and ground for 45 min at 200 rpm using a planetary ball mill to obtain a grain size of approximately 20 μm. Next, 3.00 g of the sample was uniformly distributed on the 70-mm diameter sample holder and then put into the counting container. The samples did not need to be stored for the reestablishment of radioactive equilibrium. Due to the low radioactivity, the measurement time was between 60 h and 72 h.
Determination of External Activity
The collected samples were stored in a laboratory dryer (at 70°C) until a constant weight was reached. Next, crushed samples were sealed in γBeakers (Poręba et al., 2020) for at least 3 weeks. This delay was necessary to allow 222Rn to reach a radioactive equilibrium with 226Ra. The measurement time for each sample was about 48 h (Moska, 2019).
In order to determine the external dose rates for all samples, the radionuclides of 238U, 232Th decay chains and 40K were measured using a high-resolution gamma HPGe detector. HPGe detector was calibrated using IAEA-RGU-1, IAEA-RGTh-1, and IAEA-RGK-1 reference materials provided by the IAEA. The 238U decay chain activity was assessed from the 63 keV line of 234Th, 186 keV line of 226Ra, 295 keV and 352 keV lines of 214Pb, and 609 keV, 1120 keV, 1764 keV lines of 214Bi. The 232Th decay chain activity was assessed from 338 keV and 911 keV lines of 228Ac, 583 keV and 2613 keV lines of 208Tl. 40K was evaluated from its 1460 keV line. In each decay chain, radionuclides had statistically the same radioactivity with no signs of secular disequilibrium. The 238U and 232Th activities were calculated using weighted mean from their daughter radionuclides contents.
Internal, External and Cosmic Dose Rates Calculation
Radionuclide activities determined in the sediment and in purified quartz were used to calculate the dose rates using the infinite matrix assumption (Guérin et al., 2012) while the dose rate conversion factors provided by Cresswell et al. (2018) were used. The a-value was set to be equal to 0.04 ± 0.02 (Rees-Jones, 1995). The external dose rate was additionally corrected for water content following Aitken (1985).
To account for radiation attenuation for grains (the 125–200 μm interval), we used data provided by Brennan et al. (1991) for α correction and Guérin et al. (2011) for β correction. Following the Durcan et al. (2015) notation, the attenuation factors [1 – Φ(D)], which describe the external dose rate to a grain with a given size, were used to correct external doses. These attenuation factors can be rearranged to Φ(D), which will give a residual value that can be used to calculate the internal dose rate.
Similarly, to account for the etched away layer of 10 ± 2 μm, we used data provided by Bell (1979) and Brennan (2003). This accounts for the fact that the etched away layer was absorbing part of the external radiation as well as for the internal dose rate, it contained radionuclides and was a source of internal dose rate. Moreover, the removed 10 ± 2 μm layer was exposed to the external alpha and beta radiation and its energy was deposited there preferentially, especially for the alpha radiation.
The cosmic dose rate was assessed after Prescott and Hutton (1994). Finally, internal, external and cosmic dose rates were added up to obtain the total dose rates. Internal, external and cosmic dose rates correspond to 1σ and are mostly dominated by random sources of uncertainty.
. Results and Discussion
All our results, namely sample information, the natural concentration of radionuclides and the components of the total dose rates, are demonstrated in Table 1.
Table 1
The table contains: sample information (sample ID and sample name), the natural concentration of radionuclides 238U, 232Th and 40K. Internal alpha, internal beta, external and cosmic dose rates were added up to obtain total dose rates. The final row shows the average and the standard deviation for the suite of samples.
In our study, the external and internal dose rates vary in the ranges of 0.500–2.285 Gy · ka−1 and 0.006–0.209 Gy · ka−1, respectively (Fig. 2). In addition, in every extracted quartz sample, we detected uranium and thorium decay chain members.
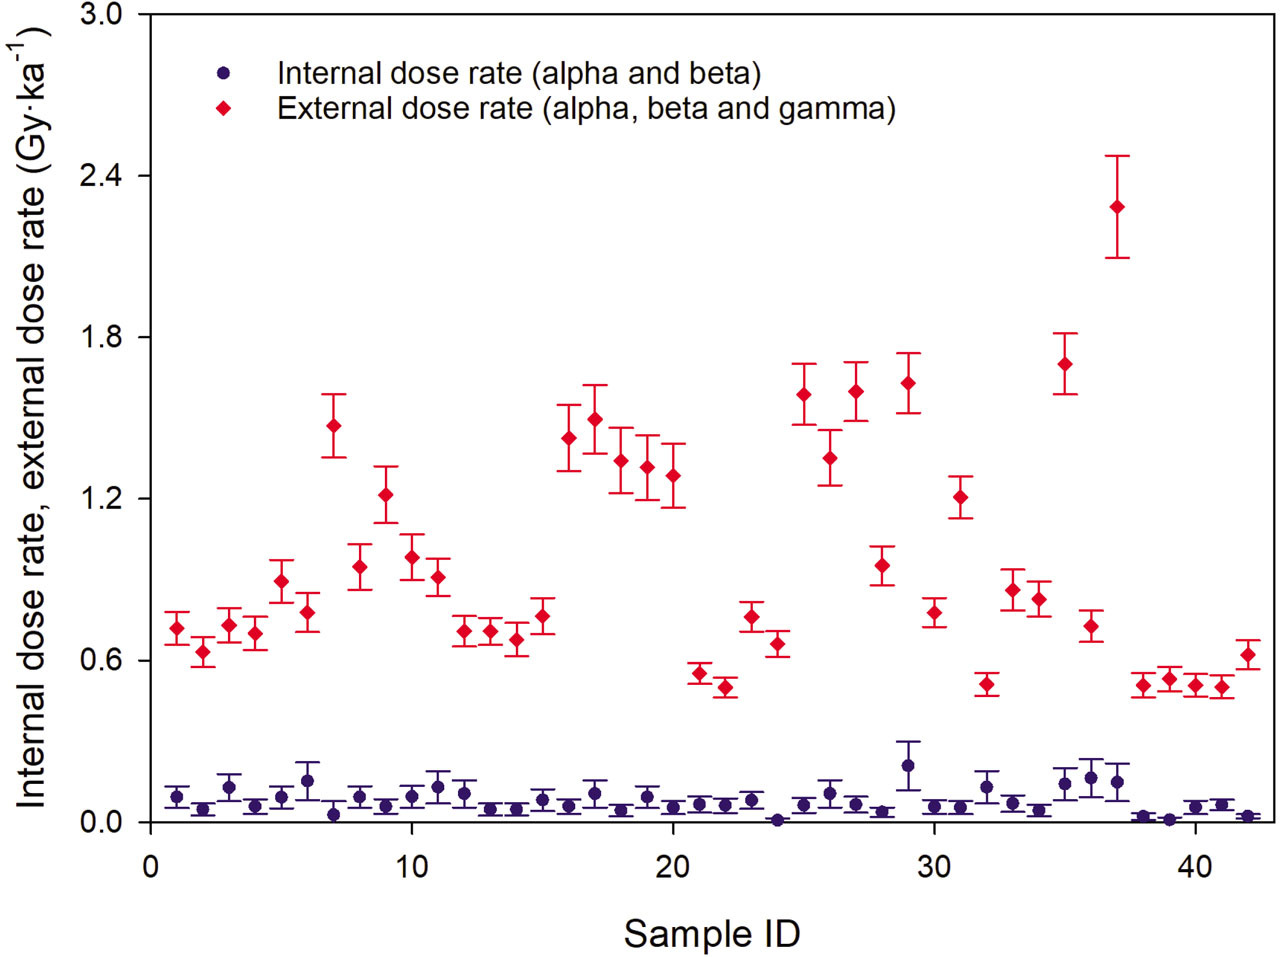
It is important to emphasise that radionuclides content from different environmental systems, in general, cannot be directly compared. Therefore, we can only roughly compare our values with the values reported by independent research groups and check how our results fit into the broader picture. On average the internal dose rates is equal to 0.0779 ± 0.0068 Gy · ka−1 (n = 42) (Fig. 3). This can be compared with that of Vandenberghe et al. (2004), who reported 1.95–6.58 Bq · kg−1 of 238U, 1.39–2.35 Bq · kg−1 of 232Th and 1.06–3.38 Bq · kg−1 of 40K, which with the application of our dose rate modifiers would correspond to 0.034–0.1 Gy · ka−1. Vandenberghe et al. (2008) performed their measurements using neutron activation analysis (NAA). Later, using NAA on different samples, Vandenberghe et al. (2008) reported 0.08 ± 0.02 mg · kg−1 of U and 0.18 ± 0.03 mg · kg−1 of Th, which with our dose rate modifiers would correspond to 0.018 ± 0.008 Gy · ka−1. In addition, Götze (2009) reports much wider ranges of plausible uranium, thorium and potassium contents of 0.0001–10 mg · kg−1, 0.0001–0.1 mg · kg−1 and 1–1000 mg · kg−1, respectively. This would correspond to 0.00002–1.4 Gy · ka−1 with our dose rate modifiers. The above studies (Vandenberghe et al., 2004, 2008; Götze, 2009) yielded results comparable to our data.
Fig 3
Internal dose rate and external dose rate histogram from 42 measured samples and data derived from values reported in the literature.
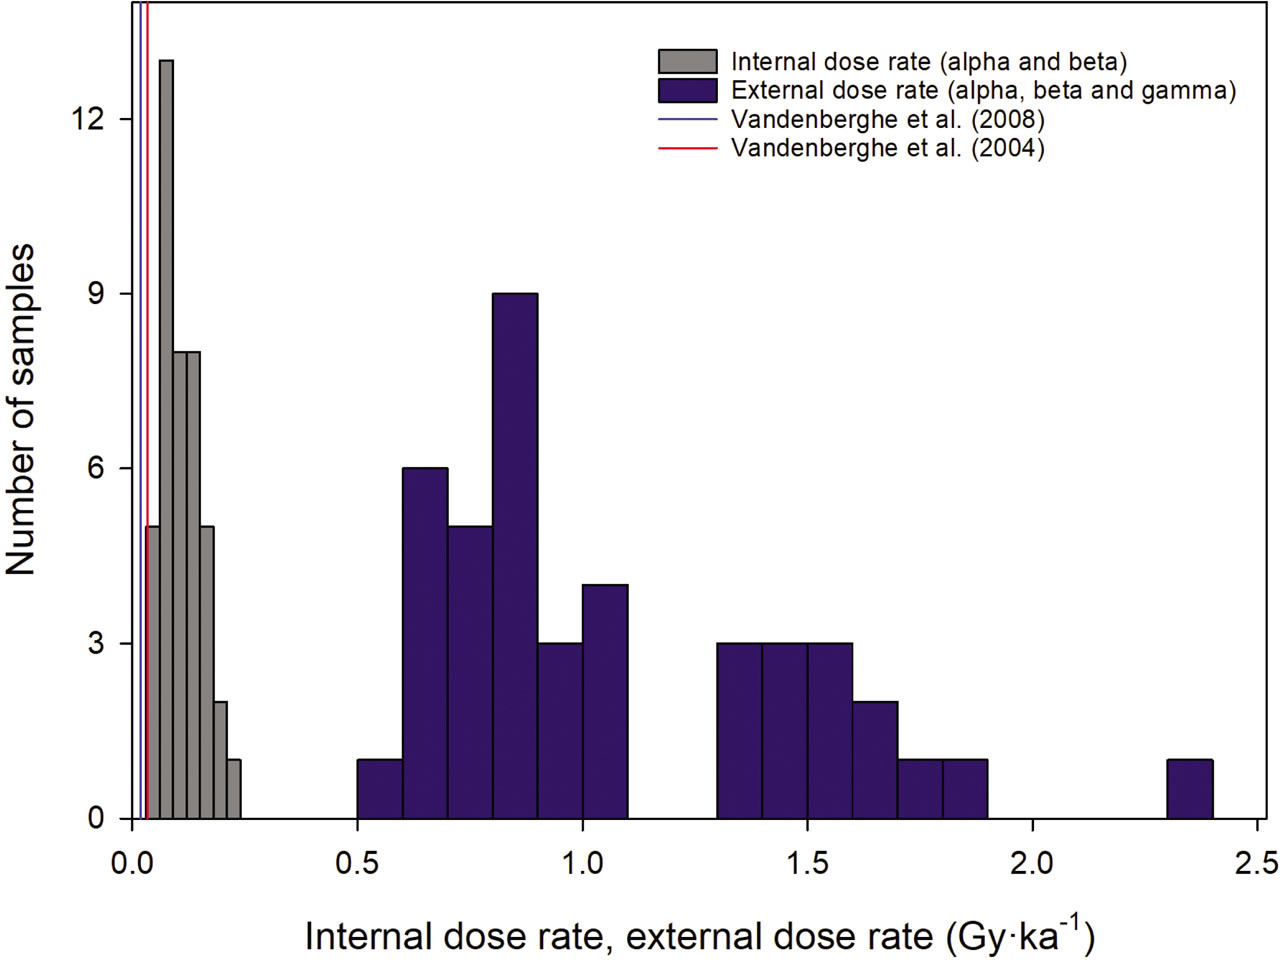
In the case of NAA one has to assume radioactive equilibrium, while μDose detects alpha and beta particles from the entire decay chain. Our data and those from other studies (Vandenberghe et al., 2004, 2008; Götze, 2009) are comparable, with no indication of radioactive disequilibrium. In addition, we do not report a statistically significant excess of beta counts over those that would be expected from uranium and thorium decay chains. Therefore, 40K was not considered as a significant dose rate contributor in our sand samples. The 40K estimates are consistent with those of Vandenberghe et al. (2004), who reported very low values of 1.06–3.38 Bq · kg−1.
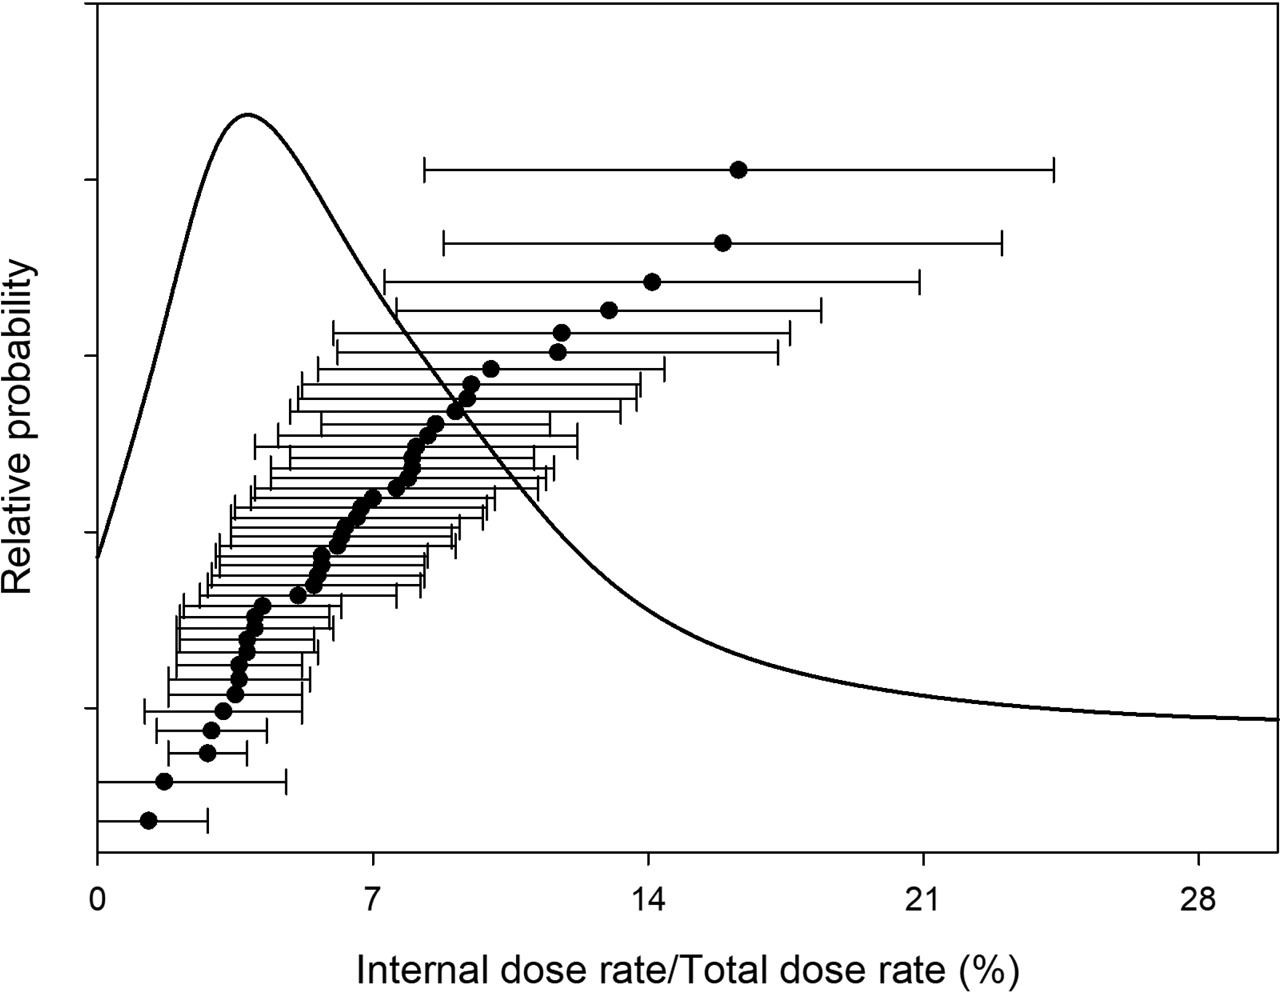
The internal dose rate, if unaccounted for, can have implications for the accuracy of dose rate determinations in low external dose contexts, but when working in higher dose environments, its significance decreases. For example, in Fig. 4 we plotted the distribution of the relative internal dose rate change. This can also be seen as apparent ageing if the internal dose rate is neglected. In our studies, on average, this equates to 7.5%. In addition, we report a few samples where this systematic error reached 20%.
Fig 4
Distribution of the quotient of internal and total dose rates (sum of the internal and external components) expressed as a percentage. Note that the relative dose rate change corresponds to the apparent ageing.
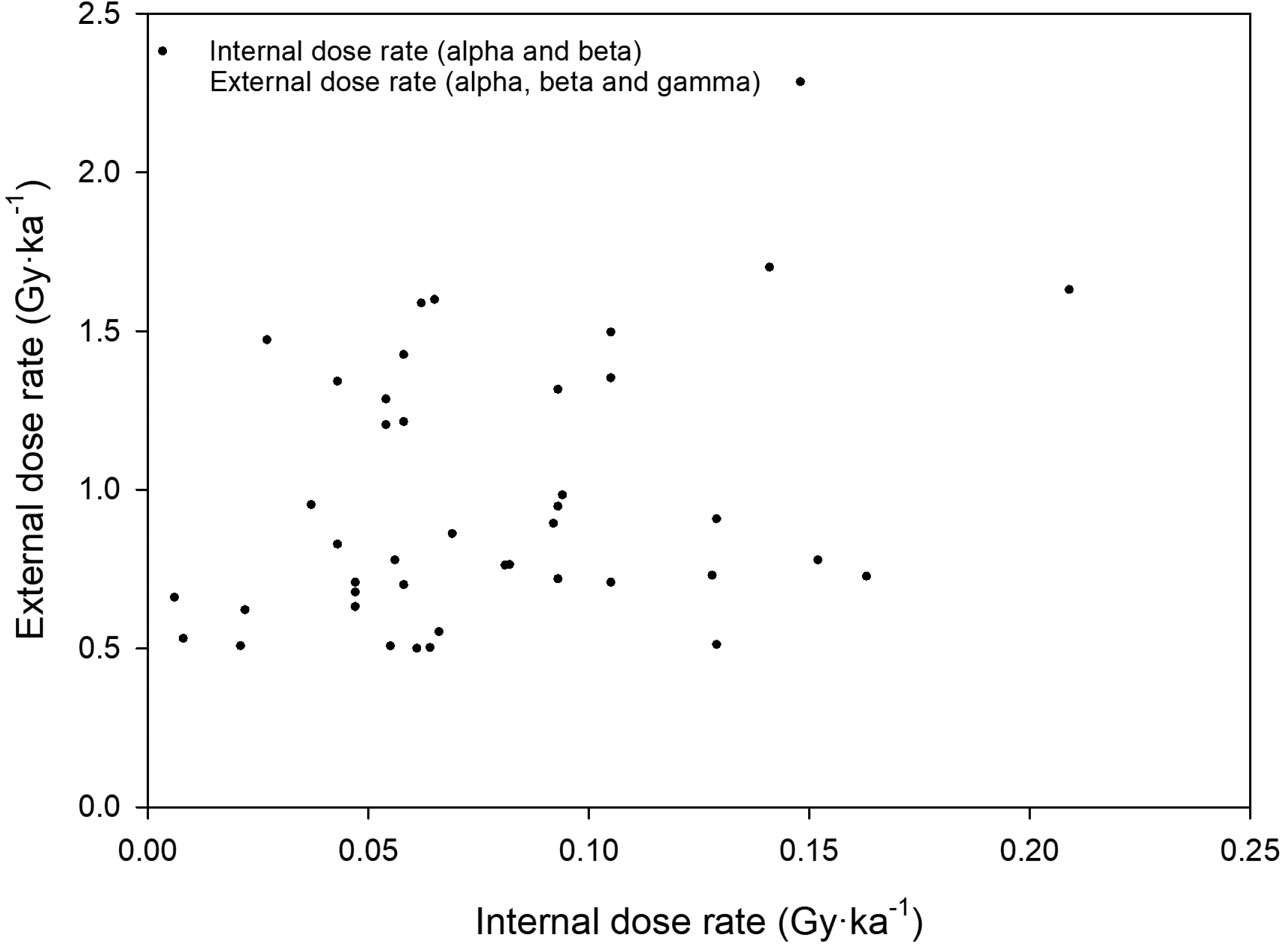
Usually, bulk sediment having significantly higher radioactivity than quartz itself should not exhibit signs of correlation between internal and external dose rates. In our profile, this might not be as obvious because we are dealing with a high quartz and low radioactivity content dune sediments. To investigate whether internal and external dose rates are correlated, in Fig. 5 we plotted external versus internal dose rates measured in our sand samples. We can see that there is no well-defined correlation. Therefore, low radioactivity samples might require internal dose rates measurements for every sample. The data show that there is no easy fix that could be applied to samples across the board. The results demonstrated in Table 1 confirm that there is no dependency between the internal and external dose rates. Even at the same site, internal dose rates can vary quite substantially; for example, at Żabinko the internal dose rate ranges from 0.058 Gy · ka−1 to 0.152 Gy · ka−1, and at Leszczyca from 0.058 Gy · ka−1 to 0.128 Gy · ka−1. This demonstrates our point that we may have to measure all internal dose rates, and for example, could not get away with measuring just one sample at each site and applying that value to all samples within a project.
Finally, cosmic rays significantly contribute to the total dose rate. In our study, on average 12% of the dose rate was induced by cosmic component, but for some samples, this contribution can be significantly higher.
. Conclusions
Our results show that for low radioactivity sediments, it may be necessary to assess the internal dose rate in pure quartz grains. This requires the labour-intensive extraction of quartz grains. Nonetheless, we would like to emphasise that it is not necessary to collect a larger amount of sample and special light conditions are not required. Additionally, we want to highlight that all our measurements were performed for geological samples; as regards heated/archaeological samples the internal dose rate measurement will be probably not feasible because the amount of sample is usually much smaller. Moreover, what is more important in the case of ceramics is that the external dose rates are higher, which results in a decrease in the relative importance of any internal component. The demonstrated findings clearly indicate and confirm that etched quartz grains contain radioactive isotopes, hence the assumption that the only source of radioactivity is radioisotopes from outside is erroneous.
The presented results show that the internal dose rate assessment can be a widely applicable crucial step in determining the age of the measured samples. Ignoring the internal alpha and internal beta components during the total dose rate assessment would have led to significant luminescence age overestimation. The internal dose rate to total dose rate ratio in our measurements often exceeds 10% (in one case reaching the unexpected value of 16%). We also demonstrated that we could flag up any relevance of the internal beta contribution, which has been largely overlooked in luminescence studies using sand-sized quartz (even more than the internal alpha contribution). In our study, the maximum value of the internal beta dose rate to the total dose rate is 3.8%.
The greatest ratio of internal dose rate to the total dose rate is noted for samples that have a low natural concentration of radionuclides, which translates to a low external dose rate (usually lower than 1 Gy · ka−1). This means that for these types of sediments, correction for internal dose rates should always be applied, otherwise the final dose rates will be underestimated, and the final results overestimated. It is possible that for other types of quartz in different geographic and geological settings, internal dose rates could be higher, and therefore further research and measurement are required to better characterize the internal dose rates of quartz. Given the variability observed in internal dose rates in this study, the arbitrary application of an assumed internal dose rate value is not appropriate, even for samples taken from the same site. Establishing the internal dose rate fixed correction for all types of sediments might not be possible, because even for similar dune samples, the internal to external dose rate measurements are characterised by a lack of correlation. Even if no allowance for internal radioactivity can be made by direct measurement, it should be added as a systematic source of uncertainty.
The presented results were obtained using the innovative μDose system, which due to the small amount of material needed, could be used in routine internal dose rate evaluations. The small sample size additionally widens the possible areas of application.