


Insulin inhibits endogenous glucose production (EGP) and stimulates glucose uptake in peripheral tissues. Hypothalamic insulin signaling is required for the inhibitory effects of insulin on EGP. We examined the contribution of central insulin signaling on circulating insulin–stimulated tissue-specific glucose uptake.
Tolbutamide, an inhibitor of ATP-sensitive K+ channels (KATP channels), or vehicle was infused into the lateral ventricle in the basal state and during hyperinsulinemic-euglycemic conditions in postabsorptive, chow-fed C57Bl/6J mice and in postabsorptive C57Bl/6J mice with diet-induced obesity. Whole-body glucose uptake was measured by d-[14C]glucose kinetics and tissue-specific glucose uptake by 2-deoxy-d-[3H]glucose uptake.
During clamp conditions, intracerebroventricular administration of tolbutamide impaired the ability of insulin to inhibit EGP by ∼20%. In addition, intracerebroventricular tolbutamide diminished insulin-stimulated glucose uptake in muscle (by ∼59%) but not in heart or adipose tissue. In contrast, in insulin-resistant mice with diet-induced obesity, intracerebroventricular tolbutamide did not alter the effects of insulin during clamp conditions on EGP or glucose uptake by muscle.
Insulin stimulates glucose uptake in muscle in part through effects via KATP channels in the central nervous system, in analogy with the inhibitory effects of insulin on EGP. High-fat diet–induced obesity abolished the central effects of insulin on liver and muscle. These observations stress the role of central insulin resistance in the pathophysiology of diet-induced insulin resistance.
In response to nutrients, insulin is rapidly released from pancreatic β-cells and decreases plasma glucose levels by inhibiting endogenous glucose production (EGP) and stimulating glucose transport into skeletal muscle, heart, and white adipose tissue (WAT). Intake of high-fat diets can lead to insulin resistance, which plays a primary pathophysiological role in the development of type 2 diabetes (1,2). Insulin resistance in the liver results in a decreased capacity of insulin to suppress EGP, whereas insulin resistance in peripheral tissues, including muscle, results in reduced insulin-mediated glucose uptake.
In addition to direct effects of insulin on peripheral tissues, insulin acts in the hypothalamus, where it exerts anorexigenic properties by stimulating proopiomelanocortin (POMC)/cocaine- and amphetamine-regulated transcript (CART) neurons and by inhibiting agouti-related peptide (AgRP)/neuropeptide Y (NPY) neurons (3–5). In fact, hypothalamic insulin signaling has appeared necessary for the inhibitory effect of insulin on EGP (6–8). Insulin activates ATP-sensitive K+ channels (KATP channels) in neurons of the hypothalamus, including POMC/CART- and AgRP/NPY-expressing neurons (9,10). Inhibition of these neuronal KATP channels by intracerebroventricular administration of sulfonylurea (either tolbutamide or glibenclamide) impairs the inhibitory effect of insulin on EGP (6). Conversely, activation of hypothalamic KATP channels enhances insulin-mediated inhibition of EGP (11).
Although the importance of this central action of insulin for the inhibition of EGP is now well established, the role of the central effects of insulin in glucose disposal is still unknown. Therefore, the aim of the current study was to determine the role of the central effect of insulin on tissue-specific insulin-stimulated glucose disposal in mice without or with diet-induced insulin resistance. To this end, we infused tolbutamide, an inhibitor of KATP channels, into the lateral ventricle of mice that were on a regular diet and quantified glucose disposal both in the basal state and during hyperinsulinemic-euglycemic conditions. We show that the central effects of insulin not only are required for inhibition of EGP but also enhance insulin-mediated glucose uptake in muscle. Furthermore, we show that these central effects of insulin on EGP and tissue-specific uptake of glucose are lost in mice with diet-induced obesity, which stresses the role of central insulin resistance in the pathophysiology of diet-induced insulin resistance.
RESEARCH DESIGN AND METHODS
Male C57Bl/6J mice (aged 15 weeks) were housed in a temperature-controlled room on a 12-h light-dark cycle. Animals had free access to water and diet (chow or a high-fat diet [45% of energy in fat derived from palm oil; Research Diet Services, Wijk bij Duurstede, the Netherlands]). Intracerebroventricular cannula implantations were performed as previously reported (12,13). All animal experiments were performed in accordance with the regulations of Dutch law on animal welfare, and the institutional ethics committee for animal procedures from Leiden University Medical Center approved the protocol.
Basal and insulin-stimulated glucose metabolism.
Postabsorptive (i.e., overnight fasted), body weight–matched male mice were anesthetized with 6.25 mg/kg acepromazine (Alfasan, Woerden, the Netherlands), 6.25 mg/kg midazolam (Roche, Mijdrecht, the Netherlands), and 0.31 mg/kg fentanyl (Janssen-Cilag, Tilburg, the Netherlands). Tissue-specific glucose uptake was determined in basal and hyperinsulinemic-euglycemic states in separate experiments (Fig. 1). Artificial cerebrospinal fluid (aCSF) or the KATP channel blocker tolbutamide, dissolved in 5% DMSO to a final concentration of 4.8 mmol/L in aCSF, was continuously infused at a rate of 2.5 μl/h i.c.v. using a Harvard infusion pump (6,14). Thirty minutes after the intracerebroventricular infusion of tolbutamide or vehicle was started, intravenous infusions were started. In the basal state study, d-[14C]glucose (0.3 μCi/kg/min; Amersham, Little Chalfont, U.K.) was continuously infused for 90 min. In the hyperinsulinemic-euglycemic clamp study, insulin (Actrapid; Novo Nordisk) was administered intravenously by primed (4.1 mU), continuous (6.8 mU/h) infusion to attain steady-state insulin levels together with d-[14C]glucose (0.3 μCi/kg/min; Amersham) for 90 min. This infusion rate of insulin was chosen based on previous dose-response studies of hyperinsulinemia, aimed at a fivefold increase in insulin levels that both inhibited EGP and stimulated glucose uptake (15). A variable intravenous infusion of a 12.5% d-glucose solution was used to maintain euglycemia as determined at 10-min intervals via tail bleeding (<3 μl, Accu-chek, Sensor Comfort; Roche Diagnostics, Mannheim, Germany). In a separate experiment, aCSF or the KATP channel activator diazoxide (dissolved in 5% DMSO to a final concentration of 2 μg/μl in aCSF) was continuously infused intracerebroventricularly in high fat–fed mice during hyperinsulinemic-euglycemic clamp. For assessment of basal and insulin-mediated glucose uptake in individual tissues, 2-deoxy-d-[3H]glucose (2-[3H]DG) (Amersham) was administered as a bolus (1 μCi) 30 min before the end of both experiments. In the last 20 min of both experiments, blood samples were taken at intervals of 10 min. Subsequently, the mice were killed and perfused with PBS, and organs were quickly harvested and snap-frozen in liquid nitrogen.
![FIG. 1. Schematic representation of the experimental procedures. A: Basal state. At t = 0 min, a continuous intracerebroventricular infusion of vehicle or tolbutamide was started and maintained throughout the entire experiment. At t = 30 min, a primed, continuous intravenous infusion of [14C]glucose was initiated and maintained for the remainder of the experiment. At t = 90 min, an intravenous bolus of 2-[3H]DG was administered. At t = 0, 100, 110, and 120 min, blood samples were obtained, and at t = 120 min the animals were killed and organs were harvested. B: Hyperinsulinemic-euglycemic state. At t = 0 min, a continuous intracerebroventricular infusion of vehicle or tolbutamide was started and maintained throughout the entire experiment. At t = 30 min, a hyperinsulinemic-euglycemic clamp was started by primed, continuous infusion of insulin together with [14C]glucose. A variable infusion of 12.5% glucose was used to maintain euglycemia. At t = 90 min, an intravenous bolus of 2-[3H]DG was administered. At t = 0, 100, 110, and 120 min, blood samples were obtained, and at t = 120 min the animals were killed and organs harvested.](https://ada.silverchair-cdn.com/ada/content_public/journal/diabetes/60/12/10.2337_db10-1100/3/m_3132fig1.jpeg?Expires=1716339274&Signature=mO4-m1HQNr4~IUftNDglTuJooA-XDGazQVuedQV~i3soTKsFcQeuDgnrF56sRQmZ2xn8DR1CUp~vNGH020pp8hNs5Eup96~e2ZzN1jinZrPzBnSYOOoPQvzAiFwOUA8aVpYI2MXe2dby224urnFVYmN1-6s1~msir0XR~2MuY~vbVTdcAim-P3eg8KLKi9wQYzdPjja9egfZtuYqbBzstmrQ3x~z963yDHEBbmBYvm-0xkGma4I1KaR~6Iw2vCWkG0NHd43P1X1mFcgxjwhKEcBPAq28SuDg2sJNcbcsJLSX-B-mJjJS6UuZUsycbI-8nGZbIboKk6~wc1z74a5mHA__&Key-Pair-Id=APKAIE5G5CRDK6RD3PGA)
Schematic representation of the experimental procedures. A: Basal state. At t = 0 min, a continuous intracerebroventricular infusion of vehicle or tolbutamide was started and maintained throughout the entire experiment. At t = 30 min, a primed, continuous intravenous infusion of [14C]glucose was initiated and maintained for the remainder of the experiment. At t = 90 min, an intravenous bolus of 2-[3H]DG was administered. At t = 0, 100, 110, and 120 min, blood samples were obtained, and at t = 120 min the animals were killed and organs were harvested. B: Hyperinsulinemic-euglycemic state. At t = 0 min, a continuous intracerebroventricular infusion of vehicle or tolbutamide was started and maintained throughout the entire experiment. At t = 30 min, a hyperinsulinemic-euglycemic clamp was started by primed, continuous infusion of insulin together with [14C]glucose. A variable infusion of 12.5% glucose was used to maintain euglycemia. At t = 90 min, an intravenous bolus of 2-[3H]DG was administered. At t = 0, 100, 110, and 120 min, blood samples were obtained, and at t = 120 min the animals were killed and organs harvested.
Schematic representation of the experimental procedures. A: Basal state. At t = 0 min, a continuous intracerebroventricular infusion of vehicle or tolbutamide was started and maintained throughout the entire experiment. At t = 30 min, a primed, continuous intravenous infusion of [14C]glucose was initiated and maintained for the remainder of the experiment. At t = 90 min, an intravenous bolus of 2-[3H]DG was administered. At t = 0, 100, 110, and 120 min, blood samples were obtained, and at t = 120 min the animals were killed and organs were harvested. B: Hyperinsulinemic-euglycemic state. At t = 0 min, a continuous intracerebroventricular infusion of vehicle or tolbutamide was started and maintained throughout the entire experiment. At t = 30 min, a hyperinsulinemic-euglycemic clamp was started by primed, continuous infusion of insulin together with [14C]glucose. A variable infusion of 12.5% glucose was used to maintain euglycemia. At t = 90 min, an intravenous bolus of 2-[3H]DG was administered. At t = 0, 100, 110, and 120 min, blood samples were obtained, and at t = 120 min the animals were killed and organs harvested.
Plasma analysis.
Blood samples were taken from the tail tip into chilled paraoxon-coated capillaries to prevent ex vivo lipolysis. The tubes were placed on ice and centrifuged at 4°C. Plasma levels of glucose and free fatty acids (FFAs) were determined using commercially available kits and standards according to the instructions of the manufacturer (Instruchemie, Delfzijl, the Netherlands). Plasma insulin levels were measured using a mouse-specific insulin ELISA kit (Crystal Chem, Downers Grove, IL). Total plasma [14C]glucose and [3H]glucose were determined in supernatant of 7.5 μl plasma after protein precipitation using 20% trichloroacetic acid and evaporation to eliminate tritiated water.
Tissue analysis.
For determination of tissue 2-[3H]DG uptake, homogenates of brain, heart, skeletal muscle (upper hind limb), and WAT (epigonadal, visceral, and subcutaneous) were boiled, and the supernatants were subjected to an ion-exchange column to separate 2-[3H]DG-6-phosphate (which is trapped within the organ and not phosphorylated) from 2-[3H]DG as previously described (16–18).
Calculations.
Turnover rates of glucose (micromoles per minute per kilogram) were calculated for the basal state and for the hyperinsulinemic-euglycemic state as the rate of tracer infusion (disintegrations per minute per minute) divided by plasma specific activities of [14C]glucose (disintegrations per minute per micromole). The ratio was corrected for body weight. EGP was calculated as the difference between the tracer-derived rate of glucose appearance and the glucose infusion rate (GIR).
Tissue-specific glucose uptake in brain, muscle, and WAT was calculated from tissue 2-[3H]DG content, corrected for plasma specific activity, and expressed as micromoles per gram of tissue.
Western blot analysis.
Whole hypothalami and skeletal muscles (upper hind limb) of mice receiving intracerebroventricular. aCSF in the basal state and the hyperinsulinemic-euglycemic state (n = 5) were homogenized by Ultra-Turrax (22.000 rpm; 2 × 5 s) in a 6:1 (vol/wt) ratio of ice-cold buffer containing the following: 50 mmol/L HEPES, pH 7.6, 50 mmol/L NaF, 50 mmol/L KCl, 5 mmol/L sodium pyrophosphate, 1 mmol/L EDTA, 1 mmol/L EGTA, 5 mmol/L β-glycogen phosphorylase, 1 mmol/L Na3Vo4, 1 mmol/L dithiothreitol, 1% Nonidet P-4040, and protease inhibitors cocktail (Complete; Roche). Homogenates were centrifuged (13,200 rpm; 15 min, 4°C), and the protein content of the supernatant was determined using a bicinchoninic acid protein assay kit (BCA Protein Assay Kit; Thermo Scientific Pierce Protein Research Products, Rockford, IL). Proteins (20–50 μg) were separated by 7–10% SDS-PAGE followed by transfer to a polyvinylidene fluoride transfer membrane. Membranes were blocked for 1 h at room temperature in Tris-buffered saline with Tween 20 buffer with 5% nonfat dry milk before an overnight incubation with phosphospecific or total antibodies (all from Cell Signaling Technology, Beverly, MA). Blots were then incubated with horseradish peroxidase–conjugated secondary antibodies for 1 h at room temperature. Bands were visualized by enhanced chemiluminescence and quantified using ImageJ (National Institutes of Health).
Statistical analysis.
Differences between groups were determined by Mann-Whitney U nonparametric tests for two independent samples. The criterion for significance was set at P < 0.05. All values shown represent means ± SEM.
RESULTS
Tolbutamide administration in postabsorptive, chow-fed mice
Plasma parameters and body weight.
The design of the infusion studies is shown in Fig. 1. In the basal and hyperinsulinemic states, body weight, plasma glucose, FFA, and insulin levels did not differ between intracerebroventricular tolbutamide- and vehicle-administered chow-fed mice (Table 1). As expected, in the hyperinsulinemic-euglycemic state insulin levels were fivefold higher, and FFA levels were ∼50% lower than the values in the basal state in both the tolbutamide- and vehicle-administered groups. In agreement with the rise in plasma insulin levels, hypothalamic insulin signaling was activated in the hyperinsulinemic-euglycemic state as phosphorylation of protein kinase B (PKB) on Thr308 (1.2 ± 0.1 vs. 1.0 ± 0.1, P = 0.08) and its downstream target PRAS40 on Thr246 (1.5 ± 0.1 vs. 1.0 ± 0.1, P < 0.05) was increased compared with the basal state (Supplementary Fig. 1).
Plasma parameters of chow-fed mice, in a basal or hyperinsulinemic-euglycemic state, as measured at the end of the experiments
| Basal state | Hyperinsulinemic-euglycemic state | |||
|---|---|---|---|---|
| Vehicle | Tolbutamide | Vehicle | Tolbutamide | |
| Body weight (g) | 23.5 ± 0.4 | 23.6 ± 0.4 | 22.8 ± 0.2 | 22.8 ± 0.5 |
| Glucose (mmol/L) | 5.2 ± 0.2 | 5.8 ± 0.4 | 6.2 ± 0.5 | 6.4 ± 0.5 |
| FFA (mmol/L) | 0.6 ± 0.1 | 0.6 ± 0.1 | 0.3 ± 0.1* | 0.3 ± 0.1* |
| Insulin (ng/mL) | 0.9 ± 0.1 | 1.0 ± 0.1 | 5.5 ± 0.4* | 4.9 ± 0.2* |
| Hematocrit (%) | 44.1 ± 0.7 | 44.3 ± 1.0 | 42.2 ± 0.6 | 42.5 ± 1.1 |
Data are means ± SEM for at least eight mice per group. Throughout the experiments, mice received intracerebroventricular infusion of vehicle or tolbutamide.
*P < 0.01, basal vs. hyperinsulinemic state.
GIR.
In the hyperinsulinemic-euglycemic clamp study, the GIR necessary to maintain euglycemia was significantly lower in tolbutamide-administered animals compared with that in vehicle-administered animals (average GIR 87 ± 6 vs. 104 ± 13 μmol/min/kg for the last 20 min of the experiment, P < 0.05 [Fig. 2A]) in the presence of similar glucose levels (average plasma glucose 5.4 ± 0.2 vs. 5.6 ± 0.1 mmol/L for the last 20 min of the experiment, nonsignificant [Fig. 2B]), indicating that intracerebroventricular tolbutamide decreased insulin sensitivity. The glucose specific activities measured at 10-min intervals in all experiments indicated the presence of steady-state conditions in all groups (Supplementary Table 1).
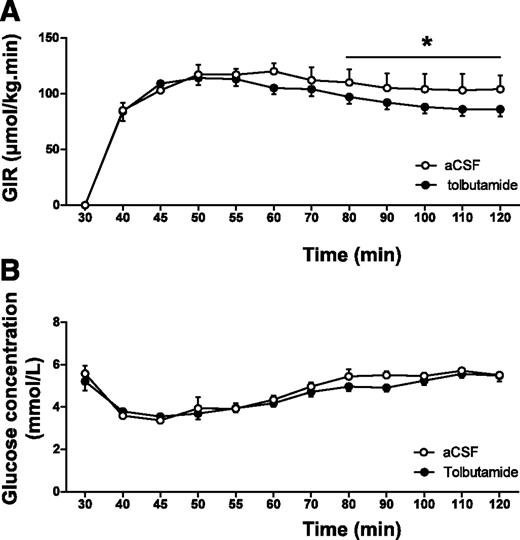
A and B: GIRs (A) and glucose concentrations (B) during hyperinsulinemic-euglycemic clamp in chow-fed mice. Throughout the experiment, mice received intracerebroventricular infusion of vehicle or tolbutamide. Values represent means ± SEM for at least eight mice per group. *P < 0.05, vehicle vs. tolbutamide.
A and B: GIRs (A) and glucose concentrations (B) during hyperinsulinemic-euglycemic clamp in chow-fed mice. Throughout the experiment, mice received intracerebroventricular infusion of vehicle or tolbutamide. Values represent means ± SEM for at least eight mice per group. *P < 0.05, vehicle vs. tolbutamide.
EGP and glucose disposal.
In the basal state, EGP, which equals glucose disposal, was not different between intracerebroventricular tolbutamide- and intracerebroventricularly vehicle-administered animals (36 ± 4 vs. 30 ± 2 μmol/kg/min, respectively, nonsignificant [Fig. 3A]). In the hyperinsulinemic-euglycemic state, EGP was significantly decreased compared with the basal state (1 ± 1 vs. 30 ± 2 μmol/kg/min, respectively, P < 0.01). Intracerebroventricular tolbutamide in the hyperinsulinemic state diminished the inhibitory effects of insulin on EGP (12 ± 4 vs. 1 ± 1 μmol/kg/min, P < 0.05).
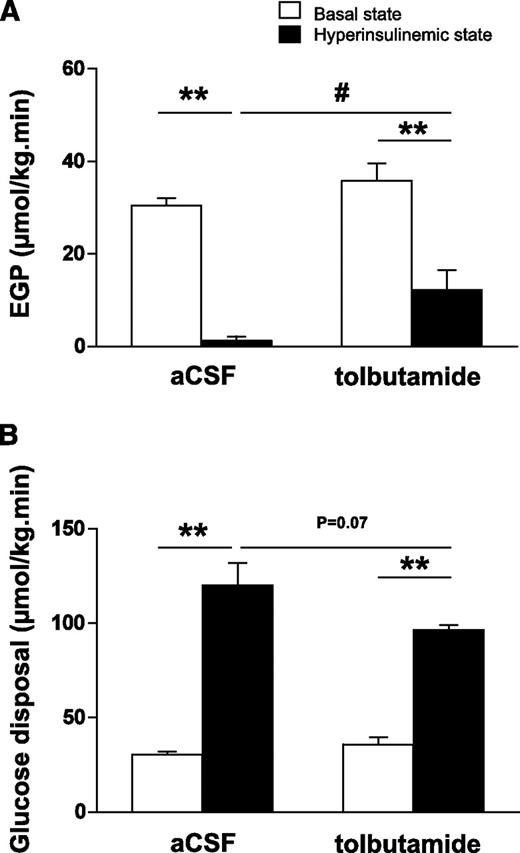
A and B: Rates of EGP (A) and glucose disposal (B) in the basal state or hyperinsulinemic-euglycemic state in chow-fed mice. Throughout the experiment, mice received intracerebroventricular infusion of vehicle or tolbutamide. Values represent means ± SEM for at least eight mice per group. **P < 0.01, basal vs. hyperinsulinemic state; #P < 0.05, hyperinsulinemic state: vehicle vs. tolbutamide.
A and B: Rates of EGP (A) and glucose disposal (B) in the basal state or hyperinsulinemic-euglycemic state in chow-fed mice. Throughout the experiment, mice received intracerebroventricular infusion of vehicle or tolbutamide. Values represent means ± SEM for at least eight mice per group. **P < 0.01, basal vs. hyperinsulinemic state; #P < 0.05, hyperinsulinemic state: vehicle vs. tolbutamide.
Glucose disposal was increased by ∼300% in the hyperinsulinemic-euglycemic state compared with the basal state (120 ± 12 vs. 30 ± 2 μmol/kg/min, respectively, P < 0.01 [Fig. 3B]), whereas intracerebroventricular tolbutamide in the hyperinsulinemic state tended to reduce glucose disposal (97 ± 3 vs. 120 ± 12 μmol/kg/min, P = 0.07).
Tissue-specific glucose uptake.
In the basal and hyperinsulinemic-euglycemic states, 2-[3H]DG uptake was measured in brain, muscle (cardiac and skeletal), and WAT (epigonadal, subcutaneous, and visceral fat) (Fig. 4). In brain, 2-[3H]DG uptake did not differ between the basal and the hyperinsulinemic states (12 ± 2 vs. 15 ± 4 μmol/g tissue, respectively, nonsignificant) and was not affected by intracerebroventricular tolbutamide (11 ± 1 vs. 14 ± 1 μmol/g tissue for the basal and hyperinsulinemic states, respectively, nonsignificant). In heart, insulin increased 2-[3H]DG uptake sixfold in the hyperinsulinemic state compared with the rate of uptake measured in the basal state (12 ± 1 vs. 2 ± 1 μmol/g tissue, respectively, P < 0.05), but this increase was not affected by intracerebroventricular tolbutamide. In muscle, insulin increased 2-[3H]DG uptake considerably in the hyperinsulinemic state compared with the basal state (11 ± 3 vs. 1 ± 1 μmol/g tissue, respectively, P < 0.05). Remarkably, intracerebroventricular tolbutamide inhibited the insulin-mediated increase in 2-[3H]DG uptake by muscle by ∼59% (5 ± 1 vs. 11 ± 3 μmol/g tissue, P < 0.05). Phosphorylation of PKB on Ser473 (14 ± 1 vs. 14 ± 1, nonsignificant) and Thr308 (8 ± 1 vs. 8 ± 1, nonsignificant) and its downstream target PRAS40 on Thr246 (14 ± 1 vs. 12 ± 1, nonsignificant) was not different between intracerebroventricular vehicle- and intracerebroventricular tolbutamide-infused mice in hyperinsulinemic conditions (Supplementary Fig. 2). In all fat pads, insulin stimulated 2-[3H]DG uptake in the hyperinsulinemic state compared with the basal state, but this increase was not affected by intracerebroventricular tolbutamide.

Tissue-specific glucose uptake in the basal state or hyperinsulinemic-euglycemic state in chow-fed mice. Throughout the experiment, mice received intracerebroventricular infusion of vehicle or tolbutamide. A: Brain. B: Heart. C: Muscle. D: Epigonadal fat. E: Subcutaneous fat. F: Visceral fat. Values represent means ± SEM for at least seven mice per group. *P < 0.05, basal vs. hyperinsulinemic state; #P < 0.05, hyperinsulinemic state: vehicle vs. tolbutamide.
Tissue-specific glucose uptake in the basal state or hyperinsulinemic-euglycemic state in chow-fed mice. Throughout the experiment, mice received intracerebroventricular infusion of vehicle or tolbutamide. A: Brain. B: Heart. C: Muscle. D: Epigonadal fat. E: Subcutaneous fat. F: Visceral fat. Values represent means ± SEM for at least seven mice per group. *P < 0.05, basal vs. hyperinsulinemic state; #P < 0.05, hyperinsulinemic state: vehicle vs. tolbutamide.
Tolbutamide administration in postabsorptive mice with diet-induced obesity
Plasma parameters and body weight.
Since all parameters in the basal state were not different between intracerebroventricular tolbutamide- and intracerebroventricularly vehicle-administered animals in chow-fed conditions, we assessed the effects of intracerebroventricular tolbutamide in high fat–fed mice only in hyperinsulinemic-euglycemic clamp conditions. Body weight of the mice with diet-induced obesity was markedly higher compared with that of chow-fed mice (37 ± 1 vs. 23 ± 1 g, respectively, P < 0.01 [Table 2]). Plasma glucose and hematocrit levels were similar in basal and hyperinsulinemic conditions. In the hyperinsulinemic-euglycemic state, insulin levels were fivefold higher than those in the basal state, resulting in a decrease of ∼50% in FFA levels. There were no differences observed in body weight, plasma glucose, FFA, insulin, or hematocrit levels between intracerebroventricular tolbutamide- and intracerebroventricularly vehicle-administered animals in the hyperinsulinemic-euglycemic state.
Plasma parameters of mice with diet-induced obesity, in a basal or hyperinsulinemic-euglycemic state, as measured at the end of the experiments
| Basal state: vehicle | Hyperinsulinemic-euglycemic state | ||
|---|---|---|---|
| Vehicle | Tolbutamide | ||
| Body weight (g) | 36.4 ± 0.8 | 37.6 ± 1.5 | 37.4 ± 0.7 |
| Glucose (mmol/L) | 5.1 ± 0.4 | 5.8 ± 0.4 | 6.2 ± 0.3 |
| FFA (mmol/L) | 0.7 ± 0.1 | 0.3 ± 0.1* | 0.3 ± 0.1* |
| Insulin (ng/mL) | 1.4 ± 0.4 | 7.5 ± 0.5* | 7.9 ± 0.6* |
| Hematocrit (%) | 44.3 ± 0.6 | 42.2 ± 1.0 | 42.4 ± 0.8 |
Data are means ± SEM for at least six mice per group. Throughout the experiments, mice received intracerebroventricular infusion of vehicle or tolbutamide.
*P < 0.01 basal vs. hyperinsulinemic state.
EGP and glucose disposal.
The GIR necessary to maintain euglycemia was not different between tolbutamide- and vehicle-administered animals (Supplementary Fig. 3). Plasma glucose specific activities obtained during the last 20 min of the experiments indicated the presence of steady-state conditions in all groups (Supplementary Table 2).
In the hyperinsulinemic-euglycemic state, insulin decreased EGP compared with the basal state by ∼74% (6 ± 3 vs. 23 ± 2 μmol/kg/min, respectively, P < 0.01 [Fig. 5A]), but surprisingly, intracerebroventricular tolbutamide did not attenuate this effect of insulin in these mice with diet-induced obesity (intracerebroventricular tolbutamide- vs. intracerebroventricularly vehicle-administered animals: 10.0 ± 4 vs. 6.3 ± 3 μmol/kg/min, nonsignificant).

Rates of EGP (A) and glucose disposal (B) in the basal state or hyperinsulinemic-euglycemic state in mice with diet-induced obesity. Throughout the experiment, mice received an intracerebroventricular infusion of vehicle (□ and ■) or tolbutamide (▨). Values represent means ± SEM for at least seven mice per group. **P < 0.01, basal vs. hyperinsulinemic state.
Rates of EGP (A) and glucose disposal (B) in the basal state or hyperinsulinemic-euglycemic state in mice with diet-induced obesity. Throughout the experiment, mice received an intracerebroventricular infusion of vehicle (□ and ■) or tolbutamide (▨). Values represent means ± SEM for at least seven mice per group. **P < 0.01, basal vs. hyperinsulinemic state.
In the hyperinsulinemic-euglycemic state, insulin increased glucose disposal only by ∼161% compared with the basal state (60 ± 5 vs. 23 ± 2 μmol/kg/min, respectively, P < 0.01 [Fig. 5B]). However, this effect of insulin was not affected by intracerebroventricular tolbutamide (intracerebroventricular tolbutamide- vs. vehicle-administered animals: 62 ± 6 vs. 60 ± 5 μmol/kg/min, nonsignificant).
Comparison of the data from this experiment with those from the previously mentioned chow-fed experiments indicated that the obese mice were considerably insulin-resistant. Muscle glucose uptake under hyperinsulinemic-euglycemic conditions in high fat–fed mice was significantly lower compared with that in chow-fed mice (7.9 ± 1.1 vs. 10.6 ± 2.6 μmol/kg/min, respectively, P < 0.05). In addition, glucose disposal rate was lower (60.2 ± 4.9 vs. 120.1 ± 11.7 μmol/kg/min, P < 0.05) and EGP was higher (6.4 ± 2.8 vs. 1.2 ± 1.0 μmol/kg/min, P < 0.05), indicating both hepatic and peripheral insulin resistance in the mice with diet-induced obesity.
Tissue-specific glucose uptake.
In mice with diet-induced obesity, we measured tissue-specific 2-[3H]DG uptake in brain, muscle (cardiac and skeletal), and WAT (epigonadal, subcutaneous, and visceral fat) in the basal state and in the hyperinsulinemic-euglycemic state (Fig. 6). In muscle, insulin stimulated 2-[3H]DG uptake compared with the basal state (8 ± 1 vs. 2 ± 1 μmol/g tissue, respectively, P < 0.05). In contrast with results in chow-fed mice, there were no effects of intracerebroventricular tolbutamide on insulin-mediated muscle glucose uptake in mice with diet-induced obesity. In accordance with the observation in chow-fed mice, insulin increased 2-[3H]DG uptake in the hyperinsulinemic state compared with the basal state in heart and WAT but not in brain, whereas intracerebroventricular tolbutamide did not affect 2-[3H]DG uptake in any of these organs.

Tissue-specific glucose uptake in the basal state or hyperinsulinemic-euglycemic state in mice with diet-induced obesity. Throughout the experiment, mice received intracerebroventricular infusion of vehicle (□ and ■) or tolbutamide (▨). A: Brain. B: Heart. C: Muscle. D: Epigonadal fat. E: Subcutaneous fat. F: Visceral fat. Values represent means ± SEM for at least seven mice per group. *P < 0.05, basal vs. hyperinsulinemic state.
Tissue-specific glucose uptake in the basal state or hyperinsulinemic-euglycemic state in mice with diet-induced obesity. Throughout the experiment, mice received intracerebroventricular infusion of vehicle (□ and ■) or tolbutamide (▨). A: Brain. B: Heart. C: Muscle. D: Epigonadal fat. E: Subcutaneous fat. F: Visceral fat. Values represent means ± SEM for at least seven mice per group. *P < 0.05, basal vs. hyperinsulinemic state.
Intracerebroventricular diazoxide administration in postabsorptive mice with diet-induced obesity.
In high fat–fed mice, we assessed the effects of intracerebroventricular diazoxide, a KATP channel activator, on insulin-stimulated muscle glucose uptake (Supplementary Table 3). There were no differences observed in body weight or plasma glucose between intracerebroventricular diazoxide- and vehicle-administered animals. The GIR necessary to maintain euglycemia, glucose disposal, and 2-[3H]DG uptake by muscle was not different between intracerebroventricular diazoxide- and vehicle-administered animals.
DISCUSSION
This study addressed the effect of central antagonism of insulin signaling on tissue-specific glucose uptake in normal weight mice and in mice with diet-induced obesity. Inhibition of the central action of insulin by intracerebroventricular tolbutamide, a KATP channel blocker, decreased the inhibitory effects of insulin on EGP as well as the insulin-stimulated muscle glucose uptake in chow-fed mice. In contrast, in mice with diet-induced obesity, the effects of insulin on EGP and muscle glucose uptake were not affected by intracerebroventricular tolbutamide. Collectively, these data indicate that the central effects of insulin are required for inhibition of not only EGP but muscle glucose uptake as well. In addition, these data indicate that these central effects of insulin on EGP and muscle glucose uptake are absent after 12 weeks of high-fat feeding.
We assessed insulin-mediated effects on EGP and glucose disposal with hyperinsulinemic-euglycemic clamp studies designed to increase plasma insulin concentrations by approximately fivefold above basal levels. This increase resulted in complete inhibition of EGP and a fourfold stimulation of glucose disposal. In complete accordance with the results of Obici et al. (6), intracerebroventricular tolbutamide blunted the effect of hyperinsulinemia on EGP by ∼20%. Therefore, this observation confirms that insulin inhibits EGP in part via its action in the central nervous system (CNS). In addition, our results indicate that the central effects of insulin contribute to the stimulatory effects of insulin on muscle glucose uptake, since this effect of insulin was in part inhibited (∼59%) by intracerebroventricular tolbutamide. This inhibition of muscle glucose uptake coincided with a trend in decreased whole-body glucose disposal (∼20%, P = 0.07), which did not reach statistical significance, probably as a result of the limited size of the mouse groups.
The current study indicates that intracerebroventricular tolbutamide decreased insulin-stimulated muscle glucose uptake in chow-fed mice, not by decreasing insulin signaling in skeletal muscle (given that phosphorylation of PKB and PRAS40 was unaffected by intracerebroventricular tolbutamide) but through other indirect effects of insulin exerted via the CNS. A role of central insulin signaling in muscle glucose uptake has been suggested in a previous study on cerebral control of muscle glucose uptake (19). In that study, intracerebroventricular insulin increased glucose storage in muscle as glycogen. When this is considered together with the results obtained in our study, a concept emerges of an insulin-dependent central pathway targeted at skeletal muscle. NPY or AgRP (both given intracerebroventricularly) did not stimulate muscle glucose uptake (20). Chronic (7-day) intracerebroventricular infusion of α-melanocyte-stimulating hormone, a POMC derivative, enhanced insulin-stimulated peripheral glucose uptake, although this effect could not be reproduced in an acute setting (21,22). However, intracerebroventricular infusion of melanotan II, an MC3/4 agonist, enhanced insulin-stimulated muscle glucose uptake (23,24). Therefore, we hypothesize that POMC/CART neurons are potential mediators of the central effect of insulin on muscle glucose uptake.
Previous studies focusing on the role of central KATP channels in glucose metabolism could not show an effect on glucose disposal (6,11). There are some methodological differences between the studies, including insulin levels and duration of fasting. In previous experiments, we carefully characterized insulin dose-response characteristics on EGP versus glucose disposal in C57Bl/6J mice (15). The data obtained in this dose-finding study indicate that increased insulin levels up to three times the basal levels inhibit EGP but do not stimulate glucose disposal. Therefore, in the current study, we aimed at fivefold increased insulin levels during the clamp compared with the basal levels and with two- to threefold levels in previous studies (6,11). Using these insulin levels, we were capable of not only reproducing the central effects of insulin on EGP as reported by Obici et al. (6) but also of documenting central effects of insulin on muscle glucose uptake. Therefore, we speculate that the discrepancy in the effects of central KATP channel modulation on insulin-mediated glucose uptake during hyperinsulinemia between our study and previous studies is explained by the higher insulin levels in our study. Furthermore, Obici et al. (6) studied rats that had fasted for 6 h and did not find an inhibition of glucose disposal rate by intracerebroventricular administration of tolbutamide—in contrast with our observations in mice fasted overnight. In a previous study, we documented that 16 h of (overnight) fasting increases muscle insulin sensitivity compared with a shorter duration of fasting (25). Therefore, differences between the duration of fasting may be involved for explaining the differential effects of intracerebroventricular tolbutamide on insulin-stimulated glucose uptake between both studies. Nonetheless, this does not invalidate our conclusions, since the duration of fast was identical in all experiments of our study.
Glucose utilization in skeletal muscle can be stimulated by sympathetic nervous system (SNS) activation, and intracerebroventricular insulin in rats increases SNS activity to the hind limb (26). Therefore, the observed effect on insulin-mediated glucose uptake in muscle after central KATP channel inhibition could be the result of reduced insulin-induced activation of the SNS toward muscle. Since the stimulation of muscle glucose uptake by α-adrenergic stimulation involves 5′-AMP-activated protein kinase (AMPK), we measured AMPKα phosphorylation in muscle (27). However, intracerebroventricular infusion of insulin or KATP channel inhibition under hyperinsulinemic conditions did not affect activity of AMPK in muscle (Supplementary Fig. 4). Apparently, the stimulation of muscle glucose uptake by central insulin effects is independent of AMPK activation in muscle. At present, the involvement of autonomic pathways in mediating the central effects of insulin on muscle glucose uptake remains unclear.
Insulin stimulated glucose uptake in heart and WAT. It is noteworthy that this effect of insulin was greater in visceral fat compared with the other fat compartments, in accordance with previous observations (28–30). The insulin-stimulated glucose uptake by heart and WAT was independent of central KATP channel activation, since intracerebroventricular tolbutamide did not affect tissue-specific glucose uptake in these tissues.
We also assessed the effects of high-fat diet on the central effects of insulin on EGP and tissue-specific glucose uptake. The study was designed for the mice to develop obesity in combination with partial, rather than complete, insulin resistance, and as a result, effects of central insulin antagonism in these mice with diet-induced obesity could still be obtained. Indeed, the high-fat diet caused partial insulin resistance, since insulin was still able, although to a lesser extent, to inhibit EGP and stimulate glucose disposal. The high-fat diet abolished the inhibitory effect of intracerebroventricular tolbutamide on insulin-mediated inhibition of EGP. Furthermore, the inhibitory effect of intracerebroventricular administration of tolbutamide on insulin-stimulated glucose uptake by skeletal muscle was abolished. Our in vivo observations in mice with diet-induced obesity extend the in vitro observations by Spanswick et al. (10), showing that physiological levels of insulin activate KATP channels in glucose-responsive neurons of lean but not obese rats, suggesting that KATP channels are already inhibited in the insulin-resistant state (31–33). Moreover, stimulation of KATP channels by intracerebroventricular diazoxide did not improve muscle glucose uptake under hyperinsulinemic-euglycemic clamp conditions in insulin-resistant mice with diet-induced obesity. The absence of effects of intracerebroventricular tolbutamide in mice with diet-induced obesity might also involve reduced insulin transport across the blood-brain barrier (34). Although the precise mechanism remains to be elucidated, the current study indicates that high-fat diet decreases the central effects of insulin on both EGP and muscle glucose uptake, which may contribute to the pathophysiology of diet-induced insulin resistance. High-fat feeding strongly reduced insulin-stimulated glucose disposal, indicating peripheral insulin resistance. It is noteworthy that in quantitative terms, insulin-stimulated muscle glucose uptake in chow-fed conditions during intracerebroventricular tolbutamide infusion was not different from muscle glucose uptake during high-fat conditions (5.2 ± 0.6 vs. 7.1 ± 1.0 μmol/g tissue, respectively, nonsignificant). This remarkable observation indicates that muscle-specific insulin resistance was present for the centrally mediated effects of insulin rather than for the direct effects of insulin on muscle, at least within the constraints of our high-fat diet mouse model.
Recently, methodological issues have been raised concerning the application of the hyperinsulinemic-euglycemic clamp method in mice (35). To support the validity of our experimental procedures, we documented that we reached steady-state conditions with respect to GIR, plasma glucose concentrations, and isotopes; isotopes enabled reliable calculations using steady-state comparisons. Another issue that has been raised is that the mice may be subject to serious hemodilution during the clamps. Our data indicate that hemodilution hardly occurred at the end of the clamps in our mice, given that hematocrit levels remained similar. Furthermore, our clamp procedure was performed in anesthetized mice. However, since all groups received identical sedation, the differences between groups cannot be related to sedation.
Recently, we also documented central effects of insulin on fatty acid uptake (13). Those studies show that intracerebroventricular tolbutamide administration in hyperinsulinemic-euglycemic clamp conditions, identical to the current conditions, decreases insulin-stimulated retention of fatty acids, specifically in WAT. Therefore, the idea emerges that regulation of fatty acids and glucose uptake by modulation of central insulin signaling is tissue-specific. In addition, both studies indicate that these effects are mediated, at least in part, by KATP channel activation in the CNS and are absent after high-fat feeding.
We conclude that insulin signaling in the brain substantially contributes not only to the inhibitory effect of insulin on glucose production but also to the insulin-stimulated glucose uptake by muscle. In mice with diet-induced obesity, these central effects of insulin on glucose homeostasis are lost. These observations stress the role of central insulin signaling in normal physiological conditions and central insulin resistance in the pathophysiology of diet-induced insulin resistance.
ACKNOWLEDGMENTS
This work was supported by grants from TI Pharma (TIP Project T2-105 to L.M.H. and J.A.R.), ZonMW (clinical fellowship 90700195 to N.R.B.), the Netherlands Heart Foundation (NHS Project 2007B81 to P.C.N.R. and J.A.R.), and the Dutch Diabetes Research Foundation (DFN Project 2007.00.010 to P.C.N.R. and J.A.R.). P.C.N.R. is an Established Investigator of the Netherlands Heart Foundation (NHS2009T038).
No potential conflicts of interest relevant to this article were reported.
C.P.C. designed and performed the experiments and wrote the manuscript. N.R.B. performed the experiments and edited the manuscript. J.J.G. performed the experiments. B.G. performed the molecular analyses. P.C.N.R. contributed to the design of the experiments and the editing of the manuscript. L.M.H. contributed to the design of the experiments and the editing of the manuscript. J.A.R. designed and supervised the experiments and wrote the manuscript with C.P.C.
Parts of this study were presented in abstract form at the 70th Scientific Sessions of the American Diabetes Association, Orlando, Florida, 25–29 June 2010.
