Experimental Solid Angle of the X-ray Perimeter Array Detector (XPAD) on the Argonne PicoProbe Analytical Electron Microscope
- Abstract number
- 246
- Presentation Form
- Poster
- DOI
- 10.22443/rms.mmc2021.246
- Corresponding Email
- [email protected]
- Session
- Poster Session 2
- Authors
- Nestor J. Zaluzec (1)
- Affiliations
-
1. Photon Science Directorate, Argonne National Laboratory
- Keywords
AEM, TEM, STEM, Microanalysis, XEDS, EDS, Spectroscopy, SDD, SiLi, X-ray, Quantitation,
- Abstract text
For the last few decades research efforts at Argonne have been focused upon the optimization of hardware and software for x-ray energy dispersive spectroscopy (XEDS) to improve the performance of microanalytical sensitivity in the Analytical Electron Microscope [1-3]. The Argonne X-ray Perimeter Array Detector (XPAD) is our latest innovation and is interfaced to the prototype ANL 30-300 kV PicoProbe Analytical Electron Microscope engineered by ThermoFisher Scientific Instruments [4]. This unique XEDS configuration consists of a linear array of detectors which judiciously circumscribes the specimen. It’s implementation is designed to maximize the collection solid angle and minimizes the penumbra and system peak effects of the instrument [5].
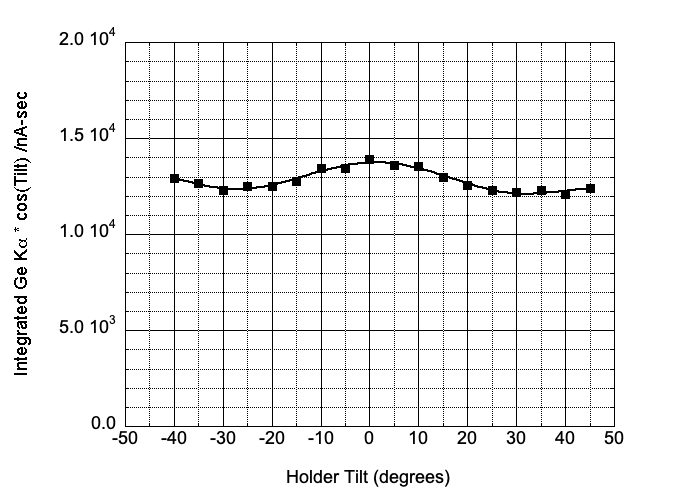
To measure and qualify the performance of this system we use a commercially available test specimen of nanocrystalline Ge on microporous SiNx [6]. This uniformly thick 20 nm Ge film on top of 20 nm of SiNx has an regular array of two micron holes which also facilitates accurate measurement of the relevant parameters needed to assess the functionality of the microanalytical system. In figure 1 is plotted the penumbra optimized performance of this detector measured using the Ge/SiNx test specimen at 200 kV for a holder tilt range of + 45 degrees. The experimental variation in the angle corrected intensity is ~ 10%. Non-optimized commercial holders will nearly always have greater variation.
Figure 1. ) Experimental Penumbra Profile illustrating 10% variation due to geometrical shadowing of the detector as a function of primary holder tilt. We note that the individual detectors of the array will show greater variation, however, the symmetry of the configuration mitigates this variation when all detectors are summed.
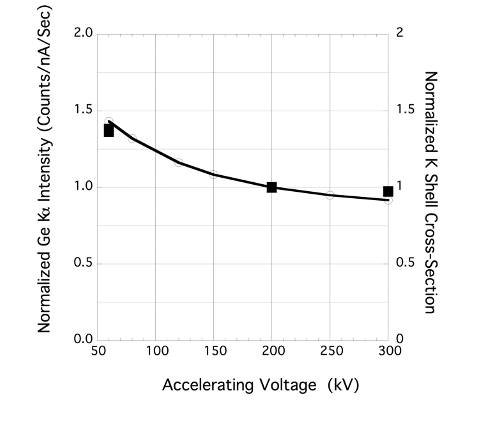
The modeled geometrical solid angle of the XPAD was calculated to be 4.47 sR. In order to confirm this we have conducted experimental measurements of the solid angle by quantitatively measuring the x-ray emission from the Ge/SiNx test specimen. Using the microporous holes in the test specimen we are able to measure the incident beam current using an in-situ Faraday cup without removing the specimen and only translating the specimen by ~ 1 micron. Figure 2 compares the normalized intensity variation for the Ge Ka emission with theoretical ionization cross-section. As expected the beam normalized intensity increases with decreasing accelerating voltage and follows the expected dependence of the relativistically corrected cross-section. A nominal 40% increase from 300 to 60 kV has been confirmed. [7-8]
Figure 2, Comparison of variation in cross-section with x-ray emission as a function of accelerating voltage (values normalized at 200 kV) . Solid line is the model, squares are experimental values.
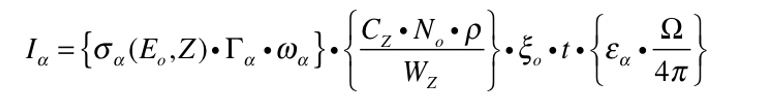
Using our custom/optimized specimen holder an experimental measurement of the absolute intensity as a function of beam current was performed to measure the solid angle to compare with the design. To do such we utilize the relationship shown in following equation.
here Iα = measured x-ray intensity (Integral counts) per unit area, σα(Eo, Z) = αth-shell ionization cross section, Eo = incident electron energy, ωa = ath-shell fluorescence yield, Γα = αth-shell radiative partition function, Wz and CZ the atomic weight and composition, Z = atomic number, No = Avogadro’s number, ρ = local specimen density, ξo = the incident electron beam current, t = acquisition (live) time, εα = the detector energy efficiency and Ωα = the detector collection solid angle. Of all these parameters, the accuracy in our measurement of Ω is most affected by the value of the least known parameter, namely the K-shell ionization cross-section [7-8].
In table 1 we list the range of values of Ω based upon our experimental measurements conducted at 60, 200 and 300 kV. Ideally all the solid angle measurements in this table would be identical, however, owing to the uncertainity in the values of σα (Eo, Z) this is not achieved. Ω is thus evaluated for two different K-shell cross-section models to give a realistic estimate of the uncertainties. In table 1, it is clear that the experimental values for Ω are well within the range expected by the design parameters for XPAD of 4.47 sR.
Accelerating Voltage (kV)
Average Ge Ka Intensity
(Integrated counts/nA-sec)
Theoretical Cross-section (Barns)
Experimental
Ω (sR)
60
21370
232.2-261.6
4.28-3.80
200
15570
157.8-182.7
4.59-3.97
300
15160
144.0-167.5
4.90-4.21
Table 1: Experimentally determined solid angle for XPAD on the ANL PicoProbe. The modeled solid angle was 4.47 sR and is within the errors of the cross-section models used herein.
Further work is in progress to assess the functionality of XPAD.
This work was supported by the Photon Science Directorate and Laboratory Directed Research and Development (LDRD) funding from Argonne National Laboratory, provided by the Director, as well as the Office of Science, of the U.S. Department of Energy under Contract No. DE-AC02-06CH11357. It was also supported in part by CRADA #01300701 between Argonne National Laboratory and ThermoFisher Scientific Instruments
- References
[1] Zaluzec N.J.; (2004), “XEDS Systems for the Next Generation Analytical Electron Microscope”,Micro. Microanal., 10, S2, 122
[2] Zaluzec, N.J. (2009). “Innovative instrumentation for analysis of nanoparticles: The π steradian detector”. MicroscopyToday 17(4), 56.
[3] Argonne National Laboratory. (2010). High collection efficiency X-ray spectrometer system with integrated electron beam stop, electron detector and X-ray detector for use on electron-optical beam lines and microscopes, US Patent 8,314,386,
[4] Zaluzec, N.J. Microscopy & Microanalysis (2021), Pittsburg Pa, August 2021
[5] Zaluzec N.J., Wen J., Wang J. , Miller D.J.; (2016) “ Quantitative Measurements of the Penumbra of XEDS Systems in an AEM “ Microsc. Microanal. 22 (Suppl 3), 278-
[6] http://www.temwindows.com/category_s/55.htm
[7] Zaluzec N.J. , (1984) “K and L Shell Cross Sections for X-ray Microanalysis in an AEM”, Analytical Electron Microscopy, ed. D. Williams, San Francisco Press, 279-284,
[8] Llovet, X, Powell, C.J., Salvat, F. and Joblonski A, (2014) “Cross Sections for Inner-Shell Ionization by Electron Impact, Journal of Physical and Chemical Reference Data 43, 13102