Abstract
Surface acoustic sensor technology plays a crucial role in numerous mechatronic systems as it enables the detection of physical interactions with the environment. These sensors, operating at micro scales, can be seamlessly integrated into various industrial applications. To harness their full potential, it is essential to establish a systematic approach for the design and manufacturing of these sensors to meet the demands of cutting-edge applications. This study focuses on creating a finite element analysis-based model, aiming to identify the most suitable Interdigital Transducer (IDT) material for the production of surface acoustic wave sensors using additive manufacturing techniques. By leveraging statistical methods, the research seeks to optimize material selection. The structural design parameters of the chosen material will then be utilized to evaluate the performance of the surface acoustic wave sensor. The study also delves into the prospective applications of this technology in diverse fields, shedding light on its promising future.
1. Introduction
Elements that detect changes in the physical environment are called sensors [1]. They are devices that enable the detection of physical quantities such as heat [2], light [3], pressure [4], sound [5] that we need in our daily lives and directing them to the processors.
Use of sensors; With the developments in the fields of micromachines and microcontrollers, it has gone beyond the traditional measurement of quantities such as temperature and pressure [6]. Among the applications where sensors are used; There are technological tools such as manufacturing [7], machinery [8], aircraft and aviation [9], cars [10], medicine [11], robotics [12]. We frequently encounter sensors that measure physical properties such as optical sensors measuring refractive index [13-14], vibration sensors measuring liquid viscosity [15], sweat rate in clothes [16] and heart rate [17]. Although the history of sensor technology dates back to 1987 [18]; The sensor was first used by Steinel [19] and started mass production.
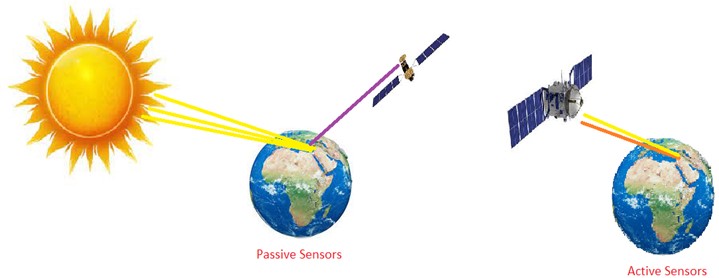
Sensors are examined in two different structures depending on the supply voltage. These are passive sensors and active sensors [20-23]. Accelerometer [24], Radiometer (Hyperspectral, Imaging etc.) [25-28], Sounder [29], Spectrometer [30] and Spectroradiometer [31], which do not require any external power source to produce signals, have the desired physical or chemical values. Sensors that can convert it into an output variable are Passive sensors. In addition, we can count active sensors as sensors that require an external power source to generate signals, such as laser altimeter [32], Lidar [33], radar [34], Ranging Instrument [35], Scatterometer [36] and Sounder [37] Fig. 1). Electronic integrated circuits are miniaturized circuits that perform a specific job and produced in a single case. Structures of electronic and mechanical systems that can operate in small sizes are called Micro electro-mechanical systems (MEMS). Thanks to developing technology, these dimensions have been created in an even smaller structure. If the dimensions are nanoscale, they are called nano-mechanical systems (NEMS). MEMS was first discussed at a micro dynamics workshop in 1987. MEMS is based on the production of electronic and mechanical systems in small sizes. MEMS is based on the production of electronic and mechanical systems in small sizes. Production methods are molding, coating technologies, wet carving method, dry carving method [38].
Fig. 1Active and passive sensor principles
Special machines are used to produce these systems; whose sizes vary between 1-100 micrometers. However, it is not physically possible to reduce operating systems to these sizes. In MEMS structures, the ratio of surface area to volume is quite high. These structures generally consist of three parts. The mechanical unit is the drive unit and the sensor unit. In MEMS structures, the drive unit; can be thermal, electrostatic, magnetic, pneumatic, and optical. Detection is done through optical, mechanical, and electronic signals.
Because MEMS is small, it is suitable for operation in small areas. The human body is a very complex mechanism. For the diagnosis and treatment of some diseases, it is important to reach the right place without damaging another part of the body. For this reason, there is movement opportunity in very limited areas. MEMS technologies are preferred for a more accurate diagnosis [39]. Thanks to its small structure and low power consumption, it can work for a long time wherever it is positioned. With this feature, it is preferred in the field of wearable technologies. MEMS structure is used in medical devices that receive health information from people [40]. In the field of health, this method, known as preventive structural health monitoring, is based on tracking data taken from the human body or sending it to a center [41]. The data collected by these small sensors is mostly transferred wirelessly [42]. In detection technology, one quantity is converted into another quantity. It contains a transducer. The transducer transmits the data it detects wirelessly. These sensors working on humans are called biochips or biosensors. These sensors are based on chemical reactions and electrical detection of a biological response [43]. Biosensors; It consists of bioreceptor, transducer, communication layer and other electronic circuits. With this structure, a chemical activity is detected biologically and converted into an electrical signal and transmission occurs. MEMS does not consist only of the sensing layer. The detected data needs to be transformed and transmitted in a form. For this reason, the application varies from place to place; Layers such as amplification, filtering, signal processing, display and data transmission are used [44]. MEMS's small structure provides various advantages. However, the shrinkage of this structure is slightly more expensive than its equivalent types. In some places this price can be ignored. Health is at the top of these areas. However, in industry, cost is an important parameter. The development of technology used in MEMS production reduces the production costs of MEMS products [45].
More common applications of micro-sized temperature sensors are Temperature, Pressure, Torque, Mass, Humidity, Steam Chemicals and Biosensors. Among these sensors, the temperature sensor plays an important role in many systems, both commercial and industrial. For sensors based on the piezoelectric principle, resonator structures to stabilize electronic oscillators can be identified as one of the examples of such sensing devices. Such devices; It is widely used in industrial, commercial, medical and military applications or equipment. Due to their small size and high sensitivity, they can react very quickly to changes in ambient conditions. They can also measure physical or chemical quantities from remote areas without the need for a separate power supply. With the advancement of techniques used to produce such sensor devices, it is now possible to manufacture sensors up to nano dimensions. One of the most developing manufacturing methods today is the devices and sensors produced with 3D devices.
2. Materials and methods
In the study, the measurement features of the micro-sized Surface Acoustic Wave sensor designed in Comsol and Ansys software were examined. The focus is on the piezoelectric behavior of materials. Piezoelectricity is a phenomenon that can be called the ability of a material to change an electric field as a result of mechanical pressure applied to some materials. This effect, which can be seen on materials, is directly proportional to the change of polarization density. Sensors consisting of materials with piezoelectric behavior; It can be used to measure changes in pressure, acceleration, temperature, strain, or force by converting them into an electrical charge.
Polyamide is a containing monomers linked by amide bonds. Natural and synthetic samples are available. The most common, naturally occurring examples are polypeptides and proteins, eg silk, wool. Examples of artificial, synthetic polyamides (nylon, kevlar, sodium (poly) aspartate can be given. Synthetic polyamides are widely used in textile, automotive industry, kitchenware and sportswear due to their durability. Polyamide, also called engineering plastic, can withstand high or low temperatures and last for a long time. It is a type of plastic that can be used. It also has high electrical insulation properties of PA 6, which is used extensively in electrical materials. The properties of the polyamide material used in our study are: density: 1300 (kg/m³), Young’s modulus: 3.1 GPa and Poisson’s ratio: 0.39 The properties of the Silicon-based Quartz material used in the study are density: 2651 (kg/m³), Young's modulus: 7.00E+01 GPa and Poisson’s ratio: 0.17.
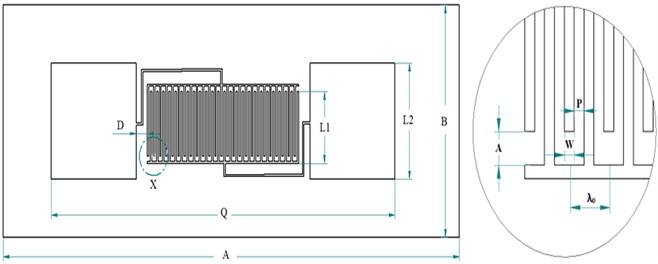
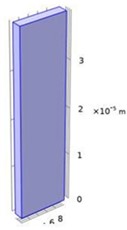
COMSOL Multipyhsics and ANSYS are used for the finite element analysis of the analysis of the designed surface-acoustic sensing device model. After defining the geometrical structure, material parameters and mesh attribution, the simulation of the performance of the sensor has been analyzed. The structural and dimensional parameters of the designed sensor are shown in Fig. 2.
Fig. 2This is a figure. Schemes follow the same formatting
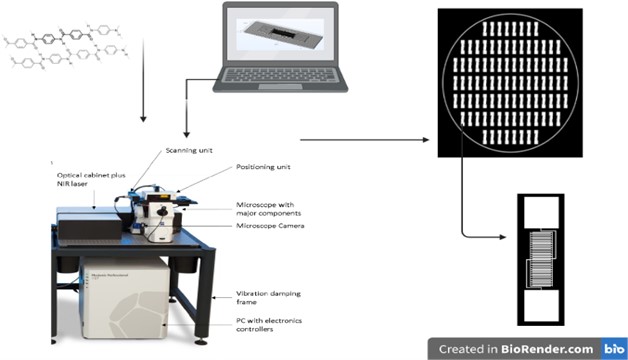
In this study, Silicon Waffle [AK1] mold was prepared via photolithography method (Fig. 3). 92 models were designed in a mask: each model was formed in the form of a rectangular array of 2.50 mm×10 mm, and the finger structures in the design were formed as 25 + 25 = 50 opposing grid structures with a length of 45 μm and a gap of 45 μm between them. The photomask was prepared by fixing an Acetate paper to a 5 inch Soda Lime Glass. The AZ 4562 photoresist layer of approximately 6 µm was laid with the coating device by rotating the silicon substrate at 4000 rpm for 60 seconds.
Fig. 3Fabrication technique and process for SAW sensors
3. Results
3.1. Finite element analysis for wafle materials
Finite element analysis for the design of the SAW-Based Wireless Temperature Sensor and the results of this analysis were evaluated. The analysis results seen at the Fig. 4. According to the Finite Element Analysis, the acoustic modes of the Polyamide and Quartz-based materials that will form the sensor were determined analysis was performed on 10 Modes. In the sensor to be produced with quartz material, the 1st Mode frequency is 874.9 Hz. has been determined. 10. Mode value is 54542 Hz. has been determined.
Fig. 4Comsul analysis of the designed sensors’ frequency modes for Mod 1
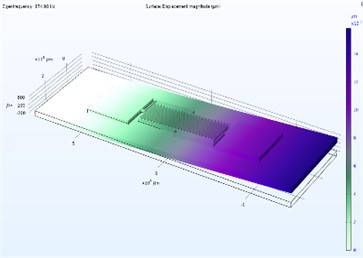
a) Quartz
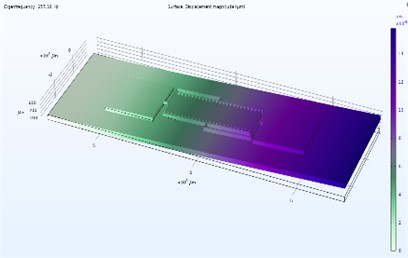
b) Polyamid
Quartz-based material frequency response increases linearly. In the analysis made with polyamide material, the 1st Mode frequency is 257.16 Hz. Here, 10.18152 Hz as the mode value (Figs. 4, 5).
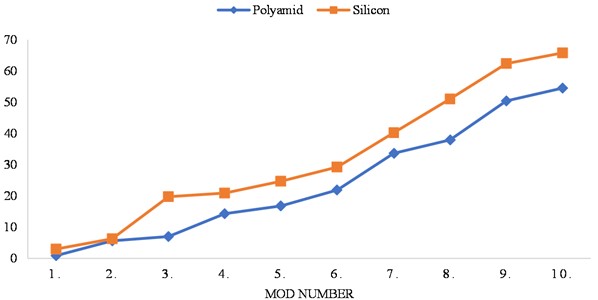
The frequency response of the polyamide-based sensor increases linearly with the increase in the number of modes. When the angular frequency values of the working materials are examined, a decrease in the 7th Mode value is observed in Quartz material. From this point on, there is a high increase in the frequency value with an angle. A similar behavior is observed in the polyamide material. A dramatic decrease in the 7th mode value is seen in polyamide-based material. From this point on, there is a high increase in the frequency value with an angle (Fig. 6).
Fig. 5Example of saw sensor acoustic analysis for Mod 1 in Comsol
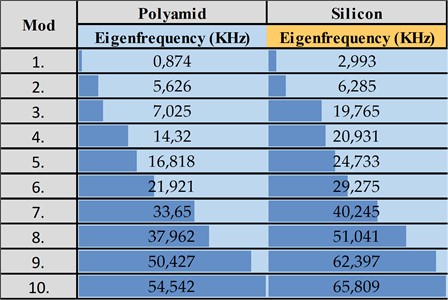
Fig. 6Frequency value with an angle
3.1.1. Statistical results of data
The results of the Wilcoxon non-parametric relationship test, which was performed by considering the analysis results on two different materials and the number of samples, were examined. Analysis was performed over 10 Modes. Mean Difference: 22188.5, Sum of pos. ranks: 55, Z-value: –2.8031 Mean (W): 27.5. In the analysis, Standard Deviation (W): 9.81 was determined. The value of is –2.8031 in the statistical analysis.
The p-value is set at .00512. The relationship between the Mode values of the 2 sensors The result is significant at .05. With this result, there are and can be seen differences between the 2 sensor models. Statistically, there is a significant difference in the mean of the values. The values for the polyamide material are much lower than the frequency values for the quartz structure.
3.2. Finite element analysis for IDT materials
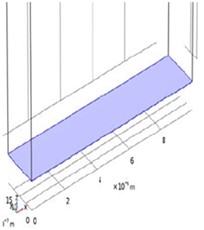
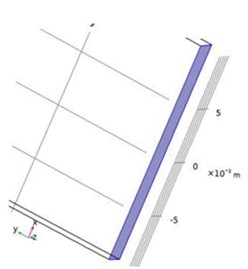
Firstly, a sensor in the form of a rod, utilizing Lithium Niobate material, was designed, and its responses to applied pressure, as well as the structure of the design, were examined (Fig. 7).
Due to the structure and simple design of the sensor, which is made of Lithuim Niobate material with high surface acoustic wave detection, the analysis result was not at the desired level. Based on the SAW Sensor (Surface Acoustic Wave Sensors) (Fig. 8) design [25], which was thought to be suitable as a result of different examinations and trials, a sensor design was made that converts an electrical input signal, which can be easily affected by physical events, into mechanical waves by utilizing its logic and design.
Fig. 7a) Rod design of the sensor designed from Lithuim Niobate material, b) regions where the sensor is fixed, c) surfaces selected to apply force, d) response of the sensor as a result of the analysis are shown
a)
b)
c)
d)
Fig. 8Surface acoustic wave sensor (SAW) example [46, 47]
![Surface acoustic wave sensor (SAW) example [46, 47]](https://static-01.extrica.com/articles/23794/23794-img12.jpg)
![Surface acoustic wave sensor (SAW) example [46, 47]](https://static-01.extrica.com/articles/23794/23794-img13.jpg)
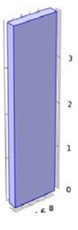
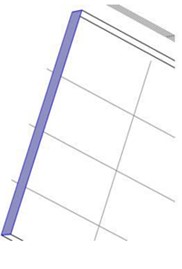
Structure of the sensor; It consists of plates at both ends and thin plates that do not store electrical energy between them. These plates act as a capacitor. Thus, the capacitance becomes an integral part of the equivalent circuit of the device. The produced load is considered to be mobile and creates current by moving in the sensor structure to which it is connected. This means that by using a current source, the current can be modeled with a value equal to the load derivative. Although many different materials have been tried when the material structure is taken into account, for the ideal design; The upper and lower parts are made of silicone, and the plates that serve as capacitors are made of copper. After many attempts, pressure was applied to the sensor fixed from the ceiling, this time from the base (Fig. 9).
Fig. 9a) Ceiling, b) fixing from the base
a)
b)
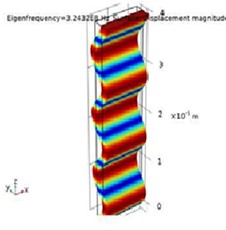
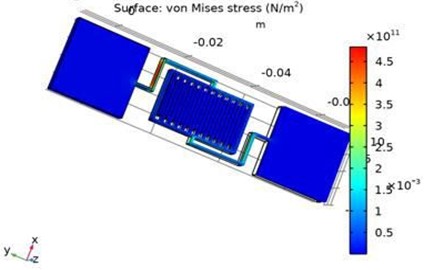
The mesh model was created with the pressure applied to the designed sensor. The results of the analysis made on the sensor structure are shown in Fig. 10. As a result of the design and analysis of the sensor, we see that our structure, which acts as a capacitor between two plates, increases its resistance to any external factors such as pressure and temperature, compared to rod type sensors. The use of silicon, which we determined as the wafer material, and copper as the IDT material, showed that the signals obtained were more usable. Although silicone does not have piezo properties on its own, it is possible to provide better results with coating. On the other hand, polyamide is a material that exhibits piezzo behavior. Additionally, its more flexible structure makes it easier to use as waffles.
Fig. 10Behavior of the designed sensor against physical factors
4. Conclusions
In this study, a SAW-based wireless temperature sensor was numerically designed and additively manufactured. The operating performance of the manufactured sensor that measures temperature wirelessly at a distance of 1-4 m was evaluated according to the material type. As the measuring range, the 7th mode can be considered as the limit. Quartz material provides in a higher frequency range in materials prepared with silicon wafer and produced by photolithography method. The designed sensor with polyamide material has a lower frequency range compared to the numerical results. In addition, the polyamide material offered a flexible structure.
According to the statistical analysis performed on the data, it seems likely that both materials are significantly different and operate in different frequency ranges. The results show that an important measurement evaluation can be made by producing the SAW-based sensor with polyamide material. This sensor which can be produced with the layered production technique can provide remote data communication with the appropriate antenna selection and electrical conductivity feature.
According to test and analysis results, acoustic values are affected in relation to the hardness value of the materials in two separate sensor models produced with Polyamide and Silicone materials. It is seen that the production of the sensor with polymaid material can be worked with a flexible and soft structure.
Due to their small size and high sensitivity, micro-sized sensors respond to environmental changes very quickly and with a significantly positive accuracy rate. They can make measurements from long distances without the need for a separate power supply. The increasing use of such sensors in today’s technology has left the door open for developments in terms of design and features.
References
-
D. Sehrawat and N. S. Gill, “Smart sensors: analysis of different types of IoT sensors,” in 2019 3rd International Conference on Trends in Electronics and Informatics (ICOEI), pp. 523–528, Apr. 2019, https://doi.org/10.1109/icoei.2019.8862778
-
L. Arakawa Martins, V. Soebarto, and T. Williamson, “A systematic review of personal thermal comfort models,” Building and Environment, Vol. 207, p. 108502, Jan. 2022, https://doi.org/10.1016/j.buildenv.2021.108502
-
Y. Aussat, A. Rosmanis, and S. Keshav, “A power-efficient self-calibrating smart lighting system,” Energy and Buildings, Vol. 259, p. 111874, Mar. 2022, https://doi.org/10.1016/j.enbuild.2022.111874
-
D. Lei et al., “Roles of MXene in pressure sensing: preparation, composite structure design, and mechanism,” Advanced Materials, Vol. 34, No. 52, Dec. 2022, https://doi.org/10.1002/adma.202110608
-
Y. Sun et al., “Review of a specialty fiber for distributed acoustic sensing technology,” Photonics, Vol. 9, No. 5, p. 277, Apr. 2022, https://doi.org/10.3390/photonics9050277
-
A. Dzedzickis, A. Kaklauskas, and V. Bucinskas, “Human emotion recognition: review of sensors and methods,” Sensors, Vol. 20, No. 3, p. 592, Jan. 2020, https://doi.org/10.3390/s20030592
-
A. Tsanousa et al., “A review of multisensor data fusion solutions in smart manufacturing: systems and trends,” Sensors, Vol. 22, No. 5, p. 1734, Feb. 2022, https://doi.org/10.3390/s22051734
-
J. Xue, Y. Zou, Y. Deng, and Z. Li, “Bioinspired sensor system for health care and human‐machine interaction,” EcoMat, Vol. 4, No. 5, Sep. 2022, https://doi.org/10.1002/eom2.12209
-
Z. Liu et al., “Remote sensing and geostatistics in urban water-resource monitoring: a review,” Marine and Freshwater Research, Vol. 74, No. 10, pp. 747–765, Mar. 2023, https://doi.org/10.1071/mf22167
-
H. Pourrahmani et al., “The applications of internet of things in the automotive industry: A review of the batteries, fuel cells, and engines,” Internet of Things, Vol. 19, p. 100579, Aug. 2022, https://doi.org/10.1016/j.iot.2022.100579
-
C. Paniagua and J. Delsing, “Industrial frameworks for internet of things: a survey,” IEEE Systems Journal, Vol. 15, No. 1, pp. 1149–1159, Mar. 2021, https://doi.org/10.1109/jsyst.2020.2993323
-
T. Mikolajczyk et al., “Recent advances in bipedal walking robots: review of gait, drive, sensors and control systems,” Sensors, Vol. 22, No. 12, p. 4440, Jun. 2022, https://doi.org/10.3390/s22124440
-
J. Terdale and A. Ghosh, “An intensity-modulated optical fiber sensor with agarose coating for measurement of refractive index,” International Journal of System Assurance Engineering and Management, pp. 1–7, Nov. 2022, https://doi.org/10.1007/s13198-022-01804-0
-
F. Ye, C. Tian, C. Ma, and Z. F. Zhang, “Fiber optic sensors based on circular and elliptical polymer optical fiber for measuring refractive index of liquids,” Optical Fiber Technology, Vol. 68, p. 102812, Jan. 2022, https://doi.org/10.1016/j.yofte.2021.102812
-
I. C. Esfahani and H. Sun, “A droplet-based micropillar-enhanced acoustic wave (μPAW) device for viscosity measurement,” Sensors and Actuators A: Physical, Vol. 350, p. 114121, Feb. 2023, https://doi.org/10.1016/j.sna.2022.114121
-
J. Foster, J. W. Smallcombe, S. Hodder, O. Jay, A. D. Flouris, and G. Havenith, “Quantifying the impact of heat on human physical work capacity; part II: the observed interaction of air velocity with temperature, humidity, sweat rate, and clothing is not captured by most heat stress indices,” International Journal of Biometeorology, Vol. 66, No. 3, pp. 507–520, Mar. 2022, https://doi.org/10.1007/s00484-021-02212-y
-
M. Schaffarczyk, B. Rogers, R. Reer, and T. Gronwald, “Validity of the polar H10 sensor for heart rate variability analysis during resting state and incremental exercise in recreational men and women,” Sensors, Vol. 22, No. 17, p. 6536, Aug. 2022, https://doi.org/10.3390/s22176536
-
Z. Peng et al., “Blood glucose sensors and recent advances: a review,” Journal of Innovative Optical Health Sciences, Vol. 15, No. 2, Mar. 2022, https://doi.org/10.1142/s1793545822300038
-
A. Hamza, H. Habibi Gharakheili, T. Pering, and V. Sivaraman, “Combining device behavioral models and building schema for cybersecurity of large-scale IoT infrastructure,” IEEE Internet of Things Journal, Vol. 9, No. 23, pp. 24174–24185, Dec. 2022, https://doi.org/10.1109/jiot.2022.3189350
-
M. B. Morshed et al., “Advancing the understanding and measurement of workplace stress in remote information workers from passive sensors and behavioral data,” in 2022 10th International Conference on Affective Computing and Intelligent Interaction (ACII), pp. 1–8, Oct. 2022, https://doi.org/10.1109/acii55700.2022.9953824
-
A. Piccone, “Passive sensors localize ships without geoacoustic information,” Scilight, Vol. 2022, No. 27, Jul. 2022, https://doi.org/10.1063/10.0012731
-
R. Yuan, Y. Lv, T. Wang, S. Li, and H. Li, “Looseness monitoring of multiple M1 bolt joints using multivariate intrinsic multiscale entropy analysis and Lorentz signal-enhanced piezoelectric active sensing,” Structural Health Monitoring, Vol. 21, No. 6, pp. 2851–2873, Nov. 2022, https://doi.org/10.1177/14759217221088492
-
G. Khandelwal and R. Dahiya, “Self‐powered active sensing based on triboelectric generators,” Advanced Materials, Vol. 34, No. 33, Aug. 2022, https://doi.org/10.1002/adma.202200724
-
L. Riaboff, L. Shalloo, A. F. Smeaton, S. Couvreur, A. Madouasse, and M. T. Keane, “Predicting livestock behaviour using accelerometers: A systematic review of processing techniques for ruminant behaviour prediction from raw accelerometer data,” Computers and Electronics in Agriculture, Vol. 192, p. 106610, Jan. 2022, https://doi.org/10.1016/j.compag.2021.106610
-
T. Nakajima et al., “An overview of and issues with sky radiometer technology and SKYNET,” Atmospheric Measurement Techniques, Vol. 13, No. 8, pp. 4195–4218, Aug. 2020, https://doi.org/10.5194/amt-13-4195-2020
-
S. G. Vesnin et al., “Portable microwave radiometer for wearable devices,” Sensors and Actuators A: Physical, Vol. 318, p. 112506, Feb. 2021, https://doi.org/10.1016/j.sna.2020.112506
-
F. Braga et al., “Assessment of PRISMA water reflectance using autonomous hyperspectral radiometry,” ISPRS Journal of Photogrammetry and Remote Sensing, Vol. 192, pp. 99–114, Oct. 2022, https://doi.org/10.1016/j.isprsjprs.2022.08.009
-
A. Aides, A. Levis, V. Holodovsky, Y. Y. Schechner, D. Althausen, and A. Vainiger, “Distributed sky imaging radiometry and tomography,” in 2020 IEEE International Conference on Computational Photography (ICCP), pp. 1–12, Apr. 2020, https://doi.org/10.1109/iccp48838.2020.9105241
-
M. Rahnemoonfar, J. Johnson, and J. Paden, “AI radar sensor: creating radar depth sounder images based on generative adversarial network,” Sensors, Vol. 19, No. 24, p. 5479, Dec. 2019, https://doi.org/10.3390/s19245479
-
K. Alonso et al., “Data products, quality and validation of the DLR earth sensing imaging spectrometer (DESIS),” Sensors, Vol. 19, No. 20, p. 4471, Oct. 2019, https://doi.org/10.3390/s19204471
-
J. Gröbner, H. Schill, L. Egli, and R. Stübi, “Consistency of total column ozone measurements between the Brewer and Dobson spectroradiometers of the LKO Arosa and PMOD/WRC Davos,” Atmospheric Measurement Techniques, Vol. 14, No. 5, pp. 3319–3331, May 2021, https://doi.org/10.5194/amt-14-3319-2021
-
S. Li, X. Fan, H. Pan, and Q. Yu, “A compensation method of saturated waveform for space-borne laser altimeter,” Remote Sensing, Vol. 14, No. 13, p. 3158, Jul. 2022, https://doi.org/10.3390/rs14133158
-
J. Lee, K.C. Lee, S. Lee, Y.J. Lee, and S.H. Sim, “Long‐term displacement measurement of bridges using a LiDAR system,” Structural Control and Health Monitoring, Vol. 26, No. 10, Oct. 2019, https://doi.org/10.1002/stc.2428
-
J. A. Zhang et al., “An overview of signal processing techniques for joint communication and radar sensing,” IEEE Journal of Selected Topics in Signal Processing, Vol. 15, No. 6, pp. 1295–1315, Nov. 2021, https://doi.org/10.1109/jstsp.2021.3113120
-
X. Liu et al., “ASCAT IB: A radar-based vegetation optical depth retrieved from the ASCAT scatterometer satellite,” Remote Sensing of Environment, Vol. 264, p. 112587, Oct. 2021, https://doi.org/10.1016/j.rse.2021.112587
-
Y. Lyu, P. Kyösti, and W. Fan, “Sub-terahertz channel sounder: review and future challenges,” China Communications, Vol. 20, No. 6, pp. 26–48, Jun. 2023, https://doi.org/10.23919/jcc.fa.2021-0450.202306
-
M. Gad-El-Hak, The MEMS Handbook. CRC Press, 2001.
-
J. H. Mahar, G. J. Rosencrance, and P. A. Rasmussen, “Telemedicine: past, present, and future,” Cleveland Clinic Journal of Medicine, Vol. 85, No. 12, pp. 938–942, Dec. 2018, https://doi.org/10.3949/ccjm.85a.17062
-
E. Bostanci, “Medical wearable technologies: applications, problems and solutions,” in 2015 Medical Technologies National Conference (TIPTEKNO), Oct. 2015, https://doi.org/10.1109/tiptekno.2015.7374111
-
Z. Deng, M. Huang, N. Wan, and J. Zhang, “The current development of structural health monitoring for bridges: a review,” Buildings, Vol. 13, No. 6, p. 1360, May 2023, https://doi.org/10.3390/buildings13061360
-
E. Turk et al., “Wireless bioacoustic sensor system for automatic detection of bowel sounds,” in 2015 19th National Biomedical Engineering Meeting (BIYOMUT), pp. 1–4, Nov. 2015, https://doi.org/10.1109/biyomut.2015.7369458
-
D. A. White, A. K. Buell, C. M. Dobson, M. E. Welland, and T. P. J. Knowles, “Biosensor‐based label‐free assays of amyloid growth,” FEBS Letters, Vol. 583, No. 16, pp. 2587–2592, Aug. 2009, https://doi.org/10.1016/j.febslet.2009.06.008
-
B. Prickril and A. Rasooly, Biosensors and Biodetection. Springer Science, 2017.
-
M. Gemelli, R. Sakauchi, T. Block, and S. Scheiermann, “Low cost MEMS based systems augmenting location and navigation performance in consumer and industrial electronics applications,” in 2020 IEEE/ION Position, Location and Navigation Symposium (PLANS), pp. 1439–1443, Apr. 2020, https://doi.org/10.1109/plans46316.2020.9109891
-
S. Ersoy and T. Waqar, Surface Acoustic Wave Sensing Encyclopedia of Sensors and Biosensor. Elsiever, 2022.
-
W. Connacher et al., “Micro/nano acoustofluidics: materials, phenomena, design, devices, and applications,” Lab on a Chip, Vol. 18, No. 14, pp. 1952–1996, 2018, https://doi.org/10.1039/c8lc00112j
About this article

This study was supported by The Scientific and Technological Research Council of Turkey (TUBITAK) within the scope of the Scientist Support Program. (Bideb-1059B192201961).
The datasets generated during and/or analyzed during the current study are available from the corresponding author on reasonable request.
Başak Aktaş: data curation, funding acquisition, investigation, resources, software, validation. Talha Şahin: data curation, funding acquisition, investigation, resources, software, validation. Ersin Toptaş: data curation, funding acquisition, investigation, resources, software, validation. Dr. Aydın Güllü: data curation, funding acquisition, investigation, resources, software, validation. Assoc. Prof. Ahmet Feyzioğlu: conceptualization, formal analysis, project administration. Prof. Dr. Sezgin Ersoy: conceptualization, formal analysis, project administration methodology, supervision, writing – original.
The authors declare that they have no conflict of interest.
