Animals. Six to eight-week-old male CD-1 or male Swiss Webster (SW) mice were purchased from Charles River (Montreal, QC, Canada). Young animals (3 mo) were allowed to habituate to the animal facility for 1 week while older animals were housed until they were 18–24 mo of age when they were used for experimentation. Animals were housed 4/cage and under controlled conditions (21◦C) on a 12-h light/dark cycle (lights on at 5:00 a.m.) and fed ad libitum. All experiments were carried out in accordance with the guidelines of the Canadian Council on Animal Care and ARRIVE Guidelines and were approved by McMaster University’s Animal Research Ethics Board (Animal Utilisation Protocols: 16-08-30 & 20-05-21). Mice were killed by cervical dislocation and all action potential recordings performed ex vivo.
Enteric nervous system.
Myenteric plexus preparation. A 2 cm segment of ileum was removed from freshly killed mice and the tissue was placed in a 2 ml recording petri dish whose inside base was lined with sylgard (170 silicone elastomer, Dow Corning, Midland, MI, USA) and filled with Krebs buffer of the following composition (mM): NaCl 118.1, KCl 4.8, NaHCO3 25, NaH2PO4 1.0, MgSO4 1.2, glucose 11.1, CaCl2 2.5; the buffer was continuously bubbled with carbogen (95% O2–5% CO2). Nicardipine (3 µM) (Sigma-Aldrich, Oakville, ON, Canada) was routinely added to the saline to prevent spontaneous muscle contraction. The segment was opened along a line parallel to the mesenteric attachment and pinned flat, under moderate tension, mucosa uppermost. The myenteric plexus was exposed by dissecting away the mucosa, submucosa, and circular muscle. The recording dish was then mounted on an inverted microscope (Nikon Eclipse TE 2000-S,Melville, NY, USA) and imaged via a PC computer using a Rolera-XR camera (Surrey, BC, Canada) and the tissue continuously superfused (4 ml min-1) with carbogenated Krebs warmed to 34 oC. A ganglion was prepared for patch clamping as described previously31; briefly, the selected ganglion was exposed by gravity flow for 15 min to 3 ml of 0.02% protease type XIV in Krebs saline (Sigma-Aldrich), then the upper surfaces of myenteric neurons were revealed by cleaning part of the ganglion with a fine hair until individual neuron soma became just visible. As noted previously31; Rugiero, 2002 #266} there was no evidence of cell swelling after this gentle treatment.
Intrinsic primary afferent neuron recording. Signals were measured in voltage recording (current clamp) mode using an Axon Instruments Multiclamp 700A computer amplifier (Molecular Devices, San Jose, CA, USA), and a Digidata 1322A (Axon Instruments) digitizer was used for A/D conversion. Signals were low pass, 4-point Bessel filtered at 5 kHz, and then digitized at 20 kHz. Data were stored on computer and analyzed offline using Pclamp software (Molecular Devices). Voltage or current commands were delivered to the amplifier under computer control using Clampex 9 (Molecular Devices) software. Patch pipettes were pulled on a Flaming-Brown-P97 (Sutter Instrument, Novato, CA, USA) electrode puller to produce micropipettes with resistances 4–6 MΩ. The patch pipettes were made from thick walled borosilicate glass (Sutter Instrument) and filled with a solution of the following composition in mM: KMeSO4 110–115, NaCl 9, CaCl2 0.09, MgCl2 1.0, HEPES 10, Na3GTP 0.2, BAPTA.K4 0.2 with 0.2% neurobiotin (Vector Laboratories, Newark, CA, US) 14 mL KOH to bring the pH to 7.3. The online program Maxchelator (Maxchelator:https://somapp.ucdmc.ucdavis.edu/pharmacology/bers/maxchelator) gives a predicted value free [Ca2+] of 0.18 µM at 34 oC32 for this intracellular solution. This value is close to resting free [Ca2+] as estimated using Ca2+-sensitive dyes in guinea pig Dogiel type II neurons (IPANs)33, 34.
With the amplifier in voltage clamp recording, about 50 hPa positive pressure was internally applied to the pipette before its tip entered the Krebs buffer superfusing the myenteric plexus preparation; the pressure was maintained until the tip was in close apposition to a neuron membrane. Only recordings with seal resistances ≥ 4 GΩ were used for analysis. After gigaseal formation, the amplifier was switched to current clamp recording and whole cell recording mode entered by further suction. During the recording period, depolarising or hyperprolarising current pulses could be injected, under computer control, via the patch pipette using Pclamp 9 Clampex software (Molecular Devices). Access resistance and cell membrane resistance, capacitance and time constants, were periodically monitored by software programmed switching to the Pclamp membrane test protocol which injects square wave pulses oscillating about the holding potential.
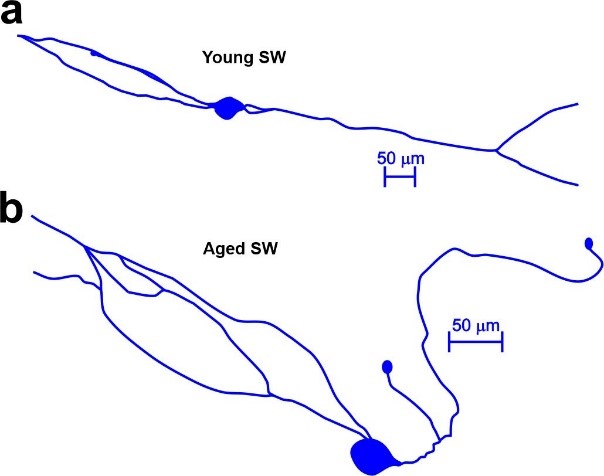
Histochemistry. At the end of each recording, neurons were ionophoretically loaded with neurobiotin by passing 40 x 500 ms duration + 0.1 nA current pulses via the patch pipette. The tissue was fixed in Zamboni’s fixative (2% v/v picric acid, 4% paraformaldehyde in 0.1 M Na2HPO4/NaH2PO4 buffer, pH = 7.0) overnight at 4 oC, and then cleared using 3 x 10 min washes of DMSO followed by 3 x 10 min washes with PBS. The tissue was then exposed to streptavidin-Texas Red (Vector Laboratories), diluted 1:50, to reveal neurobiotin. After final rinsing, the tissue was mounted in PBS containing 80% glycerol and 0.1% NaN3 and viewed under fluorescence epi-illumination on an inverted microscope (Nikon Eclipse TE 2000-S,Melville, NY, USA) and imaged using a Rolera-XR camera (Surrey, BC, Canada) Texas Red (596 nm & 620 nm excitation and emission peaks). Shapes of fluorescing neurons were traced using Inkscape 1.2 (Inkscape Project, available from: https://inkscape.org).
Mesenteric nerve recording.
Jejunum-mesenteric nerve preparation. Mice were sacrificed by cervical dislocation and all action potential recordings performed ex vivo. Short (2.5 cm) segments of proximal jejunum with attached mesenteric arcade containing a single neuromuscular bundle were immediately removed and placed in a sylgard lined recording petri dish filled with Krebs buffer. The segment was emptied of contents using a syringe filled with Krebs, then both ends were cannulated with silicone tubing. The gut and mesenteric tissue were pinned to the sylgard using pins cut from 0.25 mm diameter tungsten wire and the mesenteric nerve bundle exposed by microdissection under a stereomicroscope. The preparation was then transferred to a Nikon Eclipse TE 2000 inverted microscope and the lumen gravity perfused at 1 ml/min with room temperature (22°C) carbogenated Krebs or Krebs plus 30 µM squalamine dilactate using several Mariotte bottles35 attached to a plastic manifold. The serosal compartment was separately perfused at 5 ml/min with prewarmed (34°C) Krebs solution to which 3 µM nicardipine had been added to isolate vagal chemosensory responses by preventing active muscle contractions but not vagal responses to distension36.
The cleaned nerve was sucked into a glass-recording pipette attached to a patch-clamp electrode holder, and extracellular nerve recordings made with pClamp software using a Multi-Clamp 700B amplifier and Digidata 1440A signal converter (Molecular Devices). The nerve bundle within the pipette was isolated from the Krebs within the recording dish by gently pressing the tip into fat tissue adherent to the uncleaned parts mesenteric arcade. Electrical signals were bandpass-filtered at 0.1–2 kHz, sampled at 20 kHz, and displayed and stored on a personal computer36.
Baseline recording with Krebs buffer in the gut lumen was performed for 15 min to verify that the resting firing rate was stationary using Pclamp software; samples with non-stationary discharge (windup or rundown) were discarded. Then recording continued for 30 min which constituted the test period for young vs aged comparisons. For experiments where squalamine or sertraline were added to the luminal perfusate, the Krebs buffer only control recording period was 30 min and this was followed by another 30 min of recording in the presence of either drug. Rundown of constitutive vagal discharge in this system is not evident until > 90 min of recording36. Only one luminal test additive was applied once per animal to avoid possible signal rundown. After recording responses to luminal test substances and to allow post-hoc identification of vagal single units, we applied 0.2 ml CCK to the serosal surface of the jejunum using a handheld micropipette. Finally we distended the intestine by raising the intraluminal pressure to 14 hPa to demonstrate that the isolated single units could still respond to distension. Testing for the response of each of the isolated single units to CCK is a well-established method for identifying vagal fibres within the mesenteric nerve bundle36, 37. Cholecystokinin (25–33) sulphated (AnaSpec, Fremont, CA, USA) was dissolved in dimethyl sulfoxide (DMSO) to make a 1 mM stock solution. Aliquots were diluted on the day of the experiment to a working concentration of 0.1 µM in Krebs buffer, with a final DMSO concentration ≤ 0.0001%.
We tested the following “psychoactive” agents
10 µM sertraline hydrochloride15 (MilliporeSigma, Burlington, MA, USA). Squalamine dilactate was provided by Dr Michael Zasloff, Georgetown University (Washington, DC, United States). Squalamine dilactate powder was dissolved in 90% ethanol to make a stock solution, then aliquoted and stored at -20°C until use. Stock solution was diluted in Krebs buffer to a working concentration of 30 µM for in vitro experiments15. These concentrations activate young adult vagal fibres by approximately the same intensity of ≈ 20% above baseline firing rates.
Analysis of single unit firing patterns
Each analysed vagal single unit was discriminated from others in the multiunit recording using principal component analysis of their action potential shape, amplitude and width using the Dataview program38 for extracellular action potential analysis. Single units belonging to each vagal axon were converted into a single event point processes and displayed and used for further analysis15.
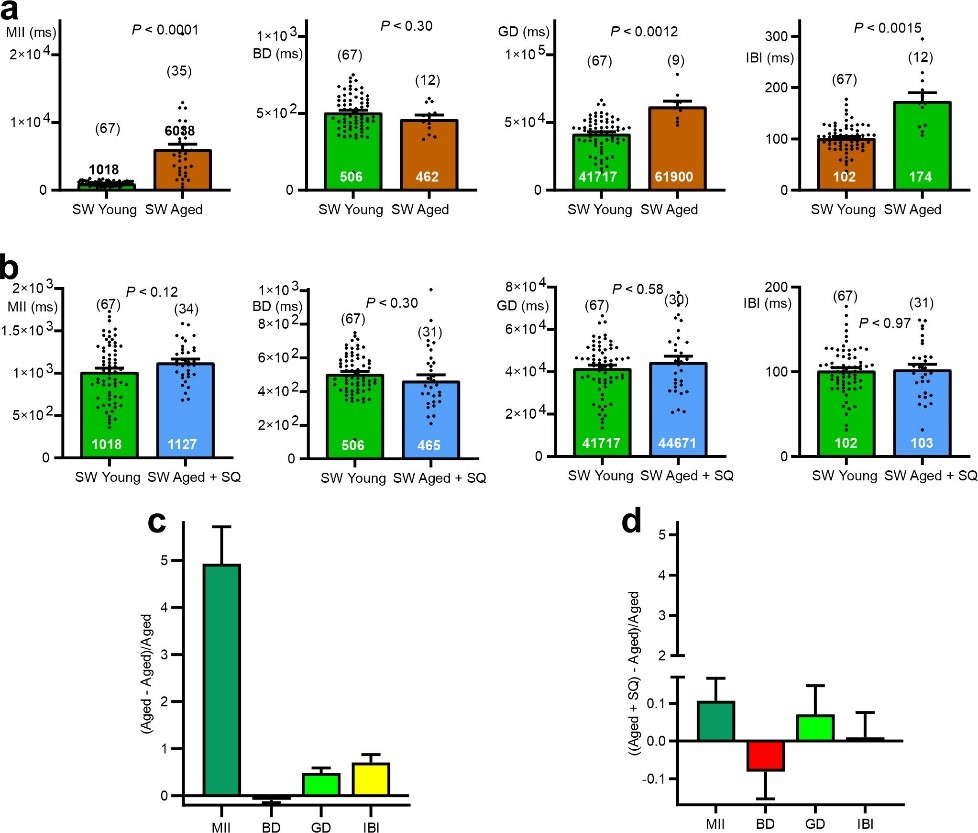
For each single unit event channel in Dataview point processes intervals vs time were displayed as using the “event parameter histogram” plot option and the mean interspike interval (MII) read from the descriptive statistics panel.
Event bursts were detected by the Poisson surprise method15, 39. For each control or treatment event channel being measured in Dataview the “Event analyse: Histograms/statistics” option of the programme calculated the gap (GD) and burst (BD) durations15. For intraburst intervals (IBI) and the Krebs and treatment bursts event channels that were created by the Poisson surprise method were logically combined using the AND gate function, thus extracting only the bursts from the point process events for either the control or treatment recording periods.
Statistical analysis.
Descriptive statistics were calculated in GraphPad Prism ver. 8.3 (GraphPad Software, San Diego, USA) are given as mean ± standard errors. When a statistical test was performed, the P value given is the probability of the test statistic being at least as extreme as the one observed if the null hypothesis of no difference is admitted. The partial eta squared statistic η2p40, pp. 70–71 gives the effect size for differences calculated in the t-test module within GraphPad. According to Cohen’s guidelines41 for interpreting η2p, 0.01 indicates a small, 0.06 a medium and 0.14 a large effect size.