
Comparative Study of Climate Change and its Impact on Ring-Widths of Spruce (Picea smithiana) at Kalam and Kaghan Forest Divisions, Khyber Pakhtunkhwa, Pakistan


Research Article
Comparative Study of Climate Change and its Impact on Ring-Widths of Spruce (Picea smithiana) at Kalam and Kaghan Forest Divisions, Khyber Pakhtunkhwa, Pakistan
Hakim Shah1*, Noor Jehan2, S. Shafiqur Rehman1 and Syed Said Badshah Bukhari1
1Department of Environmental Sciences, University of Peshawar, Khyber Pakhtunkhwa, Pakistan; 2Center for Disaster Preparedness and Management, University of Peshawar, Khyber Pakhtunkhwa, Pakistan.
Abstract | This study was conducted in Kalam Forest Division (KFD) and Kaghan Forest Division (KaFD), Khyber Pakhtunkhwa, Pakistan, with the objectives to assess the climate regimes and changes thereof during the period 1965-2015, and their impacts on ring-widths of Spruce (Picea smithiana), along with comparison of the results inter se the two Forest Divisions. Results indicated that KFD and KaFD had significantly different climate regimes of temperature and precipitation. Mean annual maximum and minimum temperatures and mean annual temperature at the two Forest Divisions during 1965-2015 significantly increased, while mean annual precipitation significantly increased in KaFD, but non-significantly decreased in KFD. Mean values of ring-widths of Spruce at KFD and KaFD during 1965-2015 were 1.36±0.02 mm and 1.48±0.02 mm and changes thereof – 0.11 mm and – 0.13 mm, respectively, showing a decreasing trend. The difference in the ring-widths and changes therein in the two Forest Divisions were significant (p<0.01). Correlation of ring-width with temperature precipitation and response functions of Spruce in KFD and KaGD for the period 1965-2015 indicated similar patterns, and were significantly (p<0.01) negative with temperature, but non-significant (p<0.05) positive with precipitation. The values of R2 for ring widths were high, indicating a good fit of the linear models.
Received | November 11, 2018; Accepted | May 22, 2019; Published | July 16, 2019
*Correspondence | Hakim Shah, Department of Environmental Sciences, University of Peshawar, Khyber Pakhtunkhwa, Pakistan; Email: hakimshah59@yahoo.com
Citation | Shah, H., N. Jehan, S.S. Rehman and S.S.B. Bukhari. 2019. Comparative study of climate change and its impact on ring-widths of spruce (Picea smithiana) at Kalam and Kaghan forest divisions, Khyber Pakhtunkhwa, Pakistan. Sarhad Journal of Agriculture, 35(3): 788-797.
DOI | http://dx.doi.org/10.17582/journal.sja/2019/35.3.788.797
Keywords | Climate change, Anthropogenic factors, Climate regimes, Ring widths, Linear models
Introduction
Climate change is an incessant global phenomenon, which is driven by both natural and anthropogenic factors. However, its magnitude and direction vary in time spans and from region to region. These variations depend on the geographical location, latitude, altitude, physiography and other features of the region under focus. Climate change creates impacts on both living and non-living things, including forest ecosystems and plant species. The impacts may cause changes, inter alia, in the growth and functioning of the forest tree species, which manifest in variations in annual growth ring-widths and other characteristics of the plant. Such variations affect the productivity of forests and the quality of timber and other produce obtained from such forests.
Temperature and precipitation are two important determinants of climate and climate change. According to the 5th Assessment Report of IPCC (2014), climate change can be observed in several forms. The climate system is warming up beyond doubt, and since the 1950s, most of these changes have proceeded with higher rates when compared with past decades to millennia. The last three decades each has become warmer than the previous decades since 1850. The period from 1983 to 2012, in the Northern Hemisphere, was assessed likely the warmest 30-year period of the last 1400 years. The combined land and ocean surface temperature data averaged at global level show a warming of 0.85 [0.65 to 1.06] °C, over the period 1880 to 2012. The precipitation on average basis over the mid-latitude land areas of the Northern Hemisphere has increased since 1901. In other regions, some areas have experienced long-term positive trends while others have observed negative trends. The number of events of heavy precipitation has increased in several regions of the globe and decreased in few one.
The effects of temperature increase cause changes in the forest types (Bajwa et al., 2015), variety of problems in health sector (Gosling et al., 2009), more powerful cyclones and sea level rise (IPCC, 2007), fluctuation in crop productivity and reduction of oxygen in the sea (Shaffer, 2009). The effects of climate change are not uniform throughout the globe and varies depending on the increase in local temperature and variations in precipitation.
Pakistan is amongst the countries most affected by climate change. It is confronted with a steady increase in temperature on land and water, changes in magnitude, duration and frequency in precipitation, rise in the occurrence of extreme climatic events and alteration in wind and storm patterns. Further, the precise quantum and frequency of these climatic changes are not uniform in temporal and spatial dimensions and need scientific research for reliable assessment and precise and more accurate statistical forecasts.
Pakistan has limited forest resources, both in extent and stocking. The total forest area and plantations is estimated at about 4.6 million hectares, which constitutes about 5.23% of the total land area of the country. These forests are classified into several forest types, including Moist Temperate and Dry Temperate, which have high economic and ecological importance. These forests harbor few coniferous species, including Spruce (Picea smithiana) (Bukhari, 2011). Spruce is an important source of timber and fuel wood, besides contributing to ecological services.
This study was conducted in the Kalam Forest Division (KFD) and Kaghan Forest Division (KaFD) covering the period 1965-2015, with the objectives to assess the climate regimes and changes therein, and their impacts on ring-widths of Spruce and comparison of the results, inter se, the two Forest Divisions.
Materials and Methods
Study areas
The study was conducted in KFD and KaFD in Khyber Pakhtunkhwa-Pakistan. The location map of the Forest Divisions, indicating the study area, is reproduced in Figure1. Kalam Forest Division is located between 34°.77’N, 72°.56’ E and 35°.54’N, 73°.52’ E. The climate is dry temperate with the major portion of rainfall being received from December to May, which varies with elevation. Rains in summer are not frequent but showers do occur occasionally. Snow falls occur from October to March, depending on altitude. The summer and autumn seasons are normally dry, with monthly rainfall below 50 mm except in July, when rainfall on average is generally higher. The winters are severe, forcing the bulk of the population to migrate with their livestock to plain areas. In March and April, the rainfall is usually received in heavy showers. There are two wet periods: from November to December and March to May. Monsoons are not favorably inclined in this area. Kaghan Forest Division is located between 34°-28’N, 73° 21’E and 34°-56’ N, 73°-41’ E. Major part of the Kaghan valley has a temperate climate within reach of the monsoon, with some sub-valleys and upper reaches lying outside the reach of the monsoon rains. The precipitation follows distinct seasonal patterns. The winter season is severe with heavy snowfall from middle of November to middle of April. The Division receives a good deal of annual precipitation as snowfall which is heavier at higher elevations.
Climate data collection
Climatic dataset (CRUTEM4) for the study area of the KFD and KaFD for the period 1965-2015 was downloaded from the Climate Research Unit (CRU), University of East Anglia, UK. The values for annual maximum temperature, annual minimum temperature, annual mean temperature and annual mean precipitation were calculated. A similar dataset was also tabulated from the data compiled by European Centre for Medium-Range Weather Forecasts (ECMWF) for comparison. The monthly data in grids of 0.125 × 0.125 Km was downscaled for the study area and corrected by Best Easy Systematic (BES) bias correction method and compared with CRU data. The data so compiled was statistically analyzed to observe the changes in the last 51 years in the study area and its impacts on the ring widths of Spruce (P. smithiana) were assessed.
Collection and preparation of samples
The Two stage sampling method was employed for selection of sample trees. In the first stage, forest maps of the two Forest Divisions with the overlaid grid of 1 × 1 km were numbered for each cell, and twenty cells were selected at random for each Forest Division. In the second stage, the selected cells were magnified and overlaid with a grid of 0.1 × 0.1 km. All cells were numbered from which twenty cells were selected at random for each Forest Division. Samples distribution maps of the study areas for KFD are reproduced in Figure 2 and KaFD in Figure 3.
The finally selected cells were located in the field with the help of compartment history files and a healthy tree each of mature age, estimated at 60 years or above, in all the selected cells were sampled at random. Two increment cores from opposite directions at breast height were extracted from each sampled tree, using Pressler’s Increment Borer, by adopting the method as described by Stokes and Smiley (1968); Norton and Ogden (1987). The extracted core samples were placed in glass tubes and transferred to the Pakistan Forest Institute (PFI) Wood Anatomy Laboratory for analysis. The GPS coordinates, slope, aspect and elevation of the sample sites and diameters of the sampled trees were noted in the field book on the spot. Summaries of the data collection for Spruce at KFD and KaFD are reproduced in Tables 1 and 2 respectively.
Cross-dating and ring-width measurement
Cross-dating of the increment cores of the sampled trees from both the Forest Divisions was done to establish a precise chronology of the sample trees by the method described by Fritts and Swetnam (1989). The data of ring-widths were examined for narrow marker years and compared for those measurements which were out of phase. To ascertain the precise year of formation of such rings, the cores were reexamined for missing, broken, incomplete or wrongly counted rings and due corrections were made, as required. The process was repeated till all data was harmoniously shaped.
Table 1: GPS coordinates, slope, aspect, elevation and diameter of sample trees at KFD.
| Sample No. | Coordinates | Slope | Aspect | Elevation | Diameter (Cm) | |
| Latitude | Longitude | |||||
| 1 | 35° 8' 24.573" N | 72° 27' 35.096" E | 56% - 82% | South West | 2567 | 76 |
| 2 | 35° 7' 36.648" N | 72° 34' 5.565" E | 56% - 82% | West | 2006 | 56 |
| 3 | 35° 11' 38.867" N | 72° 31' 32.694" E | 56% - 82% | South East | 2030 | 64 |
| 4 | 35° 12' 1.688" N | 72° 33' 21.251" E | 56% - 82% | West | 1952 | 62 |
| 5 | 35° 13' 15.822" N | 72° 32' 43.008" E | 56% - 82% | South West | 1711 | 66 |
| 6 | 35° 13' 37.974" N | 72° 34' 33.733" E | 56% - 82% | North West | 1725 | 67 |
| 7 | 35° 10' 21.764" N | 72° 31' 42.564" E | 31% - 56% | East | 1474 | 58 |
| 8 | 35° 13' 16.364" N | 72° 30' 21.907" E | 0% - 31% | South West | 1753 | 57 |
| 9 | 35° 15' 37.842" N | 72° 33' 57.489" E | 0 %- 31% | South East | 2026 | 72 |
| 10 | 35° 14' 16.601" N | 72° 36' 41.985" E | 56% - 82% | South West | 2840 | 64 |
| 11 | 35° 17' 58.572" N | 72° 36' 34.207" E | 56% - 82% | South East | 1716 | 76 |
| 12 | 35° 18' 0.865" N | 72° 35' 53.906" E | 56% - 82% | South | 1962 | 59 |
| 13 | 35° 18' 32.305" N | 72° 37' 12.195" E | 56% - 82% | West | 2035 | 61 |
| 14 | 35° 20' 18.236" N | 72° 37' 0.283" E | 56% - 82% | West | 1987 | 63 |
| 15 | 35° 20' 45.376" N | 72° 36' 26.569" E | 56% - 82% | North East | 1891 | 72 |
| 16 | 35° 21' 52.398" N | 72° 36' 14.785" E | 56% - 82% | South West | 1819 | 63 |
| 17 | 35° 19' 53.326" N | 72° 38' 36.607" E | 31% - 56% | West | 1958 | 59 |
| 18 | 35° 20' 20.013" N | 72° 34' 42.280" E | 56% - 82% | North East | 2922 | 54 |
| 19 | 35° 19' 38.932" N | 72° 37' 59.346" E | 56% - 82% | North | 2016 | 53 |
| 20 | 35° 18' 21.904" N | 72° 35' 55.980" E | 31% - 56% | North East | 2334 | 67 |
Table 2: GPS coordinates, slope, aspect, elevation and diameter of sample trees at KaFD.
| Sample No. | Coordinates | Slope | Aspect | Elevation | Diameter (Cm) | |
| Latitude | Longitude | |||||
| 1 | 34° 52' 32.301" N | 73° 37' 38.038" E | 64% - 80% | North | 2682 | 66 |
| 2 | 34° 51' 40.905" N | 73° 36' 31.223" E | 64% - 80% | North East | 2747 | 61 |
| 3 | 34° 50' 52.935" N | 73° 35' 34.687" E | 26% - 47% | North | 2721 | 57 |
| 4 | 34° 50' 33.233" N | 73° 33' 45.041" E | 26% - 47% | North West | 2619 | 67 |
| 5 | 34° 51' 5.495" N | 73° 33' 4.170" E | 26% - 47% | South West | 2622 | 59 |
| 6 | 34° 49' 1.576" N | 73° 31' 45.973" E | 80% - 97% | North | 2603 | 56 |
| 7 | 34° 48' 5.897" N | 73° 29' 22.063" E | 80% - 97% | South East | 2775 | 76 |
| 8 | 34° 49' 31.557" N | 73° 32' 51.075" E | 47% - 64% | North | 2738 | 72 |
| 9 | 34° 50' 34.946" N | 73° 31' 28.841" E | 26% - 47% | South West | 2771 | 73 |
| 10 | 34° 42' 38.673" N | 73° 33' 22.769" E | 26% - 47% | North | 2578 | 63 |
| 11 | 34° 37' 44.857" N | 73° 29' 45.191" E | 64% - 80% | North West | 2654 | 69 |
| 12 | 34° 37' 8.023" N | 73° 28' 21.244" E | 64% - 80% | North West | 2467 | 60 |
| 13 | 34° 38' 54.243" N | 73° 34' 28.728" E | 64% - 80% | North West | 2396 | 62 |
| 14 | 34° 42' 20.685" N | 73° 24' 57.372" E | 64% - 80% | South East | 2645 | 52 |
| 15 | 34° 44' 9.474" N | 73° 24' 43.666" E | 64% - 80% | West | 2768 | 64 |
| 16 | 34° 40' 16.713" N | 73° 23' 8.997" E | 80% - 97% | West | 2175 | 69 |
| 17 | 34° 38' 31.350" N | 73° 28' 57.636" E | 64% - 80% | South East | 2339 | 60 |
| 18 | 34° 39' 9.898" N | 73° 29' 39.610" E | 80% - 97% | North West | 2025 | 71 |
| 19 | 34° 39' 2.188" N | 73° 32' 22.365" E | 80% - 97% | North East | 2441 | 65 |
| 20 | 34° 36' 57.124" N | 73° 29' 57.598" E | 26% - 47% | South East | 2453 | 64 |
Samples were air dried, surfaced using a razor blade and smoothened by application of successively finer grades sand paper mounted on an orbital sander. Slides of the samples were prepared through sledge microtome. The ring-widths were measured using Win Dendro system. For each of the sample trees 51 rings were measured starting from the outer periphery.
To reduce the impacts of ontogeny and other non-climatic factors on ring growth, the data were standardized by the method described by Fritts (1976). The measured data of ring widths were plotted against the years of growth and expected 146 values of ring-widths were calculated for estimation of standardized measurements which 147 were used for further analysis. Mean sensitivity (MSx), for assessing the response of trees to factors limiting the growth, particularly climatic elements, was calculated as the relative difference in width from 150 one ring to the next by applying the formula given by Fritts (1976).
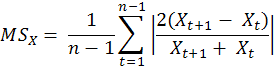
Where;
Xt= Ring-width at year t; Xt+1= Ring-width at year t+1; n= Total number of rings.
Climate growth function
Growth climate response of P. smithiana was assessed from standardized data of ring widths and mean annual maximum temperature, mean annual minimum temperature and mean annual precipitation by following Response Function Analysis techniques as described by Fritts (1976).
Statistical designs and analyses
Maximum temperature, minimum temperature, mean temperature and precipitation parameters of climate and ring-widths data based on the means of 20 sample trees were analyzed using best fit regression models at a confidence interval of 95 %. The trends in the climate and ring-widths changes were determined by applying Mann Kendall test. The significance levels of variations in the climate and growth parameters were assessed by analysis of variance and applying independent t-test (Bajwa et al., 2015). The impact of climate factors on ring-widths was measured by Response function taking climate factors as independent variables. The correlation of climate change with ring-widths was estimated through Pearson Correlation formula.
Results and Discussion
Comparison of temperature and precipitation regimes, changes therein and trends at KFD and KaFD
The mean annual maximum temperature, mean annual minimum temperature and mean annual temperature and mean annual precipitation in KFD and KaFD for the period 1965-2015, changes therein and trends over the same period are illustrated in Tables 3, 4 and 5.
Table 3: Comparison of temperature and precipitation regimes at KFD and KaFD (1965-2015).
| Climatic Factors | KFD | KaFD | p-value |
|
Mean Annual Maximum Temp (0C) |
7.87 | 10.99 | 0.000 |
|
Mean Annual Minimum Temp (0C) |
-3.36 | 0.86 | 0.000 |
|
Mean Annual Temp (0C) |
2.25 | 5.91 | 0.000 |
| Mean Annual Precipitation (mm) | 361 | 766 | 0.000 |
The findings of the study on temperature and precipitation regimes in KFD and KaFD over the time period of 1965-2015 are in consonance with corresponding results previously reported by Bukhari and Bajwa (2011); where the mean annual maximum temperature, mean annual minimum temperature, mean annual temperature and mean annual precipitation are 7.78 °C, -3.47 °C, 2.15 °C and 362.60 mm respectively in Dry Temperate zone (Greater Himalayan Region) and 11.66 °C, 1.59°C, 6.61 °C and 747.35 mm respectively in Moist Temperate zone of Pakistan, for the period 1961-2000. The current findings are a bit higher than the previously reported ones, except for precipitation in KFD which is slightly lower. The differences in the reported values are attributed to the difference in the periods and extent of the areas covered in the two studies. The period covered in the previous study is 40 years (1961-2000) compared to 51 years (1965-2015) in the current one, while the area covered in the previous study is wider covering the entire biomes of Dry Temperate and Moist temperate in Pakistan while the latter one is confined to the boundaries of the two Forest Divisions. The findings of the current study on changes in temperature regimes are in conformity with and in the precipitation at variance with Bukhari and Bajwa (2011); who reported changes of 0.44, 0.99, 0.71 °C and 11.18 mm at Dry Temperate zone (Greater Himalayan Region) and 0.43 C, 0.92, 0.67 °C and 16.72 mm at Moist Temperate zone of Pakistan for the period 1961-2000. Several regions of the globe are confronted with changes in water cycle, in terms of quantity and duration of runoff, frequency and intensity of floods and droughts and rainfall patterns (Jiang et al., 2007). Temperature is a prime element of the global energy system, which influences water cycles (Behbahani et al., 2009).
Table 4: Comparison of changes in temperature and precipitation at KFD and KaFD (1965-2015).
| Climate Characteristics | KFD | KaFD | p-value |
| Max. Temperature (°C) | 0.46* | 0.47* | 0.167 |
| Min. Temperature (°C) | 1.02* | 0.99* | 0.253 |
| Mean Temperature (°C) | 0.74* | 0.73* | 0.229 |
| Annual Precipitation (mm) |
-3ns |
90* | 0.035 |
*significant change at p<0.05, ns Non-significant change at p<0.05.
The findings of this study on changes in precipitation indicate a net decrease of 3 mm at KFD and a net increase of 90 mm at KaFD, compared to corresponding increase of 11.18 mm and 16.72 mm reported by Bukhari and Bajwa (2011). This configuration of differences in temperature and precipitation indicates that the temperature signal is uniform over wider areas causing similar changes while factors affecting magnitude of precipitation vary at shorter distances, and the resultant changes are more locality specific with changes at shorter distances. The higher increase in temperature parameters reported in this study is also in line with previous findings of increasing temperature at the end of 20th century and the beginning of the 21st century (Esper et al., 2002; IPCC, 2007).
These increases may be attributed to various factors, including a number of physical ones (IPCC, 2007; Grunewald et al., 2009) and human interventions (Foley et al., 2005; Falcucci et al., 2007; Vorholz, 2009) which influence climate processes at local, regional and global levels. Out of these factors, human activities have been found the major cause of temperature increase (Knutson et al., 2006). The changes in temperature at local levels may also be explained as associated with increasing anthropogenic activities in the study area, particularly in the tourism sector, and urbanization which can likely act as the cause of heat islands. Such heat islands’ effect has been reported by Wu et al. (2010). The findings of this study also show a higher increase in minimum temperature compared to maximum temperature, thus leading to the inference that nights are becoming warmer at higher rates compared to day time. These findings support the earlier assessment reported by Bukhari and Bajwa (2009, 2011). The results of the study on trends in climatic factors, i.e., rising trends in mean annual maximum temperature, mean annual minimum temperature, mean annual temperature in the two Forest Divisions during 1965-2015 and erratic pattern in precipitation (increase in KaFD and slight decrease in KFD in the same period) are broadly in conformity with IPCC (2014).
The comparison of mean values of climate regime of KFD and KaFD over the time period of 1965-2015 shows a highly significant difference (p<0.01) between the two forest divisions. The climate regime at KaFD is higher both for temperature parameters and precipitation compared to KFD. These differences are mainly based on difference in altitudinal and latitudinal spreads of the two Forest Divisions. Based on these location factors and associated climatic conditions, forests in the lower areas of KaFD is ecologically classified as moist temperate while in the upper areas as dry temperate. In comparison, the entire forest areas of KFD are classified as Dry Temperate and are outside the reach of monsoon clouds. This basic difference in the climate regimes of
Table 5: Trends in climatic factors at KFD and KaFD (1965-2015).
| Climatic Factors | Z - value | P value | Trend | |||
| KFD | KaFD | KFD | KaFD | KFD | KaFD | |
|
Mean Annual Maximum Temperature (0C) |
4.20 | 3.28 | 0.000 | 0.000 | Upward | Upward |
|
Mean Annual Minimum Temperature (0C) |
4.66 | 4.61 | 0.000 | 0.000 | Upward | Upward |
|
Mean Annual Temperature (0C) |
4.27 | 5.57 | 0.000 | 0.000 | Upward | Upward |
| Mean Annual Precipitation (mm) | - 0.03 | 2.95 | 0.120 | 0.002 | No trend | Upward |
the two forest divisions is manifested in composition and productivity of the forests and effects on the growth-climate response of spruce in the two forest divisions.
The comparison of changes in climatic factors of the two Forest Divisions during 1965-2015 indicates an increase in temperature in both Forest Divisions, and an increase in precipitation in KaFD but a slight decrease in KFD. This pattern of climate change indicates that changes in temperatures in the two Forest Divisions, though geographically located at an aerial distance of about 50 kilometers, are still in the same direction, but differ significantly in magnitude. However, changes in precipitation are not uniform in the two Forest Divisions and exhibit local variations. These findings are in accordance with the global patterns of climate parameters reported by IPCC (2014). The findings are also in conformity with Ahmed et al. (2013) who reported a negative relationship of tree ring-widths with May-June temperature and positive relation with March-April precipitation for Picea smithiana and Juniperus excelsa in Gilgit, Pakistan. The existence of these patterns of climate change in the two Forest Divisions produce distinct climate signals in tree growth, i.e., different growth responses, as practically observed and reported in this study.
Mean sensitivity and variance of ring-widths
Mean Sensitivity and variance of the standardized ring-widths of the sampled trees from both the Forest Divisions are summarized in Table 6.
Table 6: Comparison of statistics of mean sensitivity of ring-widths of Spruce at KFD and KaFD (1965-2015).
| Statistics | KFD | KaFD |
| Mean ring-width (mm) | 1.36 | 1.48 |
| Mean Sensitivity (MS) | 0.25 | 0.33 |
| Standard Error (mm) | 0.09 | 0.11 |
|
Variance (σ2) (mm) |
0.13 | 0.12 |
| Coefficient of Variation (CV) (%) | 26.51 | 23.41 |
Comparison of ring-widths of spruce, changes therein and trends at KFD and KaFD
Ring-widths of Spruce and changes thereof on the inter-annual basis in KFD and KaFD for the period 1965-2015, changes therein and trends were assessed. The results are reproduced in Table 7 and 8.
Table 7: Comparison of ring-widths of Spruce and changes thereof at KFD and KaFD (1965-2015).
| Ring-widths Characteristics | KFD | KaFD | p-value |
| Mean Annual Ring-width (mm) | 1.36 ± 0.02 | 1.48 ± 0.02 | 0.00 |
| Changes in Mean Annual Ring-width (mm) | - 0.11 | - 0.13 | 0.00 |
| Change in Mean Annual Ring-width (%) | - 8.0 | - 8. 8 | 0.00 |
Table 8: Comparison of trends in tree ring-widths of spruce at KFD and KaFD (1965-2015).
| Forest Division | Z- value | p-value | Trend |
| KFD | 6.25 | 0.00 | Downward |
| KaFD | 5.18 | 0.00 | Downward |
The results of the mean sensitivity and variance analysis of the standardized data of the ring-widths measured from increment cores of the sampled trees from both the Forest Divisions for the period 1965-2015 indicated mean sensitivity of Spruce in KFD as 0.25±0.09 and in KaFD as 0.33±0.11. The mean sensitivity of Spruce is higher in KaFD compared to KFD. The variance of ring-widths in the two Forest Divisions were 0.13 and 0.12 respectively. As indicated by the MS values, the impact of climate is higher in KaFD compared to KFD. The results of mean sensitivity and variance show a wide range of variability in growth parameters enabling analysis of its correlation and regression with climate factors and changes therein.
The mean sensitivity range assessed by this study is in agreement with mean sensitivity values of 0.23 to 0.42 previously reported by Ahmed et al. (2010) for
Table 9: Summary of correlation and response function of ring-widths (mm) of spruce at KFD and KaGD (1965-2015).
| Climatic Factors | Forest Division | Correlation Coefficient(r) | R2 | p-Value | Regression Model |
| Mean Maximum Annual Temperature(°C) | KFD | -0.57 | 0.44 | 0.000 | Y = 3.3250 – 0.2495 X |
| KaFD | -0.39 | 0.65 | 0.000 | Y = 5.0360 – 0.3225 X | |
| Mean Minimum Annual Temperature(°C) | KFD | -0.47 | 0.50 | 0.000 | Y = 0.9957 – 0.1103 X |
| KaFD | -0.49 | 0.53 | 0.000 | Y = 1.5733 – 0.1185 X | |
| Mean Annual Temperature(°C) | KFD | -0.53 | 0.44 | 0.000 | Y = 1.6833 – 0.1478 X |
| KaFD | -0.67 | 0.67 | 0.000 | Y = 2.4200 - 0.1593 X | |
| Mean Annual Precipitation (mm) | KFD | 0.13 | 0.56 | 0.000 | Y= -12.13 + 0.0374 X |
| KaFD | 0.25 | 0.52 | 0.000 | Y = 12.552 – 0.0014 X |
Picea smithiana, Cedrus deodara, Pinus gerardiana and Juniperus excelsa in the Upper Indus Basin of Himalayan region of Pakistan. The minor variations in the two sets of the mean sensitivity values may be emanating from the differences in site variation, as apart from tree species, mean sensitivity values depend on site conditions (Bogino and Bravo, 2009). The results of this study indicate considerable variability of mean sensitivity values due to high frequency component of ring-widths due to climatic fluctuations, and in CV due to low frequency component caused either by climate fluctuations or other long term non-climatic factors.
The study results indicated that the mean annual ring-width of Spruce in KFD during 1965-2015 was 1.36±0.02 mm and changes therein during the same period – 0.11 mm or -8.0 %, with decreasing trend. The mean annual ring-width of Spruce in KaFD was 1.48±0.02 mm and changes therein during the same period – 0.13 mm or - 8.8 %, with a decreasing trend.
The comparison of mean annual ring-widths of Spruce in the two Forest Divisions indicates a highly significant (p<0.01) difference. The mean annual ring-widths of Spruce is higher in KaFD compared to KFD. As the climate signals and changes therein in the two Forest Divisions vary in magnitude for temperature and in both magnitude and direction for precipitation, which would naturally result in different growth outcomes. However, the final outcome of such differences is also affected by other factors, like edaphic, physiographic, biotic and forest internal and external environments. It also appears that KaFD, being partly in Moist Temperate zone, has exhibited higher impacts of climate change with a larger decrease in ring-widths compared to KFD. The observed growth pattern confirms the overall negative impact of climate change on ring-width growth.
The comparison of changes in mean annual ring-widths of Spruce in the two Forest Divisions during 1965-2015 indicate a significantly (p>0.05) large decrease in mean annual ring-widths in KaFD compared to KFD. However, the trends are downward in both the Forest Divisions.
Growth-climate relationships of spruce in KFD and KaGD
Correlation of ring-width with temperature parameters and precipitation and response function analysis of Spruce in KFD and KaGD for the period 1965-2015 are reproduced in Tables 9.
The correlation between mean maximum annual temperature and ring widths of Spruce at KFD during 1965-2015 was found negative and highly significant (r = - 0.57; p<0.01). The regression model was linear, with R2 value of 0.44, indicating a good fit of the model. Similar analysis for KaFD showed a negative and highly significant (r = - 0.39; p<0.01) correlation. The regression model was linear, with R2 value of 0.65, indicating a good fit of the model.
The correlation between mean minimum annual temperature and ring widths of Spruce at KFD during 1965-2015 was found negative and highly significant (r = -0.47; p<0.01). The regression model was linear, with R2 value of 0.50, indicating a good fit of the model. Similar analysis for KaFD showed a negative and highly significant (r = -0.49; p<0.01) correlation. The regression model was linear, with R2 value of 0.53, indicating a good fit of the models.
The correlation between mean annual temperature and ring widths of Spruce at KFD during 1965-2015 was found negative and highly significant (r = -0.53; p<0.01). The regression model was linear, with R2 value of 0.44, indicating a good fit of the model. Similar analysis for KaFD showed a negative and highly significant (r = -0.67; p<0.01) correlation. The regression model was linear, with R2 value of 0.67, indicating a good fit of the model.
The correlation between mean annual precipitation and ring widths of Spruce at KFD during 1965-2015 was found positive and significant (r = 0.13; p=0.000). The regression model was linear, with R2 value of 0.56, indicating a good fit of the model. Similar analysis for KaFD showed a positive and highly significant (r = 0.15; p<0.01) correlation. The regression model was linear, with R2 value of 0.52, indicating a poor fit of the model.
The comparison of correlation and climate response functions of Spruce in KFD and KaFD indicates similar patterns of correlation and mathematical expressions in the two Forest Divisions, which are highly significant (p<0.01) and negative with temperature parameters and highly significant (p<0.01S) and positive with precipitation, with linear patterns. The values of R2 for ring widths are high, indicating a good fit of the linear models.
Conclusions and Recommendations
KFD and KaFD, geographically separated by about 50 Km aerial distance and having different latitudinal and elevational spreads, have significantly different climate regimes in temperature and precipitation, supporting the growth of various tree species, including Spruce (Picea smithiana). Mean annual maximum temperature, mean annual minimum temperature and mean annual temperature in the two Forest Divisions during 1965-2015 have significantly increased, but with different magnitudes, while mean annual precipitation has significantly increased in KaFD, but non-significantly decreased in KFD. The mean values of ring-widths of Spruce at KFD and KaFD during 1965-2015 are 1.36±0.02 mm and 1.48±0.02 mm and changes therein during the same period are – 0.11 mm (-8.0 %) and – 0.13 mm (- 8.8 %) respectively, with decreasing trends. The mean annual ring widths of Spruce for the period 1965-2015 indicate a highly significant (p<0.01) difference between KFD and KaFD, and a significant (p<0.05) decrease in mean annual ring-widths in KaFD compared to KFD. The comparison of correlation and climate response functions of Spruce in KFD and KaFD indicates similar patterns in the two Forest Divisions, which are highly significant (p<0.01) and negative with temperature parameters and non-significant (p>0.05) and positive with precipitation, both following linear patterns. The values of R2 for ring-widths are high, indicating a good fit of the linear models.
Novelty Statement
Pioneer work in comparative study of climate change in Kalam and Kaghan valleys, Khyber Pakhtunkhwa, and comparative study of impacts of climate change on ring-widths of spruce (Picea smithiana) at Kalam and Kaghan Forest Divisions, Khyber Pakhtunkhwa, Pakistan.
Author’s Contribution
Hakim Shah: This is a part of his PhD, planned and executed and drafted the manuscript.
Noor Jehan: Supervised the PhD research, clorrected the manuscript.
S. Shafiqur: Co-supervised the PhD, guided in writing the manuscript.
Syed Said Badshah Bukhari: Contributed in planning and data analysis environmental sciences.
References
Ahmed, M., M. Wahab, N. Khan, M.U. Zafar and J. Palmer. 2010. Tree-ring chronologies from upper Indus basin of Karakorum Range, Pakistan. Pak. J. Botany. (42): 295-207.
Ahmed, M., M.U. Zafar, A. Hussain, M. Akbar, M. Wahaband and N. Khan. 2013. Dendroclimatic and dendrohydrological response of two tree species from Gilgit valleys. Pak. J. Bot. (45): 987-992.
Bajwa, G.A., M.K. Shahzad and H.K. Satti. 2015. Climate change and its impacts on growth of blue pine (Pinus wallichiana) in Murree forest division, Pakistan. Sci. Tech. Dev. 34 (1): 27-34. https://doi.org/10.3923/std.2015.27.34
Behbahani, S.M.R., A. Rahimikhoob and M.H. Nazarifar. 2009. Comparison of some split window algorithms to estimate land surface temperature from AVHRR data in Southeastern Tehran, Iran. Desert 14: 157-161.
Bogino, S. and F. Bravo. 2009. Climate and intra-annual density fluctuations in Pinus pinaster subsp. Mesogeenes in Spanish woodlands. Can. J. For. Res. 39: 1557-1565. https://doi.org/10.1139/X09-074
Bukhari, S.S.B. 2011. Participatory forestry management development trends in Pakistan. Paper presented at: Regional Conference on Participatory Forest Management: Bhopal, India.
Bukhari, S.S.B. and G.A. Bajwa. 2009. Temporal temperature rise and its effects on other climatic factors. Pak. J. Forest. 58(1): 1-18.
Bukhari, S.S.B. and Bajwa, G.A. 2011. Climate change trends over coniferous forests of Pakistan. Pak. J. Forest. 61(2): 1-14.
Bukhari, S.S.B. and G.A. Bajwa. 2012. Development of national response strategy to combat impacts of climate change on forest of Pakistan. Peshawar. Pak. For. Inst. pp. 156.
Esper, J., E.R. Cook and F.H. Schweingruber. 2002. Low-frequency signals in long tree-ring chronologies for reconstructing past temperature variability. Sci. 295 (5563): 2250-2253. https://doi.org/10.1126/science.1066208
Falcucci, A., L. Maiorano and L. Boitani. 2007. Changes in land-use/land-cover patterns in Italy and their implications for biodiversity conservation. Landscape Ecol. 22: 617-631. https://doi.org/10.1007/s10980-006-9056-4
Foley, J.A., R. DeFries, G.P. Asner, C. BarFordand and G. Bonan. 2005. Global consequences of land use. Sci. 309 (5734): 570-574. https://doi.org/10.1126/science.1111772
Fritts, H.C. 1976. Tree-rings and climate. Academic press, London. H.C. Fritts and T.W. Swetnam. 1989. Dendroecology: A tool for evaluating variations in past and present forest environment. Adv. Ecol. Res. 19 ISBN 0-12013919-7. https://doi.org/10.1016/S0065-2504(08)60158-0
Fritts, H.C. and T.W. Swetnam. 1989. Dendroecology: A tool for evaluating variations in past and present forest environment. Advances in Ecological Research. 19 ISBN 0-12-013919-7.
Gosling, S.N., J.A. Lowe, G.R. McGregor, M. Pelling and B.D. Lalamud. 2009. Association between elevated atmospheric temperature and human mortality: a critical review of the literature. Clim. Change, 92: 299-341.
Grunewald, K., J. Scheithauer, J.M. Monget and D. Brown. 2009. Characterization of contemporary local climate change in the mountains of southwest Bulgaria. Clim. Change. 95: 535-549. https://doi.org/10.1007/s10584-008-9508-8
Jiang, T., Z.W. Kundzewicz, and B. Su. 2007. Changes in monthly precipitation and flood hazards in the Yangtze River Basin, China. Internat. J. Climatol. 10.1002/joc.1635.
Knutson, T.R., T.L. Delworth, K.W. Dixon, I.M. Held, J. Lu, V. Ramaswamy and M.D. Schwarzkopf. 2006. Assessment of twentieth-century regional surface temperature trends using the GFDL CM2 coupled models. J. Climate 19: 1624-51.
IPCC. 2007. Climate change 2007: Synthesis report. Contribution of working groups I, II and III to the Fourth assessment report of the intergovernmental panel on climate change [Core writing team, pachauri, R.K and Reisinger, A. (Eds.)]. IPCC, Geneva, Switzerland, pp. 104.
IPCC. 2014. Climate change 2014: Synthesis report. 5th Assessment report of the intergovernmental panel on climate change. Pachauri, R.K. and Reisinger, A. (Eds.). Geneva.
Khan, N., M. Ahmed and M. Wahab. 2008. Dendroclimatic potential of Picea smithiana (Wall) Boiss, from Afghanistan. Pak. J. Bot. 40(3): 1063-1070.
Norton, D.A. and J. Ogden. 1987. Dendrochronology: a review with emphasis on New Zealand applications. New Zealand J. Ecol. 10: 77-95.
Shaffer, G., S.M. Olsen and G.O.P. Pederson. 2009. Long term ocean oxygen depletion in response to carbon dioxide emissions from fossil fuels. Nat. Geosci. 2: 105-109. https://doi.org/10.1038/ngeo420
Stokes, M.A., and T.L. Smiley. 1968. An introduction to tree-ring dating. University of Arizona Press, Tucson, AZ.
Vorholz, F. 2009. Global climate protection. Deutschland 5: 8-13.
Wu, Z., H. Zhang, C.M. Krause and N.S. Cobb. 2010. Climate change and human activities: A case study in Xinjiang, China. Clim. Change 99:457472.
To share on other social networks, click on any share button. What are these?


