Abstract
Nanostructured deposits of ammonia (NH3) sensitive ZnO and ZnO-CuO composites were fabricated on a graphite electrode via electrophoretic deposition (EPD). Deposition was done by holding the applied voltage and deposition time constant at room temperature. Testing of sensing properties of the deposits was conducted using Wheatstone bridge circuit. SEM micrographs show a more open structure and more exposed surface area of the pure ZnO deposit compared to the ZnO-CuO deposit. The average particle size deposited at 500V for ZnO and ZnO-CuO were 241nm and 260nm respectively; whereas at 750V the average particle size is 195nm and 276nm, respectively. Deposits with greater surface area, smaller particle sizes and thicker deposits exhibit high gas sensitivity. On the other hand, addition of CuO resulted to a more compact and dense surface structure and decreased gas sensitivity. Thus, particle size and the surface structure of the deposits dictate the sensitivity of the material.
electrophoretic deposition; zinc oxide; copper oxide; ammonia; gas sensitivity
Electrophoretic fabrication of ZnO/ZnO-CuO composite for ammonia gas sensing
Ryan Dula CorpuzI,* * e-mail: ryan.corpuz@g.msuiit.edu.ph ; Jason Rayala AlbiaII
ICollege of Engineering, Iligan Institute of Technology, Mindanao State University-MSU, Iligan, Lanao del Norte, Philippines
IIInstitute of Mathematical Sciences and Physics, University of the Philippines Los Baños - UPLB, Los Baños, Laguna, Philippines
ABSTRACT
Nanostructured deposits of ammonia (NH3) sensitive ZnO and ZnO-CuO composites were fabricated on a graphite electrode via electrophoretic deposition (EPD). Deposition was done by holding the applied voltage and deposition time constant at room temperature. Testing of sensing properties of the deposits was conducted using Wheatstone bridge circuit. SEM micrographs show a more open structure and more exposed surface area of the pure ZnO deposit compared to the ZnO-CuO deposit. The average particle size deposited at 500V for ZnO and ZnO-CuO were 241nm and 260nm respectively; whereas at 750V the average particle size is 195nm and 276nm, respectively. Deposits with greater surface area, smaller particle sizes and thicker deposits exhibit high gas sensitivity. On the other hand, addition of CuO resulted to a more compact and dense surface structure and decreased gas sensitivity. Thus, particle size and the surface structure of the deposits dictate the sensitivity of the material.
Keywords: electrophoretic deposition, zinc oxide, copper oxide, ammonia, gas sensitivity
1. Introduction
Nanostructured zinc oxide is one of the most attractive semiconducting oxides due to its technological applications. It has been incorporated in various areas such as paint industry, biomedicine, environmental engineering, transparent and spin electronics, surface acoustic devices, thin film transistor, and chemical and biosensing1-5. These applications are attributed to the unique and highly modifiable properties, environmental safety, and stability of ZnO. Consequently, issues of fabrication methods and technologies to optimize the desired properties have been a central topic for materials and engineering research. Several studies have incorporated other materials by way of doping and composite to enhance specific properties of ZnO. Cu2+, Pb2+, Ga, Ag, Au, CdTe, CuInSe2, CdS, and other polyelectrolyte are some of the elements and compounds that were combined with ZnO to improve structural, morphological, optical, and electrical properties to address specific interests6-12.
At present, surge of researches focused on fabricating and innovating ZnO and its composite materials for gas sensing application13-18. In gas sensing using semiconducting oxides, the widely accepted generalized model to describe its mechanism is the adsorption-desorption reaction of reactive elements in the vacant sites leading to changes in conductivity of the material. The change in conductivity is primarily due to the change of bulk charge carrier concentration and surface band bending due to chemisorbed surface species. The gas sensitivity is therefore influenced by some microstructural properties such as grain size, surface geometry, connectivity between grains, and space-charge layer depth. This is one particular reason why nanometer scale and porous material are expected to exhibit higher sensitivity than impermeable bulk form. The large surface to volume area will lead to more vacant sites that promote more surface reactions2,4,10,18,12.
In this study, ZnO and ZnO-CuO were fabricated using EPD on graphite electrode. Aside to its simplicity and low cost, reports affirm that EPD has been successful in fabricating nanostructured ZnO composite19. The fabricated materials were subjected to gas and their electrical responses were measured. Specifically, the addition of CuO to ZnO is aimed to improve the gas sensitivity of resulting material. Ammonia which posts high technological importance in areas of agriculture, industry, and household commercial product was used as test gas20.There are reports regarding unmonitored critical concentration of NH3 can lead to potentially hazardous exposure, thus development of NH3 sensor is of significant importance21,22.
2. Experimental Procedure
2.1. Materials preparation
All chemicals and reagents used in the experiment were used as received from the manufacturer without further purification. These were ZnO powder (99.5 % pure, HIMEDIA®), CuO powder (96.0% extrapure, HIMEDIA®) and acetone CH32C0 (Technical Grade). ZnO and CuO were ground using mortar-pestle for 4 hours to ensure sufficiently fine particles. About 2.00 g of ZnO powder were mixed to acetone to prepare 0.50 M solution. ZnO-CuO-acetone mixture was prepared by adding 1.00 g of CuO to 0.5 M ZnO-acetone suspension. To ensure homogeneity of solution, the mixtures were sonicated for 1.0 hour.
2.2. Stability test
Stability of the ZnO particles in acetone was conducted by preparing 1 g of ZnO powder. The powder was then dissolved in a 30 ml acetone and was thoroughly mixed using a magnetic stirrer for 2 minutes. The resulting mixture was then ultrasonicated for 10 minutes, and magnetically stirred again for 2 minutes. The prepared suspension was then poured in a 100 ml graduated cylinder initially filled with 70 ml acetone. The particles were then allowed to settle for 10 minutes. For the stability test of CuO particles in acetone, the procedure enumerated for determining the stability of ZnO was also followed.
2.3. Electrophoretic deposition
Figure 1 shows the EPD set-up used in the experiment. Two 2.0 cm length cylindrical graphite rods (6B Steadler®) with constant separation length of 2.0 cm were used as electrodes for the deposition process carried out at laboratory temperature. The deposition potential was varied to 500V and 750V for a constant deposition time of 10.0 minutes for all the runs. The length of submerged part of the electrode is 2.0 cm.
2.4. Characterization and gas sensitivity test
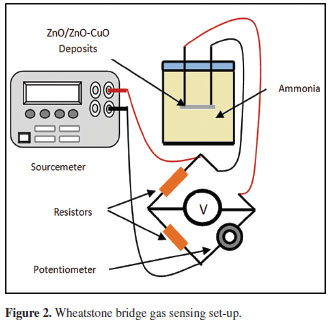
A SHIMADZU XRD 700 X-ray diffractiometer was used to verify existence of ZnO and ZnO-CuO deposits. The morphological features were analyzed under JEOL JSM 5310 Scanning Electron Microscope.The gas sensitivity was measured using Wheatstone bridge gas sensing set-up which is depicted in Figure 2. In principle, the voltage across the bridge changes if any component of the circuit changes its electrical properties due to induced stimuli. In this set-up, NH3 serve as the stimuli while the deposits serve as the sensitive component. The ZnO and ZnO-CuO deposits were placed in a closed chamber and exposed to NH3. The gas sensitivity test was carried out at laboratory condition. A constant voltage of 0.1mV (Keithley®) was applied in all sensitivity tests. Electrical response of the deposits in the presence of NH3 was measured using voltmeter (Keithley® Model 2182). The areas of exposure to NH3 of the deposits obtained from different deposition parameters are approximately equal. In this study, gas sensitivity is defined as GS = |Vg - Va / Va| where GS is the gas sensitivity, Vg is the voltage reading when exposed to NH3, and Va is the voltage reading in the absence of NH3. In measuring gas response, three samples per deposition parameter were tested and the average response was normalized and is reported.
3. Results and Discussions
3.1. Stability test
To assess the stability of the suspension, settling behavior of both ZnO and CuO powder with respect to acetone were investigated.
Figure 3 shows the stability of CuO and ZnO in acetone after 10 minutes. This result clearly indicates that ZnO is more stable than CuO because there are more suspended ZnO particles compared to CuO particles. Moreover, it is also visible23 there are more particles of CuO that had already settled on the bottom compared to ZnO particles. This more stable condition of ZnO compared to CuO could be attributed to the smaller particle sizes of the former which are not greatly affected by gravitational force.
3.2. Deposition current
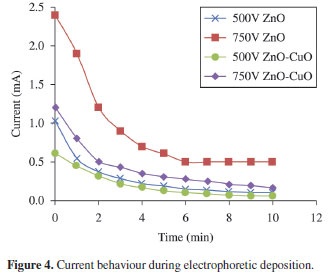
The current behavior was observed during the entire deposition process. Figure 4 shows the different current transients due to variability of deposition parameters. The decreasing trend of the current for all the deposition runs is similar with other studies of EPD reported elsewhere24. The deposition current is initially linear with time but as the deposition proceeds, the current continuously decreases to a certain value. The decrease in current implies decrease in electric field due to the formation of insulating layer of ceramics to the surface of the electrodes. Deposition carried out at higher potential resulted to higher deposition current.
The addition of CuO shows an apparent decrease in current. The presence of CuO decreases the mobility of charges in the suspension. Consequently, the resistivity of the suspension increases which is manifested by the apparent decrease in the deposition current. This observation is consistent to some reported studies that a high ionic concentration will cause instability of the suspension thereby inhibiting the movement of ceramic particles24,25.The stability of the suspension in EPD dictates the success and quality of the material formation in the substrate. Qualitative investigation of the deposits implies that the suspension current is proportional to the deposition yield. High current resulted to high deposition yield. Thicker deposit of around 0.2mm was obtained at 750V compared to the 0.1 mm thickness obtained at 500 V. Furthermore, in the presence of CuO, the particles in the suspension tend to settle faster compared to that of pure ZnO. This is also evidence that the addition of CuO caused instability of the suspension.
3.3. Structure and morphology
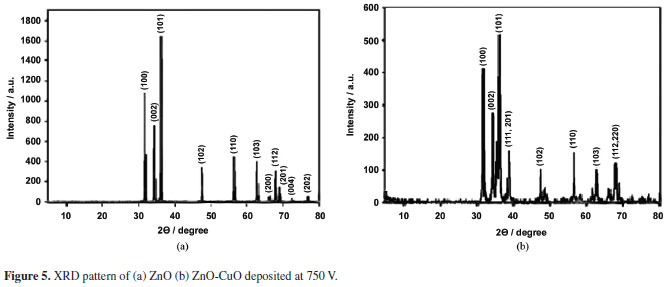
XRD pattern shown in Figure 5a illustrates the 11 characteristic peaks of ZnO. The peaks at 2θ values of 31.76, 34.42, 36.26, 47.54, 56.60, 62.86, 66.36, 67.94, 69.08, 72.54, and 76.98 which correspond to the crystal plane of 110, 002, 101, 102, 110, 103, 200, 112, 201, 004, and 202 respectively, are in good agreement with current observations. The diffraction peaks agree with the JCPDS card No 36-1451 which correspond to the hexagonal wurtzite structure of ZnO. Figure 5b on the other hand shows the combined peaks of ZnO and CuO after deposition. This result indicates that ZnO-CuO composite was formed in the process.
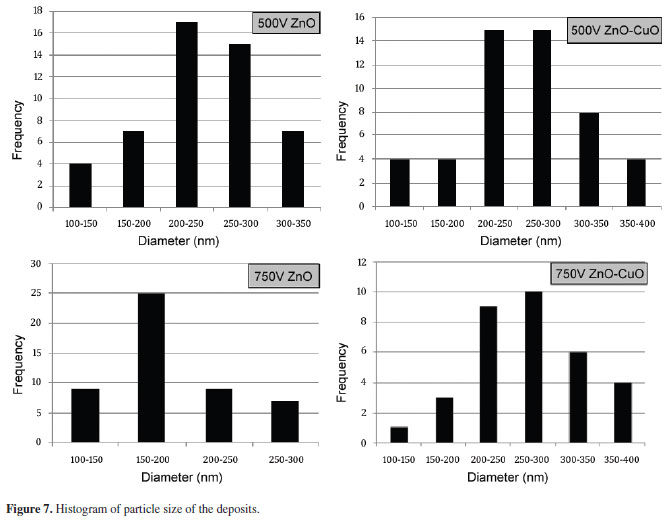
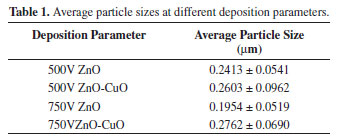
Figure 7 depicts the particle size measured using ImageJ® software and the average particle size was calculated using Microcal Origin®. Based on particle size, deposits obtained from pure ZnO exhibit a more homogenous surface structure as observed in Figures 6a and 6c. The mode of particle size of pure ZnO deposits obtained at 500V and 750V is 201-250nm. The addition of CuO in the suspension resulted to a more variable and larger particle size as illustrated in Figures 6b and 6d. The mode of the distribution obtained from 500V and 750V of ZnO-CuO deposits is 201-300nm.
Table 1 shows the calculated average particle size in each deposition parameter. The average particle size deposited at 500V for ZnO and ZnO-CuO were 241nm and 260nm, respectively. Whereas ZnO and ZnO-CuO deposited at 750V have particle size of 195nm and 276nm, respectively. ZnO deposit obtained at 750V display the smallest average particle diameter. Largest particle size was observed at ZnO-CuO deposits obtained at 750V.
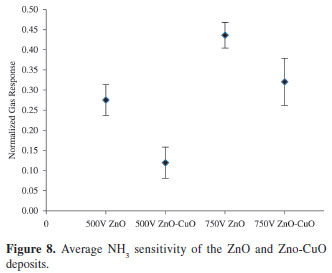
3.4. Gas sensitivity
Figure 8 and Table 2 depict the sensitivity of the material deposited at different parameters when exposed to same amount of NH3. Apparently, pure ZnO deposits obtained at 500V and 750V exhibit a higher sensitivity than with the presence of CuO. At 500V deposition potential, the addition of CuO resulted to a decrease in sensitivity from 27.65%-12.02%. The same result was observed at 750V where the sensitivity decreases from 43.73%-32.20%. As observed in the SEM images (Figure 6), pure ZnO deposits have more open structure and smaller particle sizes compared to the ZnO-CuO deposits. Varying the deposition potential influence the surface structure of the material formed on the substrate. As cited by various literatures10,16, the gas sensitivity of the material is highly dependent on the structure, particle size and the surface area. The more open the structure and the smaller the particles are, the larger the surface area will be available for gas molecules to react with to significantly change the bulk charge concentration. Since NH3 is a reducing gas, it is expected that when gas molecules penetrate an n-type material such as ZnO, they attach themselves to the vacant lattice holes which in effect increases the conductivity of the material25. This widely accepted theory in gas sensing mechanism is validated in this experiment. The measured voltage across the bridge decreases when the material is exposed to NH3. This implies that in the presence of NH3, the conductivity of the material increases. The sensitivity of ZnO to NH3 can be attributed to the change in bulk carrier concentration of ZnO due to the interaction of gas molecules and surface structure.
The addition of CuO in the deposition resulted to a decrease in sensitivity. The most sensitive deposit was obtained at 750V of pure ZnO which has the most open structure, homogenous particle sizes and a thicker deposit. The deposit obtained at 750V of ZnO-CuO composite shows a compacted smooth morphology of CuO which reduces the sensitivity of the material. The smooth deposit possibly inhibits the penetration of gas molecules to the bulk assembly of the material. Consequently, minimal charge carriers are added to the bulk concentration. In effect, the expected increase in sensitivity in the presence of CuO was not attained.
4. Conclusion
The study is successful in fabricating nanostructured NH3 sensitive ZnO and ZnO-CuO deposits via EPD. Deposition potential and the addition of CuO influence the resulting morphological properties of the deposits, thereby affecting its sensing property. SEM results show that the particles of pure ZnO deposited at 500V and 750 V are much smaller compared to the particles of the deposited ZnO-CuO composite. In addition, the surface structure of the deposited pure ZnO is more open and exposed than the surface structure of the ZnO-CuO deposit which could be the main reason of the higher sensitivity to NH3 of the latter compared to the former in the two voltages considered.
Acknowledgements
The authors would like to acknowledge the support of Prof. Marvin U. Herrera who provided tremendous intellectual contributions to the researchers. Also, Ms. Armida V. Gillado and Ms. Stephanie Tomampos deserve special recognition for technical assistance during the experimentation.
Received: September 20, 2013
Revised: April 17, 2014
- 1. Patil DR and Patil LA. Ammonia sensing resistors based on Fe2O3-Modified ZnO thick films. IEEE Sensors Journal 2007;7(3):434-439. http://dx.doi.org/10.1109/JSEN.2006.886977
- 2. Williams DE. Semiconducting oxides as gas-sensitive resistors. Sensors and Actuators B 1999;57(1-3):1-16. http://dx.doi.org/10.1016/S0925-4005(99)00133-1
- 3. Xia C, Wang N, Lidong L and Lin G. Synthesis and characterization of waxberry-like microstructures ZnO for biosensors. Sensors and Actuators B 2008;129(1):268-273. http://dx.doi.org/10.1016/j.snb.2007.08.003
- 4. Ma Y, Wang WL, Liao KJ and Kong CY. Study on sensitivity of nano-grain zno gas sensors. Journal of Wide Bandgap Materials 2009;10(2):113-120. http://dx.doi.org/10.1177/1524511X02043537
- 5. Weber J, Jeedigunta S and Kumar A. Fabrication and characterization of ZnO nanowire arrays with an investigation into electrochemical sensing capabilities. Journal of Nanomaterials 2008;2008:1-5. http://dx.doi.org/10.1155/2008/638523
- 6. Tang F, Sakka Y and Uchikosi T. Electrophoretic deposition of aqueous nano-sized zinc oxide suspensions on zinc electrode. Material Research Bulletin 2003;38(2):207-212. http://dx.doi.org/10.1016/S0025-5408(02)01029-2
- 7. Pauporté T and Lincot D. Electrodeposition of semiconductors for optoelectronic devices: results on zinc oxide. Electrochimica Acta 2000;45(20):3345-3353. http://dx.doi.org/10.1016/S0013-4686(00)00405-9
- 8. Wang Q and Zheng J. Electrodeposition of silver nanoparticles on a zinc oxide film: improvement of amperometric sensing sensitivity and stability for hydrogen peroxide determination. Microchimica Acta 2010;169(3-4):361-365. http://dx.doi.org/10.1007/s00604-010-0356-7
- 9. Boccaccini AR and Zhitomirsky I. Application of electrophoretic and electrolytic deposition techniques in ceramics processing. Current Opinion in Solid State and Materials Science 2002;6(3):251-260. http://dx.doi.org/10.1016/S1359-0286(02)00080-3
- 10. Batzill M and Diebold U. Surface studies of gas sensing metal oxides. Physical Chemistry Chemical Physics 2007;9(19):2307-2318. Available from: <ww.rsc.org/pccp>. PMid:17492094. http://dx.doi.org/10.1039/b617710g
- 11. Chang Y and Yeh C. Zinc oxide/copper oxide mixed films deposited by CVD. Materials Research Society Symposium Proceedings 2001;672.
- 12. Han N, Ding P, Chen J, Chai L, Gao H and Chen Y. Electrophoretic deposition of metal oxide films aimed for gas sensors application: the role of anodic aluminum oxide (AA0)/Al composite structure. Sensors and Actuators B 2010;144(1):267-273. http://dx.doi.org/10.1016/j.snb.2009.10.068
- 13. Miyayama M, Hikita K, Uozumi G and Yanagida H. A.c. impedance analysis of gas-sensing property in CuO/ZnO heterocontacts. Sensors and Actuators B. 1995;25(1):383-387. http://dx.doi.org/10.1016/0925-4005(95)85086-4
- 14. Baek KK and Tuller HL. Atmosphere sensitive CuO/ZnO junctions. Solid State Ionics 1995;75(1):179-186. http://dx.doi.org/10.1016/0167-2738(94)00172-O
- 15. Baek KK and Tuller HL. Electronic characterization of ZnO/CuO heterojunctions. Sensors and Actuators B 1993;1344:238-240. http://dx.doi.org/10.1016/0925-4005(93)85370-P
- 16. Hu Y, Zhou X, Han Q, Cao Q and Huang Y. Sensing properties of CuO/ZnO heterojunction gas sensors. Materials Science and Engineering B 2003;99(1)41-43. http://dx.doi.org/10.1016/S0921-5107(02)00446-4
- 17. Jun SJ and Yanagida H. The characterization of a CuO/ZnO heterocontact-type gas sensor having for CO2. Sensors and Actuators B 1996;37(1-2):55-60. http://dx.doi.org/10.1016/S0925-4005(96)01986-7
- 18. Moon WJ, Yu JH and Choi GM. The CO and H2 gas selectivity of CuO-doped SnO2-ZnO composite gas sensor. Sensors and Actuators B. 2002;87(3):464-470. http://dx.doi.org/10.1016/S0925-4005(02)00299-X
- 19. Wang YC, Leu IC and Hon MH. Preparation and characterization of nanosized ZnO arrays by electrophoretic deposition. Journal of Crystal Growth 2002;237-239(Part 1):564-568. http://dx.doi.org/10.1016/S0022-0248(01)01984-4
- 20. American Society of Heating, Refrigerating, and Air-Conditioning Engineers - ASHRAE. Ammonia as a refrigerant Atlanta: ASHRAE; 2006. Available from: <www.ashrae.org>
- 21. The Fertilizer Institute - TFI. New Source Performance Standards Review for Nitric Acid Plants. Washington: TFI; 2011. Available from: <www.tfi.org>
- 22. Environmental Protection Agency - EPA. Hazards of ammonia releases at ammonia refrigeration facilities EPA; 1998. Available from: <www.epa.gov/ceppo>
- 23. Ferrari B and Moreno R. EPD kinetics: a review. Journal of the European Ceramic Society 2010;30(5):1069-1078. http://dx.doi.org/10.1016/j.jeurceramsoc.2009.08.022
- 24. Besra L and Liu M. A review on fundamentals and applications of electrophoretic deposition (EPD). Progress in Materials Science 2007;52(1):1-61. http://dx.doi.org/10.1016/j.pmatsci.2006.07.001
- 25. Gupta SK, Joshi A and Kaur M. Development of gas sensors using ZnO nanostructures. Journal of Chemical Sciences 2010;122(1):57-62. http://dx.doi.org/10.1007/s12039-010-0006-y
Publication Dates
-
Publication in this collection
04 July 2014 -
Date of issue
Aug 2014
History
-
Received
20 Sept 2013 -
Accepted
17 Apr 2014