
Abstract
The gas-liquid two-phase mass transfer process in microchannels is complicated due to the special dynamical characteristics. In this work, a novel method was explored to measure the liquid side volumetric mass transfer coefficient kLa. Pressure transducers were utilized to measure the pressure variation of upward gas-liquid two-phase flow in three vertical rectangular microchannels and the liquid side volumetric mass transfer coefficient kLa was calculated through the Pressure-Volume-Temperature correlation of the gas phase. Carbon dioxide-water, carbon dioxide-ethanol and carbon dioxide-n-propanol were used as working fluids, respectively. The dimensions of the microchannels were 40 µm×240 µm (depth×width), 100 µm×800 µm and 100 µm×2000 µm, respectively. Results showed that the channel diameter and the capillary number influence kLa remarkably and that the maximum value of kLa occurs in the annular flow regime. A new correlation of kLa was proposed based on the Sherwood number, Schmidt number and the capillary number. The predicted values of kLa agreed well with the experimental data.
Microchannels; Gas-liquid upward two-phase flow; Mass transfer; Pressure variation
FLUID DYNAMICS; HEAT AND MASS TRANSFER; AND OTHER TOPICS
Experimental investigation of the liquid volumetric mass transfer coefficient for upward gas-liquid two-phase flow in rectangular microchannels
X. Y. Ji; Y. G. Ma* * To whom correspondence should be addressed ; T. T. Fu; CH. Y. Zhu; D. J. Wang
School of Chemical Engineering and Technology, State Key Laboratory of Chemical Engineering, Tianjin University, Tianjin 300072, China E-mail: ygma@tju.edu.cn
ABSTRACT
The gas-liquid two-phase mass transfer process in microchannels is complicated due to the special dynamical characteristics. In this work, a novel method was explored to measure the liquid side volumetric mass transfer coefficient kLa. Pressure transducers were utilized to measure the pressure variation of upward gas-liquid two-phase flow in three vertical rectangular microchannels and the liquid side volumetric mass transfer coefficient kLa was calculated through the Pressure-Volume-Temperature correlation of the gas phase. Carbon dioxide-water, carbon dioxide-ethanol and carbon dioxide-n-propanol were used as working fluids, respectively. The dimensions of the microchannels were 40 µm×240 µm (depth×width), 100 µm×800 µm and 100 µm×2000 µm, respectively. Results showed that the channel diameter and the capillary number influence kLa remarkably and that the maximum value of kLa occurs in the annular flow regime. A new correlation of kLa was proposed based on the Sherwood number, Schmidt number and the capillary number. The predicted values of kLa agreed well with the experimental data.
Keywords: Microchannels; Gas-liquid upward two-phase flow; Mass transfer; Pressure variation.
INTRODUCTION
The gas-liquid two-phase micro-contactor is a very important part of micro-chemical systems. The interfacial area - to - volume ratio of gas-liquid two-phase flow in microchannels was demonstrated to be much higher than that in conventional tubes (Haverkamp et al., 2001; Yue et al., 2006; Fu et al., 2010) and the mass transfer process was greatly enhanced. Therefore, microchannels could be used efficiently and safely in gas absorption, desorption, direct fluorination, hydrogenation and other processes (Tegrotenhuis et al., 2000; Jǎhnisch et al., 2000; Demas et al.; 2003; Yeong et al., 2004; Kobayashi et al., 2004). There are many reports (Jepsen, 1970; Irandoust and Andersson, 1988; Irandoust et al., 1992; Tortopidis and Bontozoglou, 1997; Bercic and Pintar, 1997; Kreutzer, 2003; Van Baten and Krishna, 2004; Vandu et al., 2005; Yue et al., 2009) on the gas-liquid two-phase mass transfer process. Because of the significant effect of surface tension on gas-liquid two-phase flow in microchannels, the characteristics of gas-liquid two-phase flow in microchannels are quite different from those in conventional channels. Consequently, a fundamental understanding of the gas-liquid mass transfer process in microchannels is very necessary.
Although titration methods show good accuracy in determining the concentration of solute in solutions, their disadvantage is also obvious. For instance, a large amount of solution is required and the determination of the endpoint often depends on artificial factors. In microchannels 100µm in magnitude, the titration method is quite limited by the small volumetric flow rates of gas and liquid phases. Moreover, trace absorption and real-time observation and measurement are very difficult. In this paper, a high-speed camera and pressure transducers were utilized, respectively, to directly observe the flow pattern and measure the pressure change for upward gas-liquid two-phase flow in real-time in three vertical rectangular microchannels. The liquid volumetric mass transfer coefficient kLa was calculated based on the Pressure-Volume-Temperature correlation of the gas phase. The experimental results at high flow rates were verified by the titration method and the capillary number Ca was introduced to correlate the liquid volumetric mass transfer coefficient kLa.
EXPERIMENTAL SETUP
The microchannel chips were fabricated first by the etching technique on transparent glass and then the mechanical method was applied to produce and polish the microchannels with rectangular cross-section. Dimensions of the microchannels were 40 µm×240 µm (depth×width), 100 µm×800 µm and 100 µm×2000 µm, respectively, referred to as microchannels 1, 2 and 3 for short. The length of the two-phase inlets and mixing section were 1.5 and 4cm, respectively, as shown in Figure 1 (a). The hydraulic diameters dh of the microchannels were 68.57µm, 177.78µm and 190.48 µm, respectively, and all the experiments were carried out at atmospheric pressure and 298.15K.
To eliminate the effect of outlet connecting tubes and two-phase collectors on the mass transfer of two-phase mixing sections, absorption in non-mixing section microchannels was conducted under the same conditions (named blank experiments), but, as shown in Figure 1(b), the T-junction was connected directly to the outlet connecting tubes without the mixing section.
The flow chart of experiments is shown in Figure 2. Pure carbon dioxide was driven and the flow rates were set by a micro-infusion pump. After flowing through a filter and a valve, it was then injected into the vertical microchannels. The pressure transducer installed on the gas inlet connecting pipe determines the inlet pressure of the microchannels. Water was boiled to remove the dissolved carbon dioxide and then cooled to room temperature. Water, ethanol and n-propanol (physical properties are listed in Table 1) were driven by the micro-infusion pump and the actual flow rates of the liquid phases were determined by using an electronic balance. Liquid phase and carbon dioxide flowed in the mixing section of microchannels and then into the two-phase collector through an outlet connecting tube of 0.5mm diameter. The two-phase collector was enclosed to isolate it from the outside environment. The pressure transducer installed on the outlet connecting tube measured the outlet pressure of the microchannels and two thermocouple thermometers installed on the inlet and outlet connecting tubes were employed to determine the temperature of the system. A high-speed camera (2500fps) was used for the observation of the flow patterns. The mass transfer of carbon dioxide into the liquid phases was determined by the Pressure-Volume-Temperature correlation of the gas phase based on the pressure variation before and after the absorption. The titration method was used to verify the pressure method at large flow rates. For this purpose, 10mL of 0.1mol·L-1 NaOH solution were added to 10mL of the two-phase mixture and then 0.1mol·L-1 HCl solution was used for titration; phenolphthalein and helianthine were used as the first and second endpoint indicators (light pink and orange), respectively. The results showed that the relative deviation of the two methods at large flow rates was 1~2.5%, which confirmed the credibility of the pressure variation method.
To eliminate the effect of the frictional pressure drop on the experimental results, the frictional pressure drop of nitrogen-water, without absorption, was measured experimentally. The frictional pressure drop for nitrogen-ethanol and nitrogen-n-propanol without absorption were calculated based on the model of Lockhart and Martinelli (1949) and the method of Chisholm (1967).
The Lockhart and Martinelli model could be expressed via Eqs. (1) and (2):
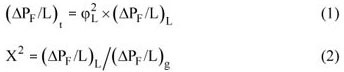
where (ΔPF/L)t is the total two-phase frictional pressure drop in the microchannels, kPa·m-1; (ΔPF/L)t is the liquid single-phase frictional pressure drop in the microchannels, kPa·m-1; (ΔPF/L)t is the gas single-phase frictional pressure drop in the microchannels, kPa·m-1.  is the two-phase multiplier and X is the Martinelli parameter.
Chisholm related to X by introducing another parameter, the Chisholm factor C:

A new correlation of the Chisholm factor C that takes into account the different physical properties of the liquid phases was proposed in our previous work and was employed to calculate the frictional pressure drop of nitrogen-ethanol and nitrogen-n-propanol without absorption. The correlation expressed as follows:

where CaL=µLJL/σ, a=7.59-0.4237×A-0.9485+0.0023×ReL and b=0.223+0.2×A0.9778. A is the aspect ratio of the rectangular cross-section of the microchannels. Thus, the practical pressure change resulting from absorption could be derived by subtracting the frictional pressure drop from the total pressure change.
RESULTS AND DISCUSSION
Flow Patterns of Upward Two-Phase Flow in Vertical Microchannels
The gas-liquid two-phase flow patterns captured by the high-speed camera in the experiments are shown in Figure 3. The flow patterns varied from Taylor bubble flow to annular flow with increasing gas and liquid flow rates. The length of the gas bubbles LB and liquid slugs LS in Taylor bubble flow were obtained from an analysis of flow pattern images. Figure 4 shows the experimental results for Taylor bubble length and slug length. As can be seen from Figure 4, the distribution of the length of Taylor bubbles and liquid slugs became gradually uniform from water to ethanol and to n-propanol as the continuous phase, which indicated that there was a better mixing effect and mass transfer performance in the carbon dioxide-n-propanol system than in the other two systems.
Calculation of the Liquid Volumetric Mass Transfer Coefficient kLa
The mass transfer of carbon dioxide into water, ethanol and n-propanol is mainly governed by the liquid phase and kLa is obtained from the equation of mass balance (Yue et al. (2006)):
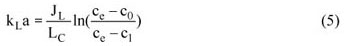
where C0 and C1 are concentrations of carbon dioxide in the liquid phase at the inlet and outlet of the microchannels and Ce is the equilibrium concentration of carbon dioxide in the liquid phase (Zhang, 1986; Liu et al., 2002), JL is the liquid phase superficial velocity and LC is the length of the mixing section of the microchannel. The value of kLa in the outlet connecting tube of the experiments is the same as that of the blank experiments, expressed as follow:
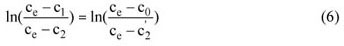
Yue et al. (2006) demonstrated that Eq. (6) could reasonably eliminate the outlet effect. Combination of Eq. (5) and Eq. (6) results in the following expression:
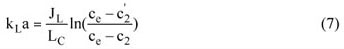
where C2 and  are the concentrations of carbon dioxide in the liquid phases in the two-phase collector of the microchannel flow experiments and the blank experiments, respectively, and are calculated from the following correlations:
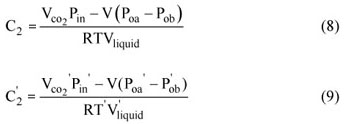
where Pin is the inlet pressure of the absorption processes and  is that of the blank experiments; Pob is the outlet pressure before absorption in the experiments and
  is that of the blank experiments; Poa is the outlet pressure after absorption in the experiments and
  is that of the blank experiments; T is the temperature of system in the experiments and T' is that of the blank experiments;
  is the total CO2 volume injected into the system in the experiments and
  is that of the blank experiments; Vliquid is the total liquid phase volume injected into the system in the experiments and
  is that of the blank experiments; and V is the total volume of the system.
A large amount of experimental data has been measured for calculating kLa. Table 2 lists typical measured values for the quantities on the r.h.s. of Eqs. (8) and (9) of the three systems in microchannel 1 at JL=0.05m·s-1 and JG=1.8 m·s-1.
Liquid Volumetric Mass Transfer Coefficient kLa
Figure 5 and Figure 6 illustrate the influences of channel diameter and capillary number on kLa, respectively, with the liquid phase superficial velocities JL=0.03, 0.05 and 0.07 m·s-1 from bottom to top, respectively; the transition from Taylor bubble flow to an annular flow pattern is marked by black lines.
It can be seen from Figures 5 and 6 that the value of kLa in microchannel 1 was much larger than that in microchannels 2 and 3. The values of kLa also presented remarkable differences between the different liquid phases used, which demonstrated the great influence of both channel diameter and liquid phase capillary number on kLa. The value of kLa increased with gas and liquid superficial velocities, because, in Taylor bubble flow, the number of gas bubbles increased with increasing the gas flow rate. As a consequence, the interfacial area for mass transfer was enhanced, resulting in the increase of kLa. The value of kLa achieved the maximum in the annular flow, in accord with the literature (Haverkamp et al., 2001; Kobayashi et al., 2004).
There are many reports on the investigation of the liquid mass transfer coefficient kLa in Taylor bubble flow. Jepsen (1970) proposed an energy dissipation model to correlate the value of kLa and the pressure drop of the system is required to use this model. Bercic and Pintar (1997) studied the absorption of methane into water in a circular tube and proposed a model of kLa that did not consider the influence of tube diameter and diffusion coefficient. Subsequently, researchers divided the mass transfer of the Taylor bubble to the surrounding liquid into three parts, the cap and tail of bubbles into the liquid slug, and the cylindrical part of bubble into the liquid film between the gas bubble and the tube wall. On the basis of this, Van Baten and Krishna (2004) simulated the mass transfer process of a Taylor bubble rising into the surrounding liquid in vertical circular tubes with CFD and proposed a model of kLa that introduced the tube diameter and diffusion coefficient, as follows:
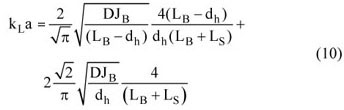
where JB is the rising velocity of the Taylor bubble, approximately given by JB≈ JL+JG , as validated by analyzing the variation of flow pattern images, D is the liquid phase diffusivity, and the Taylor bubble length and liquid slug length were obtained by visualization and measurement of flow pattern images captured with a high speed camera. Van Baten and Krishna (2004) regarded the mass transfer of the cylindrical part of the bubble into the liquid film as the dominant part of the total mass transfer process. Based on this, Vandu et al. (2005) investigated the mass transfer process of oxygen into water in circular and square channels of 1mm, 2mm and 3mm diameters and proposed a model of kLa that approximated the total mass transfer as being only that of the cylindrical part transferring into the film. Yue et al.(2009) also investigated the absorption of oxygen into water experimentally in an air-water system and proposed a correlation of kLa according to Eq. (10).
The precise length of the Taylor bubbles and liquid slugs is required to apply the above models, which results in great limitations in application. Yue et al. (2006) utilized the Sherwood number and Schmidt number to correlate kLa in a rectangular microchannel with a hydraulic diameter of 667µm, as follows:
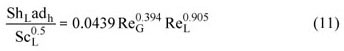
where the Sherwood number is Sh L=kLdh/D, the Schmidt number ScL=µL/ρLD, the gas phase Reynolds number ReG=ρGJGdh/µG and liquid phase Reynolds number ReL=pLJLdh/µL, with µL,µG and ρL,ρG as the viscosities and densities of the liquid and gas phases, respectively.
Figure 7 shows the comparison of experimental results for carbon dioxide-water with values predicted by Eqs. (10) and (11). Because the results of carbon dioxide-ethanol and carbon dioxide-n-propanol showed the same trends as that of carbon dioxide-water, they are not displayed here. It can be seen from Figure 6 that there exists a remarkable deviation between the experimental results and values predicted by Eqs. (10) and (11). This may be explained as follows: Eq. (10) considers that the mass transfer of the cylindrical part into the liquid film dominates the total mass transfer; the mass transfer into the liquid film is thus mainly controlled by the length of the liquid slugs surrounding the Taylor bubbles. The longer the liquid slugs, the easier the absorbed gas phase is transferred into the liquid slugs from the liquid film. As a consequence, the liquid film could absorb more gas phase, which results in the high value of kLa (Van Baten and Krishna, 2004; Vandu et al., 2005; Yue et al., 2009). However, the hydraulic diameters of the microchannels used in our experiments were 100 µm in magnitude, such that the lengths of the liquid slugs were much shorter than those (LS>3LB) in large tubes. Consequently, the gas phase absorbed by the liquid film could not be transferred into the liquid slugs efficiently. Therefore, the liquid film achieved saturation and could not absorb any more gas phase; in this case, the experimental results for kLa were much lower than those of the literature. The predictive performance of Eq. (11) is better than that of Eq. (10) and appears to be quite well consistent with experimental results in the range of ReL=59.4~700.6 and ReG=62.1~1088.3. However, it is worth noting that the ranges of gas and liquid Reynolds numbers in the present experiments were ReL=1.1~13.07 and ReG=0.87~61.9, respectively. The hydraulic diameters of microchannels were also much smaller than the 667µm used by Yue et al. (2006), resulting in the large deviation of more than 20% of the predictions of by Eq. (11) from the experimental data in this work, as shown in Fig.6.
The hydraulic diameters of the microchannels used here were all less than 200µm. On such a micro-scale, the capillary number Ca has an important influence on gas-liquid two-phase flow, which was demonstrated by the remarkable difference of the experimental results between water, ethanol and n-propanol as the working liquid phase. Thus, in this paper, a new correlation is proposed based on Eq. (11) but introducing the liquid phase capillary number CaL:
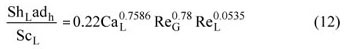
where CaL=µLJL/σ, with σ being the surface tension. The values of the parameters were obtained by using the least square fitting method. The comparison between experimental results and values predicted by Eq. (12) is shown in Figure 8. The mean deviations are 10.5%, 13.75% and 15.06% for carbon dioxide-water, 11.65%, 8.05% and 6.93% for carbon dioxide-ethanol and 12.16%, 10.27% and 12.13% for carbon dioxide-n-propanol in the three microchannels, respectively. Figure 9 shows the comparison of predictions of Eq. (12) with experimental data in the circular channels of Van Baten and Krishna (2004) and in the rectangular channel of Yue et al. (2006); the mean deviations are 4.82% and 4.19%, respectively, indicating that Eq. (12) has good predictive performance in both circular and rectangular microchannels.
CONCLUSIONS
The liquid volumetric mass transfer coefficient kLa of carbon dioxide-water, carbon dioxide-ethanol and carbon dioxide-n-propanol two-phase upward flow in vertical microchannels were obtained by measuring the pressure variation before and after the absorption processes. The experimental results were checked by titration under large flow rates and the following conclusions could be obtained:
1) Determination of the liquid volumetric mass transfer coefficient kLa via measuring the pressure variation of the system before and after the absorption process has the advantage of a non-interferencing, real-time determination, high credibility, and good accuracy for trace absorption and requires very little solution, being suitable for the micro-scale;
2) Both the channel diameter and the liquid phase capillary number influence the liquid volumetric mass transfer coefficient remarkably, and kLa achieves its maximum in the annular flow pattern;
3) A new dimensionless correlation of kLa was proposed by introducing the liquid phase capillary number, which showed good predictive performance under micro-scale conditions.
ACKNOWLEDGEMENTS
This work was supported by the National Nature Science Foundation of China (No. 20876107) and the Opening Project of State Key Laboratory of Chemical Engineering (No. SKL-ChE-08B06).
NOMENCLATURE
a
Pin
Pob
Poa
T
T'
Vliquid
V
Greek Letters
Dimensionless Group
ShL
ScL
ReG
ReL
CaL
(Submitted: June 30, 2010 ; Revised: August 2, 2010 ; Accepted: August 26, 2010)
- Bercic, G., Pintar, A., The role of gas bubbles and liquid slug lengths on mass transport in the Taylor flow through capillaries. Chemical Engineering Science, v. 52 (21-22), 3709-3719 (1997).
- Chisholm, D., A theoretical basis for the LockhartMartinelli correlation for two-phase flow. International Journal of Heat and Mass Transfer. v.10, 1767-1778 (1967).
- Demas, N., Gunther, A., Schmidt, M. A. et al., Microfabricated multiphase reactors for the selective direct fluorination of aromatics. Ind. Eng. Chem. Res. 4, No. 42, 698-710 (2003).
- Fu T. T., Ma Y. G., Funfschilling D., Li H. Z., Bubble formation and breakup mechanism in a microfluidic flow-focusing device. Chemical Engineering Science, v. 64, 2392-2400 (2009).
- Haverkamp, V., Emig, G., Hessel, V. et al., Characterization of a gas-liquid microreactor. The micro bubble column: determination of specific interracial area. Proceedings of the Fifth International Conference on Microreaction Technology, Berlin (2001).
- Irandoust, S., Andersson, B., Mass-transfer and liquid-phase reactions in a segmented two-phase flow monolithic catalyst reactor. Chemical Engineering Science, v. 43, (8), 1983-1988 (1988).
- Irandoust, S., Ertle, S., Andersson, B., Gasliquid mass-transfer in Taylor flow through a capillary. Canadian Journal of Chemical Engineering, v. 70, 115-119 (1992).
- Jahnisch, K., Baerns, M., Hessel, V., et al., Direct fluorination of toluene using elemental fluorine in gas-liquid microreactors. Flurine Chem. 1, No.105, 117-128 (2000).
- Jepsen, J. C., Mass transfer in two-phase flow in horizontal pipelines. AIChEJ. 5, No.16, 705-711 (1970).
- Kobayashi, J., Mori, Y., Okamoto, K. et al., A microfluidic device for conducting gas-liquid-solid hydrogenation reactions. Science, 304, No. 5675, 1305-1308 (2004).
- Kreutzer, M. T., Hydrodynamics of Taylor flow in capillaries and monolith reactors. Ph.D. Thesis, The Netherlands: Delft University of Technology (2003).
- Liu, G. Q., Ma, L. X., Liu, J., Manual of Chemistry and Chemical Industry Physicality Data, Beijing, China, Chemical Industry Press (2002).
- Lockhart R. W., Martinelli R. G., Proposed correlations for isothermal two-phase two-component flow in pipes. Chemical Engineering Progress. v. 45, 39-48 (1949).
- Tegrotenhuis, W. E. , Cameron, R. J. , Viswanathan, V. V. et al., Solvent extraction and gas absorption using microchannel contactors. Proceedings of the Third International Conference on Microreaction Technology. Berlin (2000).
- Tortopidis, P. and Bontozoglou, V., Mass transfer in gas-liquid flow in small-diameter tubes. Chemical Engineering Science, 14, No.52, 2231-2237 (1997).
- Van Baten, J. M., Krishna, R., CFD simulations of mass transfer from Taylor bubbles rising in circular capillaries. Chemical Engineering Science, v. 59, 2535-2545(2004).
- Vandu, C. O., Liu, H., Krishna R., Mass transfer from Taylor bubbles rising in single capillaries. Chemical Engineering Science, v. 60, 6430-6437 (2005).
- Yeong, K. K., Gavriilidis, A., Zapf, R., Hessel, V., Experimental studies of nitrobenzene hydrogenation in a microstructured falling film reactor. Chemical Engineering Science, 16, No.59, 3491-3494 (2004).
- Yue, J., Chen, G. W., Yuan, Q., Luo L. A., Hervé, L. G., Mass transfer in gas-liquid flow in microchannels. Journal of Chemical Industry and Engineering, 6, No.57, 1296-1303 (2006).
- Yue, J., Luo, L. A., Gonthier, Y., Chen, G., Yuan Q., An experimental study of airwater Taylor flow and mass transfer inside square microchannels. Chemical Engineering Science, v. 64, 3697-3708 (2009).
- Zhang, S. Q., Chemical Industry Manual. Jinan, China, Sandong Science and Technology Press (1986).
Publication Dates
-
Publication in this collection
04 Jan 2011 -
Date of issue
Dec 2010
History
-
Accepted
26 Aug 2010 -
Reviewed
02 Aug 2010 -
Received
30 June 2010


