Abstracts
Root length density (RLD) is a critical feature in determining crops potential to uptake water and nutrients, but it is difficult to be measured. No standard method is currently available for assessing RLD in the soil. In this study, an in situ method used for other crops for studying root length density and distribution was tested for sugarcane (Saccharum spp.). This method involved root intersection counting (RIC) on a Rhodic Eutrudox profile using grids with 0.05 x 0.05 m and modeling RLD from RIC. The results were compared to a conventional soil core-sampled method (COR) (volume 0.00043 m³). At four dates of the cropping season in three tillage treatments (plowing soil, minimum tillage and direct planting), with eight soil depths divided in 0.1 m soil layer (between 0-0.6 and 1.6-1.8 m) and three horizontal distances from the row (0-0.23, 0.23-0.46 and 0.46-0.69 m), COR and RIC methods presented similar RLD results. A positive relationship between COR and RIC was found (R² = 0.76). The RLD profiles considering the average of the three row distances per depth obtained using COR and RIC (mean of four dates and 12 replications) were close and did not differ at each depth of 0.1 m within a total depth of 0.6 m. Total RLD between 0 and 0.6 m was 7.300 and 7.100 m m-2 for COR and RIC respectively. For time consumption, the RIC method was tenfold less time-consuming than COR and RIC can be carried out in the field with no need to remove soil samples. The RLD distribution in depth and row distance (2-D variability) by RIC can be assessed in relation to the soil properties in the same soil profiles. The RIC method was suitable for studying these 2-D (depth and row distance in the soil profile) relationships between soil, tillage and root distribution in the field.
Brasil; root mapping; root study methods; trench-profile method
A densidade de comprimento de raízes (DCR) é uma característica importante para determinar o potencial de absorção de água e nutrientes das plantas, mas é difícil de ser medida. Nenhum método padrão está atualmente disponível para avaliar a DCR no solo. Neste estudo, um método in situ usado em outras culturas para estudo da densidade de comprimento e distribuições das raízes foi testado para a cana-de-açúcar (Saccharum spp.). O método envolveu contagem de intersecções de raízes (CIR) no perfil de um Latossolo Vermelho eutroférrico, usando grade com quadrículas de 0.05 x 0.05 m, modelizando a DCR a partir da CIR. Os resultados foram comparados com o método do trado cilíndrico (TRA) (volume de 0.00043 m-3). Em quatro épocas durante o ciclo em três manejos do solo (plantio convencional, cultivo mínimo e plantio direto), em oito profundidades divididas a cada 0.1 m (entre 0 - 0.6 e 1.6 - 1.8 m) e três distâncias horizontais em relação à linha de plantio (0 - 0.23, 0.23 - 0.46 e 0.46 - 0.69 m), os métodos TRA e CIR apresentaram resultados de DCR similares. Encontrou-se positiva entre TRA e CIR (R² = 0,76). As DCRs nos perfis, considerando as médias das três distâncias da linha por profundidade, obtida utilizando-se de TRA e CIR (média de quatro datas e 12 repetições), foram próximas e não diferiram a cada 0.1 m de profundidade até 0.6 m de profundidade. A DCR total entre 0 e 0.6 m foi de 7.300 e 7.100 m m-2 para TRA e CIR, respectivamente. Para o tempo de realização, o método CIR foi 10 vezes mais rápido do que TRA e o método CIR pode ser realizado no campo, sem necessidade de remover amostras de solo. A distribuição da DCR em profundidade e distância da linha (variabilidade 2D) pelo método CIR pode ser avaliada em relação às propriedades do solo nos mesmos perfis do solo. O método CIR foi apropriado para estudos dessas relações 2D (profundidade e distância da linha no perfil do solo) entre solo, manejo e distribuição de raízes no campo.
Brasil; mapeamento da distribuição radicular; avaliação do sistema de raízes; método da parede do perfil
SOILS AND PLANT NUTRITION
Sugarcane root length density and distribution from root intersection counting on a trench-profile
Densidade de comprimento e distribuição de raízes de cana-de-açúcar a partir da contagem de intersecção de raízes na parede do perfil
Mateus Carvalho Basilio de AzevedoI,* * Corresponding author < azevedo@iapar.br> ; Jean Louis ChopartII; Cristiane de Conti MedinaIII
IIAPAR - Unidade Regional de Paranavaí, C.P. 564 - 87701-970 - Paranavaí, PR - Brasil
IICIRAD - Annual Cropping Systems Research Unit, Station de Roujol - 97170 - Petit-Bourg, Guadalupe, France
IIIUEL - Depto. de Agronomia, C.P. 6001 - 86051-990 - Londrina, PR - Brasil
ABSTRACT
Root length density (RLD) is a critical feature in determining crops potential to uptake water and nutrients, but it is difficult to be measured. No standard method is currently available for assessing RLD in the soil. In this study, an in situ method used for other crops for studying root length density and distribution was tested for sugarcane (Saccharum spp.). This method involved root intersection counting (RIC) on a Rhodic Eutrudox profile using grids with 0.05 × 0.05 m and modeling RLD from RIC. The results were compared to a conventional soil core-sampled method (COR) (volume 0.00043 m3). At four dates of the cropping season in three tillage treatments (plowing soil, minimum tillage and direct planting), with eight soil depths divided in 0.1 m soil layer (between 0-0.6 and 1.6-1.8 m) and three horizontal distances from the row (0-0.23, 0.23-0.46 and 0.46-0.69 m), COR and RIC methods presented similar RLD results. A positive relationship between COR and RIC was found (R2 = 0.76). The RLD profiles considering the average of the three row distances per depth obtained using COR and RIC (mean of four dates and 12 replications) were close and did not differ at each depth of 0.1 m within a total depth of 0.6 m. Total RLD between 0 and 0.6 m was 7.300 and 7.100 m m-2 for COR and RIC respectively. For time consumption, the RIC method was tenfold less time-consuming than COR and RIC can be carried out in the field with no need to remove soil samples. The RLD distribution in depth and row distance (2-D variability) by RIC can be assessed in relation to the soil properties in the same soil profiles. The RIC method was suitable for studying these 2-D (depth and row distance in the soil profile) relationships between soil, tillage and root distribution in the field.
Key words: Brasil, root mapping, root study methods, trench-profile method
RESUMO
A densidade de comprimento de raízes (DCR) é uma característica importante para determinar o potencial de absorção de água e nutrientes das plantas, mas é difícil de ser medida. Nenhum método padrão está atualmente disponível para avaliar a DCR no solo. Neste estudo, um método in situ usado em outras culturas para estudo da densidade de comprimento e distribuições das raízes foi testado para a cana-de-açúcar (Saccharum spp.). O método envolveu contagem de intersecções de raízes (CIR) no perfil de um Latossolo Vermelho eutroférrico, usando grade com quadrículas de 0.05 × 0.05 m, modelizando a DCR a partir da CIR. Os resultados foram comparados com o método do trado cilíndrico (TRA) (volume de 0.00043 m-3). Em quatro épocas durante o ciclo em três manejos do solo (plantio convencional, cultivo mínimo e plantio direto), em oito profundidades divididas a cada 0.1 m (entre 0 - 0.6 e 1.6 - 1.8 m) e três distâncias horizontais em relação à linha de plantio (0 - 0.23, 0.23 - 0.46 e 0.46 - 0.69 m), os métodos TRA e CIR apresentaram resultados de DCR similares. Encontrou-se positiva entre TRA e CIR (R2 = 0,76). As DCRs nos perfis, considerando as médias das três distâncias da linha por profundidade, obtida utilizando-se de TRA e CIR (média de quatro datas e 12 repetições), foram próximas e não diferiram a cada 0.1 m de profundidade até 0.6 m de profundidade. A DCR total entre 0 e 0.6 m foi de 7.300 e 7.100 m m-2 para TRA e CIR, respectivamente. Para o tempo de realização, o método CIR foi 10 vezes mais rápido do que TRA e o método CIR pode ser realizado no campo, sem necessidade de remover amostras de solo. A distribuição da DCR em profundidade e distância da linha (variabilidade 2D) pelo método CIR pode ser avaliada em relação às propriedades do solo nos mesmos perfis do solo. O método CIR foi apropriado para estudos dessas relações 2D (profundidade e distância da linha no perfil do solo) entre solo, manejo e distribuição de raízes no campo.
Palavras-chave: Brasil, mapeamento da distribuição radicular, avaliação do sistema de raízes, método da parede do perfil
Introduction
The root system, especially root length density (RLD), must be understood to allowing insights into crop functioning (Tardieu, 1988; Taylor and Klepper, 1978), and soil water and mineral balances (Chopart and Vauclin, 1990; Habib et al., 1991; Taylor and Klepper, 1975). The root distribution is also a good biological indicator of the physical status of a cropped soil (Nicou and Chopart, 1979; Nicou et al., 1993). The RLD can be studied by many methods with advantages and shortcomings (Böhm, 1979; Box, 1996; Vasconcelos et al., 2003). However, currently there is no standard method available for studying roots in the field. A usual field method is the root core-sampled method, which is easy to implement but time-consuming; and it is difficult to estimate root system spatial variability.
The trench-profile method (Böhm, 1976) is easy to carry out and enables the operator to monitor root distribution in the soil profile, but RLD and root biomass cannot be measured directly, and it needs to open a trench. Attempts have already been made to compare the number of roots in a soil profile and RLD measured by standard methods, first by Böhm (1976), and then by other authors in crops such as wheat (Drew and Saker, 1980), cotton (Bland and Ducas, 1988) and maize (Vepraskas and Hoyt, 1988). The empirical relationships revealed in these studies are highly variable, with differences ranging from 2- to 10-fold between treatments. Based on the findings of Melhuish and Lang (1968), Chopart and Siband (1999) developed a model for estimating RLD in corn based on the root intersection density (RID), with the soil profile being considered as a plane, and taking the degree of root anisotropy and root directions relative to the monitoring plane into account. The model was parameterized for sugarcane (Chopart et al., 2008a), but the results have not yet been compared to those obtained with conventional methods.
The sugarcane (Saccharum officinarum L.) root system is highly dependent on the physical soil conditions (Costa et al., 2007; Monteith and Banath, 1965). It is thus essential to be able to assess the root system distribution of this crop in the field using a validated method. The aim of the study was to test the RLD estimation method based on root counts on a trench profile developed by Chopart et al. (2008a). This method was compared with a conventional soil-core method involving soil sampling and root extraction by washing; the comparison was done through the aligned paired up relation obtained from the plant in its different soil tillage, seasons and both horizontal and vertical distances, and also from the comparison of the RLD profile per depth.
Material and Methods
This study was carried out in field conditions in Londrina (Paraná State, Brazil, 23º23' S; 51º11' W, 560 m a.s.l.) under humid subtropical climatic conditions (mean rainfall 1,620 mm). The sugarcane crop (cv. RB72454) was planted in 2002 in a clayey Rhodic Eutrudox (Table 1). The experiment had three tillage treatments in ten replicates, which were done during the year 2002, when the sugarcane crop was planted. The experimental design was a completely randomized one. Each experimental plot was composed by four sugarcane lines (1.4 m between rows) that were 30 m in length. The treatments were: (i) plowing soil: cultivation + disking (twice) at plantation, and soil cultivation followed by incorporated fertilization; (ii) minimum tillage: soil cultivation, one disking at plantation and incorporated fertilization; and (iii) direct planting: direct plantation and fertilizers spread on the ground surface. The treatments are not different for the sugarcane root development (results not shown). The results of the three tillages were compiled as one data set for the comparison of the two methods.
Roots were evaluated during the whole third (2005) and fourth (2006) cropping period, at the following stages: 280 days after ratoon (DAR) in 2005, and 60, 170 and 240 DAR in 2006. The sites for roots evaluation in five experimental plots (trench profiles) were determined randomly using two central rows of each plot. At each root site evaluation, 1.5 m-long × 2 m-deep soil trenches were dug perpendicularly to the sugarcane rows (Figure 1). For both methods, data were collected from 0-0.6 m at the three tillages × four replicates (12 replicates in all) and 1.6-1.8 m depth at the three tillages × one or two replicates (three or six replicates). For each depth of 0.1 m were collected three soil core samples for the COR method (0-0.23, 0.23-0.46 and 0.46-0.69 m from the row) and data of 28 root intersection counts with a 0.05 × 0.05 m grid for the RIC. Centers of the COR samples were at horizontal distances of 0.11, 0.35 and 0.58 m from the row.
In the conventional soil core-sampling (COR) method (control), soil samples were collected using soil core samplers (COR) with a known volume. The soil was sampled with a metal cylinder with dimensions of 0.074 m in diameter and 0.1 m long, resulting in a volume of 0.00043 m3 (Figure 1). Roots were extracted from the soil by washing with tap water, following separation using a 1 mm mesh sieve. Root lengths were then evaluated from digital images with the ANALYRA free software (developed by CIRAD, France) using the intersect method (Newman, 1966; Tennant, 1975).
In the tested method (RIC), the RLD was estimated by counting root intersections on a soil profile, without any sampling required. It involved freeing the roots from the trench profile surface for a few millimeters in such a way that root intersections on the side of the soil profile could be counted. The intersections were spatially pinpointed on a 0.05 × 0.05 m grid (Figure 1). Ramifications located outside of the counting plane were not taken into account. Data obtained via this 2-D mapping (points on a plane) were transformed into root lengths per volume (RLD), with a 3-D geometry, using a model designed specifically for sugarcane (RLD = RID CO CE, where RID is root intersection density, CO is geometrical coefficient - based on root directions in the soil - and CE is the experimental coefficient - dependent on the root intersection densities) by Chopart et al. (2008a). The RACINE software (Chopart et al., 2009) was used to store spatialized data on root intersections and to calculate RLDs from root intersection density (RID). For efficient implementation of the geometrical model used (Chopart et al., 2008a), it was essential to count root intersections between the straight line segments (roots) and the plane (soil profile), even though the profiles were not perfectly flat.
The time required to obtain the RLD value was a key criterion for testing the methods. The time required to evaluate a 'typical' 1.4 m-wide × 1 m-deep profile was determined recording the mean time (based on five soil profiles) spent in the field, in the laboratory and on a computer from the time when the field measurements were obtained until the time when RLDs were determined. The laboriousness of the work increased over a gradient ranging from the work on the computer, in the laboratory and in the trenches in the field - this was taken into account when analyzing the results. The trench digging time was not taken into account.
Three years after their application, there were no differences between treatments on the above-ground plant parts or the root systems (data not shown). So, the results of the three treatments were therefore, not analyzed separately. The experimental set-up was considered as being made up of 30 uniform plots. The results obtained by the two methods were compared in each stage studied and at the same location in the profile (Figure 1), one COR sampling location was coupled to four 0.05 × 0.05 m grids (e.g. 0.1 m × 0.1 m counting surface). Each value presented is the mean of replications, whose number varied according to dates and soil depths (Table 2). For the analysis of correlations between methods, the data were the means of the replicates obtained for each horizontal distance and soil depth, under different growing stages of the sugarcane in the three soil tillage treatments thus forming the aligned pairs with the values from both methods. We have then obtained a set of data with RLD values of different greatness, thus allowing the relation of the methods much more widely. For these correlations, the methods were compared by separating the beginning of sugarcane growth from other dates, resulting in two data sets: 60 DAR and 170, 240, 280 DAR mean. The results are also presented in the form of soil profiles according to the depth. Those values were obtained by the calculation of the average from different horizontal distances, which were presented with its standard errors. An analysis of variance (ANOVA) was performed to compare the values obtained by the two methods per 0.3 m depth.
Results and Discussion
The total times required to obtain RLDs using the two methods differed markedly (Table 3). The COR method was the most time-consuming, since the root extraction and preparation operations were carried out manually. The RIC was the least time-consuming method, with an overall assessment time of approximately four hours per soil profile, i.e. tenfold shorter than the COR method. To estimate the RLD using COR, the computer time involved removing the root samples and scanning, measuring the root lengths with a software program and typing data on a spreadsheet. Beyond the field work, the RIC method only involved one more operation: inputting RID data in the RACINE program. It took very little time to calculate RLDs from RIDs using the model and to input the data on a spreadsheet. Vasconcelos et al. (2003) compared the COR method with a method close to RIC and obtained a less marked difference in results, i.e. RIC was fivefold shorter than COR, but it is still quite a substantial difference.
Correlations obtained when comparing the COR and RIC results were reasonable explanatory (R2 = 0.756), but this variability seemed random because the regression line was very close to the bisecting line (Figure 2): RIC = 0.999 COR - 60, R2 = 0.756, n = 46
There would be two dates (60 DAR and mean of 170, 240 and 280 DAR) × three row distances × eight soil depths = 48 pairs. In all ways, in depth, there are two pairs among the 48 pairs where the roots were in neglectable quantity. Therefore, these two pairs were not used. Apart from these tests of gradient and ordinate correlation, other indicators enabled analysis of the quality of the results obtained by the RIC method, which involves modeling. Differences between RIC and COR methods were also analyzed by the following statistical quantities: root mean square error (RMSE) (Loague and Green 1991) and mean bias. They should be as close as possible to 0%. The RMSE and mean bias (39% and 2.3% respectively) confirm the quality of the relations between the RIC and COR methods.
The mean profiles obtained from the overall data (three treatments - plowing soil, minimum tillage and direct planting × four dates - 60, 170, 240 and 280 DAR × four replicates = 48 profiles per method) were very comparable (Figure 3). RLD could be estimated by the RIC method when there were not enough replications. Standard errors were partially due to variations between dates and treatments and to random variability that is often noted in-situ root system studies. This variability was comparable to both methods.
The results obtained between 0-0.6 m depth were summarized per 0.3 m soil level (Table 4) to check mainly whether clustering data for several soil depths increased the gap between the RLDs obtained with COR and RIC. It was found that the RIC method slightly underestimated the RLD - below 0.3 m - but the difference was not significant.
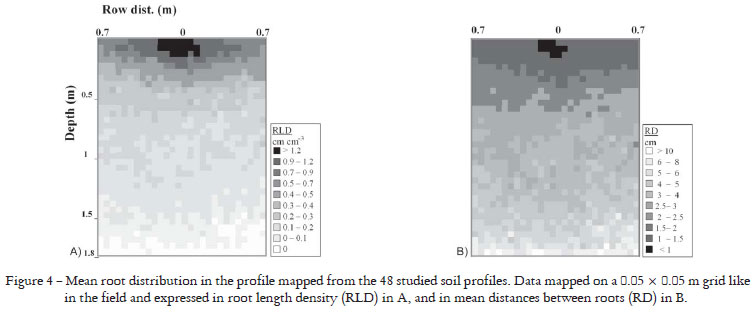
RLD distribution was mapped on a 0.05 m square mesh grid to assess local spatial variability in the root system in relation to the physical and chemical soil characteristics. The findings were illustrated on a RLD map drawn up using means calculated for all profiles. This enabled a 2-D representation of the root distribution of a 'typical' root system of cv. RB 72 474 in the studied environment (Figure 4a). It was easy to transform the RLD map into a map of distances between roots (RD) using Newman's formula (1966): RD = (4π)0.5 × (RLD0.5)-1. The resulting map (Figure 4b) differs slightly from the RLD map (Figure 4a), especially as it indicates a better root distribution in deep soil horizons than on the map of Figure 4a. This type of map can be useful for determining the mean morphology of a root system according to tillage conditions. The COR method, provided data on only three distances along the planting row and per 0.1 m soil layer down to a depth of 0.6 only. As the COR method was also about tenfold longer to perform than the RIC method, it would be very hard to draw up 0.2 root maps at 1.8 m depth as it was possible with the RIC.
Using the RLD values for each grid at the same depth, it is possible to calculate a mean value and to obtain a mean RLD profile at a specific depth, as it is standardized by the conventional COR method. This mapped presentation was carried out at 60 DAR, enabling the comparison between treatments and vertical distances. The results obtained (Figure 5) are close to those of Figure 3, reached by averaging the results found at the four measuring dates. With the RIC method, it was possible to create 2-D maps covering a depth of 1.8 m, showing root-space distribution according to soil treatments (Figure 6). It was thus observed that the highest root length density in soil tilled to a depth of between 0 and 0.2 m (Figure 5) was linked to a high concentration of roots beneath the row, but there were few differences between the various tilling methods in the middle of the inter-row.
The mean RLD's by layers of soil in this study has shown figures around 8000 m m-3 between 0 and 20 cm depth and around 2,000 m m-3 between 40 and 60 cm depth. These results were superior to the ones found by Battie-Laclau and Laclau (2009), also in Brazil but in plant cane, that was between 3,000 and 5,000 m m-3, in the 0 to 20 cm layer. In bigger depths, between 40 and 100 cm, the results were compatible. These averages by soil layer hide horizontal gradients as well as heterogeneities of distribution of roots. The RLD's maximum values obtained in minor soil volume, as small as 0.1 m3, hit up to 20,000 m m-3 (Figure 6). These results are due to the volume greatness, found in a few studies with up to 13,000 m m-3 (Reghenzani, 1993, cited by Smith et al., 2005), 15,000 m m-3 (Chopart and Marion, 1994).
The choice of making maps using averages calculated from four replications offered the advantage of showing representative distributions as well as vertical and horizontal gradients, but spatial variability in terms of single profiles does not appear. Individual profiles can be examined in order to study spatial variability. For example, in one replication of minimum tillage treatment, there was a lower root density in part of the profile due to local soil mechanical resistance (Figure 7).
In the literature, there is few data on the sugarcane root distribution in 2-D showing the heterogeneities of the distribution. There are drawings like the ones from Evans (1936), but they are only descriptive and not quantitative. Recently, some 2-D sugar cane root system distribution were published, under the conditions of irrigated sugar cane and non-irrigated sugar cane (Battie-Laclau and Laclau, 2009). In this paper, the distribution of roots, including gradients and spatial variability, are compatible to the ones obtained at this study. The difference is that the results got by Battie-Laclau and Laclau (2009) are expressed in root intersects' densities, and not in root length densities.
We also identified the number of 0.05 × 0.05 m meshes without roots for each 0.2 m soil layer for the three tillage treatments considering the date means. This percentage of area containing no roots is an indicator of the quality of spatial distribution of roots in the profile. Thus Figure 8 shows that while the mean RLD at the surface of plowed soil was distinctly higher, the percentage of empty meshes was low for each of the tilling treatments, limiting the agronomic interest of the elevated RLD considering water and nutrients uptakes. Between 0.2-0.6 m, however, the highest mean density in plowed soil did indeed correspond to better root distribution (empty grids were 10, 19 and 21% for plowing, minimum tillage and direct sowing treatments respectively). Between 0.4-1.0 m depth, there were no longer any marked differences between tilling treatments, but the percentage of empty meshes remained lower for plowed ground. Lastly, below 1.0 m, the lowest root density observed corresponded to a high proportion of empty meshes with slight differences between treatments and even, apparently, a larger number of empty meshes under plowing. Therefore, contrary to what the average RLD profiles could suggest, it was not at the surface (0-cm) that plowing was of lasting effect and useful for water uptake, but rather at a depth of between 0.4 and 1.0 m (Figures 5 and 8). These examples have been given with a view to demonstrating the wealth of information obtainable using the RIC method regarding the quality of a root system's extension in relation to horizontal distance in the inter-row, depth, agronomic treatments and the soil's properties.
The RIC method combined with a model for conversion of root intersection data into RLD thus facilitates comparative quantitative analyses of spatial variability in the physical status of the soil and in root distribution. These root system maps could be compared to the cropping profiles in which there were several different morphological units (Manichon, 1987; Neves et al., 2003). These cropping profile observations could be used to model structural changes brought about by tillage (Roger-Estrade et al., 2000).
The RIC method disturbs the environment as a trench must be dug. However, the soil extracted from the trench may (and must) be put back in place, while respecting the soil horizons, without any soil removal. With the COR method, the sampled soil is removed from the field to carry out the laboratory analyses, so the soil is washed off and lost. With the RIC method, much data can be processed (around 1,000 root intersection counts per soil profile of 1.4 m × 2 m depth) to be converted (by calculations) into RLDs. These calculations can be very quickly performed using freeware (RACINE®, Chopart et al., 2009) tailored to this method. Finally, the main shortcoming of the RIC method as compared to COR is that the root biomass cannot be assessed. It is thus recommended for studies on water and mineral uptake and on relationships between soil physical conditions and roots, for which RLD is more important than root weight.
When studying root systems in the most superficial layers, the advantage of the COR method is that the soil core samplers can be driven vertically down into the soil, whereas trenches have to be dug with the RIC method, thus disturbing the environment. Below a depth of about 1 m, it is very hard to implement the COR method and time-consuming motorized procedures are necessary, which was beyond the scope of the present study.
In summary, the results obtained with the COR method were representative of the root system, but the method was very time consuming, as also noted by other authors (Vasconcelos et al., 2003; Vepraskas and Hoyt, 1988). The method tested (RIC), which involved counting root intersections in a soil profile and estimating RLD based on these counts using a model, gave RLD values very close to those obtained with the COR method, but it was less time consuming. It was the only method that could provide an estimate of the spatial distribution of RLDs in the profile and its variability. Root growth could thus be compared with physical and chemical soil conditions, and soil morphological units that markedly hamper root growth could also be detected. However, all the methods used to study root systems have their limitations, and it is as well the case for the tested method estimating sugarcane root length density from root intersection counting on a trench profile. Using this method it is specifically difficult to study RLD in very deep layers, because the model estimating sugarcane RLD through root intersection counting was established only at a 0-1.5m depth (Chopart et al., 2008a). Local relationships have to be found out in order to estimate RLD from root intersection counting. Moreover, it is difficult to distinguish dead and living roots.
These two methods are appropriate to describe the RLD profile and not to suppose the maximum depth of the root system. Under these conditions, below 2 m, there are roots but they are few and the comparison of estimating methods of RLD, trench profile and soil core, is difficult.
The comparison between COR and RIC methods was made only for sugarcane. However, according to theoretical models (Melhuish and Lang, 1968), it was possible to estimate RLD from the root intersection counting and models were validated for maize (Chopart and Siband, 1999), sorghum (Chopart et al., 2008b) and rice (Dusserre et al., 2009). It would now be of interest to assess this root mapping methodology with these crops, especially those with high spatial variability in their root systems.
Acknowledgements
This work was funded by the Universidade Estadual de Londrina, UEL, and CAPES (Brazil) as well as by the CIRAD and the ARPEGE research project (France), developed during the PhD thesis of the first author. The authors wish to express their thanks to L.G. Mantoani, R. Belgamo, P. Zaccheo and A. Garcia for their helpful assistance in the field, and L. le Mézo for assistance with preparation of the figures.
Received July 02, 2009
Accepted July 13, 2010
- Battie-Laclau, P.B.; Laclau, J.P. 2009. Growth of the whole root system for a plant crop of sugarcane under rainfed and irrigated environments in Brazil. Field Crops Research 114: 351-360.
- Bland, W.L.; Ducas, W. 1988. Root length density from minirhizotron observations. Agronomy Journal 80: 271-275.
- Böhm, W. 1976. In situ estimation of root length at natural soil profiles. Journal of Agricultural Science 87: 365-368.
- Böhm, W. 1979. Methods of studying root systems. Springer, New York, NY, USA.
- Box, J.E. 1996. Modern methods for root investigations. p. 193-237. In: Waisel, Y.; Eshel, A.; Kafkafi, U., eds. Plant roots the hidden half. Dekker YM, New York, NY, USA.
- Chopart, J.L.; Marion, D. 1994. In situ characterization of sugarcane root development. Application to develop a method for root biomass evaluation. Idessa-Cirad, Bouaké, Côte d'Ivoire (in French).
- Chopart, J.L.; Le Mézo, L.; Mézino, M. 2009. RACINE 2: Software application for processing root data from impact counts on soil profiles: Software and user guide. CIRAD, France. (in English, French and Portuguese).
- Chopart, J.L.; Vauclin, M. 1990. Water balance estimation model: Field test and sensitivity analysis. Soil Science Society of America Journal 54: 1377-1384.
- Chopart, J.L.; Siband, P. 1999. Development and validation of a model to describe root length density of maize from root counts on soil profiles. Plant and Soil 214: 61-74.
- Chopart, J.L.; Rodrigues, S.R.; Azevedo, M.C.B.; Medina, C.C. 2008a. Estimating sugarcane root length density through root mapping and orientation modelling. Plant and Soil 313: 101-112.
- Chopart, J.L.; Sine, B.; Dao, A.; Muller, B. 2008b. Root orientation of four sorghum cultivars: application to estimate root length density from root counts in soil profiles. Plant Root 2: 67-75.
- Costa, M.C.G.; Mazza, J.A.; Vitti, G.C.; Jorge, L.A.C. 2007. Root distribution, plant nutritional status, and stalk and sugar yield in two genotypes of sugarcane in distinct soils. Revista Brasileira de Ciência do Solo 31: 1503-1514. (in Portuguese, with abstract in English).
- Drew, M.C.; Saker, L.R. 1980. Assessment of a rapid method using soil cores for estimating the amount and distribution of crop roots in the field. Plant and Soil 55: 297-295.
- Dusserre, J.; Audebert, A.; Radanielson, A.; Chopart, J.L. 2009. Towards a simple generic model for upland rice root length density estimation from root intersections on soil profile. Plant and Soil 325: 277-288.
- Evans, H. 1936. The root system of sugar cane II: Some typical root systems. Empire Journal of Experimental Agriculture 4: 208-221.
- Habib, R.; Pages, L.; Jordan, M.O.; Simonneau, T.; Sébillotte, M. 1991. Water and mineral uptake by the root system of plants, with special regard to modeling absorption by the roots. Agronomie 11: 623-643. (in French, with abstract in English).
- Loague, K.; Green, R.E. 1991. Statistical and graphical methods for evaluating solute transport models: overview and application. Journal of Contaminant Hydrology 7: 51-73.
- Manichon, H. 1987. Morphological observation of the structural state of ploughed horizons and evidence of compaction effects. p. 39-52. In: Monnier, G.; Gross, M.J., eds. Soil Compaction and Regeneration. Rotterdam, Netherlands. (in French).
- Melhuish, F.M.; Lang, A.R.G. 1968. Quantitative studies of root in soil. I Length and diameters of cotton roots in a clay-loam soil by analysis of surface-ground block of resin-impregnated soil. Soil Science 106: 16-22.
- Monteith, N.H.; Banath, C.L. 1965. The effect of soil strength on sugarcane root growth. Tropical Agriculture 42: 293-296.
- Neves, C.S.V.J.; Feller, C.; Guimarães, M.F.; Medina, C.C.; Tavares Filho, J.; Fortier, M. 2003. Soil bulk density and porosity of homogeneous morphological units identified by the cropping profile method in clayey Oxisols in Brazil. Soil and Tillage Research 71: 109-119.
- Newman, E.I. 1966. A method of estimating the total length of roots in a sample. Journal of Applied Ecology 3: 139-145.
- Nicou, R.; Chopart, J.L. 1979. Root growth and development in sandy and sandy clay soils of Senegal. p. 375-384. In: Lal, R.; Greenland, D.J., eds. Soil physical properties and crop production in the tropics. Wiley, New York, NY, USA.
- Nicou, R.; Charreau, C.; Chopart, J.L. 1993. Tillage and soil physical properties in semi-arid West Africa. Soil and Tillage Research 27:125-147.
- Roger-Estrade, J.; Richard, G.; Manichon, H. 2000. A compartmental model to simulate temporal changes in soil structure under two cropping systems with annual moldboard ploughing in a silt loam. Soil and Tillage Research 54: 41-53.
- Smith, D.M.; Inman-Bamber, N.G.; Thornburn, P.J. 2005. Growth and function of the sugarcane root system. Field Crops Research 92: 163-189.
- Tardieu, F. 1988. Analysis of the spatial variability of maize root density. Effect of wheel compaction on water extraction. Plant and Soil 109: 257-262.
- Taylor, H.M.; Klepper, B. 1975. Water uptake by cotton root systems: an examination of assumptions in the single root model. Soil Science 120: 57-67.
- Taylor, H.M.; Klepper, B. 1978. Role of rooting characteristics. Advances in Agronomy 30: 99-128.
- Tennant, D. 1975. A test of a modified line intersect method of estimating root length. Journal of Ecology 63: 955-1001.
- Vasconcelos, A.C.M.; Casagrande, A.A.; Perecin, D.; Jorge, L.A.C.; Landell, M.G.A. 2003. Evaluation of the sugarcane root system with different methods. Revista Brasileira de Ciência do Solo 27: 849-858. (in Portuguese, with abstract in English).
- Vepraskas, M.J.; Hoyt, G.D. 1988. Comparison of the trench-profile and core methods for evaluating root distribution in tillage studies. Agronomy Journal 80: 166-172.
Publication Dates
-
Publication in this collection
13 Jan 2011 -
Date of issue
Feb 2011
History
-
Received
02 July 2009 -
Accepted
13 July 2010