
The Effect Of Visual Properties On Numerical Judgments In Ans Tasks


Abstract
Approximate number sense (ANS) is usually tested by blue-yellow dot test in which participants have to compare two sets of dots and to select larger set. Numerous studies have demonstrated that visual properties of sets such as surface area or convex hull have the effect on numerical judgment. It is unclear which characteristics of two sets – numerical or visual properties – have a larger effect on numerical judgment. In this study we have estimated the effect of two visual properties (surface area and convex area) on numerical judgments in intermixed format of presentation of dots. To fulfill our goal we use longitudinal sample of schoolchildren and estimate the effect of visual properties on numerical judgment in blue-yellow dot test in first and fourth grades. The sample included 138 participants (46% girls) from one urban school. The mean age at first grade was 7.84 years (SD = .34, range 7.06–8.37) and 10.77 years at fourth grade (SD = .36, range 9.72–11.85). We estimate the effect of visual properties adjusted for numerical properties of sets using multilevel regression models where trials are nested in individuals. Our results have revealed that in intermixed format surface area has a larger effect than convex area. The effect of surface area increases from first to fourth grade. Additionally, we demonstrate that the effect of visual properties varies depending on size of sets.
Keywords: ANSvisual propertiesnumerical proportionnumerical judgmentsurface areaconvex area
Introduction
The ability to perceive and approximately estimate numerosity without counting and using symbols is usually refered to as Approximate number system or sense (ANS) (e.g., Dehaene, 1997; Feigenson, Dehaene & Spelke, 2004). ANS is supposed to be evolutionary ancient and innate and present in animals and infants (Cantlon, Brannon, 2007; Xu & Arriaga, 2007; Lipton & Spelke, 2003). It is demonstrated that precision of ANS is correlated with later math achievement (Libertus et al., 2011; Mazocco et al., 2011; Starr et al., 2013). However, some studies failed to find significant correlation between ANS and math achievement (e.g., Tikhomirova et al., 2018; Rodic et al., 2015; Mussolin et al., 2012; Sasanguie et al., 2014).
The accuracy of ANS is often measured by “blue-yellow dot test” in which individuals have to compare two sets of dots and decide which one is bigger (e.g., Libertus et al., 2011; Halberda et al., 2008; Tikhomirova et al., 2015; Tikhomirova et al., 2014; Tosto et al., 2013). There are several peculiarities regarding to ability to compare two sets of objects without counting. The first one is the size effect that manifested in lower accuracy and larger reaction time during comparison of larger sets comparing to smaller sets (e.g., Dehaene, 2001). For example, participants are less precise when they have to compare 16 and 25 dots than 7 and 15 dots. Numerous studies also confirmed the existence of distance effect when participants were slower and less precise while comparing sets that are relatively similar in magnitude (Holloway & Ansari, 2009). Distance effect is the analogue of the numerical ratio effect that is demonstrated in the lower accuracy and the longer reaction time when the proportion between two compared sets increased (Lyons et al., 2015).
It was suggested that the accuracy of non-symbolic magnitude comparison skills was affected by visual properties of stimulus such as cumulative (surface) area (the sum of areas of all dots of one colour), convex hull area (the smallest area that included all dots of one colour) or density (e.g., Gebuis, Reynvoet, 2012a; Gilmore et al., 2011). Some authors proposed that comparison of sets of dots can be done based on comparison of several visual properties (Gebuis, Reynvoet, 2012c). Leibovich and Henik (2013) claimed that it is physically impossible to study discrete magnitudes in isolation from continuous visual properties. They suggested that it was the inseparable process of estimation of numerosity that involved estimation of continuous physical features (e.g., cumulative area or size of objects) and discrete properties (number of objects). Moreover, they suggested that in real life situation the information about visual properties alone was enough to accurately discriminate numerosities (Leibovich & Henik, 2013).
In order to confirm the effect of visual properties on accuracy of comparison of two sets of dots researchers manipulated different visual properties and identified two types of trials. The first type was congruent trials where visual properties positively correlated with magnitude. In these trials, for example, the set which contained more dots had a larger cumulative area or convex hull. The second type was incongruent trials where magnitude negatively correlated with visual properties. In this type, the set which contained more dots had a smaller cumulative area (e.g., Clayton, Gilmore & Inglis, 2015; Gilmore et al., 2016; Gebuis & Reynvoet, 2012b).
It was supposed that if visual properties did not affect numerical judgments, there were no differences in accuracy between congruent and incongruent trials. Meanwhile, it was demonstrated that accuracy of comparison was higher and reaction time was faster in congruent trials than in incongruent (congruency effect) (e.g., Szucs et al., 2013; Gebuis & Reynvoet, 2012a; 2012b). Congruency effect was supposed to confirm that numerosity judgmentsare based on estimation of visual properties of stimulus (Gebuis & Reynvoet, 2012a). In early studies of congruency effect only one visual feature was controlled, for example surface area or size of objects. Particularly, Hurewitz, Gelman and Schnitze (2006) demonstrated that participants tended to identify the set as larger in case it contained dots with larger diameters or larger surface area.
Later studies demonstrated that participants comparing two sets of dots might take into account several visual properties that sometimes provided contradictory information (Gebuis & Reynvoet, 2011). For example, there existed trials where cumulative area positively correlated with numerosity whereas convex hull negatively correlated with numerosity. It was demonstrated that the way of controlling visual properties of stimulus affects the accuracy of non-symbolic discrimination (Clayton, Gilmore & Inglis, 2015; Szucs et al., 2013). Under the conditions of several visual properties were controlled for (e.g., convex hull and surface area) the accuracy of comparison was lower than in in case with only one visual property was controlled for (Clayton, Gilmore & Inglis, 2015; Smets et al., 2016).
It was demonstrated that visual properties had a different effect on estimation of numerosity. Gilmore and colleagues (2016) demonstrated that the effect of congruency was higher for convex hull than for surface area (Gilmore et al., 2016). They also showed that convex hull had the effect on estimation of numerosity for both adults and children whereas the effect of surface area reduced with age. Another study demonstrated that the effect of surface area and convex hull varied depending on size of compared sets (Clayton & Gilmore, 2015). When the number of dots in both sets was relatively large (40-80 dots), the effect of convex hull was larger than the effect of cumulative area. When the number of dots was relatively small (10-19 dots), the effect of convex hull reduced whereas the effect of cumulative area became larger.
In most studies the close relationship between estimation of visual properties and numerosity was established based on existence of the congruency effect. It should be noted that some studies failed to find the congruency effect or obtained the opposite results when the accuracy was higher in incongruent trials (e.g., Odic et al., 2013). Clayton, Gilmore and Inglis (2015) supposed that these results might be explained by insufficient controlling for visual properties.
Several studies demonstrated that the effect of visual properties on numerosity estimation decreased with age (Soltész et al., 2010; Szucs et al., 2013; Tokita & Ishiguchi, 2013; Starr et al., 2017). Particularly, Szucs and colleagues (2013) showed that in congruent trials adults and children had an equal accuracy whereas in incongruent trials the accuracy was higher for adults. Gilmore and colleagues (2013) supposed that higher accuracy of adults in incongruent trials might be explained by higher inhibitory control (Gilmore et al., 2013). However, Starr, DeWind and Brannon (2017) demonstrated that there was no significant link between inhibitory control and non-numerical bias in non-symbolic comparison task.
Problem Statement
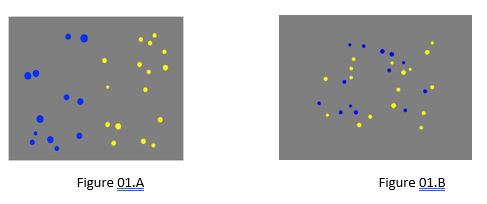
Existing studies of the effect of visual properties on numerosity estimation had several limitations. Firstly, the most findings regarding to congruency effect was done using protocols where compared sets of dots were presented separately (pared format) (Figure
Previously, it was shown that the accuracy was lower for intermixed format than for paired format and that paired presentation condition elicited the strongest numerical ratio effect for both reaction time and accuracy (Price et al., 2012). It is possible that the effect of visual properties on numerical judgment might be different in two formats.
Secondly, the estimation of the effect of visual properties was done mostly based on the observation of the congruency effect. The presence of the congruency effect was interpreted as the existence of the effect of visual properties. As a rule, congruency effect was established as a dichotomous effect (yes or no) and it was not described quantitatively. In order to demonstrate congruency effect researchers compared accuracy for congruent and incongruent trials. Within this approach characteristics of each trial were not estimated quantitatively (for example, in which degree surface areas of two sets were different) but only qualitatively (congruent or not congruent). In this approach, the variability between congruent trials was not taken into account. However, it is possible that accuracy can vary within congruent and incongruent trials and that this variability can be affected by visual characteristics of stimulus as well. The absence of the congruency effect does not unambiguously mean that visual properties do not affect the comparison of two sets. It is crucial to quantitatively estimate how different non-numerical features affect numerical judgments and how these effects change with age (Starr et al., 2017).
Thirdly, the investigation of developmental changes in the effect of visual properties in numerosity estimation was done using cross-sectional studies (e.g., Starr et al., 2017). To the best of our knowledge, there haven’t been any longitudinal studies that would estimate longitudinal changes of the effect of visual properties on estimation of numerosity.
Thirdly, the investigation of developmental changes in the effect of visual properties in numerosity estimation was done using cross-sectional studies (e.g. Starr et al., 2017). To the best of our knowledge, there haven’t been any longitudinal studies that would estimate longitudinal changes of the effect of visual properties on estimation of numerosity.
Research Questions
The main research question was to investigate the effect of visual properties of stimulus on accuracy and reaction time (RT) of ANS tasks which were presented in intermixed format. We suggested that comparison of two sets of dots was done based on visual properties of stimulus in both congruent and incongruent trials. We aimed to go beyond the dichotomy of congruency effect and to quantitatively estimate how different non-numerical features influence numerical judgments.
Purpose of the Study
The aims of study were:
To quantitatively estimate the effect of visual properties on accuracy and reaction time of numerical judgment in intermixed format controlling for numerical properties of sets.
To estimate changes in the effect of visual properties depending on size of sets.
To compare the effects of visual properties on numerical judgments for pupils in first and fourth grades.
Research Methods
Participants
The analysis for this study was conducted on the data collected within the “Cross-cultural Longitudinal Analysis of Student Success” (CLASS) project. For the aims of this study data of Russian schoolchildren were analyzed. The Russian sample included 138 participants (46% girls) from one urban school. The mean age at first grade was 7.84 years (SD = .34, range 7.06–8.37) and 10.77 years at fourth grade (SD = .36, range 9.72–11.85). A total of 100% of the participants were Russian. Some schoolchildren participated only once; thus, their data were removed from the analysis. The final sample consisted of 93 first-graders (48% girls). 100% of them participated in study in fourth grade.
The study received approval from the Ethics Committee of the Psychological Institute of the Russian Academy of Education. Parental and participant consent was obtained prior to data collection
Materials and procedure
All participants were tested in quiet settings within their school facilities by a trained experimenter. All measurement waves occurred at the end of the academic year (April-May). All experimenters strictly used the same protocol with instructions for testing administration across all measurements.
ANS accuracy. The non-symbolic comparison of numerosity task (blue-yellow dot test) was used to estimate ANS (Halberda et al., 2008). Participants were presented with arrays of yellow and blue dots, mixed together and varying in size and number. The task required the participants to judge whether the array contained more yellow or blue dots by pressing the responding keys on the keyboard. The stimuli were 150 static pictures, with the arrays of yellow and blue dots varying between 5 and 21 dots of each color and the ratios of the arrays in the two colors falling between 1:3 and 6:7. The presentation order was the same for all participants. The stimulus flashed on the screen for 400 ms, and the maximum response time was 8 sec. If no answer during this time was given, then the answer was recorded as wrong, and a message appeared on the screen to encourage pressing the space bar to see the next trial. The message disappeared after 20 sec, and the next trial was displayed only after pressing the space bar. The task contained a set of instructions, a practice trial with two items and an option to repeat the practice.
All trials were congruent by surface area, 33 trials (22%) were incongruent by total area.
Statistical approach
Each trial in blue-yellow dot test contains two sets of dots. It is possible to identify visual and numerical properties for each trial. Numerical properties are the number of dots in both sets (size of sets) and the numerical proportion between two sets. In addition to numerical features we identify two visual properties:
Surface area (the sum of areas of all dots of one color in the set).
Convex area (the area within convex hull – the smallest perimeters which included all dots within sets).
We calculated for each trial the proportion between two sets in surface and convex areas using the formula that in previous studies was used for calculation numerical proportion w:
w = (Largest set/smallest set) – 1.
The smaller is the value of w– the closer are two compared sets in surface or convex areas.
We estimate the effect of each visual properties using mixed effect or multilevel models (trials are nested within participants). Multilevel regression models allow disentangling the effect of trials’ characteristics from the effect of individuals’ characteristics and estimating within and between individuals’ variability. This enables to estimate the effect of trials’ characteristics more precisely.
In the first step, the dependent variable was the accuracy of numerical judgment (0 – incorrect answer, 1 – correct answer). As the dependent variable was dichotomous, we applied logistic multilevel regression and estimated how numerical and visual properties affected the probability of the correct answer. In the second step, the dependent variable was the reaction time for choice.
Initially we estimated independent effects of each numerical and visual properties on accuracy and RT of numerical judgments. To fulfill this goal we ran several regression models including each predictor separately. The predictors were: 1) surface areas proportion; 2) convex areas proportion; 3) numerical proportion between two sets; 4) size of sets (sum of all dots in two sets).
All independent variables were transformed into Z-scores in order to compare regression coefficients of different variables.
Next, we aimed to estimate the effect of visual properties adjusted for numerical properties and included visual and numerical properties into regression models. We did not include numerical proportion variable in regression models to avoid multicollinearity problem because numerical proportion and surface areas proportion were highly correlated (r = .96).
The sets of multilevel regression models were tested for each dependent variable:
Baseline model. Model without predictors. This model estimated mean log odds and reaction time across sample and estimated variability between trials and between individuals
Model 1. Surface areas proportion, convex areas proportion and size of sets were included as independent variables. This model enables to estimate the effect of visual properties on outcomes controlling for size of sets.
Model 2.Interaction term between size of sets and surface areas proportion was added. This interaction model estimated if the effect of surface areas proportion changed depending on size of comparing sets.
Model 3.Interaction between size of sets and convex areas proportion was added into the model. This model estimated if the effect of convex areas proportion changes depending on size of comparing sets.
These models were estimated for accuracy and reaction time for first- and fourth-graders.
Findings
Descriptive statistics
Descriptive statistics for dependent and independent variables are shown in Table
Descriptive statistics revealed that mean accuracy increased from first to fourth grade whereas RT decreased during this period.
The effect of visual and numerical properties on accuracy of numerical judgment
To test independent effects of numerical and visual properties on the accuracy of numerical judgments each predictor was added in regression model separately. The dependent variable was accuracy of numerical judgment (0 – incorrect answer, 1 – correct answer).
Results of analysis of separate effects of each visual and numerical property revealed that surface areas and convex areas proportions had the positive effects on accuracy of comparison of two sets. The f surface areas proportion had a larger effect in fourth grade than in first grade.
Size of sets had no significant effect on accuracy in first grade and had negative effect in fourth grade. Participants were less accurate in comparison of larger sets. Numerical proportion had a positive effect on accuracy of numerical judgment in first and fourth grades. This effect was larger in fourth grade than in first.
Next, we estimated the effect of visual properties on accuracy of numerical judgments adjusted for size of sets.
Results of multilevel regression analysis revealed that under control of size of sets surface areas proportion had the positive effect on accuracy in first and fourth grade whereas convex areas proportion had no significant effect. Size of sets had the significant positive effect on accuracy of comparison in first grade and had no effect in fourth grade. It should be noted that the effect of size of sets changed when visual properties were controlled for. The separate effect of size was insignificant in first grade and negative in fourth grade. Under control of visual properties, the effect became positive in first grade and insignificant in fourth grade.
The model with interaction terms demonstrated that the effect of visual properties significantly varied depending on size of sets. The positive effect of surface areas proportion on probability to give correct answer became smaller for larger sets in fist and fourth grades (Figure
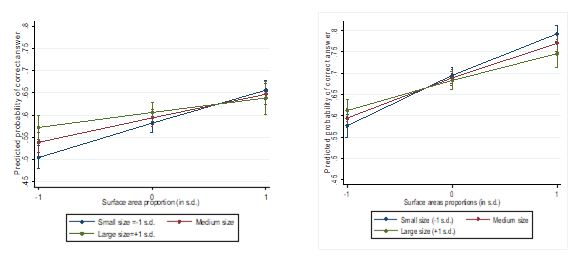
The negative effect of convex areas proportion was significant and negative for medium and large sets.

The effect of visual and numerical properties on RT of numerical judgment
The analysis of independent effects of each numerical and visual property revealed that surface areas proportion and numerical proportion had the positive effect on RT of numerical judgment in first grade and had a negative effect in fourth grade. Convex areas proportion had no effect on RT. Size of sets had the negative effect on RT in first and fourth grades.
Next, we estimated the effect of visual properties on RT of numerical judgments adjusted for size of sets.
The results of analysis of the effect of visual properties adjusted for size of sets revealed that the effect of surface areas proportion remained significant and positive in first grade. So the reaction time increased when ratio between surface areas of two sets increased. In fourth grade situation changed and the effect of convex areas ratio became negative and remained significant even after controlling for sets size. The effect of convex areas proportion was insignificant in first and fourth grades. The effect of size of sets was negative in first and fourth grade so RT decreased when size of sets increased.
The interaction terms were insignificant in first and fourth grades so the effect of surface areas proportion did not vary for trials with different size of sets. This was true for effect of convex areas ratio as well. Thus the effect of surface areas proportion on RT of numerical judgment did not vary depending in size of sets.
Conclusion
The main aim of the study was to estimate the effect of visual properties on numerical judgments in blue-yellow dot test. Our study had several distinctions from previous studies of the effect of visual properties.
The first distinction was that we went beyond the estimation of dichotomous congruency effect and quantitatively estimated the effect of two visual properties (surface area and convex area). In order to assess the effect of visual properties we calculated for each trial the proportion between convex areas of two sets and the proportion between surface areas of two sets and used multilevel regression analysis to calculate the effect of these characteristics. We assumed that if visual properties influenced accuracy or reaction time in blue-yellow dot test, these proportions had to be significant in regression models even after control for numerical properties.
The second distinction was that we estimated the effect of visual properties in intermixed format of dots presentation. The previous studies investigated the effect of visual properties in paired format of presentation and used the congruency effect as an indicator of the existence of the effect of visual properties. The third distinction is that we used longitudinal data to estimate developmental changes of the effect of visual properties on numerical judgments.
Our analysis demonstrated that the mean accuracy increased and RT decreased from first to fourth grades. Our results also confirmed the existence of size effect but only in fourth grade. In first grade the probability to give the correct answer in comparison tasks did not correlated with size of sets whereas in the fourth grade the probability to give correct answer decreased when size of sets increased. There existed the numerical ratio effect – the probability to give the correct answer increased when proportion between two compared sets increased.
The first aim of our study was to estimate the effect of visual properties on accuracy and on numerical judgment. Our analysis revealed that in intermixed format convex areas proportion has a smaller effect on numerical judgments comparing to the effect of surface areas proportion. In case when the effects of two visual properties were estimated separately, both proportions had the positive effect but the surface areas proportion had a larger effect. In case when size of sets was controlled, the effect of convex areas proportion became insignificant whereas the effect of surface areas proportion remained positive and significant. The probability to give the correct answer increased when proportion between surface areas increased. Our results were different from the results of some previous studies which demonstrated that convex area had a larger effect then surface area (e.g. Gilmore et al., 2016). A possible reason of differences was the format of presentation of stimulus. In intermixed format it might be difficult to estimate convex area for each color so participants did not take into account this visual property.
Surface areas proportion also had the effect on RT of numerical judgments. It is interesting that that this effect reversed from first to fourth grade. In first grade the effect was positive and in fourth it became negative. So participants were faster in numerical judgment when proportion in surface areas between two sets increased but only in fourth grades.
The second aim of our study was to estimate if the effect of visual properties varied as function of size of sets. Our results demonstrated that the effect of surface areas proportion on probability to give the correct answer was smaller for larger sets. This was true in first and fourth grades. The effect of convex areas proportion was significant and positive only for medium and large sets. It is possible that participants could not accurately estimate surface areas in large sets so the surface areas proportion was not taken into account in the process of numerical judgments. Our results were partially in line with study of Clayton and Gilmore (2015).They demonstrated that the effect of cumulative area decreased with size of sets whereas the effect of convex hull increased.
The third aim of our study was to estimate developmental changes of the effect of visual properties. Our analysis revealed that the effect of surface areas proportion on probability to give the correct answer increased from first to fourth grades. The effect of convex areas proportion did not change from first to fourth grades. It is possible that in fourth grade participants were able to estimate surface area more precisely and this effect manifested in growth of accuracy and reduction of RT needed for numerical judgments.
Our study had several limitations. Firstly, we did not estimate the effect of visual properties adjusted for numerical proportion. The analysis of independent effect of numerical properties revealed that numerical proportion had the significant effect on numerical judgment. As surface areas proportion and numerical proportion were highly correlated we could not disentangle the effects of numerical proportion and surface areas proportion. Secondly, as all trials were in intermixed format we could not be sure that the effect of visual properties were specific for intermixed format or for a specific age. Thirdly, the design of our study was not balanced on congruent and incongruent trials so we did not estimate and replicate the congruency effect. We also could not estimate the effect of visual properties separately for congruent and incongruent trials.
These problems might be solved in future studies. To disentangle the effect of surface area proportion from the effect of numerical proportion it is advisable to create stimulus in which these two properties will not be highly correlated. It is also advisable to balance congruent and incongruent trials and control both visual characteristics: surface area and convex hull. It enables to estimate both the dichotomous congruency effect and the continous effect of visual characteristics. In order to compare the effect of visual properties in different formats of presentation (intermixed and paired) it is advisable to create stimulus in both formats but with equal visual and numerical properties. Thus, stimuli are needed to be controlled by congruency, visual properties, numerical properties and different formats of presentation.
References
- Cantlon, J.F., & Brannon, E.M. (2007). Basic math in monkeys and college students. PLoS biology, 5(12), e328.
- Clayton, S., & Gilmore, C. (2015). Inhibition in dot comparison tasks. Zdm, 47(5), 759-770.
- Clayton, S., Gilmore, C., & Inglis, M. (2015). Dot comparison stimuli are not all alike: The effect of different visual controls on ANS measurement. ActaPsychologica, 161, 177-184.
- Dehaene, S. (1997). The number sense: How the mind creates mathematics. – OUP USA, 2011
- Dehaene, S. (2001). Précis of the number sense. Mind & language, 16(1), 16-36.
- Feigenson, L., Dehaene, S., & Spelke, E. (2004). Core systems of number. Trends in cognitive sciences, 8(7), 307-314.
- Gebuis, T., & Reynvoet, B. (2011). Generating nonsymbolic number stimuli. Behavior research methods, 43(4), 981-986.
- Gebuis, T., & Reynvoet, B. (2012a). Continuous visual properties explain neural responses to nonsymbolic number. Psychophysiology, 49(11), 1649-1659.
- Gebuis, T., &Reynvoet, B. (2012b). The interplay between nonsymbolic number and its continuous visual properties. Journal of Experimental Psychology: General, 141(4), 642.
- Gebuis, T., & Reynvoet, B. (2012c). The role of visual information in numerosity estimation. PloS one, 7(5), e37426.
- Gilmore, C., Attridge, N., & Inglis, M. (2011). Measuring the approximate number system. The Quarterly Journal of Experimental Psychology, 64(11), 2099-2109.
- Gilmore, C., Attridge, N., Clayton, S., Cragg, L., Johnson, S., Marlow, N., ...&Inglis, M. (2013). Individual differences in inhibitory control, not non-verbal number acuity, correlate with mathematics achievement. PloS one, 8(6), e67374.
- Gilmore, C., Cragg, L., Hogan, G., & Inglis, M. (2016). Congruency effects in dot comparison tasks: Convex hull is more important than dot area. Journal of Cognitive Psychology, 28(8), 923-931.
- Halberda, J., Mazzocco, M. M., & Feigenson, L. (2008). Individual differences in non-verbal number acuity correlate with maths achievement. Nature, 455(7213), 665.
- Holloway, I. D., & Ansari, D. (2009). Mapping numerical magnitudes onto symbols: The numerical distance effect and individual differences in children’s mathematics achievement. Journal of experimental child psychology, 103(1), 17-29.
- Hurewitz, F., Gelman, R., & Schnitzer, B. (2006). Sometimes area counts more than number. Proceedings of the National Academy of Sciences, 103(51), 19599-19604.
- Leibovich, T., & Henik, A. (2013). Magnitude processing in non-symbolic stimuli. Frontiers in Psychology, 4, 375.
- Libertus, M.E., Feigenson, L., &Halberda, J. (2011). Preschool acuity of the approximate number system correlates with school math ability. Developmental science, 14(6), 1292-1300.
- Lipton, J.S., & Spelke, E.S. (2003). Origins of number sense: Large-number discrimination in human infants. Psychological science, 14(5), 396-401.
- Lyons, I. M., Nuerk, H. C., & Ansari, D. (2015). Rethinking the implications of numerical ratio effects for understanding the development of representational precision and numerical processing across formats. Journal of Experimental Psychology: General, 144(5), 1021.
- Mazzocco, M.M., Feigenson, L., & Halberda, J. (2011). Preschoolers' precision of the approximate number system predicts later school mathematics performance. PLoS one, 6(9), e23749.
- Mussolin, C., Nys, J., Leybaert, J., & Content, A. (2012). Relationships between approximate number system acuity and early symbolic number abilities. Trends in Neuroscience and Education, 1(1), 21-31.
- Odic, D., Libertus, M. E., Feigenson, L., &Halberda, J. (2013). Developmental change in the acuity of approximate number and area representations. Developmental psychology, 49(6), 1103.
- Price, G.R., Palmer, D., Battista, C., & Ansari, D. (2012). Nonsymbolic numerical magnitude comparison: Reliability and validity of different task variants and outcome measures, and their relationship to arithmetic achievement in adults. Actapsychologica, 140(1), 50-57.
- Rodic, M., Zhou, X., Tikhomirova, T., Wei, W., Malykh, S., Ismatulina, V., ... &Kovas, Y. (2015). Cross-cultural investigation into cognitive underpinnings of individual differences in early arithmetic. Developmental Science, 18(1), 165-174.
- Sasanguie, D., Defever, E., Maertens, B., &Reynvoet, B. (2014). The approximate number system is not predictive for symbolic number processing in kindergarteners. Quarterly journal of experimental psychology, 67(2), 271-280.
- Smets, K., Moors, P., & Reynvoet, B. (2016). Effects of presentation type and visual control in numerosity discrimination: implications for number processing? Frontiers in psychology, 7, 66.
- Soltész, F., Szűcs, D., &Szűcs, L. (2010). Relationships between magnitude representation, counting and memory in 4-to 7-year-old children: A developmental study. Behavioral and Brain Functions, 6(1), 13.
- Starr, A., DeWind, N. K., & Brannon, E.M. (2017). The contributions of numerical acuity and non-numerical stimulus features to the development of the number sense and symbolic math achievement. Cognition, 168, 222-233.
- Starr, A., Libertus, M. E., & Brannon, E.M. (2013). Number sense in infancy predicts mathematical abilities in childhood. Proceedings of the National Academy of Sciences, 110(45), 18116-18120.
- Szucs, D., Nobes, A., Devine, A., Gabriel, F.C., & Gebuis, T. (2013). Visual stimulus parameters seriously compromise the measurement of approximate number system acuity and comparative effects between adults and children. Frontiers in Psychology, 4, 444.
- Tikhomirova, T., Kuzmina, Yu., & Malykh, S. (2018). Does Symbolic and Non-Symbolic Estimation Ability Predict Mathematical Achievement across Primary School Years? ITM Web of Conferences 2018, 18, 04006.
- Tikhomirova, T.N., Malykh, S.B., Tosto, M.G., Kovas, Y.V. (2014). Cognitive characteristics and mathеmatical achievement in high school students: cross-cultural analyses. Psihologicheskij zhurnal. 35(1), 41-53.
- Tikhomirova, T.N., Voronin, I.A., Misozhnikova, E.B., Malykh, S.B. (2015). The structure of the interrelation of the cognitive characteristics and academic achievement in school age. Teoreticheskaya i ehksperimental'naya psihologiya. 8(8), 55–68.
- Tokita, M., & Ishiguchi, A. (2013). Effects of perceptual variables on numerosity comparison in 5–6-year-olds and adults. Frontiers in Psychology, 4, 431.
- Tosto, M.G., Tikhomirova, T., Galajinsky, E., Akimova, K., Kovas, Y. (2013). Development and Validation of a Mathematics-number sense Web-based Test Battery. Procedia – Social and Behavioral Sciences, 86, 423-428.
- Xu, F., & Arriaga, R.I. (2007). Number discrimination in 10-month-old infants. British Journal of developmental psychology, 25(1), 103-108.
Copyright information

This work is licensed under a Creative Commons Attribution-NonCommercial-NoDerivatives 4.0 International License.
About this article
Publication Date
23 November 2018
Article Doi
eBook ISBN
978-1-80296-048-8
Publisher
Future Academy
Volume
49
Print ISBN (optional)
-
Edition Number
1st Edition
Pages
1-840
Subjects
Educational psychology, child psychology, developmental psychology, cognitive psychology
Cite this article as:
Kuzmina, Y., Tikhomirova, T., & Malykh, S. (2018). The Effect Of Visual Properties On Numerical Judgments In Ans Tasks. In S. Malykh, & E. Nikulchev (Eds.), Psychology and Education - ICPE 2018, vol 49. European Proceedings of Social and Behavioural Sciences (pp. 338-351). Future Academy. https://doi.org/10.15405/epsbs.2018.11.02.38