


Abstract
Drosophila Midline (Mid) is an ortholog of vertebrate Tbx20, which plays roles in the developing heart, migrating cranial motor neurons, and endothelial cells. Mid functions in cell-fate specification and differentiation of tissues that include the ectoderm, cardioblasts, neuroblasts, and egg chambers; however, a role in the somatic musculature has not been described. We identified mid in genetic and molecular screens for factors contributing to somatic muscle morphogenesis. Mid is expressed in founder cells (FCs) for several muscle fibers, and functions cooperatively with the T-box protein H15 in lateral oblique muscle 1 and the segment border muscle. Mid is particularly important for the specification and development of the lateral transverse (LT) muscles LT3 and LT4, which arise by asymmetric division of a single muscle progenitor. Mid is expressed in this progenitor and its two sibling FCs, but is maintained only in the LT4 FC. Both muscles were frequently missing in mid mutant embryos, and LT4-associated expression of the transcription factor Krüppel (Kr) was lost. When present, LT4 adopted an LT3-like morphology. Coordinately, mid misexpression caused LT3 to adopt an LT4-like morphology and was associated with ectopic Kr expression. From these data, we concluded that mid functions first in the progenitor to direct development of LT3 and LT4, and later in the FCs to influence whichever of these differentiation profiles is selected. Mid is the first T-box factor shown to influence LT3 and LT4 muscle identity and, along with the T-box protein Optomotor-blind-related-gene 1 (Org-1), is representative of a new class of transcription factors in muscle specification.
THE body wall muscles of the Drosophila larva are composed of a stereotypic pattern that includes 30 unique muscle fibers (each a single myotube) per abdominal hemisegment (Bate 1990). These muscles form during embryogenesis, during which time they take on unique characteristics such as size, shape, pattern of innervation, and epidermal attachment (Abmayr and Keller 1998; Baylies et al. 1998; Frasch 1999; De Joussineau et al. 2012). The unique identity of each muscle fiber is conferred through overlapping signaling pathways and cell autonomous transcription factors that specify muscle progenitors (Abmayr and Keller 1998; Baylies et al. 1998; Frasch 1999; Tixier et al. 2010), which then undergo asymmetric cell division to generate founder cells (FCs) (Bate 1990; Ruiz Gomez and Bate 1997; Carmena et al. 1998). A single FC initiates the formation of multinucleate syncytia by fusing with fusion competent myoblasts (FCMs) (Rochlin et al. 2010; Abmayr and Pavlath 2012). FCs dictate the number of cell fusion events that take place, leading to a characteristic number of nuclei for each muscle in the pattern (Bataille et al. 2010). These fusing nuclei adopt the transcriptional profile of the original FC nucleus (Bourgouin et al. 1992; D’Alessio and Frasch 1996; Ruiz-Gomez et al. 1997; Jagla et al. 1998; Keller et al. 1998; Nose et al. 1998; Crozatier and Vincent 1999; Knirr et al. 1999; Duan et al. 2007; Muller et al. 2010; Carrasco-Rando et al. 2011; Boukhatmi et al. 2012; Schaub et al. 2012), which determines the specific morphological features of each muscle fiber.
The identity of each FC, and its capacity to confer this identify on the resulting muscle fiber, is determined by expression of a unique combination of transcription factors in FCs (Baylies et al. 1998; Frasch 1999; Beckett and Baylies 2007; Tixier et al. 2010). Correspondingly, the loss or misexpression of these identity transcription factors (iTFs) can affect the formation and morphology of the specific muscles in which they are expressed. The loss of different iTFs can impact muscle formation in distinct ways. For example, the dorsal acute muscle 3 (DA3) is absent in nautilus (nau) loss-of-function embryos (Keller et al. 1998) and its FC adopts the morphology of its sibling dorsal oblique muscle 5 (DO5) (Enriquez et al. 2012). DA3 is also absent in collier (col) mutants and, instead, becomes a DA2-like muscle, the progeny of a different Col-expressing muscle progenitor (Crozatier and Vincent 1999; Enriquez et al. 2012). Thus, muscle progenitors are still capable of switching their fates. Following asymmetric division of the progenitor, many iTFs control cell fate choice specifically between the two sibling FCs. For example, Col is expressed in the DA3–DO5 progenitor, which gives rise to FCs for DA3 and DO5. Col expression is not normally maintained in DO5, but ectopic Col expression transforms its morphology to that of its DA3 sibling (Crozatier and Vincent 1999).
The lateral transverse (LT) muscles are a special set of four muscles in the center of the hemisegment. The LTs are thin, elongated fibers with dorsal/ventral orientations. Seven iTF-encoding genes are expressed in the LT muscles, including Krüppel (Kr) (Ruiz-Gomez et al. 1997), apterous (ap) (Bourgouin et al. 1992), muscle segment homeobox (msh) (Nose et al. 1998), araucan (ara)/caupolican (caup) (Carrasco-Rando et al. 2011), twist (twi) (Wong et al. 2008), and lateral muscles scarcer (lms) (Muller et al. 2010). Though similar in shape, the four LT muscles can be distinguished from each other by positional information and gene expression patterns. As an example, while Kr is expressed in the progenitors for LT1/2, LT3/4, and VA1/2, its expression becomes restricted to FCs for LT2, LT4, and VA2 (Ruiz-Gomez et al. 1997). The differentiated LT4 muscle is also distinguished by being shifted dorsally relative to the other three LTs. Moreover the LT4 muscle has fewer nuclei (four to six) compared to LT1–3 (six to eight per muscle) (Metzger et al. 2012). The genetic mechanisms regulating these morphological distinctions have not been identified.
Midline (Mid) is the Drosophila ortholog of vertebrate Tbx20. It is one of eight Drosophila T-box transcription factors and plays a fundamental role in cell fate choice in several differentiating tissues. In the nervous system, mutations in mid lead to the duplication of specific neurons and concomitant loss of their siblings (Buescher et al. 2006; Gaziova and Bhat 2009; Leal et al. 2009). Its loss impacts axon guidance (Liu et al. 2009) due to misspecification of surrounding neuroblasts (Manavalan et al. 2013). Mid and its paralog H15 play partially redundant roles in specification and differentiation of the embryonic ectoderm (Buescher et al. 2004) and in sensory organ precursor (SOP) cells in the eye imaginal disc (Das et al. 2013). Mid and H15 also promote cardioblast specification and heart morphogenesis (Miskolczi-McCallum et al. 2005; Qian et al. 2005; Reim et al. 2005), and it has been reported that Mid is both a target of the Tinman (Tin) transcriptional regulator (Qian et al. 2005; Ryu et al. 2011; Jin et al. 2013) and is required for tin expression (Reim et al. 2005). Despite these well-characterized roles in the Drosophila embryo, no study of mid in the somatic mesoderm has been described.
In this study, we have explored the role of mid (also referred to as neuromancer2, H15-related, and lost in space) (Kolodziej et al. 1995; Brook and Cohen 1996; Qian et al. 2005) in patterning the somatic muscles. We find that it influences the development of several muscles in different ways. Mid shows partial redundancy with the H15 T-box factor in development of the lateral oblique 1 (LO1) muscle and the segment border muscle (SBM). It also influences the ability of ventral acute 2 (VA2) to adopt the proper morphology. However, we find that its most profound impact is on the LT3 and LT4 muscle fibers. Mid is initially coexpressed with Kr in the progenitor for LT3/4 and, after division of this progenitor, both FCs. Consistent with this early expression pattern, both LT3 and LT4 are frequently absent in embryos mutant for mid. Expression of both Kr and Mid then declines in the FC for LT3 but is maintained in LT4. Consistent with this expression profile, loss of mid causes muscles in the LT4 position to be transformed to an LT3-like placement and myonuclear number. Interestingly, misexpression of Mid in wild-type embryos can cause the apparent transformation of LT3 to LT4 with respect to position, Kr expression, and myonuclear number. These data implicate the conserved Tbx transcription factor Mid as a novel iTF for the specification of the LT3/4 progenitor and the regulation of cell fate choice between LT3 and LT4.
Material and Methods
Fly stocks and genetics
The location of EMS-induced allele mid8A69N1 was initially determined by complementation analysis using the Bloomington deficiency collection for the second chromosome. The following stocks were obtained from the Bloomington Stock Center: mid1 (Nusslein-Volhard et al. 1984), midlos1 (Kolodziej et al. 1995), mid2 (Nusslein-Volhard et al. 1984), and Df(2L)GpdhA and Df(2L)BSC810 (Cook et al. 2012). mid1, mid2, and midlos1 are embryonic lethal alleles (Nusslein-Volhard et al. 1984; Buescher et al. 2004; Liu et al. 2009; FlyBase). The mid1 allele is null as a consequence of a point mutation (C659T) that introduces a stop codon in the mid coding sequence. The mid2 allele is a C1758T nucleotide substitution that also introduces a stop codon. Finally, the midlos1 allele is the result of a 22-bp deletion at position 321, which deletes seven amino acids and causes a frame shift leading to a stop codon. Df(2L)exe16012, twi-GAL4 (Bloomington stock no. 914), Mef2-GAL4 (Baylies and Bate 1996), 24B-GAL4 (Brand and Perrimon 1993), H15(nmr1210) (Qian et al. 2005), and Df(2L)x528 (Buescher et al. 2004) were obtained from Sandra Leal; UAS-mid (Liu et al. 2009) was obtained from Susumu Hirose; and apME680-GFP (ap-GFP) (Capovilla et al. 2001) was obtained from Manfred Frasch. Analysis of the mid and H15 mutant phenotypes utilized Df(2L)x528/Df(2L)GpdhA (Buescher et al. 2004) and mid1/Df(2L)BSC810 (Gaziova and Bhat 2009). The breakpoints of Df(2L)BSC810 have been defined molecularly (Cook et al. 2012). The nmr210 null allele of H15 was generated by imprecise excision of a P-element, which deleted a region from −331 bp to +10,580 bp, including the 5′-UTR, transcription and translation start sites, as well as the entire DNA binding domain (Qian et al. 2005; FlyBase). Mutant flies are, however, both viable and fertile. twipromoter-actin::GFP was used to mark total somatic muscle and apME-GFP (apME-GFP) was used to mark Ap-expressing muscles for FACS as previously described (Richardson et al. 2007). apME-NLS::dsRed (apRed) was used for nuclei quantitation and has been described (Richardson et al. 2007; Metzger et al. 2012). The second chromosome balancers were CyO,P{(w[+mC]=GAL4-twi.G)}2.2,P(UAS-2xEGFP)AH2.2 and CyO,P{ry[+t7.2]=en1}wgen11. Misexpression of Mid in the musculature under control of 24B-GAL4, twi-GAL4 and Mef2-GAL4 was carried out at 16° while twi-GAL4 was carried out at 16° or 25°, as indicated.
Sequencing determination of mid mutant allele
Genomic DNA was isolated from embryos from the mid8A69N1 homozygous mutant and the parent isogenic line. All exons were PCR amplified and both strands sequenced. A single mutation was identified.
Generation of antibodies
Antisera were generated in guinea pigs against aa 71–193 of Mid and aa 330–520 of Kr. Rabbit antisera was generated against aa 1–201 of Kr (PRF&L). Crude antisera were affinity purified against the original bacterial protein coupled to Affi-Gel according to manufacturer instructions (Bio-Rad).
Immunohistochemistry and immunofluorescence
Embryos were collected and processed as described previously (Erickson et al. 1997; Richardson et al. 2007). The following antisera were used. Affinity purified antisera is indicated (AP): guinea pig anti-Krüppel (1:250), rabbit anti-Krüppel (AP, 1:1500), guinea pig anti-Mid (AP, 1:800), mouse antimyosin heavy chain (MHC, 1:100, FMM5C8, gift from D. Kiehart), chicken anti-β-galactosidase (1:500, Abcam no. 9361), chicken anti-GFP (1:500, Abcam no. 13970), rabbit anti-GFP (1:500, Abcam no. 290), rat antitropomyosin (Tropo, 1:1000, Abcam MAC141), and mouse anti-β-PS-integrin (1:50, Developmental Studies Hybridoma Bank). Rabbit anti-Mid (1:800) was obtained from Susumu Hirose (Liu et al. 2009); mouse anti-Lb (1:3000) was obtained from Krzystof Jagla (Jagla et al. 1998); rat anti-Org-1 (1:200) was obtained from Manfred Frasch (Schaub et al. 2012); rabbit anti-Slouch (1:200) (Beckett and Baylies 2007), rat anti-Ara, and anti-Caup (1:200) were obtained from Sonsoles Campuzano (Diez del Corral et al. 1999); and anti-Stripe A (1:200) was obtained from Talila Volk (Becker et al. 1997). Secondary antibodies included Alexa Fluor-conjugated antichicken, antirat, antimouse, antirabbit, and anti-guinea pig (1:200, Invitrogen). Alexa Fluor 488-conjugated phalloidin (1:100) was added along with secondary antibodies for detection of F-actin. Colorimetric detection used biotinylated antimouse secondary antibodies (1:200, Vector Laboratories) and the Vectastain ABC Elite kit (Vector Laboratories). Fluorescent signal amplification used biotinylated anti-guinea pig secondary antibody and biotinylated antichicken secondary antibody (1:500, Vector Laboratories) and followed the protocol as described in the TSA kit (Tyramide Signal Amplification kit from Life Technologies).
Confocal microscopy and image processing
For Figure 1, Figure 2, Figure 3, Figure 4, Figure 5, Figure 6, and Supporting Information, Figure S2, Figure S5, and Figure S6, confocal microscopy was performed on fixed embryos using Zeiss LSM 510 VIS and Zeiss LSM 700 Falcon microscopes with a Plan-Apochromat ×40/1.3 oil DIC objective. The pinhole was kept at 1.0 Airy unit. Confocal images were processed using LSM Image Browser (Zeiss) and reoriented using IMARIS (Bitplan). Isosurfacing of the fluorescent images was carried out from confocal Z-series using IMARIS, and 2D images of the 3D files have been incorporated into the figures. For Figure 7, Figure S1, and Figure S3, fluorescent images were acquired on a Leica SP5 laser-scanning confocal microscope equipped with a 63 1.4 NA HCX PL Apochromat oil objective and LAS AF 2.2 software. The pinhole was kept at 1.0 Airy unit. Maximum intensity projections of confocal z-stacks were rendered using Volocity (Perkin Elmer). All images were processed using Adobe Photoshop CS4.
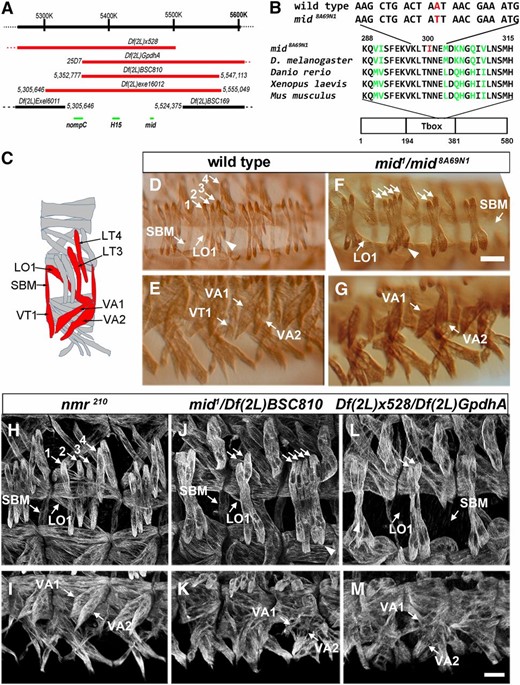
Identification of mid as a gene regulating somatic muscle morphogenesis. (A) The mid/H15 genomic region and corresponding map positions of deletions used in this study. The minimal overlapping area among the deficiencies that fail to complement contains three protein coding genes, six uncharacterized nonprotein coding genes, and one snoRNA gene (not shown). The molecular breakpoints are shown for deficiencies that have been mapped to genome sequence. (B) The sequence lesion in the nonnull allele mid8A69N1 changes aa 300 in the T-box domain from N to I. (C) Schematic representation of somatic muscle pattern, with analyzed muscles shown in red. (D–M) Stage 16 embryos stained with muscle myosin corresponding to wild-type (D and E), mid1/mid8A69N1 (F and G), nmr1210 (H and I), mid1/Df(2L)BSC810 (J and K), and Df(2L)x528/Df(2L)GpdhA, which lacks both mid and H15 (L and M) embryos. Lateral (D, F, H, J, and L) and ventral (E, G, I, K, and M) views. The arrowhead in F and J denotes the change in position of the fourth LT compared to wild type. The 1–4 represents LT1–4 muscles. Bar, 15 µm.
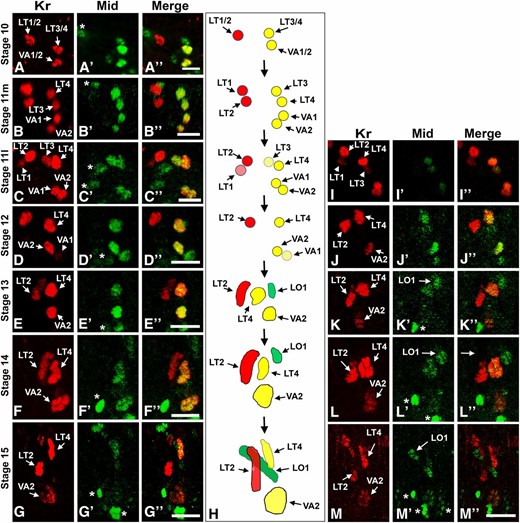
Mid and Kr expression in the muscle lineages. All are lateral views of a single abdominal hemisegment of embryos immunostained for Kr (red, A–G and I–M) and Mid (green A′–G′ and I′–M′), with merged data in (A′′–G′′ and I′′–M′′). (A) Coexpression of Mid and Kr is seen in the LT3/4 and VA1/2 progenitors. (B) By mid stage 11, coexpression of Mid and Kr are observed in FCs for LT3, LT4, VA1, and VA2. (C and I) Mid and Kr coexpression continues in FCs for LT4, VA1, and VA2 in late stage 11, but both Mid and Kr are reduced in the FC for LT3. (D–G) Mid and Kr are lost from the developing LT3 myotube but continue to be detected in LT4. (H) Schematic representation of Mid and Kr coexpression during LT3, LT4, VA1, VA2, and LO1 development. (J) No expression is apparent in FCs for LO1 and VT1 at stage 12, though Mid is apparent in FCs for LT4 and VA2 as in D–G. (K–M) Mid expression is detectable in the LO1 FC and becomes apparent in the muscle by stage 15. The asterisk in A–G and I–M indicates nonmuscle Mid-expressing cells. Where indicated, m and l refer to mid and late stage, respectively. Bar, 10 µm.
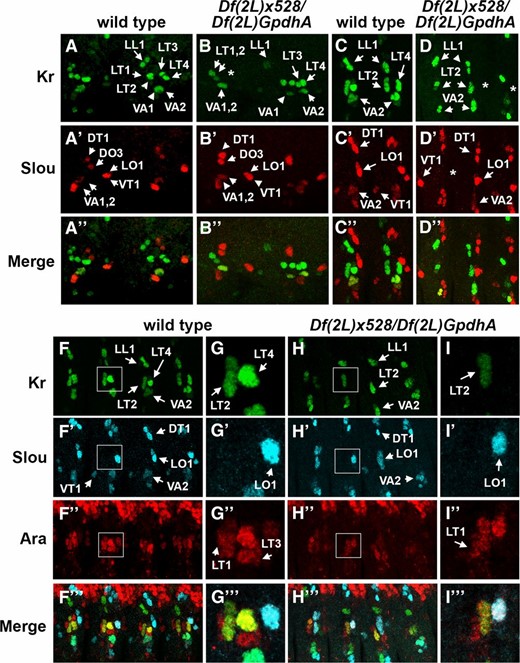
Founder cells for LT3, LT4, LO1, and the VT1, but not VA2, are impacted by the loss of mid. Lateral views of abdominal hemisegments from stage 11 embryos (B and C), stage 14 (D and E), and stage 13 (F–I), immunostained for Kr, Slou, and Ara, as indicated. Wild type is shown in B, D–D′′, F–F′′′, and G–G′′′, while Df(2L)x528/Df(2L)GpdhA, which lacks both mid and H15, is shown in C, E–E′′, H–H′′′, and I–I′′′. Asterisks indicate missing FCs for LT3 and LT4 (C and E), and LO1 (E′). The absence of both Kr- and Ara-expressing FCs for LT3 and LT4 was apparent in stage 13 embryos (H–I′′′). Enlarged view of area outlined in white (F and H) is shown in G and I, repectively. Note that expression of Ara in the FC for LO1 has not been reported previously. Bar, 10 µm.
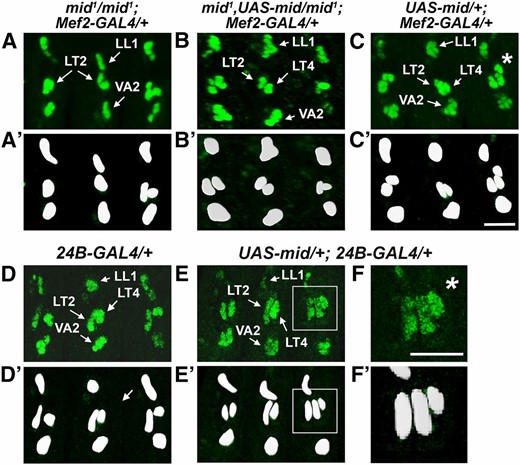
Panmesodermal expression of Mid rescues Kr-expressing cells in mid mutants and generates extra Kr-expressing cells. Lateral views of stage 14 embryos immunostained for Kr. (A) mid1/mid1; Mef2-GAL4/+, (B) mid1, UAS-mid/mid1; Mef2-GAL4/+, (C) UAS-mid/+; Mef2-GAL4/+, (D) 24B-GAL4/+, and (E) UAS-mid/+; 24B-GAL4/+. (A′–F′) Digital 2D snapshots of Kr-expressing cells that were isosurfaced from confocal Z-series in 3D using Imaris (Bitplan). (A) Kr-expressing cells in the position of LT4 were absent in mid mutants, suggesting that mid is critical for specification and/or Kr expression in the FC for LT4. (B) The presence of Kr-expressing cells in the LT position of mid mutant embryos upon panmesodermal expression of mid suggests that mid expression is sufficient for the LT4 FC. (F and F′) Enlarged view from E and E′. (C, E, and F) Additional Kr-expressing cells were visible in the LT position upon misexpression of mid in wild-type embryos (asterisks). Bar, 10 µm.
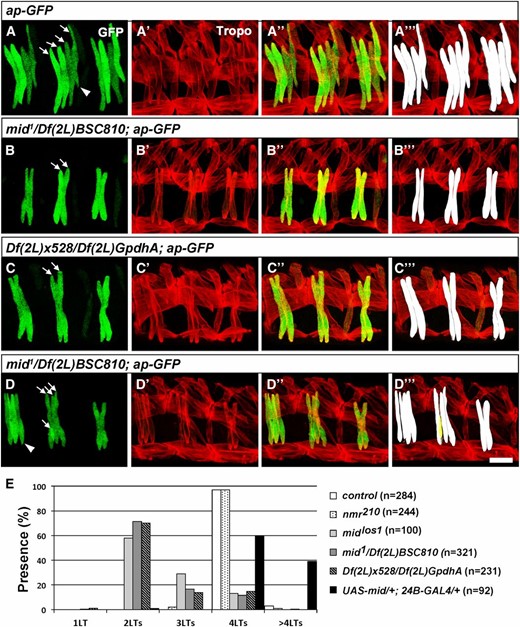
Loss of muscles LT3 and LT4 in mid and mid, H15 mutant embryos. (A–D) Lateral views of stage 16 embryos immunostained for tropomyosin (Tropo) and for GFP driven by the ap-GFP transgene. (A–A′′′) ap-GFP control. (B–B′′′ and D–D′′′) Embryos trans-heterozygous for mid1/Df(2L)BSC810; ap-GFP. (C–C′′′) Embryos trans-heterozygous for Df(2L)x528/Df(2L)GpdhA; ap-GFP that lack mid and H15. (A′′′–D′′′) Digital 2D snapshot of GFP-expressing LTs that were isosurfaced in 3D from confocal Z-series in Imaris (Bitplan). (D′′′) Note small extra syncytia (yellow) in some segments of mid mutant embryos. Arrows indicate LTs and the arrowhead in D refers to the altered ventral limit of LT4. Bar, 15 µm. (E) Quantitation of phenotypes produced by loss of H15 alone, mid alone, mid and H15, or panmesodermal expression of Mid. n = abdominal hemisegments.
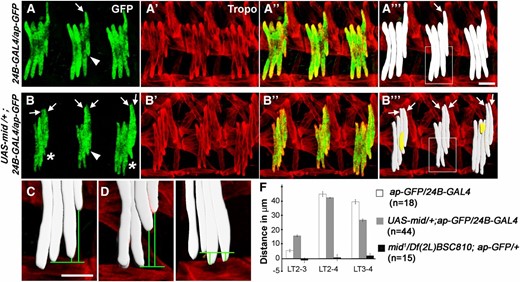
Panmesodermal expression of Mid causes a morphological conversion of LT3 to LT4. Lateral views of stage 16 embryos immunostained for tropomyosin (Tropo) and GFP directed by the ap-GFP transgene. (A–A′′′ and C) ap-GFP/24B-GAL4 and (B–B′′′ and D) UAS-mid/+; ap-GFP/24B-GAL4. (A′′′–B′′′) Digital 2D snapshot of GFP-expressing LTs that were isosurfaced in 3D from confocal Z-series in Imaris (Bitplan). (B′′′) Note that additional small syncytia are apparent in some segments (yellow). The asterisk in B denotes segments with extra muscles, arrowhead denotes the dorsally shifted LT3 muscle, and arrows indicate LTs. (C–E) Enlarged views from A′′′, B′′′, and Figure 2D′′′, respectively, showing the dorsal shift of LT4 in wild-type embryos (C), dorsal shift of both LT3 and LT4 upon panmesodermal expression of Mid (D), and lack of this shift in mid mutants (E). Bar, 15 µm. (F) Quantitation of the difference in the ventral limit in wild-type, panmesodermal expression of Mid and loss of mid. LT2/3, LT2–4, and LT3/4 corresponds to the height difference between LT2 and LT3, LT2 and LT4, and LT3 and LT4, respectively. n = abdominal hemisegments.
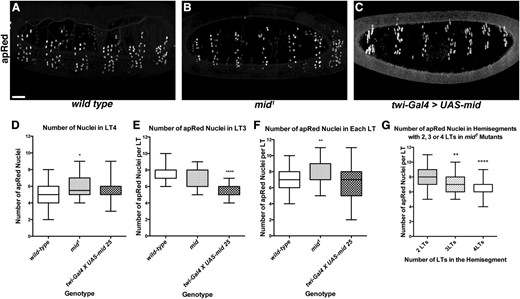
Loss and gain of Mid affects the number of fusion events in LT3 and LT4. (A–C) Lateral views of stage 17 live embryos expressing the apRed transgene. Approximately six hemisegments are shown. (A) Wild type (apRed) embryo. (B) mid1; apRed homozygote. (C) twi-GAL4, apRed > UAS-Mid. (D) Box and whisker plot showing comparison of the number of apRed-positive nuclei only in the fourth most posterior LT muscle in a hemisegment. Significance (P = 0.03) is indicated with an *. (E) Comparison of the number of apRed-positive nuclei only in the third most posterior LT muscle in a hemisegment. Significance is shown as ****P < 0.0001. (F) Comparison of the number of apRed-positive nuclei per LT muscle in a single hemisegment between wild type and mid1; apRed mutant. Significance is shown as **P = 0.0015. (G) Comparison of the number of apRed-positive nuclei per LT muscle in mid1; apRed mutant hemisegments where there were two, three, or four total LT muscles. Significance between two and three LTs is indicated as **P = 0.0049. Significance between two and four LTs is indicated as ****P = 1.75 × 10⁻⁷. Bar, 25 μm.
Quantitation
Muscle phenotypes were analyzed using immunostaining for MHC or Tropo plus ap-GFP. Final data were derived from two to three independent datasets for each genotype, with similar datasets from both labs and including both ap-GFP-marked and unmarked LTs. All quantitation was done double blind in coded samples from confocal projections using LSM Image Browser or Imaris.
To determine the extent of the dorsal shift, the distance between LT2/3, LT3/4, and LT2–4, confocal projection images was determined. LT2 served as a control since it neither expressed nor was affected by mid. The approximate vertical distance between the tip of LT2, LT3, and LT4 was determined in IMARIS. A horizontal line was drawn at the ventral tip of LT2 to intersect the vertical line from the tip of LT3 and LT4 (Figure 6). A dorsal shift in LT3 and LT4 relative to LT2 was considered positive, whereas a position more ventral than that of LT2 was considered negative.
Myonuclei were counted live at stage 17 using expression of the apRed transgene. Data were analyzed using GraphPad Prism v.6.0 software, and significance was calculated using an unpaired Student’s t-test. For comparison of the number of ap-Red-positive nuclei, only hemisegments in which there were four LTs were counted: apRed (n = 36 hemisegments), mid1; apRed homozygous mutants (n = 10 hemisegments), and twi-GAL4, apRed > UAS-mid (n = 10 hemisegments). Within the mid1 mutants, hemisegments in which there were two LTs (n = 52 hemisegments) were shown to have a significantly greater number of nuclei per LT than those hemisegments in which there were three LTs (n = 6 hemisegments) or four LTs (10 hemisegments).
Results
Mid mutants exhibit defects in the pattern of larval body wall muscles
A role for mid in Drosophila somatic muscle development was identified via whole genome gene expression analysis in which mid was upregulated (2.2-fold) in ap-expressing FCs (LTs 1–4, VA2/3) when compared to total somatic musculature. Briefly, cells were labeled with ap-GFP, purified by fluorescence activated cell sorting, transcriptionally profiled by microarray analysis, and compared to cells expressing twiprom-actin::GFP (Dobi et al. 2014). Simultaneously, Mid was identified on the basis of its loss-of-function phenotype in an EMS screen for mutations that impact muscle development. Deficiency mapping localized this mutation (hereafter referred to as mid8A69N1) to cytological region 25D6–25E5 (Figure 1A). Molecular analysis revealed that mid8A69N1 contains a point mutation that causes an N300I amino acid change in the Mid T-box region (Figure 1B). Complementation studies with mid1, an embryonic lethal allele (Nusslein-Volhard et al. 1984; Buescher et al. 2004), indicated that mid8A69N1 is allelic to mid1, and phenotypic analysis of embryos trans-heterozygous for mid8A69N1 and mid1 (Figure 1, D–G) confirmed that mutations in mid were the source of these muscle defects. We observed both disorganized and/or missing muscle fibers in 100% of the hemisegments in 100% of the mid mutant embryos (Table S1). Since mid and H15 have been shown to play partially redundant roles in some tissues (Brook and Cohen 1996; Qian et al. 2005), we next included the adjacent mid paralogous gene H15 (also referred to as neuromancer1 or nmr1) in our analysis. These studies used nmr210, which is viable and fertile, and the embryonic lethal combination Df(2L)x528/Df(2L)GpdhA, which deletes both genes (Buescher et al. 2004). Whereas mutations in H15 alone had no impact on muscle pattern (Figure 1, H and I), we found that it functioned redundantly with mid in the formation of some, but not all, muscles (Figure 1, J and M, Table 1, and see below).
Quantitation of muscle phenotypes in embryos mutant for H15 or mid or H15, mid
| nmr1210 | mid1/mid8A69N1 | mid1/Df(2L)BSC810 | Df(2L)x528/Df(2L)GpdhA | ||
|---|---|---|---|---|---|
| Mid expression | Muscles | Percentage of muscles presenta | |||
| No | LT1 | 100 | 100 | 100 | 99.5 |
| No | LT2 | 100 | 98.6 | 100 | 99.5 |
| Yes | LT3 | 100 | 36 | 28 | 29 |
| Yes | LT4 | 98 | 23 | 14 | 17 |
| Yes | VA1 | 100 | 100 | c | d |
| Yes | VA2 | 100 | 94.2 | c | d |
| Yes | LO1 | 100 | 94.22 | 76 | 43 |
| Yes | VT1 | 100 | 100 | d | d |
| No | SBM | 100 | 76 | 69 | 49 |
| No | DTb | 100 | 100 | 100 | 100 |
| No | LLb | 100 | 100 | 100 | 100 |
| n | 180 | 270 | 140 | 175 | |
| e | 18 | 23 | 15 | 18 | |
n, no. of segments; e, no. of embryos.
Included only muscles in wild-type position.
DT1 (dorsal transverse 1) and LL1 (lateral longitudinal 1) scored as controls due to close proximity to LT4.
VA1/VA2 appear to be present but morphologically abnormal in 92% of hemisegments.
Muscles not scored due to morphological abnormalities.
| nmr1210 | mid1/mid8A69N1 | mid1/Df(2L)BSC810 | Df(2L)x528/Df(2L)GpdhA | ||
|---|---|---|---|---|---|
| Mid expression | Muscles | Percentage of muscles presenta | |||
| No | LT1 | 100 | 100 | 100 | 99.5 |
| No | LT2 | 100 | 98.6 | 100 | 99.5 |
| Yes | LT3 | 100 | 36 | 28 | 29 |
| Yes | LT4 | 98 | 23 | 14 | 17 |
| Yes | VA1 | 100 | 100 | c | d |
| Yes | VA2 | 100 | 94.2 | c | d |
| Yes | LO1 | 100 | 94.22 | 76 | 43 |
| Yes | VT1 | 100 | 100 | d | d |
| No | SBM | 100 | 76 | 69 | 49 |
| No | DTb | 100 | 100 | 100 | 100 |
| No | LLb | 100 | 100 | 100 | 100 |
| n | 180 | 270 | 140 | 175 | |
| e | 18 | 23 | 15 | 18 | |
n, no. of segments; e, no. of embryos.
Included only muscles in wild-type position.
DT1 (dorsal transverse 1) and LL1 (lateral longitudinal 1) scored as controls due to close proximity to LT4.
VA1/VA2 appear to be present but morphologically abnormal in 92% of hemisegments.
Muscles not scored due to morphological abnormalities.
Muscles form correct attachments in mid mutants
Since signaling pathways from the ectoderm serve to pattern the underlying mesoderm, we wished to confirm that the muscle defects in mid mutants were not due to ectodermal defects. Prior work showed that the pattern of mid1 mutant cuticles did not display gross abnormalities, though they did have some patches of naked cuticle (Buescher et al. 2004). To examine ectodermal patterning in a more detailed way, we stained mid1 embryos for Stripe (Sr) A expression, a marker of differentiated tendon cells (Volk 1999) (Figure S1, A and B). We found that tendon cells were appropriately specified in mid mutants (Figure S1B), showing that the overlying epidermis was not severely mispatterned and supporting the conclusion that mid defects are due to the loss of Mid within the muscle. Since strong epidermal staining of SrA makes it difficult to image the internal tendons to which LT muscles attach, we also performed a staining for β-PS-integrin/myospheroid, which is enriched at myotendinous junctions. We found that there was an enrichment of β-PS-integrin at the poles of the LT muscles in both wild type and mid1 homozygous mutant embryos (see arrows, Figure S1, C and D), suggesting that these muscles formed correct attachments to the internally located tendons. Taken together, our data are consistent with a cell autonomous role for Mid in the muscles.
Mid is expressed in a subset of progenitors, founder cells, and developing muscle fibers
Previous reports have described the expression of Mid in the embryonic ectoderm, neuroblasts, and cardiomyoblasts (Buescher et al. 2004; Gaziova and Bhat 2009; Leal et al. 2009; Liu et al. 2009; Formaz-Preston et al. 2012), but did not note expression in the somatic musculature. To evaluate whether the observed muscle phenotypes correlate with Mid expression, and support the hypothesis that Mid functions in a cell autonomous manner in the musculature, we examined the pattern of Mid from stages 10–15 of myogenesis (Figure 2). Note that multiple panels are provided for several stages since visualization of all Mid-expressing muscles is not optimal in a single panel. In addition, we chose to confirm low levels of Mid expression at critical stages with multiple images. Since our preliminary analysis suggested that the LT and VA muscles appeared to be impacted by the loss of mid, we relied on the presence of the iTF Kr (Ruiz-Gomez et al. 1997) as a landmark to ensure proper identification of these progenitors. In wild-type embryos, Kr is expressed in the progenitors of LT1/2, LT3/4, and VA1/2, and maintained in the founders of LT2, LT4, and VA2. At stage 10, we found that Mid was coexpressed with Kr in the LT3/4 progenitor and VA1/2 progenitor but not that of LT1/2 (Figure 2A). Kr continued to be detected in the FCs for LT1–4, VA1, and VA2 immediately after division and was detectable through stages 14 and 15 (Ruiz-Gomez et al. 1997; Beckett and Baylies 2007; Carrasco-Rando et al. 2011), but declined in the LT1, LT3, and VA1 FCs by late stage 11 (Figure 2, B–D) (Ruiz-Gomez et al. 1997; Beckett and Baylies 2007; Carrasco-Rando et al. 2011). Similarly, Mid was lost in the VA1 and LT3 FCs by stage 12 but, like Kr, was detectable in the FCs and the growing VA2 and LT4 muscles into stage 15 (Figure 2, E–G, Figure S2). We next examined mid expression in the progenitors for LO1/ventral transverse 1 (VT1) and the SBM, since these muscles appeared to exhibit defects in mid mutant embryos. The founder cells for LO1 and the SBM have been shown to express Org-1, while the SBM expresses Ladybird (Lb) (Busser et al. 2012; Schaub et al. 2012). Thus we used these markers to identify the LO1/VT1 and SBM progenitors. We were unable to detect Mid in the LO1/VT1 progenitor but observed weak expression in the resulting VT1 FC and strong expression in its sibling LO1 (Figure 2, J–L, Figure S2). We did not detect Mid in the SBM using Org-1 and Lb as points of reference (Figure S2).
Perturbations of FCs for muscles affected by mid loss
We next examined mid, H15 mutant embryos for the presence of the above Mid-expressing progenitors and FCs for a variety of muscles using Kr and Slou as reporters (Figure 3). In the absence of mid, Kr expression associated with LT2 and lateral longitudinal 1 (LL-1) was still present. However, a Kr-expressing cell in the position of the developing LT4 muscle was frequently absent in both stage 11 and stage 14 embryos (Figure 3, C and E, respectively). Moreover, cells expressing Ara, which appears to act at an early stage in specification of the progenitors for the LT muscles (Carrasco-Rando et al. 2011), were not detected near the positions of LT3 and LT4 at stage 13 (Figure 3, H and I). These data suggested that, even at fairly early stages, the FC for LT4 either ceased to express both Ara and Kr or did not persist in the absence of mid. However, since alternative methods for clearly monitoring the presence of these FCs do not currently exist, we cannot distinguish between these two possibilities. The presence of progenitors and FCs for VA1, VA2, LO1, and VT1, which also express Mid, was monitored in mid, H15 mutant embryos using Kr and Slou. Quantitation revealed that the Slou positive FCs for VT1 and LO1 were missing in ∼25% of hemisegments, suggesting that loss of Mid affects the specification of these muscles (Figure 3, B–D, Table 2). However, despite robust expression of Mid and Kr in the VA1/2 progenitor and VA2 FC (Figure 2), this FC was unaffected by the loss of mid and H15 (Figure 3, B–H).
Quantitation of founder cells present in mid mutant embryos
| Stage 13–14 (% presence) | |||||||
|---|---|---|---|---|---|---|---|
| Muscles | LT2a | LT4b | VA2a | LL1a | LO1b | VT1b | SBMb |
| FC markers | Kr+ | Kr+ | Kr+ | Kr+ | Kr− | Kr+ | Lb+ |
| Slou− | Slou− | Slou+ | Slou− | Slou+ | Slou+ | ||
| Wild type (n = 20) | 100 | 100 | 100 | 100 | 100 | 100 | 98.8 |
| Df(2L)X528/Df(2L)GpdhA (n = 48) | 100 | 33.33 | 100 | 100 | 75 | 72.9 | 62.1 |
n, no. of segments.
LT2, VA2, and LL1 scored as controls due to close proximity to LT4.
Examined only muscles in the LT, LO, VT, and SBM regions.
| Stage 13–14 (% presence) | |||||||
|---|---|---|---|---|---|---|---|
| Muscles | LT2a | LT4b | VA2a | LL1a | LO1b | VT1b | SBMb |
| FC markers | Kr+ | Kr+ | Kr+ | Kr+ | Kr− | Kr+ | Lb+ |
| Slou− | Slou− | Slou+ | Slou− | Slou+ | Slou+ | ||
| Wild type (n = 20) | 100 | 100 | 100 | 100 | 100 | 100 | 98.8 |
| Df(2L)X528/Df(2L)GpdhA (n = 48) | 100 | 33.33 | 100 | 100 | 75 | 72.9 | 62.1 |
n, no. of segments.
LT2, VA2, and LL1 scored as controls due to close proximity to LT4.
Examined only muscles in the LT, LO, VT, and SBM regions.
Together, these data suggest that Mid expression is most important for the presence of the FC for LT4. While mid may influence the FCs for LO1 and VT1, it is not essential for specification or development of VA2.
Mesodermal expression of Mid rescues LT4-associated Kr expression in mid mutants and generates extra Lb- and Kr-expressing FCs
To determine whether mesodermally expressed mid is responsible for the muscle defects, we next examined whether panmesodermal expression of Mid using the GAL4-UAS system (Brand and Perrimon 1993) could rescue the mid mutant phenotype. The twi-GAL4, Mef2-GAL4, and 24B-GAL4 drivers have been used extensively to drive panmesodermal expression of UAS-associated constructs. To confirm the exact timing of GAL4-UAS-directed expression and endogenous mid, we used UAS-directed dsRed to show that twi-GAL4 clearly drives panmesodermal expression as early as stage 7, and that this expression persists through stage 11 (Figure S3). Double labeling of these embryos with Mid antisera reveals the FCs in stages 10 and 11, well after GAL4 has activated the UAS. Similar studies examined expression of UAS-directed dsRed under control of Mef2-GAL4 in cells identified by their expression of Kr and in the positions of the FCs. These studies confirmed the presence of dsRed and Kr-expressing progenitors as early as stage 9, before Mid protein is normally detected, through stage 11, when endogenous Mid becomes more robust (Figure S3). Lethal phase tests (Figure S4) revealed significant embryonic lethality in loss-of-function mutants, as previously reported for mid mutants (see Materials and Methods) and gain-of-expression experiments.
We were unable to see rescue of the LT3 and LT4 muscles in late-stage mid mutant embryos using a variety mesodermal and ubiquitous GAL4 drivers, in part due to the muscle perturbations caused by this misexpression (data not shown). However, Kr-expressing FCs were observed in this position in 97% of the hemisegments examined in mid1, UAS-mid/mid1; Mef2-GAL4/+ embryos (Figure 4, compare A and A′ with B and B′, and Table 3).
Quantitation of founder cells present in mid mutant embryos and embryos with panmesodermal expression of UAS-mid
| Stage 13–15 (% presence) | |||||||
|---|---|---|---|---|---|---|---|
| Muscles | LT2a | LT4b | VA2a | LL1a | SBM | Extra | Extra |
| FC markers | Kr+ | Kr+ | Kr+ | Kr+ | Lb+ | Kr+ | Lb+ |
| 24B-GAL4/+ (n = 65) | 100 | 100 | 100 | 100 | NA | 4.6 | NA |
| UAS-mid/+; 24B-GAL4/+ (n = 115) | 100 | 100 | 100 | 100 | NA | 18 | NA |
| UAS-mid/+; Mef2-GAL4/+ (n = 35) | 100 | 97 | 98 | 98 | NA | 45 | NA |
| mid1/mid1; Mef2-GAL4/+ (n = 37) | 100 | 27 | 100 | 100 | NA | 2.7 | NA |
| mid1, UAS-mid/mid1; Mef2-GAL4/+ (n = 25) | 100 | 96 | 100 | 100 | NA | 28 | NA |
| UAS-mid/twi-GAL4 (n = 28) | NA | NA | NA | NA | 100 | NA | 93 |
| Wild type (n = 87) | NA | NA | NA | NA | 98 | NA | 0 |
NA, not applicable; n, no. of segments.
LT2, VA2, and LL1 scored as controls due to close proximity to LT4.
Examined only muscles in the LT and SBM region.
| Stage 13–15 (% presence) | |||||||
|---|---|---|---|---|---|---|---|
| Muscles | LT2a | LT4b | VA2a | LL1a | SBM | Extra | Extra |
| FC markers | Kr+ | Kr+ | Kr+ | Kr+ | Lb+ | Kr+ | Lb+ |
| 24B-GAL4/+ (n = 65) | 100 | 100 | 100 | 100 | NA | 4.6 | NA |
| UAS-mid/+; 24B-GAL4/+ (n = 115) | 100 | 100 | 100 | 100 | NA | 18 | NA |
| UAS-mid/+; Mef2-GAL4/+ (n = 35) | 100 | 97 | 98 | 98 | NA | 45 | NA |
| mid1/mid1; Mef2-GAL4/+ (n = 37) | 100 | 27 | 100 | 100 | NA | 2.7 | NA |
| mid1, UAS-mid/mid1; Mef2-GAL4/+ (n = 25) | 100 | 96 | 100 | 100 | NA | 28 | NA |
| UAS-mid/twi-GAL4 (n = 28) | NA | NA | NA | NA | 100 | NA | 93 |
| Wild type (n = 87) | NA | NA | NA | NA | 98 | NA | 0 |
NA, not applicable; n, no. of segments.
LT2, VA2, and LL1 scored as controls due to close proximity to LT4.
Examined only muscles in the LT and SBM region.
We next explored whether panmesodermal expression of Mid supported a role for Mid in specifying particular FCs and driving their unique features. Control embryos from the rescue experiment in which Mef2-GAL4 was used to drive expression of Mid in a wild-type background occasionally exhibited extra Kr-expressing cells in a position adjacent to LT4 (Figure 4, C and C′). Given the high level of GAL4 expression typically observed under Mef2 control, we also explored the impact of 24B-GAL4-directed Mid at 16°. Upon misexpression of Mid throughout the musculature using 24B-GAL4, we observed the normal pattern of Kr expression in muscles LL1, LT2, LT4, and VA2, but also observed small ectopic Kr-expressing syncytia near LT4 in ∼18 and 45% of the hemisegments, respectively (Figure 4, D–F and Table 3). Consistent with an LT-like identity for this ectopic Kr-expressing muscle, we found that it also expressed the LT marker Ara (Figure S5).
From these data, we suggest that Mid is required in mesodermal cells to direct specification of the LT4 FC, and that its precise timing and/or level is essential for this cell to properly differentiate. Moreover, Mid misexpression is capable of directing additional cells to adopt properties of this FC that include position and expression of Kr and Ara.
Mid and H15 direct the specification and development of a subset of muscle fibers
We next conducted a quantitative phenotypic analysis of the muscle fibers affected by the loss of mid and/or H15 (Figure 5, Table 1). Mutant combinations included mid8A69N1/mid1, mid1, mid1/Df(2L)BSC810, midlos1, mid2, and nmr210. As anticipated from our preliminary phenotypic analysis (Figure 1), the Mid expression pattern (Figure 2), and the loss of the Kr-expressing LT4 FC in mid mutants (Figure 3), the most highly penetrant muscle defect that we observed was the absence of two of the four LT muscles in embryos lacking either mid or mid and H15 (Figure 5, Table 1). Muscle defects were quantified by both groups and included two to three datasets (see Materials and Methods). One approach relied on tropomyosin in combination with the LT muscle marker ap-GFP (Capovilla et al. 2001) recombined into H15, mid, and double mutant backgrounds (Figure 5, A–D). The other approach relied on tropomyosin or myosin heavy chain to examine the LT position and morphology. Combining these datasets, which had minimal differences, revealed that four LTs were present in only 11.5% of abdominal hemisegments in mid mutant embryos and 14.7% in embryos lacking both genes (Figure 5E). Thus, H15 did not appear to contribute significantly to the mutant phenotype with respect to LT3 and LT4.
We also examined the morphology of the LT3 and LT4 muscles in the embryos in which all four LTs were present. As clearly revealed with ap-GFP, the most posterior LT did not display its characteristic dorsal shift and was instead positioned similarly to LTs 1–3 (Figure 1, F and J and Figure 5D). Notably, Mid expression normally declines in LT3 but persists in LT4 (Figure 2). Thus, our phenotypic data are consistent with the Mid expression pattern and the hypothesis that mid acts at an early stage to influence development of the LT3/4 progenitor, and at a later stage to direct a cell fate choice between LT3 and LT4. We further hypothesize that loss of Mid causes LT4 to adopt the LT3 morphology, while persistent expression drives LT3 to adopt the morphology of LT4.
In contrast to LT3 and LT4, in which H15 does not appear to contribute to specification or development, H15 can partially compensate for mid in formation of LO1 and the SBM. The Mid-expressing LO1 muscle was absent in 24% of the hemisegments in mid mutants but 57% of those mutant for mid, H15 (Table 1). Surprisingly the SBM, in which we could not detect Mid, was missing in 31% of hemisegments lacking mid and 51% of hemisegments lacking mid and H15. Interestingly, the Lb-expressing FC for this muscle was missing in mid, H15 mutants (Figure S6). In addition, we observed extra Lb-expressing muscles in many segments upon panmesodermal expression of Mid, usually in close alignment with the SBM (Figure S6). These data suggest that mid plays an important role in specifying the SBM. We hypothesize that very low levels of Mid expression might provide sufficient activity to direct SBM development, and that the loss of this expression accounts for the absence of the SBM in mid and mid, H15 mutant embryos.
While we observed defects in the ventral muscles, consistent with Mid expression in these muscles, it was difficult to quantify these defects due to changes to the overall ventral muscle pattern. From our analysis of the Kr-expressing VA2 FC in mid, H15 mutant embryos (Figure 3), we concluded that specification of the VA2 FC was not dependent on mid or H15. However, we observed aberrant ventral muscle morphologies in 92% of hemisegments (Figure 1, K and M and Table 1), suggesting that mid was important for the VA2 muscles to adopt the correct morphology.
Misexpression of Mid induces a morphological switch in LT3 to LT4
We sought to test the above hypothesis by determining whether persistent expression in LT3 was sufficient to drive it to adopt an LT4 like morphology. We found that twi-GAL4, Mef2-GAL4, and 24B-GAL4-directed Mid at 25° caused perturbations in the muscle pattern, a phenotype similar to the one that had been previously observed upon misexpression of the T-box protein Org-1 (Schaub et al. 2012). We therefore continued this analysis by misexpressing Mid in the musculature at 16°, highlighting the LT muscles as in Figure 5, using the LT-specific muscle marker ap-GFP (Capovilla et al. 2001). Whereas most muscles appeared to develop normally under these conditions, perturbations were clearly observed in the LT muscles. Among these defects were extra LTs in >40% of hemisegments (Figure 5E, black bars and Figure 6, B–B′′′) and short ap-GFP and tropomyosin-positive syncytia that did not appear to develop fully (Figure 6, B and yellow in B′′′). Most importantly, we examined hemisegments having only four LTs and found that the muscle in the LT3 position appeared to adopt an LT4-like morphology in which the entire muscle was shifted dorsally (Figure 6, B–B′′′ and D). We noted that this shift in morphology from an LT3 to an LT4-like morphology upon persistent Mid expression was reciprocal to the LT4 to LT3 switch described in mid mutants in Figure 5.
To quantify the degree to which LT muscles were dorsally or ventrally shifted, we measured the distance between the ventral-most positions of LT2 and the shifted muscles in the LT3 and LT4 positions (Figure 6, C–E). We first took advantage of the ∼15% of mid mutant embryos that still exhibited four LTs (Figure 5D) to measure the ventral shift of the muscle in the LT4 position. In wild-type embryos, the distance between the ventral-most positions of LT2 and LT3 was very small, as expected, whereas the distance between LT2 and LT4 was significant (Figure 6, C and F, white bars). In mid mutant embryos, as in wild-type embryos, we did not observe any appreciable difference between the ventral-most position of LT2 and LT3 as expected (Figure 6, D and F, black bars). However, the posterior-most muscle in the hemisegment adopted an LT3-like position, aligning its ventral pole with LT2 and LT3. We then quantitated the dorsal shift in embryos misexpressing Mid. In these embryos, the distance between LT2 and LT4 was similar to that in wild type, again as expected. However, we found that the difference in the ventral position of the third LT increased relative to LT2 and decreased relative to LT4 (Figure 6, E and F, gray bars). Thus, the muscle in the position of LT3 adopted an LT4-like morphology upon panmesodermal expression of Mid. These data are consistent with the possibility that perdurance of Mid in LT3, in contrast to its normal decline, was able to drive this cell to a more LT4-like morphology. Taken together, these data suggest that Mid controls the morphology of the LT3 and LT4 muscles and, as observed for Kr expression in these FCs, mediates cell fate choice between these two siblings.
Loss or misexpression of mid affects the number of nuclei in the LT muscles
Because both loss and misexpression of Mid affected the presence and morphology of LT3 and LT4 (Figure 5 and Figure 6), we tested whether other morphological properties associated with LT identity were altered. We used the previously described apRed transgene to count the number of nuclei in the LT muscles (Richardson et al. 2007; Metzger et al. 2012). As noted above, Ap is a marker of LT identity, and its expression in these muscles showed that they retained their LT identity even upon mid loss or misexpression (Figure 7, A–C). It also suggested that Mid did not regulate ap expression in these muscles. An additional marker of LT identity is the number of nuclei in each LT. In wild type embryos, LT muscles average approximately six to eight nuclei in LT1–3 and four to six nuclei in LT4 (Metzger et al. 2012). To determine if gain or loss of mid expression altered the number of fusion events in an LT, we counted the number of nuclei in the two most posterior LTs in hemisegments where we could identify four LT muscles (n = 36 hemisegments for wild type, n = 10 for mid1, and n = 10 for twi-GAL4 > UAS-mid). In the small percentage of mid mutant hemisegments with four LT muscles, the lack of dorsal shift we observed in mid mutants indicated a change in LT4 to an LT1–3-like fate. We found that, on average, the fourth most posterior LT in a mid1 hemisegment had one more nucleus than that of wild type (P = 0.03) (Figure 7D). This small, but significant, increase was consistent with other marks of LT4 to LT3 fate change we observed, and suggested that Mid plays a role in specifying the number of fusion events for LT4. Overexpression of Mid in the LTs does not lead to a change in the number of nuclei in the most posterior LT.
Next, we compared the number of nuclei in the third most posterior LT. Our results showed that, on average, the third most posterior LT in a Mid misexpression embryo had fewer than six nuclei (P < 0.0001) (Figure 7E). This highly significant decrease is consistent with a transformation of LT3 to an LT4-like phenotype, similar to the dorsal shift also observed upon Mid misexpression.
To learn more about the change in the number of LT nuclei in these mutant backgrounds, we counted the number of apRed-positive nuclei in all the LTs present in a given hemisegment (Figure 7F). We found that misexpression of Mid did not significantly impact the overall number of nuclei in each LT. Interestingly, however, the average number of nuclei per LT muscle in mid1 homozygous mutants was slightly higher than wild type, on the order of 0.6 nuclei per hemisegment (n = 120 hemisegments for both genotypes, P = 0.0015). To understand further why mid1 mutants showed a significant increase in nuclei number per LT, we examined the number of nuclei per LT in mid1 mutant hemisegments containing two, three, or four LTs (Figure 7G). Strikingly, we found that in hemisegments in which there were only two LT muscles remaining, these individual muscles underwent a small, but highly significant, number of additional fusion events compared to hemisegments in which there were three or four LTs (P = 1.75 × 10⁻⁷). LTs in hemisegments containing two LTs had on average one more nucleus than hemisegments containing three LTs, and two more nuclei than those hemisegments containing four LTs. These results were similar to the increase in overall number of nuclei that have been observed upon loss of selected somatic muscles (Bataille et al. 2010). Taken together, our data suggested that loss of mid affected nuclear number in two ways: first, LT4 adopted an LT1–3-like fate, showing the increased number of nuclei associated with this change; and second, in hemisegments where LT3 and LT4 are lost, there was a significant increase in fusion events in the remaining LTs. In contrast, while overexpression of Mid did not alter the number of nuclei in LTs overall, LT3 does adopt an additional hallmark of LT4-like fate, with a reduced number of fusion events. These results, combined with the dorsal shift data and Kr expression, underscore the muscle transformations that occur upon Mid loss or overexpression.
Discussion
Numerous studies over the past two decades have explored the mechanisms by which the unique size, shape, orientation, and attachment of each muscle is controlled. These analyses have revealed the fundamental role of transcriptional regulators in establishing muscle identity and in directing the specific morphological features characteristic of each muscle. Our results have revealed the T-box protein Mid as a new iTF that acts in multiple ways to implement the unique differentiation profiles of specific muscle fibers in the Drosophila embryo.
While previous work in Drosophila identified a role for Mid in the cardiac mesoderm, no role in the somatic musculature had been described. Our labs identified Mid using complementary approaches: an unbiased functional screen of EMS-induced mutations to identify genes that impact myogenesis and a whole genome transcriptome analysis to identify genes differentially expressed in subsets of muscles (Dobi et al. 2014). In particular, we hoped to identify genes specific to the Ap-expressing subset of muscles. Many muscle genes identified in the microarray screen were expressed in more than one muscle subset, and upon mutant examination, disrupted the muscle pattern broadly. Mid expression, on the other hand, significantly overlaps with Ap and displays defects in the Ap-expressing muscles LT3, LT4, and VA2. This result demonstrates that the original rationale for the screen was valid, in that we were able to recover a subset-specific iTF, and suggests that we can identify additional muscle genes from our microarray data.
The T-box protein Mid functions in complex genetic programs in the VA1/VA2, LO1/VT1, and SBM muscles
We have demonstrated that Mid is expressed in the progenitor for the VA1 and VA2 muscle group and that Mid protein declines in VA1 but is retained in VA2. Despite this early expression, VA2 is not dependent on Mid or its adjacent paralog H15 for formation, and the Kr, Slou-expressing VA2 FC is present in mid and mid, H15 mutant embryos. The morphology of the resulting muscle is abnormal, however, suggesting that Mid is important for VA2 to adopt the proper morphology. Six additional identity genes are expressed in VA2: ap (Bourgouin et al. 1992), Kr (Ruiz-Gomez et al. 1997), Pox meso (Poxm) (Duan et al. 2007), nau (Keller et al. 1998), slou (Knirr et al. 1999), and msh (Nose et al. 1998). Loss of any of these genes most commonly impacts muscle morphology, suggesting that the precise iTF profile in VA2 is critical to morphogenesis.
We have not observed Mid in the progenitor of the LO1/VT1 FCs, but it is detected in the sibling FCs and is prominent in the developing LO1 myotube. Mid and H15 appear to function in a partially redundant manner in LO1, since it was absent in only 25% of hemisegments of mid mutant embryos but 50% of the hemisegments of double mutants. Interestingly, the Slou-positive LO1 FC was absent in only 25% of double mutant hemisegments, suggesting that many FCs were specified but did not progress to myotubes.
Mid and H15 are also partially redundant in directing formation of the SBM, which is missing in 51% of double mutant hemisegments but only 24% of mid mutant hemisegments. Interestingly, this muscle loss phenocopies that of lb mutant embryos, in which the SBM is missing in 57% of hemisegments (Jagla et al. 1998). We also found that panmesodermal expression of Mid causes an expansion of Lb-expressing cells near the SBM that appear similar in orientation. Interestingly, panmesodermal expression of Mid in the cardiac mesoderm, where Mid and Lb are coexpressed, also results in expansion of Lb-expressing cardiomyoblasts (Qian et al. 2005; Reim et al. 2005). Surprisingly, we have not detected Mid expression in the progenitor or FC for the SBM. Thus, either Mid functions nonautonomously in SBM specification or a very low level of Mid is sufficient.
Mid functions as an iTF for LT3 and LT4 at multiple stages of muscle specification and differentiation
Mid is initially expressed in the LT3/4 progenitor that gives rise, through asymmetric division, to FCs for both LT3 and LT4. Our data suggest that Mid is required in this progenitor for its subsequent development, since the most highly penetrant phenotype of mid mutants is the loss of both sibling progeny. After division, Mid is lost in the LT3 FC but is retained in LT4. We favor the hypothesis that this differential expression reflects a second role for Mid in cell fate selection between LT3 and LT4. Supporting evidence derives from FCs that circumvent the early requirement for Mid, and the resulting LT4 muscle adopts an LT3-like morphology. This notion is further supported by the observation that the number of fusion events is regulated by Mid in LT3 and LT4. Earlier work had implicated iTFs in regulation of the number of fusion events (Bataille et al. 2010). This work, however, relied on over- and misexpression of iTFs to show that this misexpression altered the number of fusion events in exogenous muscles. Here, we show that an iTF endogenously regulates the number of fusion events in a muscle and tie this change in nuclear number to a direct transformation in cell fate. Finally, persistent panmesodermal expression of Mid caused LT3 to adopt an LT4-like morphology. Together, these data support the hypothesis that Mid functions as an iTF for LT3 and LT4, which is first required for development of FCs for both muscles, and then directs cell fate choice between the sibling LT3 and LT4 FCs.
We favor the hypothesis that Mid functions autonomously in these cells to specify LT fate. Although direct somatic muscle transformations have been observed in other mutant backgrounds, such as the VA2 to VA1 transformation seen in Kr mutants (Ruiz-Gomez et al. 1997), none is as highly penetrant as what we see for mid. In mid mutants we do not observe a single hemisegment with a muscle displaying the properties of LT4. Moreover, we do not observe intermediate transformations of LT4 in mid mutants; rather, when four LTs are detected in a hemisegment, the most posterior LT displays changes in attachment, position, and nuclear number. We do not observe defects in muscle attachment sites and tendon cells in mid mutant embryos that might account for the muscle loss. Second, the Kr-expressing LT4 FC appears to be recovered when mesodermally expressed Mid is provided to a mid mutant embryo.
While we did not observe complete rescue of the muscles under these conditions, perhaps due to inappropriate timing and/or levels of Mid, we note that variable muscle rescue was also reported for a transgene expressing the T-box protein Org-1 under control of its own enhancer in org-1 mutants (Schaub et al. 2012). We also note that, as observed upon misxpression of iTFs such as Ap (Bourgouin et al. 1992), Org-1 (Schaub et al. 2012), Msh (Nose et al. 1998), and Poxm (Duan et al. 2007), panmesodermal misexpression of Mid results in extra muscles that align with LT3 and LT4. We did not observe the corresponding loss of other muscles under these conditions, but perhaps inappropriate Mid forces other FCs to adopt an LT-like morphology. Alternatively, persistent expression of Mid in cells in which it normally decreases may prompt this cell to undergo another round of cell division.
Transcriptional networks for specification of LT3 and LT4
The identification of Mid as an iTF adds one more member to a growing list of proteins that intersect in combinatorial ways to dictate precise muscle morphologies. Along with Mid, the Ara/Caup (Carrasco-Rando et al. 2011), Ap (Bourgouin et al. 1992), Msh (Nose et al. 1998), Lms (Muller et al. 2010), and Kr (Ruiz-Gomez et al. 1997) transcription factors contribute to the development of LT3 and LT4. Ara/Caup is expressed in the progenitors for all four LTs, where it represses the VA1/2 fate and corresponding Slou expression in the LT3/4 progenitor (Carrasco-Rando et al. 2011). These findings suggest that Ara/Caup acts at an early stage before the progenitor becomes fully committed to one developmental program. We have not observed a similar transformation of LT3/4 to VA1/2 based on expression of Kr and Slou, or misplacement of Ara-expressing cells in mid, H15 mutants, consistent with the expectation that Mid functions later in cell fate selection. However, Ara-expressing FCs for LT3 and LT4 are not observed at stage 13, suggesting either that Ara expression at this stage is actually dependent on Mid or, perhaps more likely, that mid mutant FCs do not survive.
Msh, Ap, and Lms are also expressed in the progenitors and FCs for all four LTs. Lms and Kr are lost in msh mutants and Ap is severely reduced (Muller et al. 2010), suggesting that msh is important for LT FCs to express these iTFs. All three iTFs contribute to the formation of the LTs, though the impact of their loss is significantly less than that of mid since four LTs develop in more than half of all segments in msh (Nose et al. 1998), lms (Muller et al. 2010), or ap (Bourgouin et al. 1992; Muller et al. 2010) mutants. Thus, despite the loss of msh and corresponding reduction in Ap, Kr, and Lms, many of these mutant FCs form myofibers (Bourgouin et al. 1992; Nose et al. 1998; Muller et al. 2010). Thus, none of these genes seem likely to be absolutely essential for mid expression and/or essential downstream targets of Mid, since mutations in such genes would be expected to cause a similar loss of LT3 and LT4. Rather, we anticipate that functional redundancy and combinatorial regulatory networks exist both upstream and downstream of Mid to direct formation of the LTs.
Relevant to Mid, a morphological shift from LT4 to LT3 has been observed for Kr (Ruiz-Gomez et al. 1997) and, to a lesser extent, ap (Muller et al. 2010) mutants. Kr is detected in the promuscular cluster and LT1/2 and LT3/4 progenitors. Reminiscent of Mid, Kr declines in one of the sibling FCs in each pair but is maintained in the other. As in mid mutant, LT4 often adopts an LT3-like morphology in Kr mutant segments in which all four LTs are present. Thus both Mid and Kr are key players in FCs adopting the LT3 vs. LT4 morphology. The loss of Kr in mid mutant and ectopic Kr-expressing cells upon panmesodermal mid leads us to hypothesize that Kr might be a target of Mid in the LT4 FC or cooperate with Mid to implement an LT4-like differentiation program.
Mid and the T-box family of proteins
The T-box family of transcription factors has eight characterized members in Drosophila that impact specification and differentiation of several tissues. Mid and H15, orthologs of vertebrate Tbx20, play partially redundant roles during neuroblast specification (Buescher et al. 2006) and axon guidance (Liu et al. 2009; Manavalan et al. 2013). Interestingly, the role of Mid in selecting muscle fate choice between LT3 and LT4 is analogous to its function in the nervous system, where it mediates neuroblast fate specification (Buescher et al. 2006; Gaziova and Bhat 2009). Mid and H15 also promote cell fate specification and morphogenesis in the Drosophila heart (Miskolczi-McCallum et al. 2005; Qian et al. 2005; Reim et al. 2005), where mid is both a target and a regulator of the Tin transcription factor (Qian et al. 2005; Reim et al. 2005; Ryu et al. 2011; Jin et al. 2013).
Mid represents only the second T-box containing transcription factor for which a role in the body wall muscles has been explored and is the most influential iTF to date for development of any LT muscles. Org-1, an ortholog of Tbx1, is required in a subset of muscle progenitors and founder cells in the body wall muscles as well as in the heart-associated alary muscles and precursors of the adult muscles (Schaub et al. 2012). The Tbx6 subfamily is composed of Dorsocross 1, 2, and 3, which are expressed in identical patterns and play redundant roles in the amnioserosa, heart, and hindgut. These proteins are key components in cardiogenesis and are required for formation of most myocardial and pericardial cells (Reim et al. 2003; Hamaguchi et al. 2004; Reim and Frasch 2005; Hamaguchi et al. 2012). Brachyenteron, the ortholog of vertebrate Brachyury, mediates the early specification of the caudal visceral mesoderm (Kusch and Reuter 1999; Hamaguchi et al. 2012). Lastly, the Tbx3 ortholog Optomotor-blind (Omb) has been implicated in development of the optic lobe and wing (Grimm and Pflugfelder 1996; Shen et al. 2010) and adult abdominal segments (Kopp and Duncan 2002), where it is a downstream target of Decapentaplegic (Dpp) (Haerry et al. 1998) and controls proliferation (del Alamo Rodriguez et al. 2004; Zhang et al. 2013). Future studies will be necessary to determine whether, as with Mid, muscle expression of other T-box proteins has been overlooked and whether, as shown for Mid and Org-1, T-box factors represent a new family involved in the combinatorial control of muscle fate specification.
Acknowledgments
We thank Susumu Hirose, Sandra Leal, Rolf Bodmer, Krzystof Jagla, Sonsoles Campuzano Manfred Frasch, Talila Volk, and the Bloomington Stock Center for reagents. We thank Abmayr and Baylies lab members for advice and technical assistance. This work was supported by the Stowers Institute for Medical Research and National Institutes of Health (NIH) award R01-AR44274 to S.M.A., by NIH P30 CA008748 to Memorial Sloan Kettering Cancer Center, NIH R01-GM56989 to M. K. B., and NIH National Research Service Award 1F32AR057290 to K.C.D.
Footnotes
Supporting information is available online at http://www.genetics.org/lookup/suppl/doi:10.1534/genetics.115.174300/-/DC1.
Communicating editor: R. J. Duronio
Literature Cited
Dobi, K. C., M. S. Halfon, and M. K. Baylies, 2014 Whole-genome analysis of muscle founder cells implicates the chromatin regulator Sin3A in muscle identity. Cell Rep. 8: 858–870.
Author notes
These authors contributed equally to this work.
