The objective of this study was to assess experimentally the potential impact of anthropogenic pH perturbation (ApHP) on concentrations of dimethyl sulfide (DMS) and dimethylsulfoniopropionate (DMSP), as well as processes governing the microbial cycling of sulfur compounds. A summer planktonic community from surface waters of the Lower St. Lawrence Estuary was monitored in microcosms over 12 days under three pCO2 targets: 1 × pCO2 (775 µatm), 2 × pCO2 (1,850 µatm), and 3 × pCO2 (2,700 µatm). A mixed phytoplankton bloom comprised of diatoms and unidentified flagellates developed over the course of the experiment. The magnitude and timing of biomass buildup, measured by chlorophyll a concentration, changed in the 3 × pCO2 treatment, reaching about half the peak chlorophyll a concentration measured in the 1 × pCO2 treatment, with a 2-day lag. Doubling and tripling the pCO2 resulted in a 15% and 40% decline in average concentrations of DMS compared to the control. Results from 35S-DMSPd uptake assays indicated that neither concentrations nor microbial scavenging efficiency of dissolved DMSP was affected by increased pCO2. However, our results show a reduction of the mean microbial yield of DMS by 34% and 61% in the 2 × pCO2 and 3 × pCO2 treatments, respectively. DMS concentrations correlated positively with microbial yields of DMS (Spearman’s ρ = 0.65; P < 0.001), suggesting that the impact of ApHP on concentrations of DMS in diatom-dominated systems may be strongly linked with alterations of the microbial breakdown of dissolved DMSP. Findings from this study provide further empirical evidence of the sensitivity of the microbial DMSP switch under ApHP. Because even small modifications in microbial regulatory mechanisms of DMSP can elicit changes in atmospheric chemistry via dampened efflux of DMS, results from this study may contribute to a better comprehension of Earth’s future climate.
1. Introduction
Marine microorganisms are integral to major biogeochemical cycles, fluxes, and other processes occurring in marine systems (Glöckner et al., 2012). Abundant and diverse, microbes produce, consume, and emit various compounds that may be of critical importance to the regulation of the Earth’s climate, including but not limited to carbon dioxide (CO2), methane (CH4), and dimethyl sulfide (DMS). While atmospheric CO2 and CH4 act to amplify the Earth’s positive radiative balance, the annual emission of approximately 28.1 Tg of sulfur (S) via oceanic DMS (Kettle and Andreae, 2000; Lana et al., 2011) is believed to represent a significant source (between 18% and 42%) of global atmospheric aerosols (Chin and Jacob 1996; Gondwe et al., 2003; Kloster et al., 2006) that act to cool the climate to an extent that is still under debate (Quinn and Bates, 2011; Quinn et al., 2017). Sulfate (SO42–) particles formed through the oxidation of DMS may scatter incoming solar radiation directly or indirectly by seeding nuclei upon which clouds may condense and grow, thereby modifying the Earth’s albedo (Shaw, 1983; Charlson et al., 1987; Andreae and Crutzen, 1997). The sensitivity of cloud condensation nuclei to DMS-derived aerosols broadly depends on the presence of other major sources of atmospheric aerosols, including those derived from anthropogenic activities, as well as on the strength of DMS fluxes at the ocean–air interface (Carslaw et al., 2010; Woodhouse et al., 2013). By and large, microbial food webs in the oceans, including both autotrophic and heterotrophic organisms, are pivotal in shaping reservoirs of DMS that are available for emissions toward the atmosphere (reviewed by Simó, 2001; Stefels et al., 2007).
DMS originates from the enzymatic breakdown of dimethylsulfoniopropionate (DMSP), a compatible solute biosynthesized to various intracellular concentrations by a wide span of phytoplankton groups (Keller, 1989; reviewed by Stefels et al., 2007). While members of the classes Haptophyceae and Dinophyceae are considered as the most prolific of producers, certain members of the Bacillariophyceae (diatoms) and Chrysophyceae classes may also synthesize considerable amounts of DMSP (Stefels et al., 2007). The metabolic incentive behind the production of DMSP is believed to rest upon its efficiency in protecting algal cells against environmental shifts in salinity, temperature, nutrients, and various oxidants (Kirst et al., 1991; Karsten et al., 1996; Kiene et al., 2000; Stefels, 2000; Sunda et al., 2002). Most of the naturally occurring DMSP in seawater is found in its particulate form (DMSPp) within algal cells; however, it may be released into the water column as dissolved DMSP (DMSPd) through various mechanisms that include active exudation, predation, and diverse lytic processes (Stefels and Van Boeckel, 1993; Wolfe and Steinke, 1996; Malin et al., 1998; Stefels, 2000). Concentrations of DMSPd are notoriously difficult to gauge in natural systems due to this compound’s inherent lability and considerable potential to supply carbon and reduced sulfur to heterotrophic bacteria (Kiene and Linn, 2000), leading to rapid turnover (from a few hours to days; Lizotte et al., 2017, their review table 3) of this compound in the oceans. Once consumed by heterotrophic microorganisms, the fate of DMSPd can be traced through four distinct metabolic routes using 35S-DMSPd bioassays: (1) catabolism of DMSPd via the activity of DMSP-lyase enzymes yielding DMS; (2) demethylation–demethiolation of DMSPd yielding methyl-mercaptopropionate, methanethiol (MeSH), or inorganic sulfur; (3) production of dissolved nonvolatile S compounds; and (4) accumulation of intracellular DMSP without metabolism (untransformed pool; Kiene et al., 1999; Kiene et al., 2000; Kiene and Linn, 2000; Yoch, 2002; Reisch et al., 2011). A recent compilation of several 35S-DMSPd tracer studies from various coastal and oceanic waters shows that microbial DMS yields rarely exceed 40% of consumed DMSPd (Lizotte et al., 2017), thereby putting a cap on the potential amount of DMS available for sea-to-air emissions through bacterial mediation of DMSP. Beyond the several DMSP-dependent DMS-releasing (Ddd+) enzymes that have been isolated in populations of heterotrophic bacteria, one family of DMSP-lyase, dubbed Alma, has been identified in eukaryotes, such as Emiliania huxleyi and species of Symbiodinium, displaying the potential for direct production of DMS by phytoplankton (Todd et al., 2007; Alcolombri et al., 2015; Johnston et al., 2016). To this day, however, the relative importance of autotrophic and heterotrophic processes in supplying stocks of DMS in seawater remains unclear, with provisional estimates fluctuating extensively (Lizotte et al., 2012). Moreover, studies have shown the uptake of 35S-DMSPd by diatoms and cyanobacteria, such as Synechococcus and Prochlorococcus (Vila-Costa et al., 2006b, Ruiz-González et al., 2012), a process that further diverts DMSPd away from the potential production of DMS. Ultimately, the DMS that is produced may be withdrawn from seawater through bacterial degradation and photooxidation, with only a minor portion (<10%) escaping to the atmosphere (Brimblecombe and Shooter, 1986; Bates et al., 1992, 1994; Kiene et al., 2000; Archer et al., 2002). As a result of the intrinsic coupling between microorganisms and the cycling of marine methylated compounds, ongoing and future disturbances in oceanic ecosystems related to anthropogenic forcing that may affect marine microbes may also impact the dynamics of the climate-relevant compound DMS.
Ocean acidification (OA), the decrease in oceanic pH, is one of the many consequences associated with the rise in anthropogenic CO2. While atmospheric CO2 concentrations have expanded from 280 to more than 400 ppm over the last 200 years, the oceans have absorbed approximately 28% of those man-made emissions (Le Quéré et al., 2015), with an increase to 31% in the average uptake rate between 1994 and 2007 (Gruber et al., 2019). This oceanic uptake of CO2 has already translated into a 0.11 unit decrease in the pH of surface waters (Gattuso et al., 2015), with a decreasing rate of 0.017–0.27 pH units per decade since the late 1980s (IPCC, n.d.). Modeling studies suggest that a further decrease of 0.3–0.4 units could be expected by the end of the century, which represents an approximate 150% increase relative to the beginning of the industrial era (Caldeira and Wickett, 2005; Doney et al., 2009; Feely et al., 2009). By potentially impacting numerous microbial processes in the oceans, both autotrophic and heterotrophic (Piontek et al., 2010; Riebesell and Tortell, 2011), OA may possibly reshape reservoirs of methylated S compounds through differential alteration of production and consumption mechanisms (Archer et al., 2018; Hopkins et al., 2020b). Experimental studies examining the effects of OA on natural planktonic assemblages and their production of DMSP and DMS reveal, in many cases, a negative impact of decreasing pH on the net accumulation of these two compounds (Hussherr et al., 2017, their compilation table 6), although uncertainties persist as to the underlying manifest causes. Regional variability in the natural carbonate chemistry fluctuations to which planktonic communities are exposed may be a determining driver of the sensitivity of DMS cycling to OA (Hopkins et al., 2020a). In partly enclosed coastal water bodies, such as the Lower St. Lawrence Estuary (LSLE), uncertainties surrounding anthropogenic OA signals are entangled with physical and biogeochemical processes, such as circulation, mixing, temperature, net metabolism, riverine hydrogeochemistry, and gas exchange, which add complexity to dissolved inorganic carbon dynamics, rendering predictions of changes and their implications challenging (Melzner et al., 2013; Dinauer and Mucci, 2017; Van Dam and Wang, 2019). Added to the annual variability in pH (on the total proton scale, pHT) of 0.1 pHT unit, surface waters of the LSLE have seen an approximate 0.1 pHT unit decrease over the last century, while bottom waters have experienced a 0.2–0.3 pHT unit drop over a shorter period of 75 years to reach 7.7–7.8 pHT today (Mucci et al., 2011). Upwelling of these hypoxic high-pCO2 waters, elicited by metabolic CO2 enrichment through respiration and mixing with adjacent water masses, may lead to large fluctuations in pHT over short time scales in the LSLE, for example, between 7.934 and 7.855 during a single 50-h tidal survey (Mucci et al., 2017). The exploration of pCO2 alterations in coastal settings provides insight into “anthropogenic impacts on marine pH,” a concept described by Duarte et al. (2013) as an alternative expression to the well-known OA. The concept not only includes anthropogenic OA but also acknowledges the multiple components of anthropogenic pH perturbations (ApHP) into a wider framework, from coastal to open ocean. Coastal settings therefore represent an opportunity to explore OA-related responses of organisms that are potentially more tolerant to fluctuations in pH. Any sensitivity signals displayed by these organisms can potentially increase our understanding of the link between environmental variability and metabolic responses of oceanic communities under future ApHP. Potential human-driven shifts in DMS productivity in coastal areas have both ecological and climatological significance: Many organisms including zooplankton, fish, marine mammals, and birds can use underwater and atmospheric plumes of DMS as directional cues to orient their foraging (Kowalewsky et al., 2006; Nevitt, 2011; Savoca and Nevitt, 2014); and coastal biogeographic provinces, which occupy 10% of the global ocean area, may be the origin of nearly 11% of the global annual emissions of DMS associated in large part to enhanced coastal production of phytoplankton biomass (Nemcek et al., 2008; Lana et al., 2011).
In studies of natural communities that are dominated by the DMSP-rich E. huxleyi, the adverse effect of OA on the growth of this calcifying organism may also result in a negative impact on the overall production of both DMSP and DMS (Hopkins et al., 2010; Avgoustidi et al., 2012; Webb et al., 2015). Other OA studies reveal that reductions in DMSP at low pH were intimately linked with heightened predation of DMSP-producing phytoplankton by grazers and ensuing decline in DMS concentration (Kim et al., 2010; Park et al., 2014). However, contrasting outcomes in the dynamics of DMSP and DMS have also been observed with diminishing concentrations of DMS at high pCO2, despite heightened or invariable responses in DMSP production to OA (Archer et al., 2013; Hussherr et al., 2017) and ApHP (Bénard et al., 2019). In these studies, the distinct negative impact of acidification on DMS concentrations had been hypothesized to be associated with the alteration of bacterial DMSP and DMS mediation. However, without direct empirical evidence of bacterial transformation rates to fully reinforce those assumptions, the bacterial “black box” remained virtually sealed.
The main objective of this study was to assess experimentally the response of a coastal summer planktonic community and its cycling of DMSP and DMS under ApHP, with a focus on bacterial DMSP catabolic processes. Previously, the dependence of the concentration of DMS on bacterial metabolism had been investigated indirectly in acidification experiments by comparing bacterial production rates to concentrations of DMS or ratios of DMS normalized by total DMSP (DMS: DMSPt; Archer et al., 2013; Bénard et al., 2019). However, using 35S-DMSP-based measurements of DMSPd catabolism during a pCO2-perturbation mesocosm experiment, Archer et al. (2018) demonstrated a general inhibition of DMSPd uptake and transformation during peak DMS net production over a pCO2 gradient of 400–1,252 atm in subtropical waters of the Atlantic. Results presented in this study contribute to advancing our limited understanding of these processes by determining specifically the impact of acidification on the microbial metabolism of DMSP using the 35S-DMSPd tracer approach. With roughly 70% of OA studies showing a decrease in DMS (Hussherr et al., 2017; Hopkins et al., 2020b), the implementation of this negative pH-DMS relationship into coupled ocean-atmosphere models (Six et al., 2013; Schwinger et al., 2017) points toward amplification of warming in the future as OA persists. Conclusions from these modeling tools highlight the relevance of identifying the key processes controlling DMS concentrations under ApHP through targeted ground-truthing, especially as alterations in DMS have the potential to promote or alleviate climate change.
2. Materials and methods
2.1. Water collection and experimental setting
Water was collected on June 17 in the SLE (48° 50′ 29” N, 68° 31′ 45” W) at 5-m depth using a 5-L Niskin bottle and was filtered through a 250-µm mesh to remove large zooplankton. In situ pCO2 was determined using pH samples taken during the filling procedure (methods described in Section 2.3.1.) and total alkalinity (TA) estimation using an empirical relationship with salinity for LSLE waters (M Starr, personal communication). Further pCO2 determination only occurred during subsampling of the microcosms as described in Section 2.3.1. On June 18, water was incubated in 20-L collapsible bags (HyClone Labtainers™). The incubations were conducted at the Maurice Lamontagne Institute of the Department of Fisheries and Oceans Canada, Mont-Joli, Canada, from June 18 to July 1, 2013 (Figure 1). The sealed incubation bags used were gastight so that no exchanges with the atmosphere of either CO2 or DMS occurred during the incubation. Measured transmittances of the incubation bags were 78% ± 4% of incoming photosynthetically active radiation, 62% ± 6% Ultraviolet-A, and 33% ± 5% Ultraviolet-B. The incubation bags were placed in an exterior incubator under a neutral mesh to reduce incoming radiation. As the photic zone in the LSLE is relatively shallow during that period (10–15 m; e.g., Levasseur et al., 1984), the reduced radiation roughly corresponded to the irradiance at the sampling depth (approximately 30%; Le Fouest et al., 2006). The incubator was kept at in situ temperature through the constant inflow of coastal surface waters. As water temperature naturally fluctuated during the 12-day experiment (approximately 5 °C–8.4 °C; see Results), completely excluding potential effects of these physical variables (light and temperature) on the microbial processes under study is not possible. Use of the Tukey statistical test (see Section 2.4), however, allows simultaneous pairwise comparisons on a specific day, therefore disentangling the potential effect of naturally varying processes over time.

Sampling site. The sampling site, identified by a red star, is located in the Lower St. Lawrence Estuary, near Rimouski, Québec, Canada (48° 50′ 29” N, 68° 31′ 45” W). DOI: https://doi.org/10.1525/elementa.2020.00043.f1
Sampling site. The sampling site, identified by a red star, is located in the Lower St. Lawrence Estuary, near Rimouski, Québec, Canada (48° 50′ 29” N, 68° 31′ 45” W). DOI: https://doi.org/10.1525/elementa.2020.00043.f1
2.2. Treatments and acidification protocol
A total of nine incubation bags were exposed to three treatments in triplicate with target pCO2 of 1 × pCO2 = 775 µatm (control), 2 × pCO2 = 1,850 µatm, and 3 × pCO2 = 2,700 µatm. The pCO2 in the 1 × pCO2 treatment was not artificially modified during the setup process and corresponded to the in situ pCO2 at the water collection site (see Sections 2.1 and 2.3.1 for details). These targets of future partial pressures of CO2 (1,850 and 2,700 µatm) are within the range of pCO2 values estimated in coastal marine and estuarine habitats under scenarios of hypoxia within the next 50–100 years (Melzner et al., 2013). In light of the nonlinear nature of the carbonate system, increases in seawater pCO2 due to OA have been proposed to impact coastal zones most strongly (Melzner et al., 2013), as pCO2 under hypoxic conditions will increase proportionally to oxygen loss leading to maximum estimated pCO2 values of approximately 4,500 µatm at a salinity of 20 and temperature of 10 °C. The methods for acidification were based on recommendations from the Guide to Best Practices for Ocean Acidification Research and Data Reporting (Riebesell et al., 2010). The technique of adding a strong acid (HCl, 0.02 M) and bicarbonate (NaHCO3, 0.3 M) was used as this procedure mimics OA by maintaining the TA constant through the acidification step. The volumes needed to reach the targeted pCO2 were determined with the help of the MS Excel macro CO2SYS (Pierrot et al., 2006) using the carbonic dissociation constants (K1 and K2) of Lueker et al. (2000) and the HSO4– association constants given by Dickson (1990). Both acid and bicarbonate solutions were added in the required amounts using syringes connected to the bags by a Luer Lock port. The acidification process was carried out on June 18 (Day 1) following the filling of the bags on the same day. No further manipulation of the carbonate chemistry occurred after this initial acidification, implying that any drift or variations in pH and pCO2 were related to biological activity. No subsampling occurred on Day 1 following the acidification process. The subsampling began the next day, approximately 16 h after the initial acidification (Day 0, June 19, 08:00).
2.3. Microcosm subsampling of chemical and biological parameters
The nine incubation bags were monitored for 13 days beginning after the initial acidification (Day 1). Subsampling was carried out between 05:00 and 11:00 during Days 0–12, although not all variables were sampled every day. Water for pH, TA, primary production, DMS concentration, and 35S-DMSPd bioassay was collected directly from the microcosms and processed immediately, except for TA samples that were stored in the refrigerator (dark, 4 °C) until analysis the following month. Water for chlorophyll a (Chl a), nutrients, bacterial abundance, and phytoplankton taxonomy was collected in a brown bottle (Nalgene®, 1-L) and kept at 4 °C in the refrigerator until further subsampling within 6 h of collection (see below). Salinity samples were collected in 250-mL plastic bottles on Days 0 and 12 and stored in the dark until analysis using a Guildline Autosal 8400B salinometer in the months following the experiment. At least half of the initial aqueous volume of the microcosms remained in the bags at the end of the experiment.
2.3.1. Carbonate chemistry
The carbonate chemistry parameters (pHT, TA, and pCO2) were determined for each microcosm on Days 0, 2, 5, 7, 9, and 12. The pH was determined by carefully transferring water from the microcosm into a 125-mL plastic bottle without headspace and then allowing to equilibrate to 25.0 °C ± 0.1 °C in a thermostat bath. The pH samples were analyzed within 2–3 h of collection on a Hewlett-Packard UV-Visible diode array spectrophotometer (HP-8453A) and 5-cm quartz cell with m-cresol purple (Clayton and Byrne, 1993) used as an indicator. The pH on the total proton scale (pHT) was calculated according to Byrne (1987), using the salinity of the sample and the HSO4– association constants given by Dickson (1990). The average relative error calculated on the average relative standard deviation on replicated standard measurements and sample measurements was lower than 0.15% (n = 3 for each sample). The TA samples were collected in prerinsed 250-mL glass bottles with the addition of a few crystals of HgCl2 and sealed with Apiezon® Type-M high-vacuum grease and a ground glass stopper. Determination of TA was carried out by open-cell automated potentiometric titration (Titrilab 865, Radiometer®) using a pH combination electrode (pHC2001, Red Rod®) and a dilute HCl (0.025 M) titrant solution calibrated using Certified Reference Materials (CRM Batch#94, provided by A. G. Dickson, Scripps Institute of Oceanography, La Jolla, USA). The computed pHT at 25 °C and the measured TA were used to calculate the carbonate chemistry parameters and respective pCO2 at in situ temperature using CO2SYS (Pierrot et al., 2006).
2.3.2. Nutrients
Water for the analyses of nutrients was filtered using Whatman® GD/X syringe filters (GF/F, 0.7 µm) and stored at –20 °C in acid-washed polyethylene tubes. The samples were analyzed with a Bran and Luebbe Autoanalyzer III using a colorimetric method described by Hansen and Koroleff (2007). The analytical detection limit was 0.03 µmol L–1 for nitrate (NO3–) plus nitrite (NO2–), 0.02 µmol L–1 for NO2–, 0.1 µmol L–1 for silicic acid (Si(OH)4), and 0.05 µmol L–1 for soluble reactive phosphate (SRP).
2.3.3. Plankton biomass, composition, and enumeration
For Chl a determination, subsamples of 100 mL were filtered onto Whatman® GF/F filters (0.7 µm). Phytoplankton pigments were extracted by soaking the filters in a 90% acetone solution at 4 °C in the dark for 24 h. Then, the solution was analyzed by a 10-AU Turner Designs fluorometer using the acidification method (Parsons et al., 1984). The analytical detection limit for Chl a was 0.05 µg L–1. Samples of 200 mL for microscopic identification and enumeration of eukaryotic cells >2 µm were taken on Days 0, 6, and 12, preserved with acidic Lugol solution (Parsons et al., 1984), then stored in the dark until analysis. Cells were identified according to Lund et al. (1958) using an inverted microscope (Zeiss Axiovert 10) and taxonomic references of Tomas (1997) and Bérard-Therriault et al. (1999). For enumeration of heterotrophic bacteria, samples were kept in 10-mL sterile cryogenic polypropylene vials fixed with glutaraldehyde Grade I (final concentration 0.1%, Sigma-Aldrich; Marie et al., 2005), placed at 4 °C in the dark for 30 min, then flash-frozen in liquid nitrogen and kept at –80 °C until analysis. After defrosting to ambient temperature, the samples were stained with SYBR Green I (final concentration 0.1%, Invitrogen Inc.) to which 600 µL of Tris-EDTA 10× buffer pH 8 (Laboratoire MAT; Belzile et al., 2008) and Fluoresbrite beads of 1 µm (Polysciences) were added as an internal standard. The samples were then analyzed using a FACS Calibur flow cytometer (Becton Dickinson) equipped with a 488-nm argon laser. The cytograms obtained allowed the discrimination of heterotrophic bacteria (of high and low nucleic acid content) from photoautotrophic bacteria and eukaryotes by subtracting orange or red fluorescent particles (produced by phycoerythrin or chlorophyll; observed in FL2 and FL3) from the green particles obtained by SYBR Green I staining (observed in FL1). Hence, separated groups were circumscribed by comparing their specific scatter profiles in conjunction with their fluorescence profiles (forward scatter, side scatter, FL1, FL2, and FL3; Marie et al., 2005; Belzile et al., 2008). The bacterial abundances reported here thus include both archaea and bacteria.
2.3.4. Primary production
Rates of primary production were determined using the 14C-fixation method (Knap et al., 1996; Ferland et al., 2011). Two 250-mL polycarbonate bottles, one clear and one opaque, were filled directly from each microcosm bag before sunrise and amended with 250 µL NaH14CO3 (80 µCi mL–1). To prevent active fixation of 14C by phytoplankton in the dark bottles, 100 µL of 0.02 mol L–1 3-(3,4-dichlorophenyl)-1,1-dimethylurea was added (Legendre et al., 1983). The total initial radioactivity was determined in each bottle by subsampling 50 µL into a 20-mL scintillation vial containing 10 mL of Ecolume™ liquid scintillation cocktail and 50 µL of ethanolamine (Sigma). Bottles for the determination of primary production rates were placed in the same incubator as the microcosms and incubated for 24 h. At the end of the incubation, 3 mL was subsampled for the determination of total primary production (PT), and 3 mL was filtered with a Whatman GD/X syringe filter (0.7 µm GF/F) to quantify the fixed carbon released into the dissolved organic carbon pool (PD) and placed in 20-mL scintillation vials. The vials containing the PT and PD samples were acidified with 500 µL of HCl 6 M for 3 h under a fume hood, then neutralized with 500 µL of NaOH 6 M before adding 15 mL of Ecolume™ liquid scintillation cocktail. Varying amounts of the remaining volume were filtered onto Whatman GF/F (0.7 µm) to determine the particulate primary production (PP) by normalizing the measured radioactivity by the volume filtered. The filters were placed in 20-mL scintillation vials and acidified with 100 µL of HCl (0.05 M) and left to fume for 12 h before adding 15 mL of scintillation cocktail. The samples were analyzed using a Tri-Carb 4910TR liquid scintillation counter (PerkinElmer). The rates of carbon fixation into particulate and dissolved fractions were calculated according to the equations of Knap et al. (1996).
2.3.5. DMS and DMSP concentrations
Samples for the quantification of DMS were collected directly from the microcosms with 60-mL disposable plastic syringes and kept at 4 °C in the dark until analysis, typically within 2 h of collection. DMS was analyzed by injecting aliquots (volumes ranging from 15 mL to 20.2 mL) directly into a custom purge and trap system (P&T) manually operated with VICI-VALCO valves. DMS samples were unfiltered to avoid as much degassing as possible. Following the injection of samples, a 2-mL volume of Nanopure H2O with 1 mL of air was pushed into the purging vessel to ensure that the sample was flushed entirely out of the tubing upstream of the P&T. The lower section of the double-jacket purge system was heated to 70 °C in order to speed up the extraction of DMS from the seawater, while the upper section was kept at 4 °C and fitted with a CaCl2 trap to condense and capture any humidity generated during purging (see Scarratt et al., 2000 for further methodological details). Sparging was generated with ultrahigh purity helium (He) flowing at 70 ± 5 mL min–1 for 4 min, and gaseous DMS was trapped using a loop immersed in liquid nitrogen during the purging phase. The trapped DMS was sent for analysis to a Varian CP-3800 Gas Chromatograph, equipped with a pulsed flame photometric detector and an SPB-1 Sulfur column (Varian; 30 m × 0.32 mm ID, 4.0 µm phase), by transferring the cryo-loop into a hot bath (<100 °C). DMS concentrations were calibrated against microliter injections of a 527 ng min–1 DMS standard using a permeation tube (Certified Calibration by Kin-Tek Laboratories Inc.) kept at 40 °C and diffusing at a rate of 11.0 mL min–1 (±0.2 ml min–1) with ultrahigh purity He. Series of different concentrations (range of 50–250 µL) for the standard curve were obtained with gas-tight syringes (Hamilton), the contents of which were transferred into 3-mL disposable plastic syringes prefilled with 2 mL of Nanopure H2O, thereby reducing the possible loss of DMS during transfer to the P&T. The injections of standard DMS were followed by injections of Nanopure H2O and air as previously described for DMS samples.
For the sampling of dissolved DMSP (DMSPd), the small-volume gravity drip filtration technique was used as described in Kiene and Slezak (2006). Briefly, 20 mL of sample was gravity-filtered through a 47-mm Whatman® GF/F (0.7 µm), and the first 3.5 mL of filtrate was collected in a 5-mL polyethylene tube. For DMSPt sampling, centrifugation-style tubes were directly filled with 3.5 mL of unfiltered seawater. Both samples for DMSPd and DMSPt were preserved with 50 µL of 50% sulfuric acid solution (H2SO4). Acidified tubes were stored at 4 °C in the dark until analysis in the days following collection. DMSP concentrations were determined after a mole to mole (1:1) conversion to DMS following hydrolysis with the addition of 1 mL of NaOH (5 M). The NaOH solution was injected first into the P&T to ensure immediate conversion of DMSP into DMS and avoid subsequent loss of DMS. Following the injection of the strong base, either 3 mL or 1.5 mL of DMSP (dissolved or total, respectively) was injected and analyzed as described above for DMS determination. The final concentration of NaOH was either 1.25 M (DMSPd) or 2 M (DMSPt). Our tests revealed that those concentrations were largely sufficient to convert DMSP into DMS stoichiometrically. The detection limit for DMS/P analyses was 0.8 nmol L–1.
2.3.6. Microbial 35S-DMSPd uptake assays
For the determination of microbial DMSPd uptake and metabolism, samples of seawater were collected from the microcosm bags before sunrise and amended with 35S-DMSPd following the radiotracer methods described by Kiene and Linn (2000) with modifications by Slezak et al. (2007). The 35S-DMSP was synthesized at the Dauphin Island Sea Lab (R. Kiene, University of South Alabama) from L-[35S]-methionine with an initial specific activity of 1,175 Ci mmol–1. Several microbial DMSP transformations were investigated including the DMSPd loss rate constant (), DMSPd-to-DMS conversion efficiency (DMS yield), DMSP incorporation into particles >0.2 µm (particulate yield), and the further incorporation of 35S into macromolecules (a measure of the assimilation efficiency of sulfur) as well as the pool of untransformed 35S-DMSP in cells (Kiene and Linn, 2000). Briefly, samples were taken from each microcosm in 7-mL high-density polyethylene Nalgene bottles, and trace amounts (<5 pmol L–1) of 35S-DMSPd were added to obtain an initial radioactivity of approximately 1,000 dpm mL–1. Total initial activity was determined after gently mixing the bottles and subsampling 1 mL into 20-mL scintillation vials containing 10 mL of Ecolume™ liquid scintillation cocktail. To determine the , the bottles were incubated in a thermostat bath at in situ temperature for 3 h during which time 1 mL was subsampled after 0, 30, 60, and 180 min. The subsamples were filtered using Whatman GD/X syringe filters (0.2 µm Nylon membrane) into a polyethylene vial containing 10 mL of 20% sulfuric acid (H2SO4, final pH < 2) in order to stop bacterial activity and oxidize 35S-volatiles into nonvolatiles, while preserving 35S-DMSP (Curran et al., 1999; Kiene and Slezak, 2006). Following a >24-h dark and cool storage, the remaining 5S-DMSP was analyzed by transferring a 2-ml subsample from each time-point sample into a 100-mL serum vial. The vials were swiftly sealed using a rubber septum fitted with a well cup and a type-A/E glass filter soaked with 200 µL of stabilized H2O2 (3%). The serum vials were placed on an orbital shaker at 100 rpm for approximately 6 h to trap the volatile 35S-DMS after being injected with 200 µL of NaOH (5 M) through the stopper to cleave the remaining 35S-DMSPd (Kiene and Linn, 2000). Then, the A/E filters were transferred into 20-mL scintillation vials containing 10 mL of Ecolume™ liquid scintillation cocktail to determine the loss of DMSPd over time. The was calculated as the slope of the natural logarithm of the remaining fraction of 35S-DMSPd (trapped as 35S-DMS) versus time. Blank abiotic controls were performed on Days 4 and 12 by using 0.2 µm filtered seawater from a microcosm treated with 35S-DMSPd. The loss rates in those filtered controls were less than 1% of the of the live samples, indicating extracellular enzyme activity was not a significant process in DMSPd loss.
Determination of the different fates of consumed DMSPd was conducted in parallel incubations. Samples of 71 mL were collected in HDPE Nalgene bottles, injected with DMS (100 nmol L–1 final concentration), an inhibitor of DMS consumption (Simó et al., 2000; Galí et al., 2011), and tracer amounts of 35S-DMSPd (<5 pmol L–1). The bottles were incubated at in situ temperature for 24 h until >90% of the 35S-DMSPd was consumed (Slezak et al., 2007). After the incubation, 5 mL subsamples were taken to determine the volatile 35S produced. The subsamples were placed in 100-mL serum vials containing 100 µL of sodium dodecyl sulfate (SDS), 200 nmol L–1 of unlabeled DMSPd to prevent the further metabolization of 35S-DMSPd, and 50 µL of Ellman’s reagent to complex thiols such as MeSH, ensuring the majority of volatiles recovered were in the form of 35S-DMS. Following the transfer of the subsamples, the serum vials were swiftly sealed with a rubber septum fitted with a well cup and a type-A/E glass filter soaked with 200 µL of stabilized H2O2 (3%), and placed on an orbital shaker at 100 rpm for approximately 6 h to trap the volatile 35S-DMS (Kiene and Linn, 2000). The filters were then placed in 20-mL scintillation vials containing 10 mL of Ecolume™ liquid scintillation cocktail. After the 35S-DMS was trapped, a new H2O2-soaked filter was placed in the well cup fixed to the septum of the serum vials before being sealed. Each serum vial was injected with 200 µL of NaOH (5 M) through the stopper to cleave the remaining 35S-DMSPd, allowing us to express the 35S-DMS produced as a fraction of the consumed 35S-DMSPd during the parallel incubation.
To quantify the particulate yield and the incorporation of 35S-DMSPd into macromolecules, duplicate subsamples of 5 mL were taken from the 71-mL Nalgene bottles after the 24-h incubations and gently filtered by hand on 0.2 µm Nylon filters. The first filter was rinsed only with filtered seawater (particulate yield), while the second was also rinsed with trichloroacetic acid (TCA) to determine the assimilation efficiency into macromolecules (Kiene and Linn, 2000). The filters were then placed in scintillation vials as described above. To estimate the pool of untransformed 35S into particles, the fraction of 35S found as macromolecules was subtracted from the particulate yield (Kiene and Linn, 2000). All of the samples were counted on a Tri-Carb 4910TR liquid scintillation counter (PerkinElmer) in the weeks following collection. Logistical constraints did not allow us to monitor microbial DMSP cycling dynamics prior to Day 4. The transformation pathways of 35S-DMSPd measured during this experiment are considered to be microbial processes dominated largely by heterotrophic bacteria but not excluding low DMSP-producing phytoplankton and cyanobacteria that have also been shown to take up DMSPd (Malmstrom et al., 2005; Vila-Costa et al., 2006b).
2.4. Statistical analyses
The statistical analyses were performed using RStudio, with the nlme package (R Core Team, 2016). Normality of the data was verified using a Shapiro-Wilk test (P < 0.05), and data were log- or rank-transformed when normality was rejected. The data were analyzed using mixed model linear regressions, accounting for repeated measures covariance. Results from these models were used to test the effects of treatment (1 × pCO2, 2 × CO2, and 3 × pCO2), time, and the interaction of these factors over the duration of the experiment (Table S1). Post hoc Tukey honest significant difference (HSD) tests with Sidak corrections for multiple comparisons were performed to provide further assessment of the differences between treatments on selected days. Treatments were assigned to different letter groups (a, b, c) when significant differences were detected during daily pairwise comparisons (e.g., Table S2). In addition, nonparametric Spearman’s ρ correlation coefficients (rs) were used to evaluate the strength and direction of association between two ranked variables. In the Results section, when presenting results across all treatments for a given day, the average and standard deviation are shown (n = 9), while values referring to specific treatments on a particular day are presented as the mean and standard error (n = 3), unless stated otherwise.
3. Results
3.1. Physical and chemical conditions during the experiment
The mean and standard deviation for water salinity was 28.06 ± 0.05 (n = 9) on Day 0 in all the microcosms and remained constant throughout the experiment, averaging 28.10 ± 0.10 (n = 9) on Day 12. The temperature of the incubators fluctuated naturally throughout the experiment, with 7.5 °C on Day 0, increasing to 8.4 °C on Days 3–4, then decreasing to approximately 5 °C between Days 7 and 12. Values of three carbonate system parameters (pHT, pCO2, and TA) were monitored or calculated for each treatment at Days 0, 2, 5, 7, 9, and 12. Over the duration of the experiment, TA remained constant in all treatments, varying by less than 1% of the initial concentration. On Day 0, the pHT was 7.72 ± 0.04, 7.35 ± 0.01, and 7.18 ± 0.01, and the corresponding pCO2 were 776 ± 76, 1,855 ± 56, and 2,728 ± 54 µatm for the 1 × pCO2, 2 × pCO2, and 3 × pCO2 treatments, respectively (n = 3; Figure 2 and Table S1). As expected, the CO2 uptake associated with photosynthetic microorganisms led to variations in pCO2 and pHT in all microcosms, a common phenomenon in experiments allowing pH to drift naturally (Rost et al., 2008; Hussherr et al., 2017). The decrease in pCO2 was stronger in the acidified treatments of approximately 1,300 µatm (2× pCO2 and 3× pCO2) as compared to the control of approximately 650 µatm (1× pCO2; Figure 2b and Table S1).

Temporal variations in pHT and pCO2 for all treatments. Temporal variations in (a) pHT and (b) pCO2 in each treatment (1 × pCO2, 2 × pCO2, and 3 × pCO2; see legend for symbol attribution). Daily averages are presented (mean ± standard error, n = 3). Where error bars are not visible, the error was smaller than the size of the symbol. DOI: https://doi.org/10.1525/elementa.2020.00043.f2
Temporal variations in pHT and pCO2 for all treatments. Temporal variations in (a) pHT and (b) pCO2 in each treatment (1 × pCO2, 2 × pCO2, and 3 × pCO2; see legend for symbol attribution). Daily averages are presented (mean ± standard error, n = 3). Where error bars are not visible, the error was smaller than the size of the symbol. DOI: https://doi.org/10.1525/elementa.2020.00043.f2
On Day 0, NO3–, SRP, and Si(OH)4 concentrations across treatments averaged 12.5 ± 0.7 µmol L–1, 0.69 ± 0.07 µmol L–1, and 19.84 ± 0.01 µmol L–1, respectively (n = 9; Figure 3). During the incubation, the nutrients displayed the same general pattern, regardless of pCO2 treatments. NO3– and SRP were drawn rapidly from the microcosms at the onset of the experiment, remaining near or below the detection limit from Day 8 onward. Si(OH)4 remained relatively stable until Day 4, then decreased until Day 12, although the concentrations were significantly lower in the 1 × pCO2 treatment between Days 8 and 12, diminishing to 3.9 ± 1.0 µmol L–1 compared to 7.0 ± 1.5 µmol L–1 and 9.0 ± 0.7 µmol L–1 for 2 × pCO2 and 3 × pCO2, respectively (n = 3).

Temporal variations in nutrients for all pCO2 treatments. Temporal variations in (a) nitrate, (b) soluble reactive phosphate, and (c) silicic acid in each treatment (1 × pCO2, 2 × pCO2, and 3 × pCO2; see legend for symbol attribution). Daily averages are presented (mean ± standard error, n = 3). Where error bars are not visible, the error was smaller than the size of the symbol. Tukey honest significant difference between treatments on a given day is indicated by grouping letters (a and b). DOI: https://doi.org/10.1525/elementa.2020.00043.f3
Temporal variations in nutrients for all pCO2 treatments. Temporal variations in (a) nitrate, (b) soluble reactive phosphate, and (c) silicic acid in each treatment (1 × pCO2, 2 × pCO2, and 3 × pCO2; see legend for symbol attribution). Daily averages are presented (mean ± standard error, n = 3). Where error bars are not visible, the error was smaller than the size of the symbol. Tukey honest significant difference between treatments on a given day is indicated by grouping letters (a and b). DOI: https://doi.org/10.1525/elementa.2020.00043.f3
3.2. Phytoplankton, primary production, and bacterial abundance
The average concentration of Chl a across the microcosms on Day 0 was 1.26 ± 0.2 µg L–1 (n = 9) and increased exponentially until Day 6 to reach 20 ± 4 µg L–1 (n = 3; 1 × pCO2) and 17 ± 1 µg L–1 (n = 3; 2 × pCO2). In the 3 × pCO2 treatment, however, Chl a was significantly lower on Day 6, with 10 ± 1 µg L–1 (n = 3), and only reached its maximum concentration on Days 8–10 (Figure 4a). In the 1 × pCO2 and 2 × pCO2 treatments, the bloom was followed by a decrease in Chl a biomass, before reaching a plateau between 10 and 14 µg L–1 on Days 8–12, irrespective of treatments.
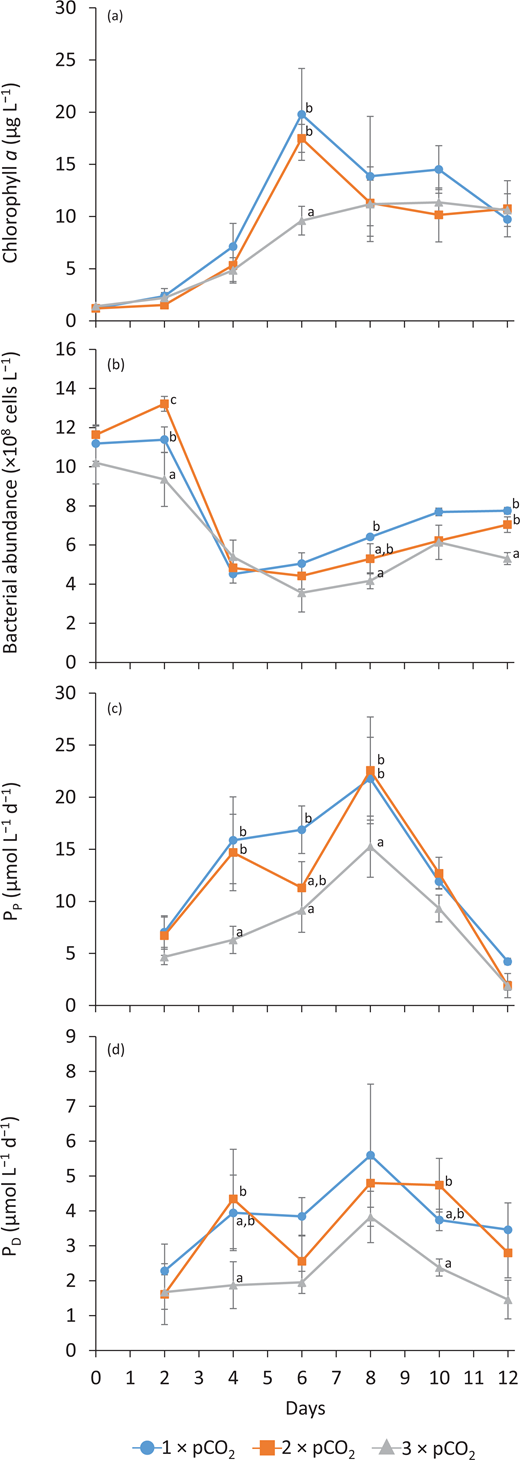
Temporal variations in phytoplankton biomass and production as well as bacterioplankton abundance for all pCO2 treatments. Temporal variations in (a) chlorophyll a concentration, (b) bacterial abundance, (c) particulate primary production rate (PP), and (d) dissolved primary production rate (PD) in each treatment (1 × pCO2, 2 × pCO2, and 3 × pCO2; see legend for symbol attribution). Daily averages are presented (mean ± standard error, n = 3). Tukey honest significant difference between treatments on a given day is indicated by grouping letters (a, b, and c). DOI: https://doi.org/10.1525/elementa.2020.00043.f4
Temporal variations in phytoplankton biomass and production as well as bacterioplankton abundance for all pCO2 treatments. Temporal variations in (a) chlorophyll a concentration, (b) bacterial abundance, (c) particulate primary production rate (PP), and (d) dissolved primary production rate (PD) in each treatment (1 × pCO2, 2 × pCO2, and 3 × pCO2; see legend for symbol attribution). Daily averages are presented (mean ± standard error, n = 3). Tukey honest significant difference between treatments on a given day is indicated by grouping letters (a, b, and c). DOI: https://doi.org/10.1525/elementa.2020.00043.f4
The initial planktonic community greater than 2 µm was identical in all the microcosms. On Day 0, the taxonomic composition was mostly comprised of small unidentified flagellates (2 to <10 µm; 51% of total numerical abundance) and a mixed assemblage of cryptophytes (Plagioselmis prolonga var. nordica; 7.4%), choanoflagellates (2 to <10 µm; 4%), dinoflagellates (Gymnodinium spp., Gyrodinium spp.; 3.4%), diatoms (Chaetoceros spp. and Skeletonema costatum; 2.5%), and “others” (approximately 24%; comprised of heterotrophic groups, ciliates, and undetermined cells 2 to <20 µm; Figure 5). By Day 6, an important shift in relative abundance of taxonomic groups had taken place. The contribution of diatoms species, including Chaetoceros spp., Skeletonema costatum, and Thalassiosira spp., to total abundance of protists had reached 50%, 25%, and 17% at 1 × pCO2, 2 × pCO2, and 3 × pCO2, respectively. The relative abundance of unidentified flagellates was 28%, 47%, and 46%, while the group “others” contributed to 9%, 17%, and 21% in the 1 × pCO2, 2 × pCO2, and 3 × pCO2 treatments, respectively. By the last day of the experiment (Day 12), diatoms were numerically dominant in all treatments, accounting for 60%, 46%, and 37% of the total cell counts at 1 × pCO2, 2 × pCO2, and 3 × pCO2, respectively.

Relative abundance of protists and variations during the experimental period. Relative abundance of nine groups of protists at the beginning of the experiment (Day 0), on Day 6, and at the end of the experiment (Day 12) in each treatment (1 × pCO2, 2 × pCO2, and 3 × pCO2). The group “others” includes Chlorophyceae, Dictyochophyceae, Euglenophyceae, heterotrophic groups, and ciliates. The bar plot on Day 0 represents the initial community assemblage before acidification. See legend for symbol attribution to protist groups. DOI: https://doi.org/10.1525/elementa.2020.00043.f5
Relative abundance of protists and variations during the experimental period. Relative abundance of nine groups of protists at the beginning of the experiment (Day 0), on Day 6, and at the end of the experiment (Day 12) in each treatment (1 × pCO2, 2 × pCO2, and 3 × pCO2). The group “others” includes Chlorophyceae, Dictyochophyceae, Euglenophyceae, heterotrophic groups, and ciliates. The bar plot on Day 0 represents the initial community assemblage before acidification. See legend for symbol attribution to protist groups. DOI: https://doi.org/10.1525/elementa.2020.00043.f5
The PP was low at the beginning of the experiment, averaging 6 ± 2 µmol C L–1 d–1 across treatments (n = 9; Figure 4c). Rates of Pp increased the fastest in the 1 × pCO2 and 2 × pCO2 treatments, reaching maximum values of 22 ± 4 and 23 ± 5 µmol C L–1 d–1 on Day 8 while PP reached a maximum of 15 ± 3 µmol C L–1 d–1 in the 3 × pCO2 treatment on the same day (n = 3). Rates of PP decreased during the following days to reach an overall average of 3 ± 1 µmol C L–1 d–1 on Day 12 (n = 9). Similarly, PD was low at the beginning of the experiment with an average of 1.9 ± 0.7 µmol C L–1 d–1 (n = 9), attaining maximum PD values on Day 8, averaging 5 ± 1 µmol C L–1 d–1 (n = 9) before diminishing to 3 ± 1 µmol C L–1 d–1 on Day 12 (n = 9; Figure 4d). The proportion of dissolved to total primary production (PD: PT ratio) was stable at approximately 20% across all treatments from Day 0 to 10, only increasing to approximately 50% on the last day of the experiment.
The initial abundance of bacteria was 11 ± 1 × 10⁸ cells L–1 on Day 0 (n = 9) across treatments, remaining relatively stable until Day 2 before sharply decreasing to 4.9 ± 0.6 × 10⁸ cells L–1 in all treatments on Day 4 (n = 9; Figure 4b). Then, the bacterial abundance varied with an overall increasing trend until the last day of the experiment when concentrations of 7.7 ± 0.2 × 10⁸ cells L–1, 7.0 ± 0.4 × 10⁸ cells L–1, and 5.3 ± 0.3 × 10⁸ cells L–1 (n = 3) were reached in the 1 × pCO2, 2 × pCO2, and 3 × pCO2 treatments, respectively.
3.3. DMSP and DMS
Temporal patterns in the concentrations of DMSPt were similar in all three treatments (Figure 6a). Initial average DMSPt concentration was 30 ± 6 nmol L–1 (n = 9), and highest concentrations of DMSPt were reached on Day 8 in the 1 × pCO2 treatment (264 nmol L–1; n = 3), on Day 10 in the 2 × pCO2 (245 nmol L–1; n = 3), and on Day 12 in the 3 × pCO2 (192 nmol L–1; n = 3). No significant differences in concentrations of DMSPt were observed between the pCO2 treatments other than on Day 8. Overall, DMSPd concentrations showed no statistically different variations between treatments throughout the experiment. Initially, DMSPd was low, averaging 2 ± 1 nmol L–1 across treatments, decreased slightly on Day 2, before increasing to 3.6 ± 0.7 nmol L–1 on Day 4, and varying between 4 and 6 nmol L–1 until Day 12 (n = 9; Figure 6b).
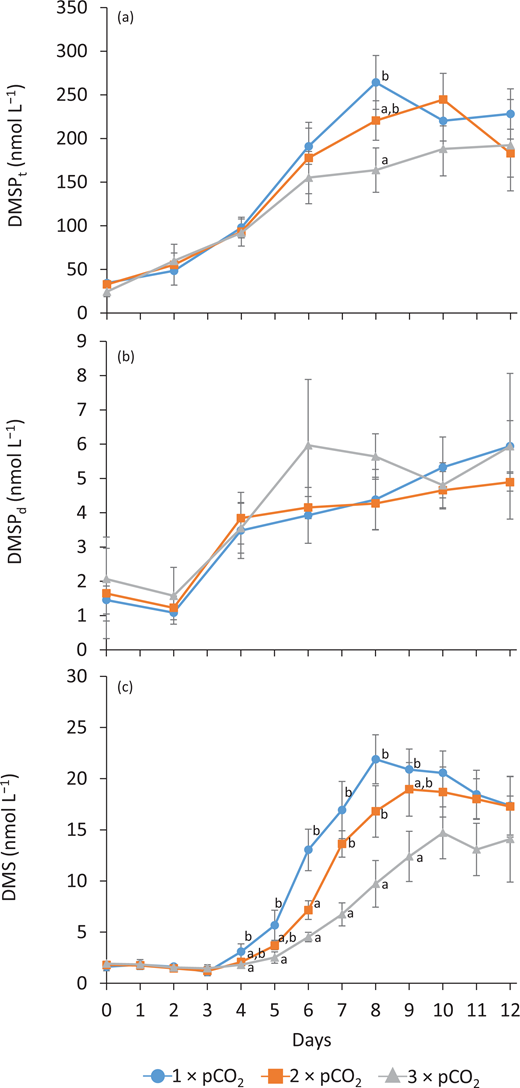
Temporal variations in concentrations of dimethylated sulfur compounds for all pCO2 treatments. Temporal variations in (a) total dimethylsulfoniopropionate (DMSP) concentrations (DMSPt), (b) dissolved DMSP concentrations (DMSPd), and (c) DMS concentrations in each treatment (1 × pCO2, 2 × pCO2, and 3 × pCO2; see legend for symbol attribution). Daily averages are presented (mean ± standard error, n = 3). Where error bars are not visible, the error was smaller than the size of the symbol. Tukey honest significant difference between treatments on a given day is indicated by grouping letters (a and b). DOI: https://doi.org/10.1525/elementa.2020.00043.f6
Temporal variations in concentrations of dimethylated sulfur compounds for all pCO2 treatments. Temporal variations in (a) total dimethylsulfoniopropionate (DMSP) concentrations (DMSPt), (b) dissolved DMSP concentrations (DMSPd), and (c) DMS concentrations in each treatment (1 × pCO2, 2 × pCO2, and 3 × pCO2; see legend for symbol attribution). Daily averages are presented (mean ± standard error, n = 3). Where error bars are not visible, the error was smaller than the size of the symbol. Tukey honest significant difference between treatments on a given day is indicated by grouping letters (a and b). DOI: https://doi.org/10.1525/elementa.2020.00043.f6
Concentrations of DMS were low and stable in all treatments during Days 0–3, averaging 1.6 ± 0.4 nmol L–1 (n = 9) during that time. From Day 4 onward, DMS accumulated until Days 8, 9, and 10 in the 1 × pCO2, 2 × pCO2, and 3 × pCO2 treatments, respectively, reaching 22 ± 2 nmol L–1, 19 ± 3 nmol L–1, and 15 ± 3 nmol L–1 (n = 3). Following these accumulations, DMS then decreased or plateaued until Day 12 (Figure 6c) in all three treatments. The highest daily DMS concentrations were always measured in the 1 × pCO2 treatment, although they were not statistically different from those in the 2 × pCO2 treatment, except on Day 6. The lowest concentrations were always measured in the 3 × pCO2 treatment, with significant differences from the other treatments observed on Days 7 and 8 (Table S2). Calculated rates of DMS net change between Day 3 and peak DMS per treatment were approximately 4.2, 3.0, and 1.9 nmol L–1 d–1, for 1 × pCO2, 2 × pCO2, and 3 × pCO2, respectively.
3.4. DMSP cycling
The measured 35S-DMSPd loss rate constant, , averaged 5.2 ± 1.5 day–1 on Day 4 across treatments (n = 9), then decreased to 2.6 ± 0.4 day–1 (n = 3) and 2.1 ± 0.4 day–1 (n = 3) in the 1 × pCO2 and 2 × pCO2 treatments on Day 6, while remaining significantly higher in the 3 × pCO2 treatment at 7.5 ± 1.4 day–1 (n = 3; Figure 7a). Values of then ranged between 2.6 and 5.5 day–1 until Day 12, irrespective of treatment. Between Days 4 and 6, the 35S-DMSPd present in particles >0.2 µm (particulate yield) varied from 33 ± 6% to 20 ± 8% in all treatments (n = 9; Figure 7b). On Day 8, the particulate yield was significantly higher in the 2 × pCO2 and 3 × pCO2 than in the 1 × pCO2 treatment, with 32 ± 13% and 34 ± 8% versus 11 ± 2% (n = 3). During the last 2 days, the particulate yield increased from 22 ± 5% to 38 ± 7% irrespective of treatments (n = 9). The incorporation of 35S-DMSPd into macromolecules was higher only in the 1 × pCO2 treatment over Days 4–6 with 10 ± 3% (n = 6), while values for the rest of the experiment ranged from 3.5% to 6.7% irrespective of treatments (Figure 7c). Moreover, the untransformed fractions of 35S-DMSP present in particles >0.2 µm (total 35S in particles; i.e., 35S-incorporated in macromolecules) varied between 4% and 38% throughout the experiment. Only on Day 8, the untransformed fractions of 35S-DMSPd were significantly higher in the two high pCO2 treatments (27% at 1 × pCO2 and 30% at 2 × pCO2), as compared to the control (4% at 1 × pCO2; Figure 7d). The yields of DMS from DMSPd, determined as the fraction of 35S-DMSPd consumed and transformed into DMS, averaged 7 ± 4% across treatments on Day 4 (n = 9). The daily DMS yields were inversely proportional to the CO2 treatments between Days 6 and 12, with the highest DMS yields at 1 × pCO2 (approximately 68% on Days 6–8), intermediate DMS yields at 2 × pCO2 (approximately 49% on Day 10), and the lowest maximum DMS yield at 3 × pCO2 (approximately 29% on Day 10; Figure 7e).
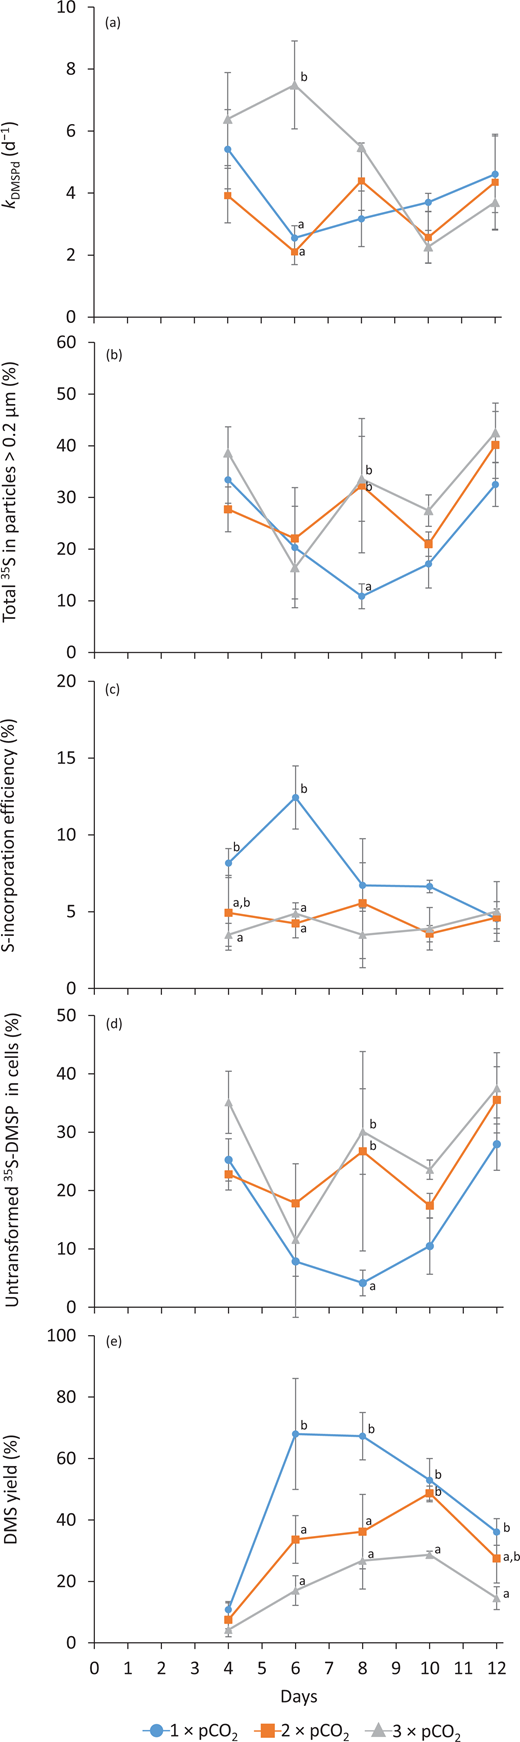
Temporal variations in microbial dimethylsulfoniopropionate (DMSP) cycling variables for all pCO2 treatments. Temporal variations of (a) microbial DMSPd loss rate constant ( in day–1), (b) particulate yield (%), (c) assimilation efficiency of 35S-DMSPd into macromolecules (%), (d) particulate untransformed 35S, and (e) microbial DMS yield (%) in each treatment (1 × pCO2, 2 × pCO2, and 3 × pCO2; see legend for symbol attribution). Daily averages are presented (mean ± standard error, n = 3). Tukey honest significant difference between treatments on a given day is indicated by grouping letters (a, b, and c). DOI: https://doi.org/10.1525/elementa.2020.00043.f7
Temporal variations in microbial dimethylsulfoniopropionate (DMSP) cycling variables for all pCO2 treatments. Temporal variations of (a) microbial DMSPd loss rate constant ( in day–1), (b) particulate yield (%), (c) assimilation efficiency of 35S-DMSPd into macromolecules (%), (d) particulate untransformed 35S, and (e) microbial DMS yield (%) in each treatment (1 × pCO2, 2 × pCO2, and 3 × pCO2; see legend for symbol attribution). Daily averages are presented (mean ± standard error, n = 3). Tukey honest significant difference between treatments on a given day is indicated by grouping letters (a, b, and c). DOI: https://doi.org/10.1525/elementa.2020.00043.f7
4. Discussion
4.1. Impact of heightened pCO2 on bloom development
In this study, a natural estuarine plankton community was exposed to three treatments corresponding to single, double, and triple pCO2 conditions. The collected surface water was sourced during summer, under pre-bloom conditions of low Chl a and high nutrient concentrations (Figures 3 and 4). Following the acidification treatment, an increase in phytoplankton biomass took place causing the exhaustion of NO3– and SRP in all microcosms (Figure 3). While the initial mixed phytoplankton community was dominated by unidentified flagellates (51%), the relative abundance of diatoms increased during the experiment, accounting for 60%, 46%, and 37% of the total community by the end of the experiment in the 1 × pCO2, 2 × pCO2, and 3 × pCO2 treatments, respectively. A mixed assemblage of Chaetoceros spp., Skeletonema costatum, and Thalassiosira spp. was responsible for the increases in diatoms over the 12-day experiment. Such increases in diatoms are typical of spring and early summer phytoplankton blooms in the LSLE, which are characterized by the dominance of diatoms, while the autumn succession favors the development of smaller groups including dinoflagellates and flagellates (Levasseur et al., 1984). Silicic acid, one of the co-limiting factors for the growth of diatoms in the LSLE (Levasseur and Therriault, 1987; Levasseur et al., 1990), was not totally depleted by the end of the incubation period. However, the higher relative abundance of diatoms in the 1 × pCO2 microcosms was accompanied by a significantly (Tukey HSD) sharper decrease in Si(OH)4 concentrations (Figure 3c) as compared to the 3 × pCO2 treatment from Day 8 onward, confirming the greater uptake of silicic acid by the diatoms in the nonacidified control. While the relative importance of diatoms increased across all treatments between Day 0 and Day 6, heightened pCO2 dampened this signal from 50% (1 × pCO2) to 25% (2 × pCO2) and 17% (3 × pCO2) of the cell counts at mid-experiment, a pattern that was still visible at the end of the experiment (Figure 5). Current understanding of the impacts of elevated partial pressure of CO2 on diatoms shows little consensus, as recently demonstrated by a synthesis of over a decade of ApHP experiments (69 in total) with natural communities sourced from various settings across the World Ocean, including estuaries (Bach and Taucher, 2019). In the 60% of cases where diatom communities responded to heightened pCO2, 56% and 32% of these responses were positive and negative, respectively. These contradictory responses are thought to be intimately linked to specific traits expressed by members of the communities, such as the carbon fixation pathway or cell size, as well as other environmental factors including temperature, light, micro- and macronutrients, and conditions of eutrophication and hypoxia in certain coastal regions (Gao et al., 2012; Hoppe et al., 2013; Melzner et al., 2013; Gypens and Borges, 2014; Wu et al., 2014). Longer term community level experiments in a wide span of aquatic settings are thus needed to unravel whether biotic responses manifest adaptation, recovery, and resilience at the ecosystem level. Such experiments are crucial because changes in assemblage structure may alter trophic transfers, biogeochemical cycles, and key ecosystem services, including the production of the climate-active gas DMS.
The increase in pCO2 also translated into differences in the timing and magnitude of maximum Chl a reached. These differences were particularly evident in the triple pCO2 treatment (Figure 4a) where Chl a peaked 2 days later and never exceeded 12 µg L–1 (3 × pCO2) as compared to 20 ± 4 µg L–1 (n = 3; 1 × pCO2). Significant differences in rates of PP were also observed (Tukey HSD test) between 1 × pCO2 and 3 × pCO2 on Days 4 and 8 inclusively, with the lowest rates of PP measured in the most acidified treatment (Figure 4c). Although many studies have shown an increase in primary production under elevated pCO2 (Riebesell et al., 2007; Egge et al., 2009; Engel et al., 2013), unabated or reduced primary productivity has also been reported (Gao et al., 2012; Gao and Campbell, 2014; Maugendre et al., 2017). Most phytoplankton groups have developed carbon concentration mechanisms to cope with CO2 deficiency, although the efficiencies of those mechanisms vary extensively between taxa (Raven et al., 2014). Therefore, predicting how elevated pCO2 might affect carbon fixation is challenging, given the numerous species present in an assemblage and their specific CO2 affinities (Giordano et al., 2005). Furthermore, the decrease of pH is likely to influence the community structure, with repercussions on community production (Tatters et al., 2013; Eggers et al., 2014). Thus, under elevated CO2 in the current experiment, changes in community composition, along with a possible increase in microzooplankton grazing under high CO2 (Rose et al., 2009; Neale et al., 2014), could have limited rates of primary production.
4.2. Effect of acidification on concentrations of dimethylated compounds
Patterns of DMSPt concentrations were not significantly different between treatments throughout most of the incubation period except for a marginal decrease in DMSPt in the triple pCO2 treatment relative to the 1 × pCO2 treatment on Day 8 of the experiment. Concentrations of DMSPt were positively correlated with concentrations of Chl a (rs = 0.77; P < 0.001; n = 61), suggesting that the greatest part of the variance in concentrations of DMSPt was associated with the variance in phytoplankton biomass. Similar results have been reported elsewhere, suggesting that DMSP production may not be strongly impacted by acidification, but that DMS concentrations may be impacted through alteration of the processes controlling the transformation of DMSP to DMS (Hopkins and Archer, 2014; Webb et al., 2015; Webb et al., 2016; Bénard et al., 2019). Overall, concentrations of DMSPd fluctuated throughout the experiment (Figure 6b), broadly following variations in DMSPt (rs = 0.70; P < 0.001; n = 61) with no significant differences between pCO2 treatments suggesting that the availability of DMSPd as a substrate for bacteria was not modulated by the acidification.
In stark contrast to pools of its precursor, DMS was significantly reduced under the 2 × pCO2 treatment and even further under the 3 × pCO2 (Figure 6c) from Day 4 onward. Averaged over the entire 12-day study period, doubling the pCO2 resulted in a 15% decline in mean concentrations of DMS, while tripling the pCO2 decreased average DMS by 40% as compared to 1 × pCO2. These results are consistent with previous results showing a decrease in DMS concentrations with increasing pCO2 (Hopkins et al., 2010; Archer et al., 2013; Archer et al., 2018; Arnold et al., 2013; Park et al., 2014; Webb et al., 2015; Webb et al., 2016; Hussherr et al., 2017; Bénard et al., 2019). Decreasing trends in DMS concentrations following ApHP have largely been attributed to changes in the structure of communities, including shifts in species dominance and modulation of grazing pressure, but also to potential modifications in the microbial uptake of DMSP and ensuing metabolic fates (Archer et al., 2013; Webb et al., 2015; Hussherr et al., 2017; Bénard et al., 2019). Despite the latter suite of processes being of central importance in modulating the amount of DMS available for sea-to-air transfer, until now only indirect evidence that ApHP may alter microbial dynamics of DMSP was available (Archer et al., 2013; Bénard et al., 2019), with the exception of one study. A pCO2-perturbation experiment in natural subtropical seawater mesocosms investigated 35S-DMSPd-based measurements of DMSPd catabolism across a pCO2 gradient of 400–1,252 atm (Archer et al., 2018). Results from this experiment demonstrated for the first time that DMSPd catabolism in general and microbial DMSPd-to-DMS conversion in particular were negatively affected by heightened [H+]T. However, the underlying mechanistic causes of this inhibition, whether a direct effect of increased [H+]T on microbial DMSP metabolism or an indirect response to [H+]T-driven changes in DMSPd availability, remained ambiguous, leaving part of the microbial “black box” sealed.
4.3. Impact of acidification on microbial uptake of DMSP and its fates
Bacteria are well known to scavenge DMSPd efficiently (Kiene et al., 1999; Kiene et al., 2000; Kiene and Linn, 2000; Vila-Costa et al., 2006a). Rates of microbial scavenging efficiency can be estimated by determining a first-order loss rate constant () for tracer amounts of added 35S-DMSPd. Throughout the experiment, varied between 2.1 and 7.5 d–1 irrespective of treatment, with higher values at 3 × pCO2 detected on Day 6 only. Overall (excepting Day 6), these results suggest that processes regulating the scavenging of DMSPd by microorganisms could be rather insensitive to acidification, at least in the estuarine context explored during this study. The range of measured suggests turnover times of 3.2–11.4 h, which, assuming steady-state conditions, would indicate the hourly renewal of 9%–31% of the DMSPd stock. These results are similar to the only other microbial DMSPd turnover times reported for a pCO2-perturbation experiment by Archer et al. (2018) who described slightly speedier turnovers of 1.3–6.3 h across the pCO2 range tested (400–1,252 atm). Microbial loss rate constants were not strongly related to bacterial abundance, in keeping with the idea that bacterial community composition and production may be more relevant in shaping than the absolute number of bacteria (Malmstrom et al., 2005; Vila-Costa et al., 2007; Royer et al., 2010). However, in the absence of bacterial production rates and identification or bacterial typing data, these avenues cannot be explored further here. Overall, values measured in this experiment agree with rates reported from several oceanic and coastal regions (Lizotte et al., 2017), and appeared to be mostly unaffected by the manipulation of pCO2, at least in the later stages of the experiment. However, as pCO2 increased throughout the experiment following the initial acidification, the possibility that bacterial DMSPd uptake may have been further altered by a constant pH reduction, and if so, to what extent, cannot be excluded.
Once consumed by bacteria, 35S-DMSP becomes part of an intracellular particulate fraction (Figure 7b) where the fate of the S-moiety is thought to be linked to a “bacterial switch” (Simó, 2001), a regulatory pivot with opposing biogeochemical end points that exert a control on the quantities of DMS ultimately produced through microbial mediation (Reisch et al., 2011). One possible fate for the S-moiety is assimilation into TCA-insoluble material, most of which is protein, operationally defined here as macromolecules (Gonzalez et al., 1999; Kiene et al., 1999). The S-incorporation efficiency (or yield of macromolecules; Figure 7c) was higher at 1 × pCO2 as compared to 3 × pCO2 on Days 4 and 6, reaching 10 ± 3%, while oscillating around 5% for the rest of the experiment. Despite these two higher average values in the control microcosms, how specifically ApHP may impact the assimilatory efficiency of sulfur by microbes remains unclear, as the signal is not comprehensive over the full experiment, thus warranting further studies. The overall low S-assimilation efficiencies, less than 12%, agree with previous studies suggesting that bacteria may use DMSP solely as a carbon source, once their S requirements are met (Scarratt et al., 2000; Pinhassi et al., 2005; Lizotte et al., 2017). This scenario would induce the switch toward the DMSP-cleavage pathway that produces acrylate, used by bacteria as a carbon source, and DMS, which is released back into the medium (Kiene, 1990; Ledyard and Dacey, 1996; Yoch, 2002).
Results from this study show that acidification may have a significant impact on DMSPd-to-DMS conversion efficiency, lending additional support to the conclusion reached by Archer et al. (2018) that DMSPd cleavage to DMS depends on [H+]. With the exception of Day 4, when microbial DMS yields averaged 7% across treatments, DMSPd-to-DMS conversion efficiencies were significantly different (Tukey HSD test) between 1 × pCO2 and 3 × pCO2 (Figure 7e) for the remainder of the experiment (Days 6–12). These results suggest that ApHP may modify the fate of DMSP consumed by microorganisms by reducing the proportion of DMSPd that is converted into DMS. The significant positive correlation found between microbial yields of DMS and concentrations of DMS (rs = 0.65; P < 0.001; n = 45) supports this idea and further suggests that in cosmopolitan diatom–dominated systems, ApHP may impact concentrations of DMS through the alteration of the microbial breakdown of DMSPd. Bacterial ectoenzyme activity can be particularly sensitive to alterations in [H+] (Piontek et al., 2010), with potential consequences for the bacterial catabolism of DMSP and removal of DMS. Microbial yields of DMS varied extensively during the experiment (Figure 7e), from 11% to 68% (1 × pCO2), from 8% to 49% (2 × pCO2), and from 4% to 29% (3 × pCO2). Several of these very high yields, especially in the control pCO2, are among the highest estimates reported in the literature, which rarely exceed 40% (see compilation table in Lizotte et al., 2017). The positive correlation discussed above (rs = 0.65) suggests that 42% of the variance (R2 = 0.652 × 100) in net concentrations of DMS may be explained by yields of DMS. The unexplained remaining variance could be related to other sources of DMS, including direct production through phytoplankton species possessing DMSP-lyases, as well as sinks of DMS including bacterial DMS consumption. Although pCO2 manipulation experiments span a variety of habitats and methodological approaches, the majority of studies harmonize on a general trend of negative [H+]-dependence of DMS. Despite being conducted in a region under ApHP, where both OA and other anthropogenic stressors strengthen acidification, results from this study support the global extrapolation of this negative [H+]-dependence of DMS used in model studies (Six et al., 2013; Schwinger et al., 2017). This relatively consistent signal may be due, in part, to the widespread presence of DMSP-consuming bacterial assemblages across diverse marine habitats (Yoch 2002; Stefels et al., 2007; Curson et al., 2011) and the sensitivity of the bacterial DMSP switch to pCO2 perturbations.
Although DMS yields varied throughout the experiment, a noteworthy result from this study is the significant negative correlation (rs = –0.62; P < 0.001; n = 44) between DMS yields and the fraction of 35S-DMSPd consumed by microbes and kept untransformed in the cells after 24 h (Figure 7d). While unclear how acidification may impact this untransformed pool of DMSP directly (with only Day 8 exhibiting a significant increase of this untransformed fraction in the 3 × pCO2 treatment as compared to the 1 × pCO2 control; Figure 7d), the negative association between these potential metabolic fates is intriguing. Several studies show that bacteria can accumulate DMSP intracellularly over several hours without degrading it (Wolfe, 1996; Kiene et al., 1999; Kiene and Linn, 2000). In these studies, the accumulation of DMSP was more rapid in osmotically stressed cells, suggesting that DMSP can be used as an osmolyte by heterotrophic bacteria. In the very few 35S-DMSPd tracer studies reporting on all of the potential fates of DMSPd, about 15%–20% of added DMSPd was consumed by bacterial cells but not further metabolized even after 24 h of incubation (Kiene and Linn, 2000; Kiene et al., 2000; Tripp et al., 2008). Average fractions of untransformed 35S-DMSPd in this study varied from 4% to 28% in the 1 × pCO2 treatment, from 17% to 36% in the 2 × pCO2, and from 12% to 38% in the 3 × pCO2 treatment (Figure 7d). These results suggest that a large portion of consumed DMSPd, more than a third on certain days in the acidified treatments, was stored untouched in the cells. The untransformed stock of DMSPd could be related to some type of adaptive mechanism in response to pH stress. This hypothesis remains to be tested, however, and thus may pave the way for future investigation into the underlying metabolic processes responsible for the partitioning of DMSP within bacteria under ApHP.
5. Conclusions
The results from this study provide novel insight into the microbially mediated fates of DMSP under heightened pCO2 derived from 35S-DMSP radio-isotopic uptake assays. A natural plankton community sourced from the surface waters of the SLE during summer 2013 was exposed to three initial pCO2 targets, corresponding to single (775 µatm), double (1,850 µatm), and triple pCO2 (2,700 µatm). Over the 12-day microcosm experiment, a mixed phytoplankton population, dominated by several species of diatoms and small unidentified flagellates, bloomed in all treatments resulting in an increase in concentrations of Chl a from an initial 1.26 µg L–1 to a peak of 20 ± 4 µg L–1 by Day 6 in the 1 × pCO2 control. While patterns of Chl a concentrations were similar in the 1 × pCO2 and 2 × pCO2 treatments, the magnitude and timing of the biomass accumulation were different in the 3 × pCO2 treatment, with a maximum of 11 ± 4 µg Chl a L–1 reached by Day 8 of the experiment. Variations in the concentrations of DMSPt were largely related to variations in Chl a (rs = 0.77; P < 0.001; n = 61). Concentrations of DMSPd fluctuated throughout the experiment, broadly associated with variations in DMSPt (rs = 0.70; P < 0.001; n = 61), with no significant differences between pCO2 treatments, suggesting that acidification did not alter the availability of DMSPd as a substrate for bacteria. The microbial scavenging efficiency of DMSPd (), as determined through 35S-DMSPd uptake assays, appeared to be mostly unaffected by the acidification treatment; however, the metabolic fate of consumed DMSPd was impacted by heightened pCO2. Results from this study are unique in showing that at peak bloom and onward (from Day 6 to Day 12) the microbial DMSPd-to-DMS conversion efficiency, otherwise known as the DMS yield, was significantly reduced, by 61%, in the highest pCO2 treatment (3 × pCO2) as compared to the control (1 × pCO2). Concentrations of DMS were also significantly curtailed under the acidification treatments: Averaged over the entire 12-day study period, doubling the pCO2 resulted in a 15% decline in mean concentrations of DMS, while tripling the pCO2 decreased average DMS by 40% as compared to the control. Furthermore, a significant positive correlation was found between microbial yields of DMS and concentrations of DMS (rs = 0.65; P < 0.001; n = 45), suggesting that the negative impact of ApHP on pools of DMS is intimately linked with modifications in the microbial partitioning of DMSPd, particularly in diatom-dominated ecosystems. Although ambiguity persists about the specific impact acidification may have on the many fates of DMSP consumed by bacteria, the negative association between DMS yields and the fraction of 35S-DMSPd kept untransformed in the cells (rs = –0.62; P < 0.001; n = 44) points toward the accumulation of DMSP as a potential protective mechanism in the face of heightened [H+]. By providing this new insight into how relatively minor adjustments in bacterial community metabolism under acidification could influence atmospheric chemistry, results from this study may facilitate a better understanding of Earth’s future climate and should be considered in predictions of DMS emissions. Further studies in waters regionally distinct in terms of carbonate chemistry are needed if the microbial “black box” is to be fully opened and explored in the context of anthropogenic perturbations to pH.
Data accessibility statement
The data are freely accessible via https://doi.pangaea.de/10.1594/PANGAEA.915942 (Bénard et al., 2020).
Supplemental files
The supplemental files for this article can be found as follows:
Table S1. Overview of the results of the mixed linear models testing for the effect of treatment (1 × pCO2, 2 × CO3, and 3 × pCO2), time, and the interactions of these factors over the duration of the experiment for the suite of tested response variables. Docx
Table S2. Overview of a Tukey honest significant difference test for averages of DMS concentrations per treatment, per day. Docx
Acknowledgments
The authors wish to thank the Maurice Lamontagne Institute and its staff for their support during the project. They also wish to acknowledge Rachel Hussherr and Liliane St-Amand for their invaluable help over the duration of the experiment.
Funding
This study was funded by a Team grant from the Fonds de la Recherche du Québec—Nature et Technologies (FRQNT-Équipe-165335), the Canada Research Chair on Ocean Biogeochemistry and Climate (950–229267), NSERC Discovery Grant (05965, JET), and by Fisheries and Oceans Canada. This is a contribution to the research program of Québec-Océan.
Competing interests
The authors declare that they have no conflict of interest.
Author contributions
Contributed to the conception and the experimental design: RB, MLe, MSc.
Contributed to the acquisition of data: RB, SM, SK.
Contributed to the synthesis of 35S-DMSP for tracer studies: RPK.
Contributed to the analysis and interpretation of data: RB, MLi, MSc, SM, MSt, JET, RPK.
Drafted and/or revised the article: All co-authors.
Approved the submitted version for publication: RB, MLi, MLe, MSc, SM, MSt, JET, SK.
References
How to cite this article: Bénard, R, Lizotte, M, Levasseur, M, Scarratt, M, Michaud, S, Starr, M, Tremblay, J-É, Kiene, RP, Kameyama, S. 2021. Impact of anthropogenic pH perturbation on dimethylsulfide cycling: A peek into the microbial black box. Elementa: Science of Anthropocene 9(1). DOI: https://doi.org/10.1525/elementa.2020.00043
Domain Editor-in-Chief: Jody W. Deming, University of Washington, Seattle, WA, USA
Associate Editor: Tamar Barkay, Department of Biochemistry and Microbiology, Rutgers, The State University of New Jersey, New Brunswick, NJ, USA
Knowledge Domain: Ocean Science