
. Introduction
Terrestrial vegetation is regarded as a sensitive indicator of climate change (Pauli et al., 2002; Nagy, 2006; Jiapaer et al., 2015). The insights from vegetation phenology may help to increase the understanding of the interaction between climate and vegetation and the exchanges of energy and matter in a given area (Hmimina et al., 2013). The normalized difference vegetation index (NDVI) was developed as a measure of vegetation greenness and is typically used to reflect ecological environment changes and evaluate land surface phenology at local, regional, and global scales (Gamon et al., 2015). The near-infrared and red-light reflectance ratio is based on satellite sensor data reflected by the vegetation status. In this ratio, NDVI=(NIR–RED)/(NIR+RED), where RED represents the amount of red light, and NIR represents the amounts of near-infrared light (Pettorelli et al., 2005). However, these data, provided since the 1980s, do not adequately describe the dynamic variations of vegetation coverage over a long time scale. To address this information gap, proxy data, such as tree rings, are frequently selected. These data can be used to evaluate the relationship between the radial growth of coniferous species and vegetation coverage and reflect the seasonal variability of vegetation coverage for hundreds of years (Malmström et al., 1997; D’Arrigo et al., 2000; Leavitt et al., 2008). The above studies mostly focused on high-latitude (Kaufmann et al., 2004; Lopatin et al., 2006; Beck et al., 2013), high-altitude (He and Shao, 2006; Shang et al., 2016), and arid areas (Liang et al., 2009; Wang et al., 2014), and relied on samples of tree rings from coniferous species.
The widespread coniferous forests in Central Asia, comprising mostly local tree species (Juniperus turkestanica Kom., Larix sibirica Ledeb., Pinus wallichiana and Picea schrenkiana) provide a good opportunity for dendrochronological studies (Esper, 2000; Chen et al., 2012; Zhang et al., 2014; Seim et al., 2016; Opała et al., 2017). Wooden cores derived from Central Asia have been systematically collected since the 1990s (Bräuning, 1994; Esper et al., 2007). Many dendrochronological studies related to ring-width variations (Esper, 2000), tree growth climate response (Esper et al., 2003; Winter et al., 2009) and hydro-climate reconstruction (Zhang et al., 2015; Chen et al., 2017a) have been carried out. However, when compared with the previous dendrochronological studies addressing hydro-climatological reconstructions, studies of tree-ring based vegetation coverage variations for Central Asia are relatively rare. In addition, the knowledge of the corresponding relationships between the radial growth of conifers and the vegetation coverage in Central Asia is still limited.
Therefore, the aims of this study are to: (1) develop a tree-ring width-based regional chronology for the Alatau Mountains; (2) reconstruct historical NDVI series for the study area and explore its variations, and (3) assess climatic signals inhering in the newly developed NDVI reconstruction.
. Materials And Methods
Sample collection
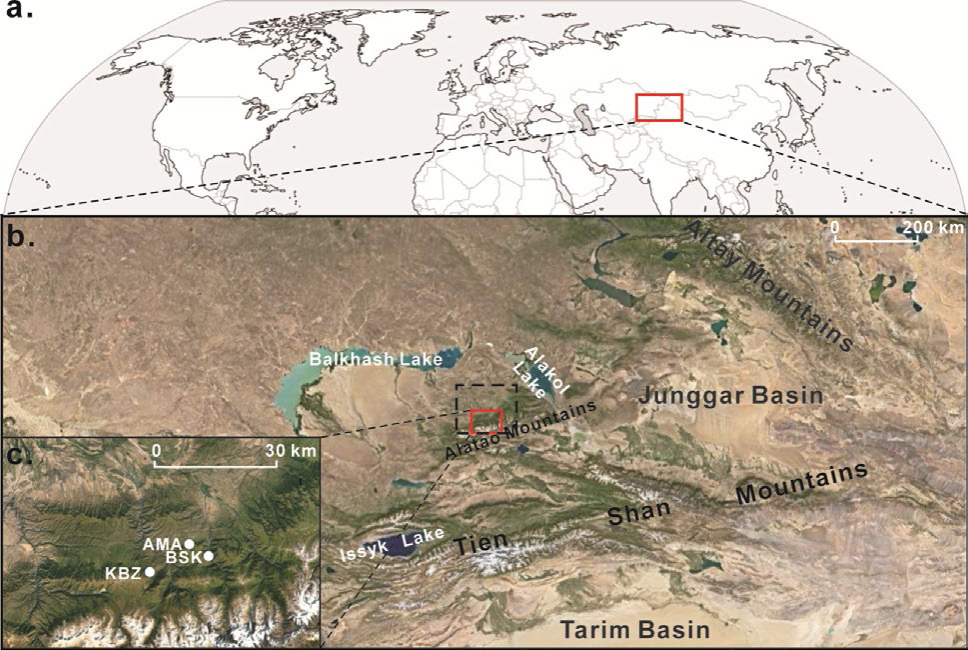
The Alatau Mountains form a boundary between China and Kazakhstan and are part of the Tian Shan Mountains of Central Asia. The Alatau Mountains extend more than 450 km from east to west, and the maximum elevation is approximately 4464 m a.s.l. The Alatau Mountains experience a temperate continental climate. The northern slopes of the Alatau Mountains have more annual precipitation (900–1000 mm) than the southern slopes and a lower snowline (3600 m a.s.l.). Approximately two-thirds of the mountains’ glaciers are distributed in the northern areas (He et al., 2014). The widespread, long-living, coniferous forest growing on the Alatau Mountains provides a good opportunity for carrying out dendrochronological studies to evaluate vegetation characteristics over a long-term period.
A long-lived Schrenk spruce (Picea schrenkiana) was selected as our study target. These spruces often grow up to 40 m in height and frequently live more than 200 years. More than 90% of the forest from 1200 to 2600 m a.s.l. in the Tien Shan Mountains contains Schrenk spruce, and it is the dominant tree species in the forests of the mountain zone. Tree-ring cores from three sites were sampled in July 2016. The study area and location of the sampling sites are shown in Fig. 1. Forest stands are moderately open and canopy densities are low. We selected healthy spruces with little evidence of damage by bushfire, landslides, earthquakes, human destruction, or animal invasion to avoid sampling non-climatic effects on radial growth. For most sampled trees, we parallelly extracted two cores from one tree at chest height. The two cores were collected from different directions at two flanks of a given tree. To collect tree cores that contained consistent climate signals, the altitude difference between the highest and lowest locations of one sampling site was less than 100 m. In total, we obtained 182 cores from 96 trees using increment borers at sites Amanboktek (code: AMA; location: 45.26°N–80.08°E; elevation: ~2050 m a.s.l.), Kikbay (KBZ; 45.21°N–79.97°E; ~1750 m a.s.l.), and Basika (BSK; 45.25°N–80.15°E; ~1450 m a.s.l.).
Ring-width measurements and chronology development
Following normal dendrochronological techniques (Speer, 2010), the sampled tree-ring cores were dried naturally and mounted on a wooden plank with grooves. Then, each core was sanded with abrasive paper and marked with needles under a microscope. Every ring on the sanded cores was measured under a binocular microscope using a Velmex Measuring System at a resolution 0.001 mm. This measuring system, the standard of North America’s Dendrological Research Community, is specifically designed for the researcher to perform non-contact measurement analysis. The system is composed of the following three main components: a UniSlide® dovetail rapid advance screw motion assembly, a linear encoder with one micron (0.001 mm) resolution, and a Velmex VRO™ Encoder Readout. Two programs, COFECHA (Grissino-Mayer, 2001) and ARSTAN (Cook and Krusic, 2005), were utilized for cross-dating quality control and to develop chronologies. To eliminate age trends that were affected by factors other than climate, the tree-ring width series were detrended using a negative exponential method, i.e. a conservative function. We used an expressed population signal (EPS) to evaluate the reliability of the chronology of the tree rings. The statistical analyses were done at 20-year intervals with an overlap of 10 years across the chronology. An EPS of ≥ 0.85 was used to ensure a reliable chronology length (Wigley et al., 1984).
Climatic data and vegetation index
For further analyses, we selected the precipitation, mean temperature, mean maximum temperature and mean minimum temperature per month of the Climatic Research Unit Time-Series (CRU TS 4.00; New et al., 2000), and the Palmer Drought Severity Index per month (scPDSI, CRU TS 3.25; Schrier et al., 2013) of the gridded 0.5° × 0.5° dataset (45°–46°N, 79°–81°E), available from 1901 to 2015, to describe the climatic conditions in the study area. Monthly normalized differential vegetation index (NDVI) data (44.932°–46.023°N, 78.986°–80.950°E) available from 1982 to 2006 were used to describe the vegetation conditions. The above climatic data and vegetation index were acquired from the Royal Netherlands Meteorological Institute (KNMI) Climate Explorer (http://climexp.knmi.nl).
Statistical analysis
We used 13-year reciprocal filters to decompose the developed chronologies of the tree rings into high- and low-pass components to evaluate the patterns of variation in various frequency ranges (Yuan et al., 2013). Variation patterns in these original and decomposed chronologies were assessed using Pearson correlations in the original, high-frequency, and low-frequency domains. Correlation analyses were also used to quantify the strengths of climatic signals and the vegetation conditions inherent in chronologies from spruces at the study site. We identified the strongest seasonal relationship between tree-ring width and vegetation data, and then a linear regression model was employed for reconstruction. We used Bootstrap (Young, 1994), Leave-one-out cross-validation (Michaelsen, 1987), and split-sample calibration-verification test (Meko and Graybill, 1995) methods to evaluate the statistical reliability of the reconstruction model. During the split-sample calibration-verification tests, the period of climatic data was split into two parts for calibration and verification. Several statistical parameters, including a reduction in error, coefficient of efficiency, and product mean test were calculated to evaluate the observed and estimated data (Cook et al., 1999). Spatial correlation was used to identify coherence between our reconstruction and the gridded 0.5° × 0.5° CRU self-calibrating PDSI 3.21 dataset (Wells et al., 2004) over a large region. In addition, statistical data from the Royal Netherlands Meteorological Institute (KNMI) were also used. Some tree-ring based climatic reconstructions and the newly developed vegetation coverage series were standardized using zero-mean normalization and decomposed using 13-year reciprocal filters to assess their coherence in a larger spatial context. Reanalysis 1 from the National Centers for Environmental Prediction/Department of Energy (NCEP/DOE) (Kalnay et al., 1996) was utilized to derive the large-scale circulation associated with the variation in the NDVI index. The Reanalysis is a meteorological data product that aims to represent the historical state of the atmosphere. Reanalysis 1 from the NCEP/DOE is one example of these Reanalysis data, and has a horizontal resolution of 2.5° × 2.5°. The climatology data from 1951 to 2000 has been removed to obtain the anomalies.
. Results
Meteorological data and NDVI analysis
Fig. 2a shows that the highest temperature periods in the study area were in summertime (from June to August), with peaks in July. Most of the annual precipitation fell in May, June, and July (120.1 mm). The two peak values of precipitation in May (42.2 mm) and November (30.1 mm), which account for 12.6% and 8.9%, respectively, of the total annual precipitation. Wintertime has less precipitation than summer. August is typically the wettest month of the year (PDSI=–0.46) for the study area (Fig. 2b). The climate data for 1901–present reveal remarkable rising tendencies in the study area for the following: annual total precipitation (Y=0.5466X–734.15, R2=0.066, p<0.01) (Fig. 2d), annual mean temperature (Y=0.0168X–29.944, R2=0.357, p<0.001) (Fig. 2e), annual mean minimum temperature (Y=0.0222X–47.377, R2=0.500, p<0.001) (Fig. 2f), annual mean maximum temperature (Y=0.0113X–12.533, R2=0.163, p<0.001) (Fig. 2g), and annual mean PDSI (Y=0.0136X–27.148, R2=0.069, p<0.01) (Fig. 2h).
Fig. 2
Gridded climatic and NDVI data for the Alatau Mountain: (a) Precipitation, mean temperature, mean maximum temperature and mean minimum temperature per month. Bars indicate precipitation (in mm), and curves with different colors represent mean temperature, mean minimum temperature and mean maximum temperature (in °C); (b) Monthly PDSI; (c) Monthly NDVI; (d) Annual precipitation during 1901–2015; (e–g) Annual mean temperature, annual mean minimum temperature and annual mean maximum temperature during 1901–2015; (h) Annual mean PDSI during 1901–2015; and (i) Annual mean NDVI during 1982–2006. Dashed lines represent trends in climate and NDVI data.
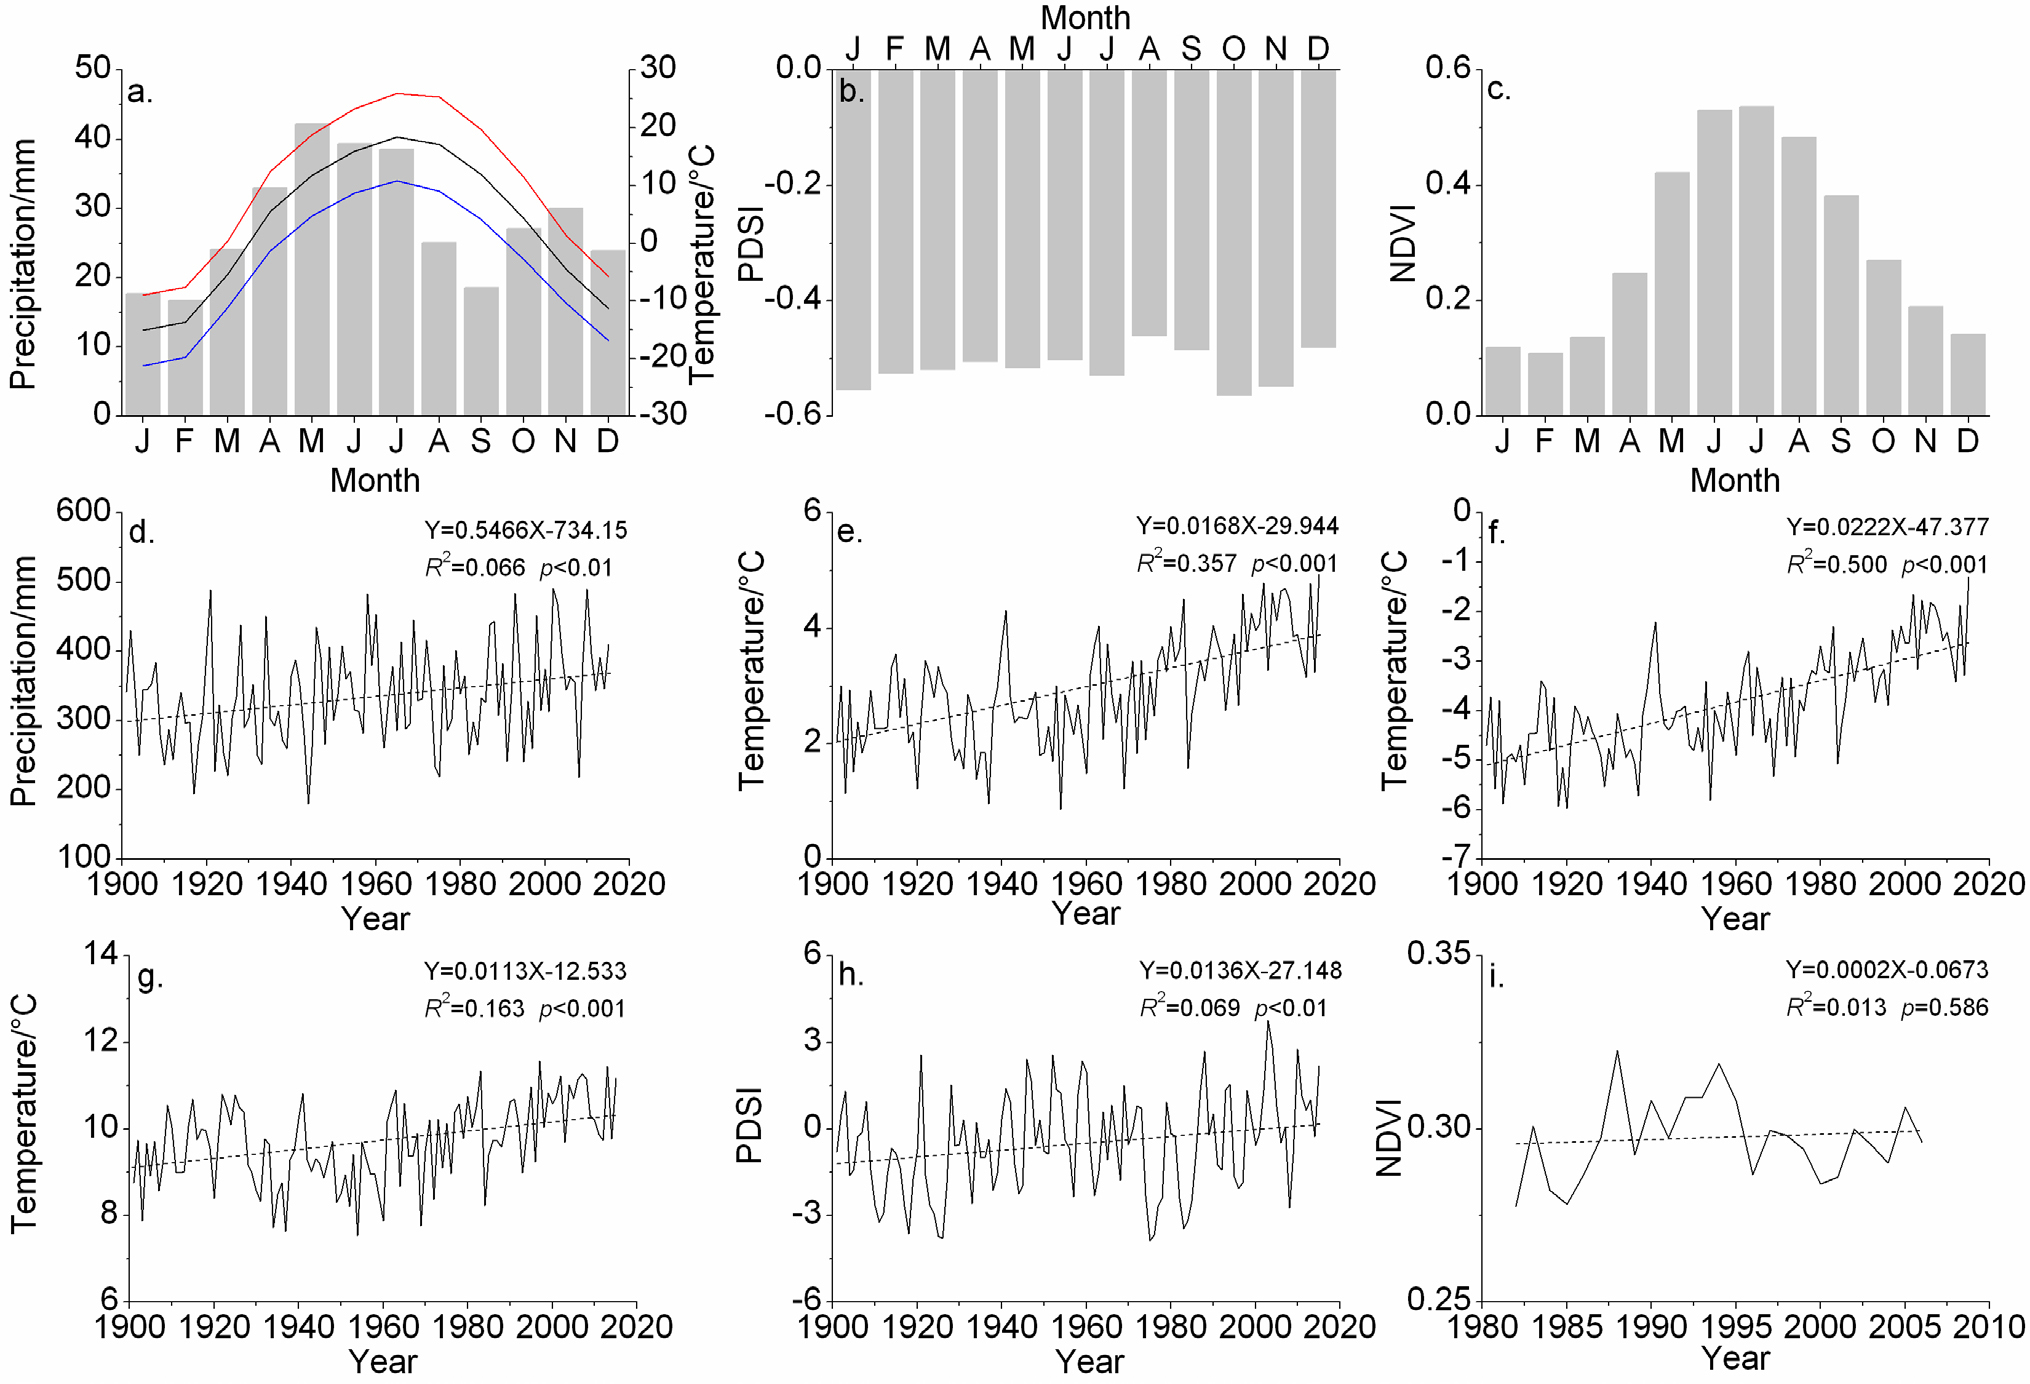
Fig. 2c indicates that the monthly NDVI values from January to March are relatively low (not exceeding 0.140) and without obvious fluctuations, but have an evident increase starting at April (0.248), and peaking in July (0.536), when the study area reaches the heathiest vegetation period of the year. Thereafter, the monthly NDVI values maintain a long-term decrease until December. An increasing trend of annual mean NDVI since 1982 is less significant (Y=0.0002X–0.0673, R2=0.013, p<0.05) (Fig. 2i). The variations in NDVI in the study area are in accordance with findings for Central Asia reported by Yin et al. (2017). The correlation coefficients between NDVI and annual precipitation and annual mean PDSI are 0.352 (p<0.1, n=25) and 0.440 (p<0.05, n=25) respectively, while the correlation coefficients between NDVI and annual mean temperature, annual mean minimum temperature and annual mean maximum temperature are not significant.
Statistical characteristics of chronologies and development of a regional chronology
After cross-dating quality control, two cores from the AMA site and four cores from the KBZ site were rejected because of the low correlations between the subseries and the master series. Ultimately, 50 cores from 28 spruces at the AMA site, 81 cores from 42 spruces at the KBZ site, and 45 cores from 23 spruces at the BSK site were used to develop ring-width chronologies. The oldest tree at the KBZ site was nearly 195 years old. In order to carry out a further analysis, we utilized the standard (STD) chronologies that contained the common variations of respective series of tree samples and retained a low-through high-frequency common variance. This variance is hypothesized as being dependent on climate (Cook, 1985). Three chronologies, the depths of their samples, EPS, and Rbar are demonstrated in Fig. 3. General statistics of these chronologies for a common period of analysis (from 1900 to 2010) are listed in Table 1. The reliable lengths of AMA, KBZ, and BSK chronologies were 107 (1910–2016), 167 (1850–2016), and 137 (1880–2016) years, respectively.
Fig. 3
Chronologies (thin lines) with their sample depth (dashed lines). Red and blue lines represent EPS and Rbar data: (a) AMA; (b) KBZ; (c) BSK; and (d) ARC.
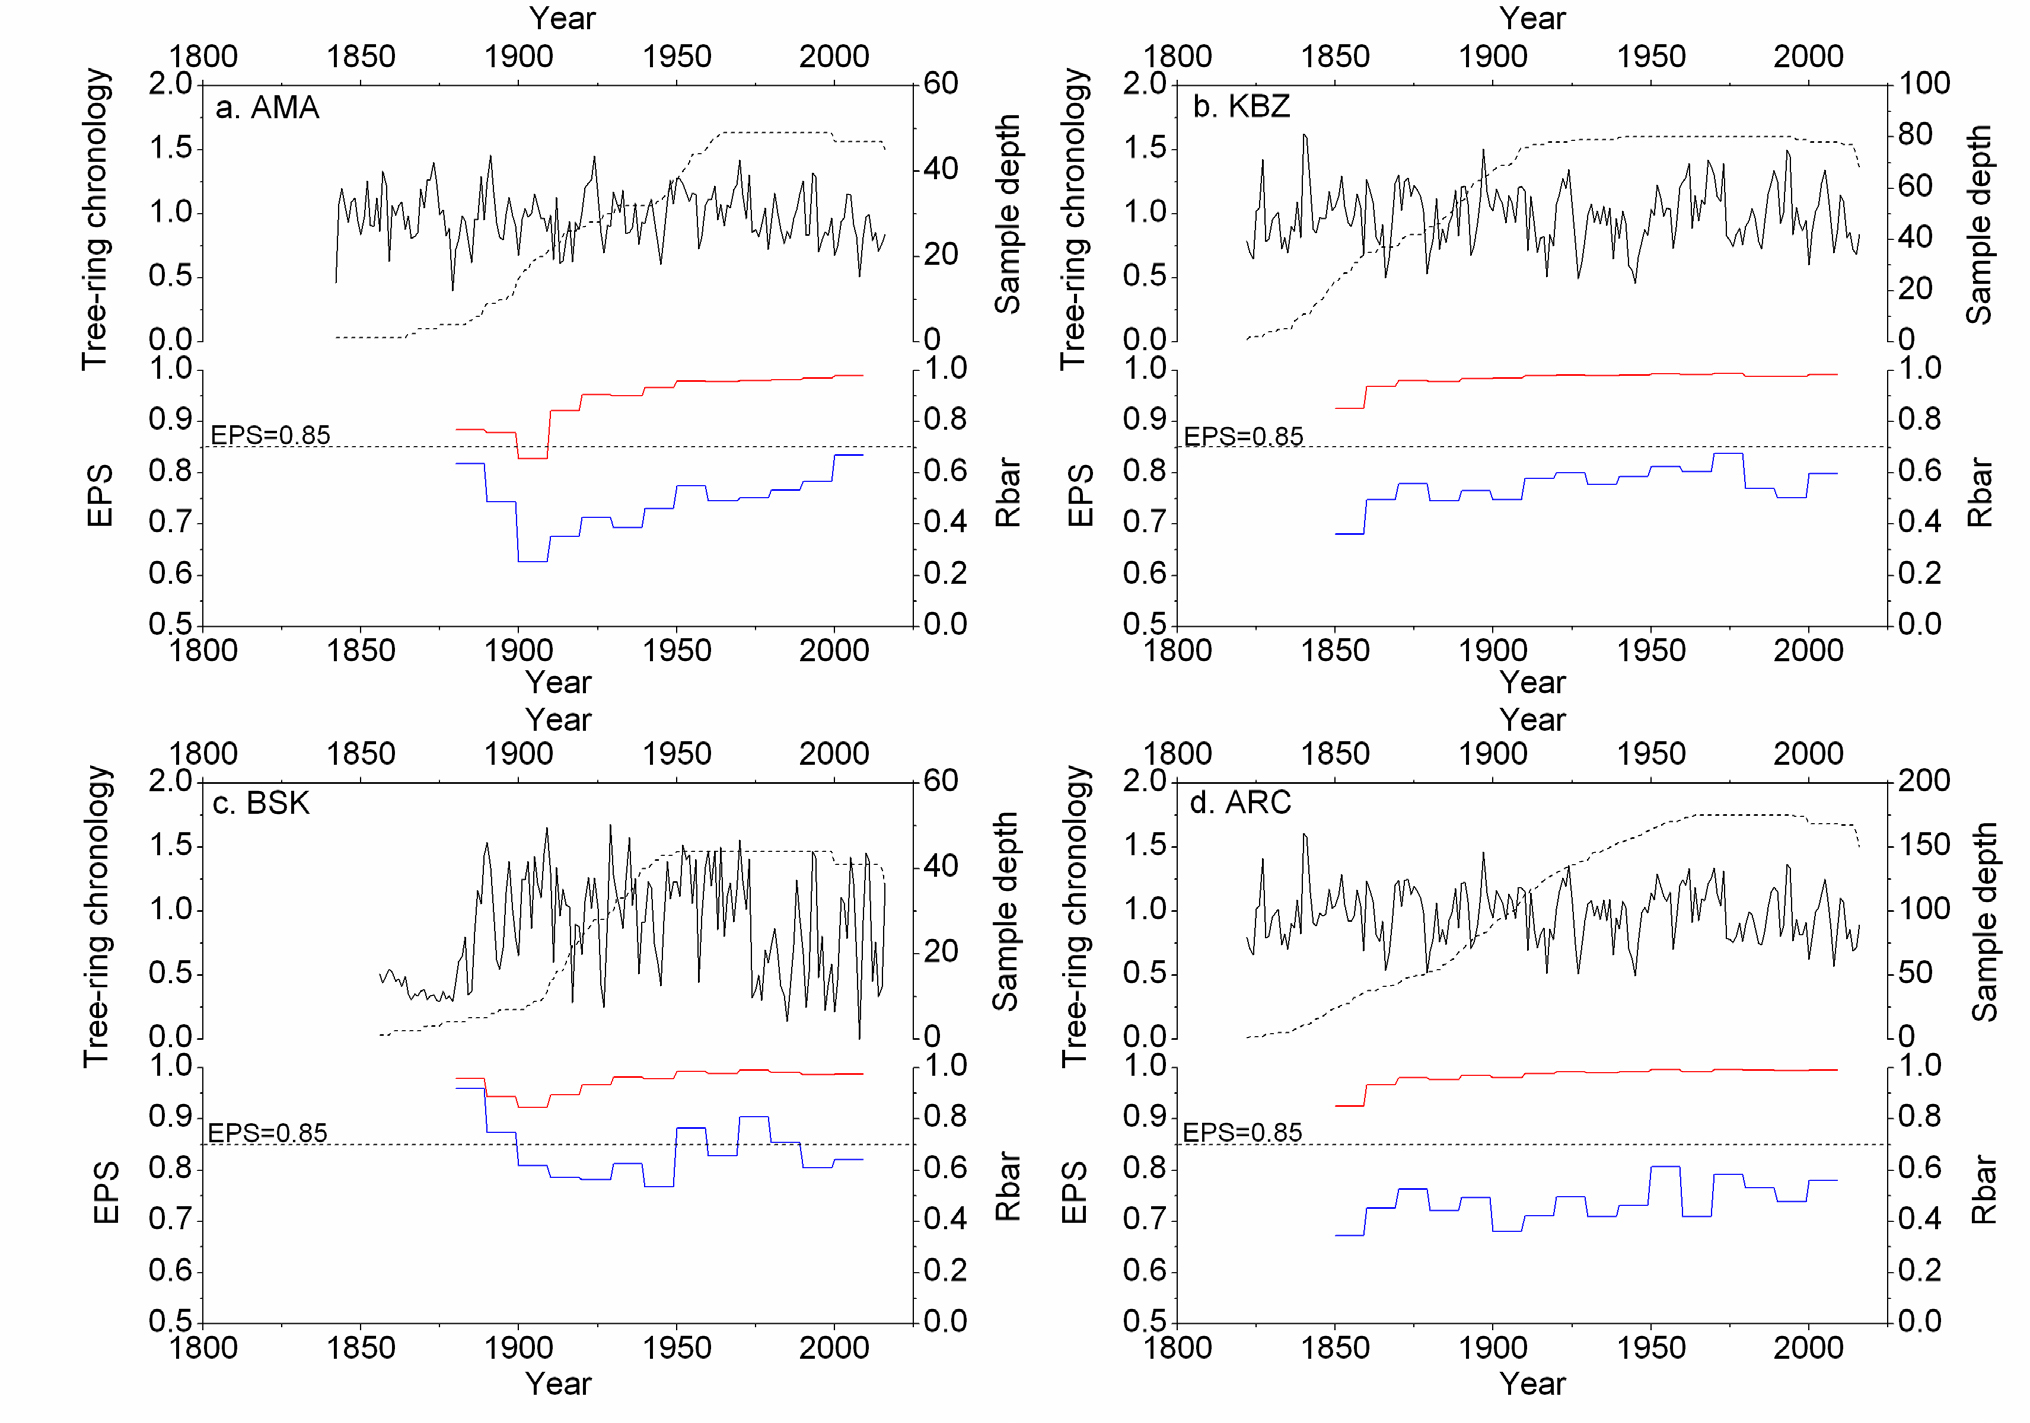
Table 1
Statistical characteristics of chronologies over the common period of 1900–2010
In addition to the reciprocal filters, we also used Pearson correlation coefficients to analyze the three sets of data, which included original unfiltered data, high-pass filtered data, and low-pass filtered data. As shown in Table 2, the correlations for the three chronologies employing the low-pass filter are relatively low, but the confidence levels for the correlation coefficients were all over 99.9% in the case of the original, high-frequency, and low-frequency domains over the common period of 1910–2016. In the common period, the years of 1924 (value: 1.452), 1970 (1.421), 1993 (1.319), 1973 (1.307), 1994 (1.292), 1950 (1.282), 1951 (1.275), 1923 (1.27), 1948 (1.264), and 1990 (1.257) are regarded as 10 highest-value years of AMA chronology, and the 10 lowest-value years appear in 2008 (0.511), 1945 (0.607), 1913 (0.614), 1917 (0.625), 1914 (0.632), 1911 (0.645), 2000 (0.675), 1927 (0.694), 1995 (0.705), and 2014 (0.708). The 10 highest-value years of KBZ chronology are 1993 (1.499), 1994 (1.448), 1968 (1.419), 1962 (1.395), 1973 (1.392), 1969 (1.369), 1924 (1.349), 2005 (1.341), 1989 (1.336), and 1970 (1.304), and the 10 lowest-value years appear in 1945 (0.457), 1927 (0.496), 1917 (0.509), 1944 (0.554), 1943 (0.596), 2000 (0.602), 1928 (0.626), 1938 (0.648), 1946 (0.66), and 2015 (0.686). The 10 highest-value years of BSK chronology are 1929 (1.678), 1935 (1.573), 1970 (1.556), 1952 (1.517), 1964 (1.502), 1960 (1.473), 1962 (1.473), 1993 (1.467), 2010 (1.456), and 1954 (1.44), and the 10 lowest-value years appear in 2008 (0.001), 1985 (0.137), 2000 (0.211), 1997 (0.226), 1927 (0.249), 1991 (0.249), 1917 (0.286), 1977 (0.304), 1974 (0.322), and 2014 (0.334). After comparing these extreme-value years, two highest-value years (1970 and 1993) and three lowest-value years (1917, 1927 and 2000) were observed in the three chronologies. The results indicated a good coherence of extreme-values among these chronologies. As a result, we combined all the ring-width data from the AMA, KBZ, and BSK sites in order to establish a regional chronology (ARC) that was longer and more replicated.
Table 2
Correlation coefficients for three chronologies over the common period of 1910–2016.
| Original (n=107) | High-frequency (n=95) | Low frequency (n=95) | |||||||
|---|---|---|---|---|---|---|---|---|---|
| AMA | KBZ | BSK | AMA | KBZ | BSK | AMA | KBZ | BSK | |
| AMA | 1 | 0.783* | 0.660* | 1 | 0.842* | 0.682* | 1 | 0.641* | 0.683* |
| KBZ | / | 1 | 0.624* | / | 1 | 0.759* | / | 1 | 0.388* |
| BSK | / | / | 1 | / | / | 1 | / | / | 1 |
The ARC chronology and the depths of the samples are shown in Fig. 3d, and the general descriptive statistics are listed in Table 1. Values of standard deviation (SD) and mean sensitivity (MS) for the chronologies obtained using the ARC chronology are slightly lower than those of the chronologies for single sampling sites because of the combination of samples. The first-order autocorrelation (AC1) assesses relationships between tree growth in a current year and previous growth. These values ranged from 0.396 to 0.577, and revealed that chronologies possessed low-frequency variance, which was affected by the lag effects of climate and tree physiology. The interseries correlations of the three chronologies obtained from sites of single sampling and the regional chronology all exceed 0.4. These values indicated a good coherence in the tree-growth. The ARC chronology with higher signal-to-noise ratios (SNR) and EPS demonstrated more climatic signals in the regional chronology. The reliable length of the ARC chronology was 167 (1850–2016) years based on the initial year of EPS>0.85.
Correlation analysis and physiological mechanisms
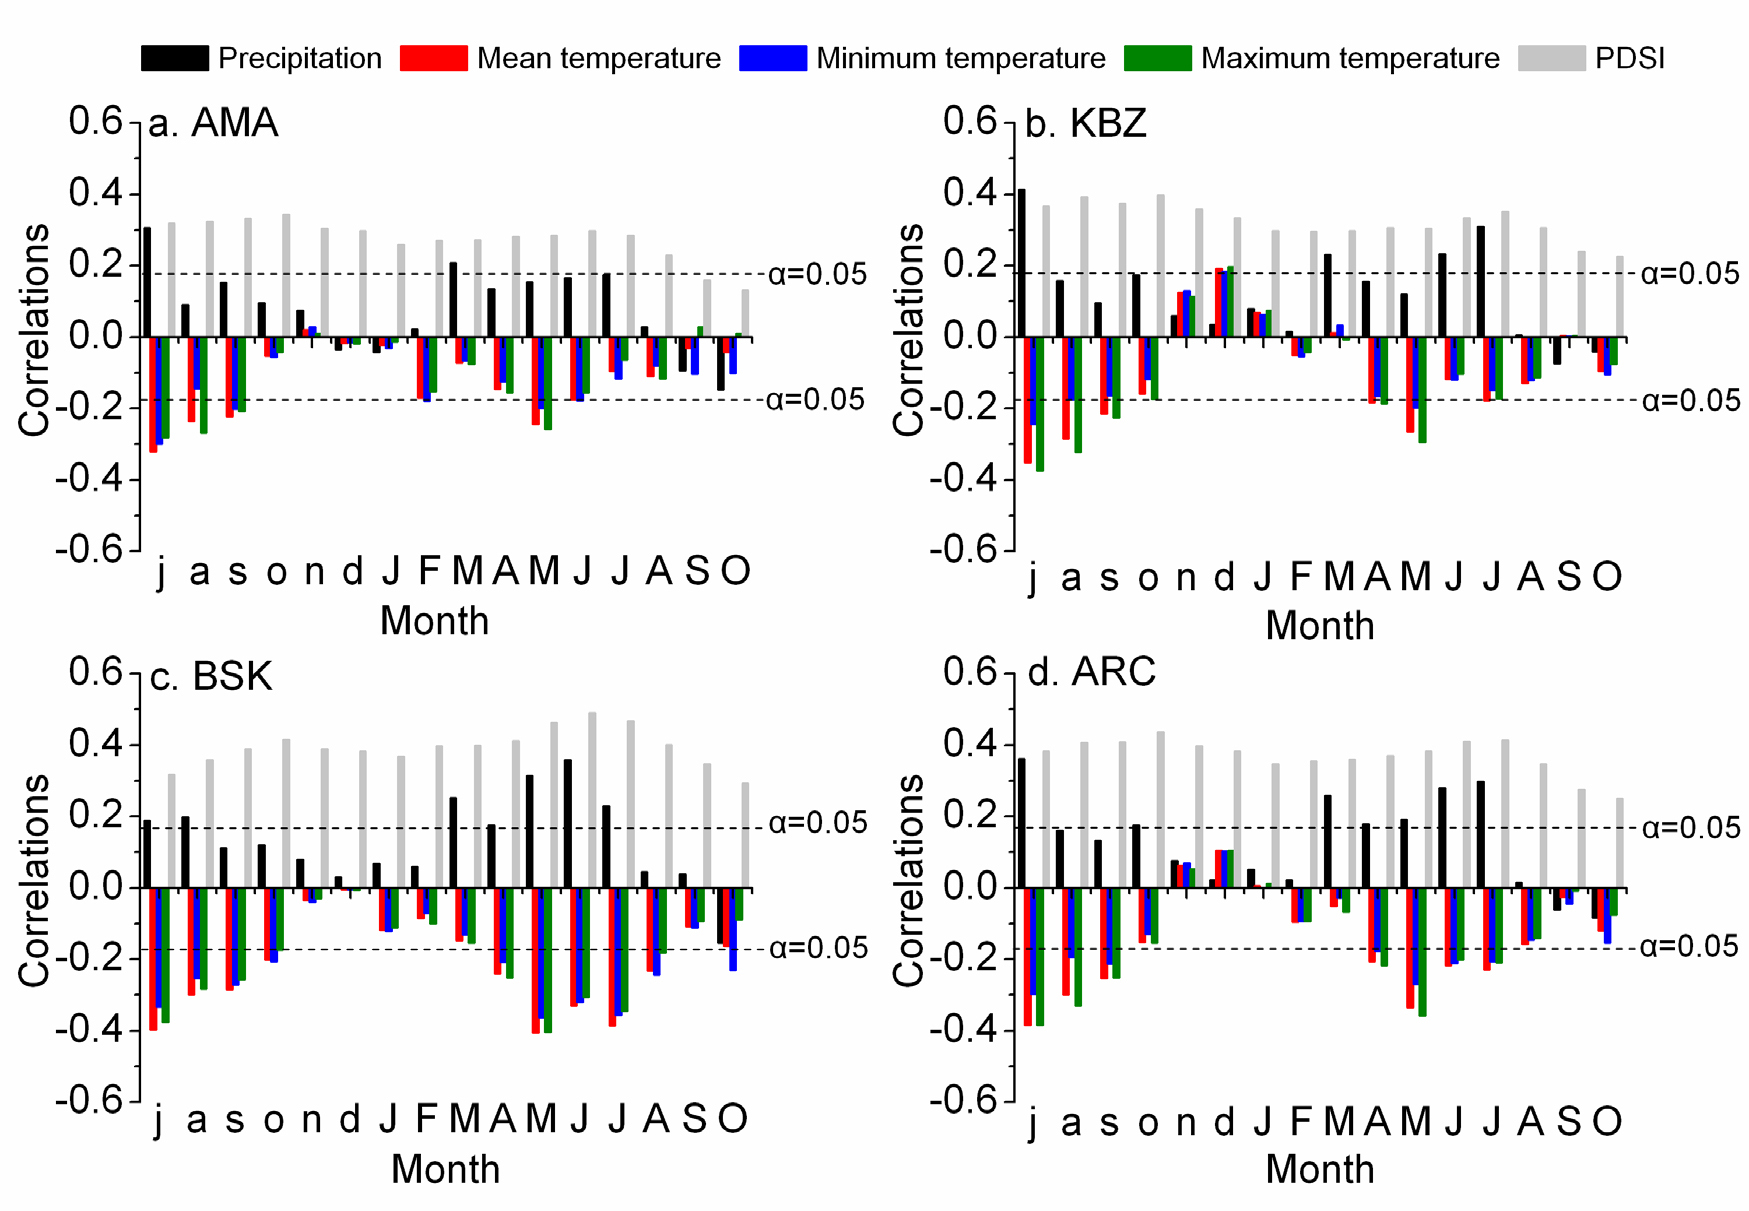
A strong biological lag effect was indicated by the high values of AC1 from 0.396 to 0.577 for the chronologies from single and composite sites (Table 1). Therefore, the climatic data per month (1901–2015) from July in the previous year to October in the current year were applied to assess the influence of climatic factors on radial growth of spruces in our study area. The results of the correlation analysis revealed that the relationship between the radial growth of spruces and precipitation was positive in general, and that significant correlations appeared in July of the previous year and from March to July of the current year (Fig. 4). There was a negative correlation between the tree-ring width of spruces and the temperature. Generally, these chronologies had very negative correlations with the temperature at the end of the growing season of the previous year and in the middle of the growing season of the current year. Furthermore, almost all of monthly the positive monthly correlation coefficients between chronologies and PDSI from July of the previous year to October of the current exceeded the 0.05 significance level. The above results demonstrated that moisture was the main climatic limitation on development of spruces’ tree rings in the study area. More precipitation at the end of the growing season of the previous year and the fast growing season of the current year may enhance the potential for accumulating water reserves in the soil, thus resulting in larger leaves (Liu et al., 2011), larger roots (Lebourgeois et al., 2004), and more nutrient in buds (Barbaroux et al., 2003). Wider tree rings may form in the current year if the above assumptions are correct. However, higher temperatures in these periods may increase evapotranspiration rates and enhance moisture stress leading to narrow rings. The tree growth-climate relationship of spruce trees established in this research is similar to that obtained in previous research in Central Asia (Zhang et al., 2015; Chen et al., 2017a). It is noteworthy that, in general, the influence of precipitation decreases with increased elevation, while the influence of temperature increases.
Fig. 4
Pearson correlations between tree-ring chronologies and climatic data (precipitation, mean temperature, mean minimum temperature, mean maximum temperature, and PDSI). Lowercase and capitals represent months of the previous and current years, respectively.
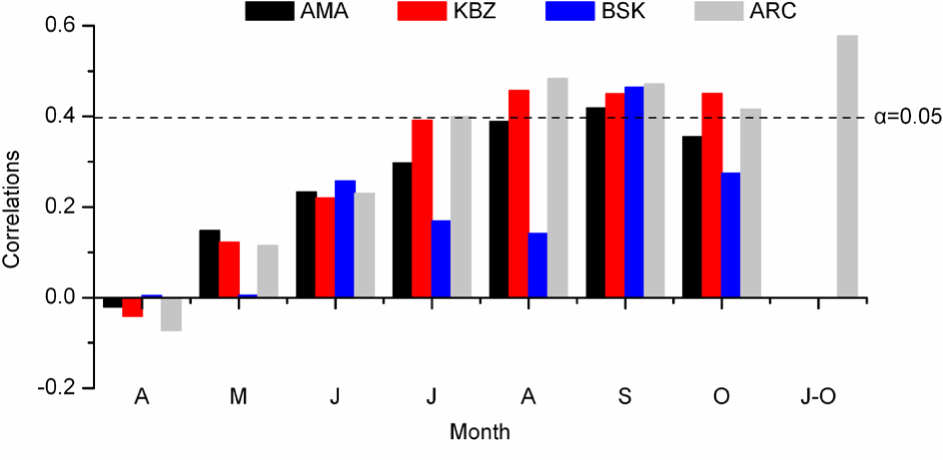
The optimal temperature for evergreen conifers to conduct photosynthesis ranges from 10°C to 25°C. If the temperature falls below –3°C to –5°C or raises above 35°C to 42°C, photosynthesis by conifers may cease (Wang, 2000). Fig. 2a reveals that the mean temperature ranged from 4.3°C to 18.3°C in April to October, and from –5.4°C to –4.5°C in March to November, respectively. Therefore, April–October was taken as the growing season for spruces in our study area. The monthly NDVI data (1982–2006) from April to October were utilized to assess the connection between vegetation coverage and tree growth (Fig. 5). Significant correlations were found from July to October based on a 0.05 significance level and peaked in September. By testing various combinations of months, we found that the maximal correlation coefficient was between the ARC chronology and the July–October NDVI (r=0.577, p<0.01, n=25). The relationship between ring width and vegetation coverage in the growing season for our study is similar to that found for other species in previous studies in northern China: the species include Sabina przewalskii Kom. and Sabina tibetica Kom. in the Tibetan Plateau (He and Shao, 2006; Shang et al., 2016), Pinus tabulaeformis Carr. in the Ortindag Sand Land (Liang et al., 2009), and Pinus sylvestris var. mongolica in the Greater Higgnan Mountains (He et al., 2005a).
NDVI reconstruction and stability tests
We computed the correlation coefficients between spruces’ growth in a radial pattern within our study area and various assemblages of months for the NDVI for the period 1982–2006, so that the most suitable season for reconstruction could be selected. To do this, we reconstructed the NDVI from July to October by using of the regional chronology. We also used a linear regression model to portray the relationship between the ARC chronology and the NDVI. The model is as follows:
(n=25, r=0.577, R2=33.3%, R2adj=30.4%, SE=0.017, F=11.489, and Durbin-Watson=1.818)
where NJuly.–Oct. is the July–October NDVI for the study area and ARC refers to the regional chronology. The model accounts for 33.3% of the NDVI variance during the calibration period 1982–2006 for the ARC chronology. Fig. 6a shows that the reconstructed NDVI tracks the observations well. The results of the Leave-one-out and Bootstrap tests (100 iterations in the recomputation process) revealed that values of r, R2, R2adj, standard error (SE), F-value (F), and Durbin-Watson (D/W) are nearly equal to those of the original regression model (1) (Table 3). Table 4 shows statistics from the split-sample calibration-verification tests for the reconstructed NDVI series. The values for reduction in error (RE) and coefficient of efficiency (CE) exceed or equal 0. Values of the product mean test (t) are positive, which indicating significant accuracy in the tree-ring estimates.
Fig. 6
(a) Comparison between the reconstructed (red line) and observed (blue line) July–October NDVI. (b) July–October NDVI reconstruction for the Alatau Mountains since 1850 (solid line). The thick line represents the 21-year moving average. Ten red and ten blue dots represent the lowest and highest value years, respectively.
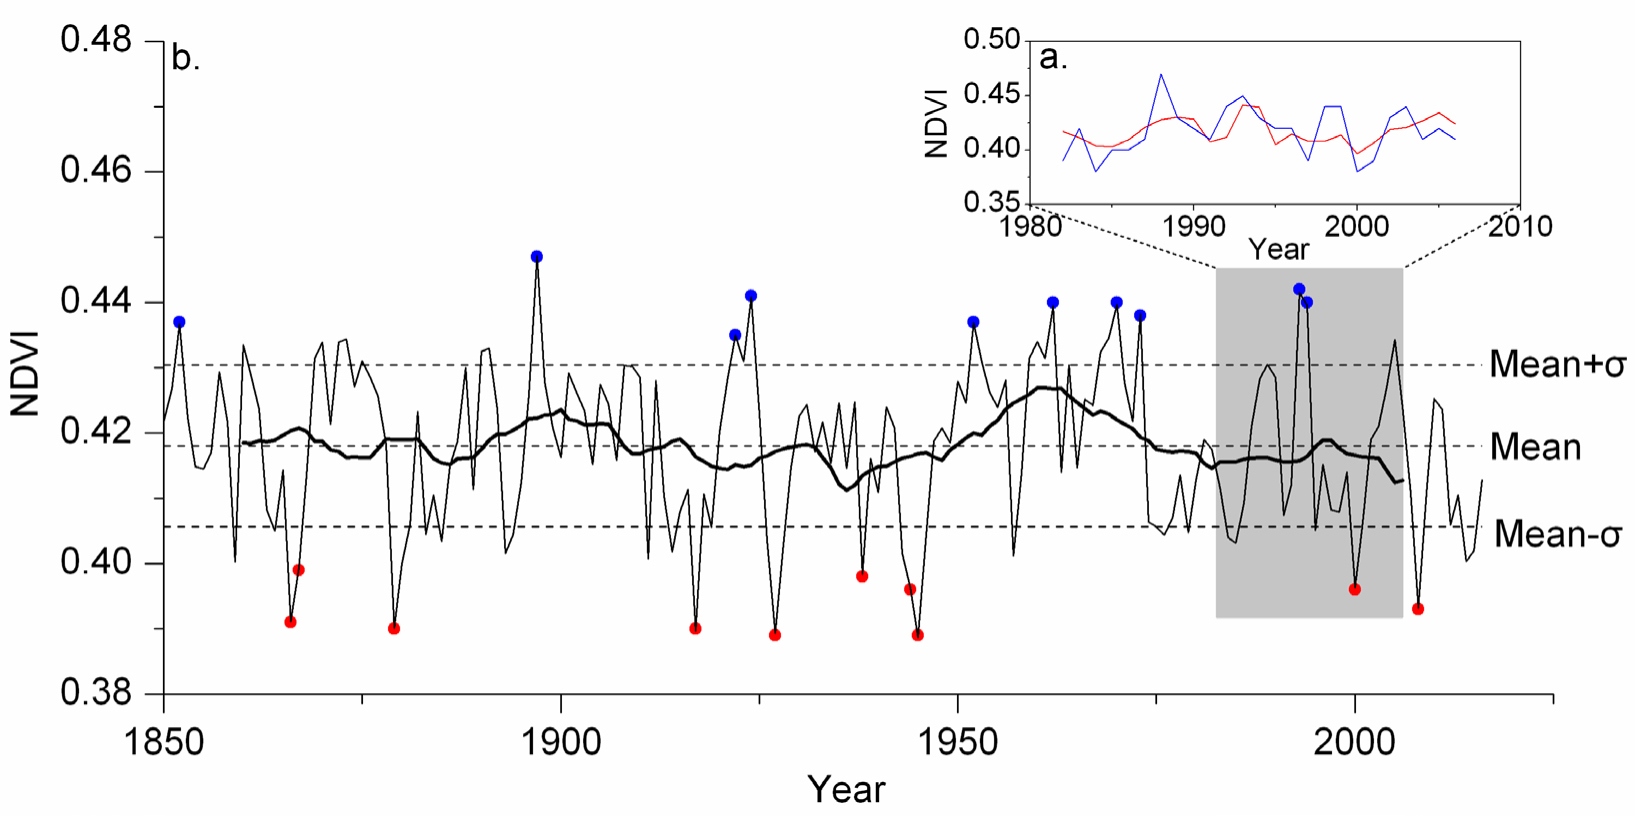
Table 3
Verification results from the Leave-one-out and Bootstrap tests for the NDVI reconstruction.
Table 4
Statistics of split-sample calibration-verification tests for the NDVI reconstruction.
The above results, which indicates significant skill in the tree-ring estimates, all demonstrate that the model (1) is stable and reliable. Therefore, we used model 1 to reconstruct the NDVI around the Alatau Mountains for July to October during the period of 1850–2016; an average value of 0.418 and a standard deviation of σ=0.012 (Fig. 6b) were obtained.
Characteristics of the reconstruction
The values for extreme years of the NDVI reconstruction are now listed. The 10 highest value years were 1897 (value: 0.447), 1993 (0.442), 1924 (0.441), 1970 (0.440), 1962 (0.440), 1994 (0.440), 1973 (0.438), 1952 (0.437), 1852 (0.437), and 1922 (0.435), and the 10 lowest-value years were 1945 (0.389), 1927 (0.389), 1917 (0.390), 1879 (0.390), 1866 (0.391), 2008 (0.393), 1944 (0.396), 2000 (0.396), 1938 (0.398), and 1867 (0.399). It can be seen that the difference between the highest-value (1897) and lowest-value (1945) years is 0.058.
The interdecadal variability was conspicuous. When a 21-year moving average was applied to the reconstruction (Fig. 6b), three periods of dense and sparse vegetation coverage could be differentiated. The periods of dense vegetation coverage (above the mean value of the reconstruction) were 1860–1870 (average value: 0.419), 1891–1907 (0.421), and 1950–1974 (0.423). The sparse vegetation coverage periods (below the mean) were 1871–1890 (0.417), 1908–1949 (0.416), and 1975–2006 (0.416).
. Discussion
The lowest-value years of 1917 and 1938 in the newly reconstructed NDVI series coincide with the historical documents that record a lack of rainfall in summer and autumn leading to a great drought occurring in the Ili region (Wen et al., 2006), a region near the present study area. In particular, a period of extreme drought occurred during the 1920s in a wide area of northern China, which is mentioned in historical records (Shi et al., 1991). Hydro-climatic reconstructions based on tree rings (Liang et al., 2006; Gou et al., 2007) are also corroborated by the third lowest-value year (1917) in the NDVI reconstruction. This shows that our reconstructed NDVI series can capture the signals of drought disasters for the Alatau Mountains.
Spatial correlation was carried out to evaluate the regional significance of the ring-width based NDVI reconstruction. The NDVI series has a correlations (>0.3) with the gridded PDSI data for July–October for 1901–2015 in a large area between approximately 40°–48°N and 68°–82°E. The highest correlations (>0.4) appear in southern Kazakhstan (Fig. 7). The newly reconstructed NDVI series for the Alatau Mountains (NAM) were compared with four climatic reconstructions based on tree-ring data: (1) August–January standardized precipitation evapotranspiration index for the southeastern Kazakhstan (SKZ, 1785–2014; Chen et al., 2017b); (2) July–August precipitation for Nilka in the Ili region (PNL, 1671–2006; Zhang et al., 2010); (3) July–June precipitation for the Issyk Lake (PIL, 1756–2012; Zhang et al., 2015); and (4) August–April precipitation for the Aksu region (PAK, 1396–2005; Zhang et al., 2009). The locations of these reconstructions are indicated in Fig. 7. There is a good coherence between the standardized NDVI reconstruction and the climatic reconstructions in the original, high-frequency, and low-frequency domains (Fig. 8). Table 5 shows that, although the coherence between the NAM and the PAK reconstructions are relatively weak, all of the correlation coefficients between the RIL and the other climatic reconstructions in the original, high-frequency and low-frequency domains exceed the 0.05 significance level in the common period of 1850–2005. The correlations between the NAM and the other climatic reconstructions weakened with the increasing north to south spatial distance. The best correlation relationship is between the NAM and the SKZ reconstructions and is a result of their proximity. The weakest correlation is between the NAM and the PAK reconstructions, because these areas are the furthest apart. Fig. 8a shows that the NDVI reconstruction and the climatic reconstructions from previous studies corresponded well in the common period. Furthermore, most of the high and low values in these reconstructions appeared in similar years in the high-frequency domain (Fig. 8b). In addition, the variation modes and long-term trends of these reconstructions were roughly synchronous in the low-frequency domain (Fig. 8c).
Fig. 7
Spatial correlation between the reconstructed NDVI series ana gridded July–October PDSI dataset. The solid circle represents the July–October NDVI reconstruction, and the dashed circles represent the four climatic reconstructions (SKZ, PNL, PIL, and PAK) used in the comparison analyses.
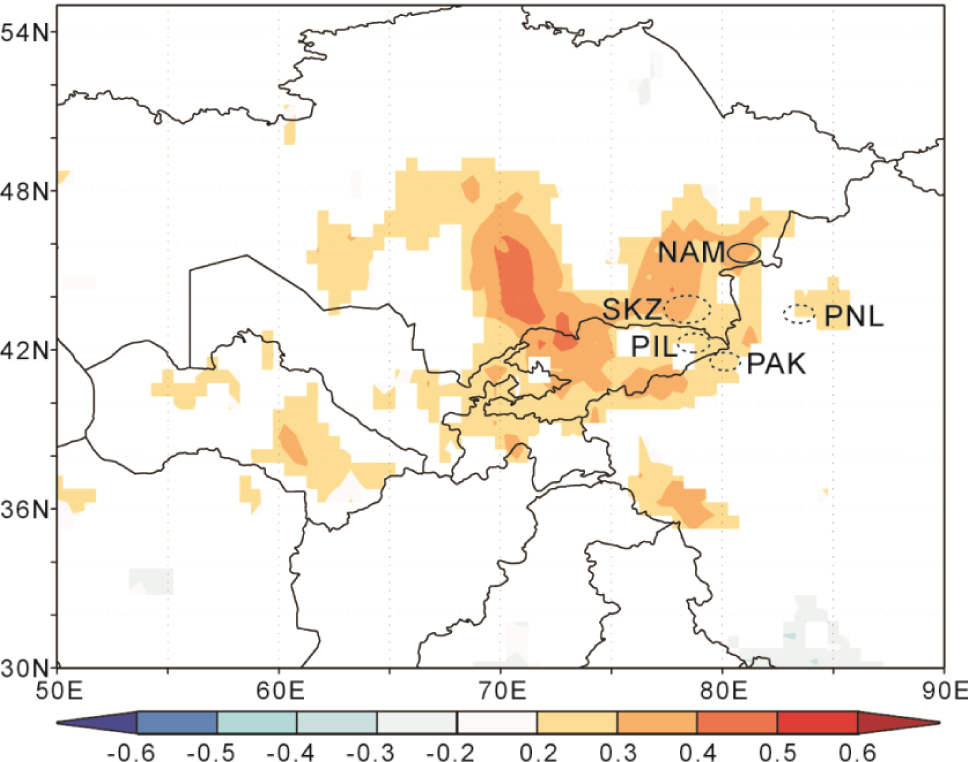
Fig. 8
Graphical comparison of the NDVI reconstruction for the Alatau Mountains (black line) and four climatic reconstructions for Central Asia (SKZ: red line; PNL: blue line; PIL: gray line; PAK: green line).
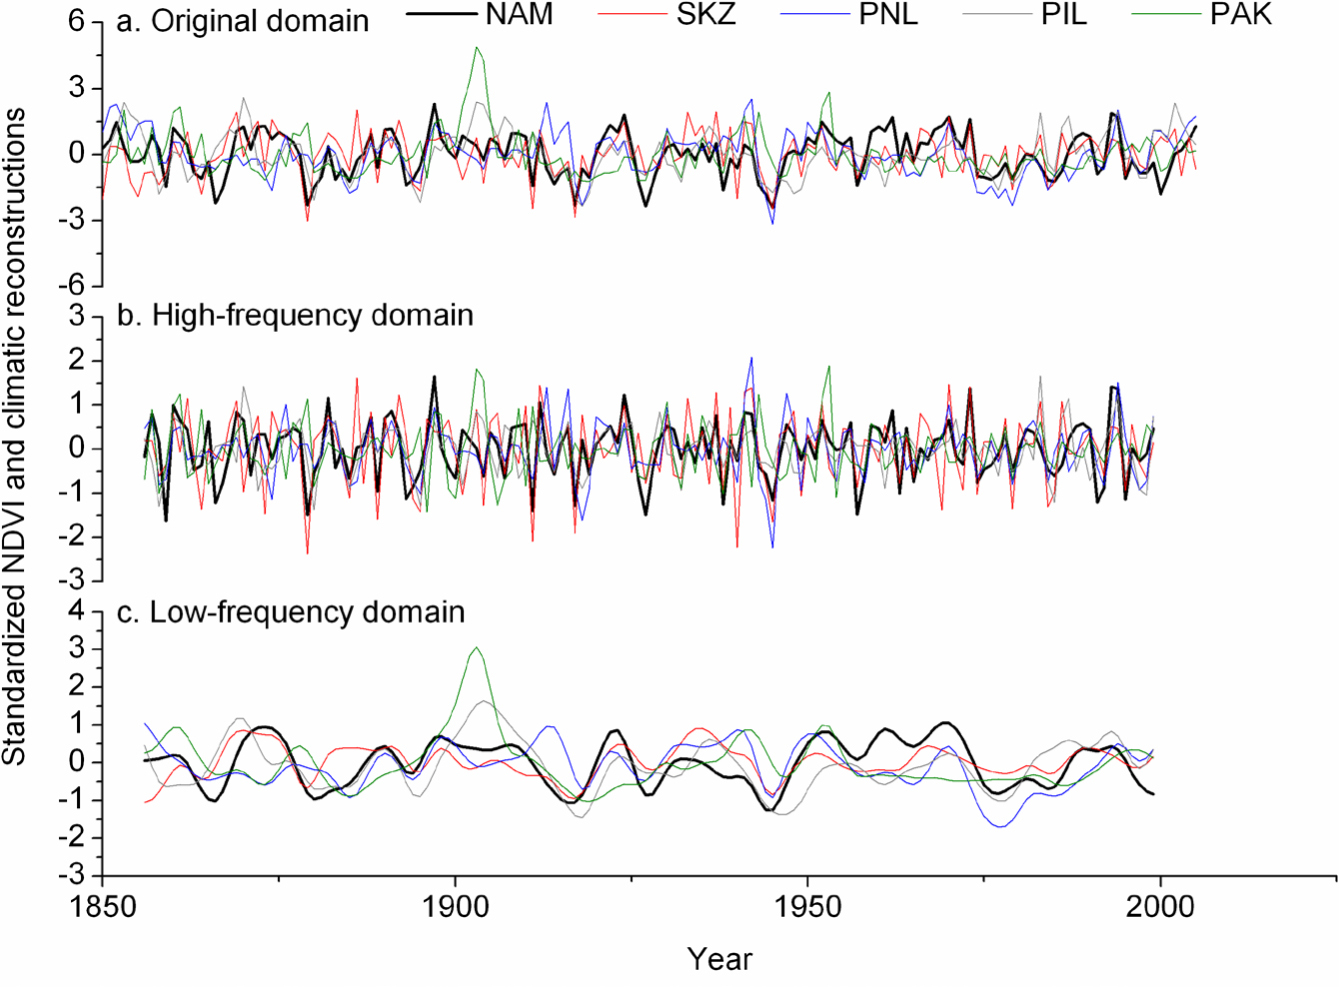
Table 5
Correlation coefficients between the NDVI and climatic reconstructions over the common period of 1850–2005.
| Original(n = 156) | High-frequency (n = 144) | Low-frequency (n = 144) | ||||||||||
|---|---|---|---|---|---|---|---|---|---|---|---|---|
| SKZ | PNL | PIL | PAK | SKZ | PNL | PIL | PAK | SKZ | PNL | PIL | PAK | |
| NAM | 0.507 | 0.460** | 0.371** | 0.197* | 0.580** | 0.508** | 0.332** | 0.189* | 0.498** | 0.326** | 0.452** | 0.190* |
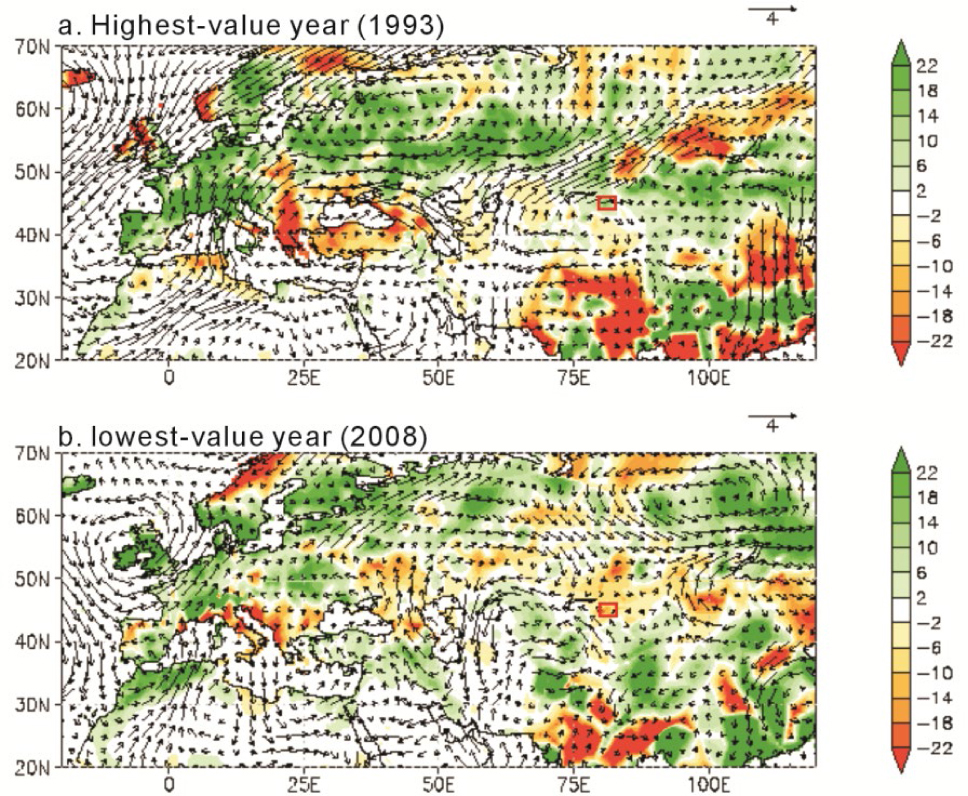
To further analyze the large-scale climate anomalies associated with the newly developed NDVI series, two typical years (1993 and 2008) were investigated. As shown in Fig. 9a, above normal rainfall was evident around the Alatau Mountains, which accounts for the highest NDVI in 1993. An anomalous westerly wind was pronounced over Eurasia between 40°–60°N, which brought air rich in water vapor from the Atlantic Ocean, and the Mediterranean and Caspian Seas. As a result, a rainy belt was observed from Western Europe to the Alatau Mountains. In contrast, below normal rainfall was evident around the Alatau Mountains in 2008 (Fig. 9b), which is well represented by the associated lowest NDVI since the 1950s. Unlike the effects of the remarkable zonal water vapor transport in 1993, precipitation in the Alatau Mountains is normally controlled by dry air from high latitudes (He et al., 2005b).
. Conclusions
A 167-year, regional, ring-width chronology was developed from 93 living and healthy spruces on the northern slopes of the Alatau Mountains. The results of correlation analyses revealed that more precipitation and lower temperatures in the growth season of the previous and current years might help to form a wider tree ring in the target coniferous species. Because of the coherence between ring width and vegetation coverage under the same water limitations, a July–October NDVI reconstruction for the Alatau Mountains was developed using the regional chronology. The reconstruction matched the observed data well, and its lowest-value years precisely captured drought events mentioned in historical documents. A spatial analysis and correlations with other tree-ring based climatic reconstructions indicated that the newly reconstructed NDVI series was affected by large-scale climatic oscillations.
The preliminary study in this paper provides new knowledge about the variations in vegetation coverage for the Alatau Mountains and will be helpful in improving the tree-ring dataset for Central Asia. However, this study is limited because it is local research based on only three sampling areas. Thus, further studies should be carried out at a larger spatial scale to verify the results presented in this paper.