
The Explained Variance and Discriminant Accuracy of APACHE IVa Severity Scoring in Specific Subgroups of ICU Patients
Robert A Raschke MD1,2
Richard D Gerkin MD1
Kenneth S Ramos MD1,2
Michael Fallon MD2
Steven C Curry MD1,2
Division of Clinical Data Analytics and Decision Support and the Department of Medicine
University of Arizona College of Medicine-Phoenix.
Phoenix, AZ USA
(Click here for accompanying editorial)
Abstract
Objective: The Acute Physiology and Chronic Health Evaluation (APACHE) is a severity scoring system used to predict healthcare outcomes and make inferences regarding quality of care. APACHE was designed and validated for use in general ICU populations, but its performance in specific subgroups of ICU patients is unproven. Quantitative performance referents for severity scoring systems like APACHE have not been established. This study compares the performance of APACHE IVa in several common subgroups of ICU patients to the performance of APACHE IVa and a referent scoring system applied in a general ICU population.
Design: Observational cohort.
Setting: Seventeen ICUs.
Patients: Adult patients meeting criteria for APACHE IVa scoring.
Intervention: We designed a “two-variable severity score” (2VSS) to provide “weak” reference values for explained variance (R2) and discriminant accuracy to use in our comparisons. R2 and AUROC were calculated for 2VSS and APACHE IVa outcome predictions in the overall cohort, and for APACHE IVa in subgroups with sepsis, acute myocardial infarction, coronary artery bypass grafting, stroke, gastrointestinal bleeding, trauma, or requiring mechanical ventilation. APACHE IVa subgroup performance was compared to APACHE VIa and 2VSS performance in the overall cohort.
Measurements and Main Results: APACHE IVa out-performed 2VSS in our cohort of 66,821 ICU patients (R2: 0.16 vs 0.09; AUROC: 0.89 vs 0.77). However, APACHE IVa performance was significantly diminished in subgroups with sepsis, coronary artery bypass grafting, gastrointestinal bleeding or requiring mechanical ventilation compared to its performance in the overall cohort analysis. APACHE IVa performance in patients undergoing CABG (R2: 0.03, AUROC: 0.74) failed to surpass 2VSS performance referents.
Conclusions: The performance of severity scoring systems like APACHE might be insufficient to provide valid inferences regarding quality of care in select patient subgroups. Our analysis of 2VSS provides quantitative referents that could be useful in defining acceptable performance.
Introduction
The Acute Physiology and Chronic Health Evaluation (APACHE) has undergone iterative refinement over the past 40 years and is currently the most widely used severity scoring system in the United States (1-3). APACHE provides a score based on the patient’s age, vital signs and laboratory values on the first ICU day and chronic health conditions. This score is used in combination with the patient’s admission diagnosis and other information to calculate predicted hospital and ICU mortality and length-of-stay (LOS), and days of mechanical ventilation. Ratios derived from these calculations, such as the standardized mortality ratio (observed/predicted mortality) and observed/predicted LOS are used by the Centers for Medicare and Medicaid Services, managed care plans, health insurance plans and consumers to benchmark and compare the quality of care provided by physicians, hospitals and healthcare systems. APACHE was updated and revalidated using large clinical databases in 2001-2003, yielding APACHE version IV (1,2) and in 2006-2008, yielding APACHE version IVa (4).
The use of severity scoring systems such as APACHE to make inferences regarding quality of care is susceptible to bias if the regression models employed do not adequately characterize severity of illness. This is a particular liability when applied to a different population of patients than those for whom the system was originally developed and validated (3,5). This is likely because the optimal set of predictor variables in a severity scoring system is specific to the patient population of interest. The optimal predictor variables for patients with pneumococcal pneumonia might include factors such as prior pneumococcal exposure history, the specific competency of the patient’s immune response against pneumococcus, ciliary function of the lower respiratory tract, current cardiopulmonary capacity, and bacterial virulence factors. The optimal set of specific predictor variables in patients with stroke or trauma are likely quite different. APACHE uses a set of predictor variables empirically found to be predictive in heterogeneous populations of general ICU patients, but these may not necessarily provide acceptable severity-adjustment for specific subpopulations of ICU patients.
The performance of severity scoring systems is typically assessed using statistical tests that include Pearson’s R-squared (R2) - which describes the “explained variance” of the system for prediction of continuous outcomes like LOS, and the area under the receiver operating curve (AUROC) - which describes the “discriminant accuracy” of the system for prediction of discrete outcomes such as mortality. APACHE IV has yielded an R2 of 0.21 for LOS prediction, and AUROC of 0.88 for mortality prediction in a cohort of 131,000 general ICU patients (1,2). However, R2 as low as 0.03 and AUROC as low as 0.67 have been reported for APACHE IV outcome predictions in different reference populations, such as those with surgical sepsis (6,7). The performance of the current version, APACHE IVa, is unpublished for many important subgroups of ICU patients.
It has been proposed that AUROC results in the range of 0.70-0.80 indicate “good” discriminant accuracy, and values in the range of 0.80-0.90 are taken to be “very good” or “excellent” (3,8,9), but these subjective ratings have no clear mathematical justification. AUROCs as high as 0.80 have been achieved by scoring systems that utilized only 1-3 predictor variables (10-14). It does not seem plausible that so few variables could acceptably characterize the complex nature of severity-of-illness. R2 and AUROC do not have established and well-justified performance thresholds and are therefore of limited value in determining whether a severity scoring system provides valid inferences regarding quality of care.
Therefore, we first set out to quantify performance thresholds for R2 and AUROC by designing a severity score which only incorporated two predictor variables, to intentionally limit the explained variance and discriminant accuracy of the system. This method was previously recommended by the RAND Corporation for assessing severity scoring systems like APACHE because it provides a population-specific referent of unacceptable performance to which the system of interest can be compared (10). We subsequently compared the statistical performance of our two-variable severity score (2VSS) to that of APACHE IVa (which incorporates 142 variables) in a large cohort of ICU patients, and in several common subgroups. Our hypothesis was that APACHE IVa would have diminished and possibly unacceptable explained variance and discriminant accuracy in certain specific subgroups.
Methods
Our Institutional Review Board provided exemption from human research requiring informed consent. Consecutive patients >16 years of age admitted to any ICU in 17 Banner Health acute care hospitals between January 1, 2015 and September 31, 2017 were eligible for inclusion in our cohort of ICU patients. The hospitals ranged from a 44-bed critical access facility to a 708-bed urban teaching hospital in the southwestern United States. The ICUs included general medical-surgical units, as well as specialty-specific cardiovascular, coronary, neurological, transplant and surgical-trauma ICUs. Only the first admission for each patient was included. Patients were excluded if they were admitted as a transfer from another hospital ICU, their ICU LOS was < four hours, or records were missing data required to calculate predicted outcomes using APACHE IVa methodology.
Data used to calculate the acute physiology score (APS) were collected by direct electronic interface between the Cerner Millennium® electronic medical record and Philips Healthcare Analytics. The worst physiological values occurring during the first ICU day were extracted electronically for Acute Physiology Score (APS) calculation using commercial software provided by the Phillips eICU® program. Chronic health conditions required for APACHE score calculations and admission information needed for calculation of expected mortality (including admission diagnosis) were entered by nurses who staff our critical care telemedicine service. Observed and predicted ICU and hospital LOS, ventilator days, and ICU and hospital mortality were provided by Philips Healthcare using proprietary APACHE IVa methodology (Cerner Corp. Kansas City, MO).
The 2VSS incorporated only the patient’s age and requirement for mechanical ventilation (yes/no) and used multiple linear regression for prediction of LOS and ventilator days, and multiple logistic regression for prediction of mortality. In contrast, APACHE IVa incorporates 142 variables (27 in the APACHE score, plus 115 admission diagnostic categories) and uses disease-specific regression models serially revised and revalidated in large patient populations (1-3). The two variables incorporated in our 2VSS have been shown to contribute only 10% of the discriminant accuracy of APACHE IV for predicting ICU mortality (1). Therefore, we posited that the best observed AUROC and R2 achieved by 2VSS in our cohort analysis could reasonably determine referents of unacceptable performance for comparison with APACHE IVa performance in the analysis of our cohort and in specific subgroups.
Cohort analysis: We used APACHE IVa and the 2VSS to predict five outcomes in our cohort of ICU patients: ICU and hospital LOS, ventilator days, and ICU and hospital mortality. R2 was calculated for LOS and ventilator days, and AUROC for mortality outcomes. APACHE IVa results were compared to those of 2VSS. Differences between AUROC results were determined to be statistically significant by comparison of 95% confidence intervals calculated using a nonparametric method based on the Mann-Whitney U-statistic. The highest R2 and AUROC achieved by 2VSS in the ICU cohort were used to establish referents of unacceptable performance in all subsequent comparisons.
Subgroup analyses: R2 and AUROC were then calculated for APACHE IVa outcome prediction in seven subgroups of ICU patients, including those with admission diagnoses of sepsis, acute myocardial infarction, coronary artery bypass grafting (CABG - with or without other associated cardiac procedures such as valve replacement), stroke, gastrointestinal bleeding, trauma, or requirement of mechanical ventilation. The performance of APACHE IVa in each subgroup was compared to the performance of APACHE IVa and 2VSS in the cohort analysis.
Results
71,094 patients were admitted to study ICUs during the study period. Of these, 2,545 were excluded due to ICU LOS < four hours, 1,379 due to missing data required to calculate APACHE IVa predicted outcomes, and 349 due to transfer from another ICU. The remaining 66,821 patients were included in the analysis. The mean age was 65.7 years (SD 16.3). The most common ICU admission diagnoses were: infections 21.0% (16.8 % due to sepsis); cardiac 14.8% (4.6% due to acute myocardial infarction); cardiothoracic surgery 8.8% (3.8% due to CABG); neurological 8.7% (4.1% due to stroke); pulmonary 7.3%; vascular 5.8%; trauma 5.7%; and gastrointestinal 4.8% (4.0% due to GI bleeds), metabolic/endocrine 4.6%; toxicological 4.5%; cancer 3.8%; and general surgery 3.2%.
Table 1 compares the explained variance (R2) and discriminant accuracy (AUROC) of APACHE IVa and 2VSS outcome predictions in the ICU cohort.
Table 1. Comparison of APACHE IVa to a 2-variable severity score (2VSS) for outcome prediction in a cohort of 66,821 ICU patients.
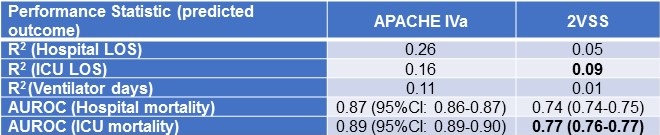
Bold font represents the best performance achieved by the 2VSS by R2 and AUROC.
The highest R2 achieved by 2VSS was for ICU LOS (R2 = 0.09) and the highest AUROC for ICU mortality (AUROC = 0.77).
Subgroup results for APACHE IVa are shown in Table 2.
Table 2. Performance of APACHE IVa outcome prediction in selected subgroups in descending order of discriminant accuracy for ICU mortality. (Click here for enlarged Table 2)
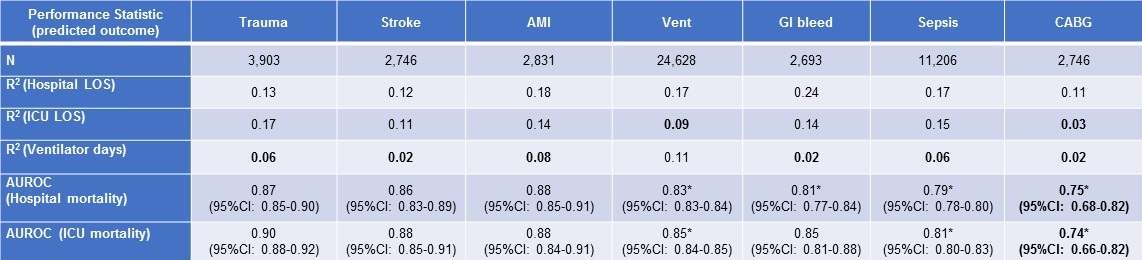
Bold font indicates performance statistically no better than the best performance of 2VSS in the ICU cohort.
*Indicates statistically significantly-reduced performance compared to APACHE IVa in the inclusive ICU cohort (non-overlapping 95% confidence intervals).
Abbreviations: Vent = patients requiring mechanical ventilation; AMI = acute myocardial infarction; GI = gastrointestinal, CABG = coronary artery bypass grafting.
AUROC for APACHE IVa mortality predictions (hospital and ICU mortality) ranged from 0.74-0.90 and were statistically-significantly diminished in subgroups of patients with sepsis, GI bleeds, CABG or mechanical ventilation compared to APACHE IVa performance in the cohort analysis. R2 for APACHE IVa prediction of ventilator days was less than 0.09 (the performance referent established by 2VSS) in subgroups of patients with trauma, stroke, acute myocardial infarction, sepsis, GI bleeds and CABG. APACHE IVa predictions of ICU LOS, ventilator days, ICU mortality and hospital mortality for patients who underwent CABG yielded: R2 0.03, R2 0.02, AUROC 0.74 and AUROC 0.75, respectively – all failing to exceed the performance referents established by our cohort analysis by 2VSS.
Discussion
Our study employed empirically-derived, quantitative referents of unacceptable severity-adjustment performance: R2 < 0.09 and AUROC < 0.77. APACHE IVa significantly surpassed these referents in all comparisons made in the analysis of our inclusive cohort of ICU patients. R2 values for APACHE IVa indicate that it explains about 15- 25% of the variance in hospital and ICU LOS and about 10% of the variance in ventilator days and that it provides discriminant accuracy >0.85 for mortality prediction in this general ICU population. These findings are consistent with previous reports of APACHE IV performance in other large cohorts of ICU patients (1,2,4,15).
However, APACHE IVa performance was significantly diminished in specific subgroups of ICU patients – notably those with sepsis, GI bleeding, requiring mechanical ventilation and undergoing CABG. Values for R2 for the prediction of ventilator days in several subgroups were as low as 0.02 – explaining only 2% of the observed variance in ventilator days. Hospital mortality prediction for patients with sepsis yielded an AUROC 0.79 – barely superior to the referent AUROC of 0.77 achieved by 2VSS, and arguably only because of our large sample size. APACHE IVa prediction of ICU LOS, vent days, ICU mortality and hospital mortality in patients undergoing CABG all failed to exceed the performance referents set by 2VSS.
Few published studies are available to provide meaningful comparisons with the subgroup results from our study. Most describe smaller patient populations outside the U.S. (6,16,17,18). Previous use of APACHE IV to predict outcomes in patients with sepsis reported AUROCs ranging from 0.67 to 0.94 (6,16,19). APACHE IV uses a specific logistic modeling technique and has been specifically validated for CABG patients, but CABG-specific R2 and AUROC were not reported (20). No previous study compared APACHE IVa performance in subgroups with that in a general population of ICU patients using quantitative performance referents.
Our findings are important because although general severity scoring systems like APACHE IVa are not optimized for use in specific ICU patient subgroups, they are often used in this manner to make implications regarding quality of care (6,16-19,21-26). In addition to the subgroups discussed above, previous studies have employed general severity scoring system to predict outcomes in subgroups of patients with acute coronary syndrome (17), acute kidney failure (21), malignancy (22), organ transplantation (23), ECMO (24), cardiac surgery (25) and survivors of cardiac arrest (4,26). Many of these studies report AUROCs inferior to our 2VSS referent (6,19,20,23-26). Diagnosis-specific scoring systems, such as the Cardiac Surgery Score (CASUS), generally have provided superior discriminant accuracy in the specific subsets of patients they were designed to serve (27-29).
We believe that general severity scoring systems like APACHE IVa are at an inherent disadvantage in the prediction of outcomes in specific subgroups of ICU patients, because they employ general predictor variables empirically-chosen to work best in heterogeneous patient populations. The APACHE score for example comprises 27 parameters, including vital signs, laboratory values, and specific chronic health items, with a few additional clinical variables added for patients undergoing CABG. As the field of precision medicine has emerged, a rapidly-growing literature describes the use of highly-specific biomarkers, proteomic assays, genomic microarrays and whole-genome sequencing in disease-specific outcome predictions (30-38). As the science of precision medicine advances, it’s likely that we will develop more precise methods of outcome prediction for specific subgroups of patients that are likely to surpass the performance of general severity scoring systems based only on clinical variables and routine laboratory tests.
Our study illustrates some features of the explained variance and discriminant accuracy of current severity scoring systems. Our finding that R2 does not generally exceed 0.25 is consistent with the findings of other investigators in regards to other well-validated severity scoring systems (2,11,39). This indicates that less than 25% of the between-patient variability in ICU or hospital LOS is explained by current scoring systems. There are two possible explanations for this finding. Either current severity scores are not well-designed to predict LOS, or LOS is inherently not very dependent on severity-of-illness. Our findings imply that ratios of observed/predicted LOS, or observed/predicted ventilator days calculated using current severity scoring systems, may be vulnerable to significant residual bias.
The differences in the discriminant accuracy achieved by 2VSS and APACHE IVa were surprisingly narrow (e.g., AUROC 0.77 vs. 0.89 for ICU mortality), suggesting that the relationship between AUROC and system complexity is non-linear. We recently performed a Monte Carlo simulation that showed that AUROC increases quadratically in diminishing increments as explanatory power is added to a mortality prediction model, and that the model can achieve an AUROC of 0.85 when only half of important predictor variables have been incorporated (40). This suggests that even the best current severity scoring systems, achieving AUROCs near 0.85, may leave many important aspects of severity-of-illness unaccounted for.
Based on our study results and review of the literature, we suggest that an AUROC ≤ 0.80 represents unacceptable discriminant accuracy in relation to severity scoring systems. This proposition is more conservative than previously-described subjective rating scales (3,8,9), but consistent with published examples of severity scoring systems that are inherently unlikely to yield acceptable discriminant accuracy. Systems incorporating only 1-3 variables have achieved AUROCs of 0.70-0.80, including one intentionally-designed to perform poorly (AUROC 0.70) (10), and others based only on: categorical self-assessment of health (i.e. as poor, good, excellent) (AUROC 0.74) (12), age (AUROC 0.76) (13) or hypotension, tachypnea and altered mentation (AUROC 0.80) (14). Furthermore, a model based only on administrative variables yielded an AUROC 0.81 (41) despite the inaccuracies inherent in such data (42).
Our proposed performance threshold for AUROC implies that organ failure scores, such as the sequential organ failure assessment (SOFA) and the multiple organ dysfunction score (MODS), generally fail to provide acceptable discriminant accuracy (43,44) to mitigate bias in outcome comparisons used to make inferences regarding quality of care. Outdated versions of severity scoring systems, such as the mortality probability model (MPM) and APACHE II, may achieve discriminant accuracy in the marginal range, with AUROCs of 0.80-0.84 (3,14,45). Well-designed contemporary severity scoring systems, such as APACHE IV, MPM-III, the simplified acute physiology score (SAPS-3), the Veterans Affairs intensive care unit risk adjustment model (1,3,5,9,15,46,47) and several newer machine-learning models (48,49) generally achieve AUROCs ranging from 0.84-0.89 when applied to general patient populations for which they were designed and validated.
Conclusions
Our study suggests that the explained variance and discriminant accuracy of general severity adjustment scoring systems like APACHE might be significantly reduced when they are used to predict outcomes in specific subgroups of ICU patients, and therefore caution should be exercised in making inferences regarding quality of care based on these predictions. Further studies are needed to establish absolute performance criteria for severity scoring systems.
References
- Zimmerman JE, Kramer AA, McNair DS, Malila FM. Acute Physiology and Chronic Health Evaluation (APACHE) IV: hospital mortality assessment for today's critically ill patients. Crit Care Med. 2006;34:1297-1310. [CrossRef] [PubMed]
- Zimmerman JE, Kramer AA, McNair DS, Malila FM, Shaffer VL. Intensive care unit length of stay: Benchmarking based on Acute Physiology and Chronic Health Evaluation (APACHE) IV. Crit Care Med. 2006;34:2517-29. [CrossRef] [PubMed]
- Breslow MJ, Badawi O. Severity scoring in the critically ill: Part 1 – Interpretation and accuracy of outcome prediction scoring systems. Chest. 2012;141:245-52. [CrossRef] [PubMed]
- Kramer A, Zimmerman J, Yi J. Performance of MPMo-III and APACHE IV mortality predictions in a multi-institutional ICU database – implications for national benchmarking. Crit Care Med. 2012;40:1–328 [Abstract]. [CrossRef]
- Vincent J-L, Moreno R. Clinical review: Scoring systems in the critically ill. Crit Care. 2010;14:207-16. [CrossRef] [PubMed]
- Chan T, Bleszynski MS, Buczkowski AK. Evaluation of APACHE IV predictive scoring in surgical abdominal sepsis: A retrospective cohort study. J Clin Diag Res. 2016;10:16-8. [CrossRef] [PubMed]
- Ghorbani M, Ghaem H, Rezaianzadeh A, et al. A study on the efficacy of APACHE-IV for predicting mortality and length of stay in an intensive care unit in Iran. F1000 research. 2017;6:2032. [CrossRef] [PubMed]
- Afessa B, Gajic O, Keegan MT. Severity of illness and organ failure assessment in adult intensive care units. Crit Care Clinics. 2007;23:639-58. [CrossRef] [PubMed]
- Keegan MT, Gajic O, Afess B. Comparison of APACHE III, APACHE IV, SAPS 3 and MPMoIII and influence of resuscitation status on model performance. Chest. 2012;142:851-8. [CrossRef] [PubMed]
- Hadorn DC, Keeler EB, Rogers WH, Brook RH. Assessing the performance of mortality prediction models. RAND/UCLA/Harvard Center for Healthcare Financing Policy Research. 1993. ISBN: 0-8330-1335-1.
- Verburg IWM, de Keizer NF, de Jonge E, Peek N. Comparison of regression methods for modeling intensive care length of stay. PLOS One. 2014;9:1-11. [CrossRef] [PubMed]
- DeSalvo KB, Fan VS, McDonell MB, Fihn SD. Predicting mortality and healthcare utilization with a single question. HRS: Health Services Research. 2005;40:1234-46. [CrossRef]
- Austin PC, Styerberg EW. Interpreting the concordance statistic of a logistic regression model: Relation to the variance and odds ratio of a continuous explanatory variable. Med Care. 2013;51:275-84. [CrossRef] [PubMed]
- Freund Y, Lemachatti N, Krastinova E, Van Laer M, et al. Prognostic accuracy of Sepsis-3 criteria for in-hospital mortality among patients with suspected infection presenting to the emergency department. JAMA. 2017;317:301-8. [CrossRef] [PubMed]
- Kuzniewicz MW, Vasilevskis EE, Lane R, et al. Variation in ICU risk-adjusted mortality: Impact of methods of assessment and potential confounders. Chest. 2008;133:1319-27. [CrossRef] [PubMed]
- Khwannimit B. Bhurayanontachai R, Vattanavanit V. Validation of the sepsis severity score compared with updated severity scores in predicting hospital mortality in sepsis patients. Shock. 2017;47:720-5. [CrossRef] [PubMed]
- Nassar AP, Mocelin AO, Andrade FM, Brauer L. SAPS 3, APACHE IV or GRACE which score to choose for acute coronary syndrome patients in intensive care units? Sao Paulo Med. J. 2013;131:173-8. [CrossRef]
- Ayazoglu TA. A comparison of APACHE II and APACHE IV scoring systems in predicting outcomes in patients admitted with stroke to an intensive care unit. Anaesth Pain and Intens Care. 2011;15:7-12. Available at: http://www.apicareonline.com/original-article-a-comparison-of-apache-ii-and-apache-iv-scoring-systems-in-predicting-outcome-in-patients-admitted-with-stroke-to-an-intensive-care-unit/ (accessed 12/26/18).
- Bauer PR, Kashyap R, League SC, Park JG, et al. Diagnostic accuracy and clinical relevance of an inflammatory biomarker panel for sepsis in adult critically ill patients. Diagn Microbiol Infect Dis. 2016;84:175–80. [CrossRef] [PubMed]
- Kramer AA, Zimmerman JE. Predicting outcomes for cardiac surgery patients after intensive care unit admission. Semin Cardiothorac Vasc Anesth. 2008;12:175-83. [CrossRef] [PubMed]
- Costa e Silva VT, de Castro I, Liano F, et al. Performance of the third-generation models of severity scoring systems (APACHE IV, SAPS 3 and MPM-III) in acute kidney injury critically ill patients. Nephrol Dial Transplant. 2011;26:3894-901. [CrossRef] [PubMed]
- Soares M, Salluh JI. Validation of the SAPS 3 admission prognostic model in patients with cancer in need of intensive care. Intensive Care Med. 2006;32:1839-44. [CrossRef] [PubMed]
- Oliveira VM, Brauner JS, Rodrigues Filho EIs SAPS 3 better than APACHE II at predicting mortality in critically ill transplant patients? Clinics (Sao Paulo). 2013;68:153-8. [CrossRef]
- Tsai CW, Lin YF, Wu VC, et al. SAPS 3 at dialysis commencement is predictive of hospital mortality in patients supported by extracorporeal membrane oxygenation and acute dialysis. Eur J Cardiothorac Surg. 2008;34:1158-64. [CrossRef] [PubMed]
- Doerr F, Badreldin AM, Can F, et al. SAPS 3 is not superior to SAPS 2 in cardiac surgery patients. Scand Cardiovasc J. 2014;48:111-9. [CrossRef] [PubMed]
- Salciccioli JD, Cristia C, Chase M, et al. Performance of SAPS II and SAPS III scores in post-cardiac arrest. Minerva Anestesiol. 2012;78:1341-7. [PubMed]
- Badreldin AM, Kroener A, Heldwein MB, et al. Prognostic value of daily cardiac surgery score (CASUS) and its derivatives in cardiac surgery patients. Thorac Cardiovasc Surg. 2010;58:392-7. [CrossRef] [PubMed]
- Doerr F, Badreldin AMA, Heldwein MC, et al. A comparative study of four intensive care outcome prediction models in cardiac surgery patients. J Cardiothorac Surg. 2011;6:21. [CrossRef] [PubMed]
- Hekmat K. Prediction of mortality in intensive care unit cardiac surgical patients, European J Cardiothorac Surg. 2010;38:104–9. [CrossRef] [PubMed]
- Finnerty CC, Ju H, Spratt H, et al. Proteomics improves the prediction of burns mortality: results from regression spline modeling. Clin Transl Sci. 2012;5:243-9. [CrossRef] [PubMed]
- Mikacenic C, Price BL, Harju-Baker S, et al. Two-Biomarker Model Predicts Mortality in the Critically Ill with Sepsis. Am J Respir Crit Care Med. 2017;196:1004-11. [CrossRef] [PubMed]
- Cuenca AG, Gentile LF, Lopez MC, et al. Development of a genomic metric that can be rapidly used to predict clinical outcome in severely injured trauma patients. Crit Care Med. 2013;41:1175-85. [CrossRef] [PubMed]
- Stortz JA, Mira JC, Raymond SL, et al. Benchmarking clinical outcomes and the immunocatabolic phenotype of chronic critical illness after sepsis in surgical intensive care unit patients. J Trauma Acute Care Surg. 2018;84:342-9. [CrossRef] [PubMed]
- Muehlschlegel JD, Liu KY, Perry TE, et al. Chromosome 9p21 variant predicts mortality after coronary artery bypass graft surgery. Circulation. 2010;122:S60-5. [CrossRef] [PubMed]
- Perry TE, Muehlschlegel JD, Liu KY, et al. Preoperative C-reactive protein predicts long-term mortality and hospital length of stay after primary, non-emergent coronary artery bypass grafting. Anesthesiology. 2010;112:607-13. [CrossRef] [PubMed]
- Scicluna BP, van Vught LA, Zwinderman AH, et al. Classification of patients with sepsis according to blood genomic endotype: a prospective cohort study. Lancet Respir Med. 2017;5:816-26. [CrossRef] [PubMed]
- Sharma NK, Salomao R. Sepsis through the eyes of proteomics: The progress in the last decade. Shock. 2017;47:17-25. [CrossRef] [PubMed]
- Miajlovic H, Aogáin MM, Collins CJ, et al. Characterization of Escherichia coli bloodstream isolates associated with mortality. J Med Microbiol. 2016;65:71-9. [CrossRef] [PubMed]
- Vasilevskis EE, Kuzniewicz MW, Brian A. Cason BA. Mortality Probability Model III and Simplified Acute Physiology Score II: Assessing their value in predicting length of stay and comparison to APACHE IV. Chest. 2009;136:89–101. [CrossRef] [PubMed]
- Submitted Am J Epidemiol.
- Male, E, Ghamande S, White HD. Superiority of APACHE IV vs. APR-DRG in evaluating ICU mortality based on discharge billing codes. Am J Resp Crit Care Med. 2017;195:A2772 [Abstract].
- van Walraven C, Bennett C, Forster AJ. Administrative database research infrequently used validated diagnostic or procedural codes. J Clin Epidemiol. 2011;64:1054-9. [CrossRef] [PubMed]
- Bota, P, Melot C, Ferreira L, et al. The Multiple Organ Dysfunction Score (MODS) versus the Sequential Organ Failure Assessment (SOFA) score in outcome prediction. Inten Care Med. 2002;28:1619-24. [CrossRef] [PubMed]
- Zygun DA, Laupland KB, Fick GH, et al. Limited ability of SOFA and MOD scores to discriminate outcome: a prospective evaluation in 1,436 patients. Can J Anaesth. 2005;52:302-8. [CrossRef] [PubMed]
- Ho KM, Williams TA, Harahsheh Y, Higgins TL. Using patient admission characteristics alone to predict mortality of critically ill patients: A comparison of 3 prognostic score. J Crit Care. 2016;31:21-5. [CrossRef] [PubMed]
- Render ML, Deddens J, Freyberg R, Almenoff P, et al. Veterans Affairs intensive care unit risk adjustment model: validation, updating, recalibration. Crit Care Med. 2008;36:1031-42. [CrossRef] [PubMed]
- Lipshutz AKM, Feiner JR, Grimes B, Gropper MA. Predicting mortality in the intensive care unit: a comparison of the University Health Consortium expected probability of mortality and the Mortality Prediction Model III. Intensive Care. 2016;4:35. [CrossRef] [PubMed]
- Kim S, Kim W, Park RW. A comparison of intensive care unit mortality prediction models through the use of data mining techniques. Healthcare Inform Res. 2011;17:232-43. [CrossRef] [PubMed]
- Pirracchio R, Petersen ML, Carone M, Rigon MR, Chevret S, van der Laan MJ. Mortality prediction in intensive care units with the Super ICU Learner Algorithm (SICULA): a population-based study. Lancet Respir Med. 2015;3:42–52. [CrossRef] [PubMed]
Acknowledgements
We would like to acknowledge the work of Maria Calleja and Banner Health Clinical Performance Analytics in providing the data used in our analysis.
Author’s contributions
Conception and design: RAR, RDG, KSR, MF, SCC
Data collection: RAR
Statistical analysis: RDG, RAR
Interpretation: RAR, RDG, KSR, MF, SCC
Writing the manuscript: RAR, RDG, KSR, MF, SCC
Guarantor taking full responsibility for integrity of the study: RAR
The authors have no conflicts of interest to report and there was no direct funding for this project.
Abbreviation List
- 2VSS: two-variable scoring system
- APACHE: Acute Physiology and Chronic Health Evaluation
- APS: acute physiology score
- AMI: acute myocardial infarction
- AUROC: area under the receiver operating curve
- CABG: coronary artery bypass grafting
- CASUS: cardiac surgery score
- GI: gastrointestinal
- ICU: intensive care unit
- LOS: length of stay
- MODS: multiple organ dysfunction score
- MPM: mortality probability model
- RAND (corporation): research and development
- R2: Pearson’s coefficient of determination
- SAPS: simplified acute physiology score
- SOFA: sequential organ failure assessment
Cite as: Raschke RA, Gerkin RD, Ramos KS, Fallon M, Curry SC. The explained variance and discriminant accuracy of APACHE IVa severity scoring in specific subgroups of ICU patients. Southwest J Pulm Crit Care. 2018;17:153-64. doi: https://doi.org/10.13175/swjpcc108-18 PDF
 Post a Comment
Reader Comments