Effect of Steam on the Energy and Activated Carbon Production of A Pilot-Scale Downdraft Steam Co-Gasification
Sawitree Prapakarn1, Weerachai Arjharn1, Pansa Liplap1, Natthapong Prapakarn1 and Thipsuphin Hinsui2
1School of Agricultural Engineering, Institute of Engineering, Suranaree University of Technology, 111 University Avenue, Muang District, Nakhon Ratchasima, 30000, Thailand.
2Center of Excellent in Biomass, Institute of Engineering, Suranaree University of Technology, 111 University Avenue, Muang District, Nakhon Ratchasima, 30000, Thailand.
Corresponding Author E-mail: oceanone@hotmail.com
DOI : http://dx.doi.org/10.13005/ojc/330537
A by-product from gasification technology is charcoal that can be developed as high-quality activated carbon by activation technology such as steam, chemical, high nitrogen and other activation methods. Thus, in this study, the concept of combined energy and activated carbon production from coconut shell was investigated using a pilot-scale open top downdraft steam co-gasification with steam injected into the reduction zone of the gasifier. A pilot-scale experiment on coconut shell steam co-gasification aimed at generating electricity; therefore, the reactor temperature profile, syngas characteristics, performance of the syngas in the production of electricity were included in the steam co-gasification and iodine absorption of the charcoal. The result showed that the study of combined energy and activated carbon production from coconut shell is a way of using resources efficiently, increasing quality of the by-product, and using clean technology.
KEYWORDS:Activated carbon; coconut shell; energy; gasification; steam co-gasification
Download this article as:| Copy the following to cite this article: Prapakarn S, Arjharn W, Liplap P, Prapakarn N, Hinsui T. Effect of Steam on the Energy and Activated Carbon Production of A Pilot-Scale Downdraft Steam Co-Gasification. Orient J Chem 2017;33(5). |
| Copy the following to cite this URL: Prapakarn S, Arjharn W, Liplap P, Prapakarn N, Hinsui T. Effect of Steam on the Energy and Activated Carbon Production of A Pilot-Scale Downdraft Steam Co-Gasification. Orient J Chem 2017;33(5). Available from: http://www.orientjchem.org/?p=36593 |
Introduction
Technology development and modern science aspiring to boost productivity rather than increase the use of inputs, focuses on linking activities in the agricultural sector and industry by using biomass and technology to optimize energy production, to create high-value products and to further increase the product value. This is a way to develop the industry moving sustainably. Biomass can be converted to energy via either biological or thermochemical processes1, the latter consisting mainly of combustion, pyrolysis and gasification. Among these, gasification is attractive in terms of energy production because it produces a clean-burning fuel that can used in many power generation applications2, at a greater overall conversion efficiency of a given biomass resource into electric power compared to traditional combustion-based technologies .3
The thermo-chemical conversion process used in gasification under the conditions of limited oxygen or air. Solid fuel is converted into burnable gas. The gasification system is low pressure and innocuous .4 The gas can be used directly to produce energy, delivered into an internal combustion engine to produce electricity, or be input into the boilers to produce steam. The steam can then drive a steam turbine to produce electricity to use this as an advantage in other ways. Moreover, the by-product of the process is charcoal that can be developed as high-quality activated carbon.5, 6 This gasification process is called conventional gasification technology. The weakness of this process is that it cannot increase the quality of charcoal to be high-quality activated carbon. There are many supporting types of research in which steam is a catalyst in the thermal chemical process called steam gasification, which can increase the quality of charcoal to be activated carbon. The surface carbon has physical changes. The carbon atoms which are dropped out, resulting in a porous material with a different mechanism is to open the closed pores, making pore size larger and creating new porous charcoal. The surface area has more free electrons. As a result, the absorption ability is higher. This will increase the ability to absorb carbon performance. Moreover, the process can also increase the hydrogen gas yield. 7,8 However, a review of relevant research found that the study of combined energy and activated carbon production using a pilot-scale downdraft steam co-gasification is not currently being conduct.
Therefore, in this study, the concept of combined energy and activated carbon production from coconut shell using a steam co-gasification process to produce energy, and to increase the charcoal value. Finally, technology development and modern science, to boost productivity rather than increase the use of inputs, focuses on linking activities in the agricultural industry by using biomass and technology to optimize energy production to create high-value products and to further increase the product value. This is a way to develop the industry moving sustainably.
Materials and Methods
Sample
The coconut shell derived from process plants located on the Ampol Food Processing Ltd., Nakornpathom province, Thailand. The coconut shell was fiber of 15%, size of 9 – 70 mm and bulk density of 206 kg/ m3 (Fig. 1). The initial moisture contents of the coconut shell were 5.84 % (w.b.). Characteristics of each the coconut shell was determined by means of proximate and ultimate analyses (Table I). Proximate analysis was determined as per ASTM D1762-84 and ASTM D2015-77 standards. For ultimate analysis, CHNS Element Analysis (LECO, CHNS-932).
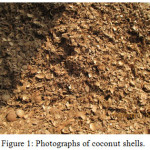 |
Figure 1: Photographs of coconut shells. |
Table 1: Proximate and ultimate analyses of the coconut shell.
|
Sample |
Coconut shell |
|
Proximate analysis (wt.%, wet basis) |
|
|
Moisture |
5.84 |
|
Ash |
2.23 |
|
Volatile |
76.69 |
|
Fix carbon |
15.24 |
|
LHV(MJ/kg) |
20.33 |
|
Ultimate analysis (wt.%, daf ) |
|
|
Carbon (C) |
46.2 |
|
Hydrogen (H) |
5.42 |
|
Nitrogen (N) |
0.87 |
|
Sulfur (S) |
0.05 |
|
Oxygen (O) |
45.23 |
Experimental Apparatus
Suranaree University of Technology, Thailand and Satake Corporation Co., Ltd., Japan collaboratively invented (Fig. 2) and developed a pilot-scale downdraft (open top) steam co-gasification power plant. The gasifier was manufactured from mild steel with insulation of inner lining as well as high-temperature ceramic. The height and inner diameter of the gasifier were 3.11 meters and 0.75 meters, respectively. The steam pipe has been connected to reduction zone of the power plant. Then, a grate was placed on the bottom of gasifier to hold feedstock. A screw conveyor with water jacket was installed below the grate for charcoal removal. Nine 10 cm-diameter air nozzles were installed around the combustion zone. A gas cleaning and cooling system was placed next to the gasifier, including, water scrubber, a cyclone collector, chilled water scrubber, biomass filter and bag filter. For generating electricity, an engine-generator set with a maximum power output at 90 kW was employed. Photographs of downdraft steam co-gasification power plant are presented in Fig. 3.
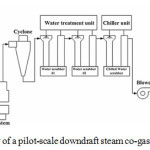 |
Figure 2: Schematic view of a pilot-scale downdraft steam co-gasification power plant. |
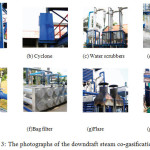 |
Figure 3: The photographs of the downdraft steam co-gasification system. |
Experimental Procedure
The coconut shell was refilled into the gasifier to the predetermined level. Then, all nozzle valves were open to let air flow through the gasifier. The scrubber circulation pump and air blower were turned on. After that, the coconut shell was ignited at the ignition ports that were in the combustion zone with a pilot lighter. The heat, which was generated in this process, evaporated moisture from the coconut shell in the dry zone. This caused pyrolysis and gasification reactions. After the gasification reaction had been completely done, the syngas left the gasifier through the gas cleaning and cooling system. The contaminations, i.e. dust, pyrolytic products (tar) and water vapor, were first eliminated by the gases flowing through a cyclone collector, followed by a chilled scrubbers and water scrubber. Most of the tar was entrapped in cold water by the chilled water scrubber. The moisture in the wet gas derived from the chiller scrubber was eliminated by passing it through a biomass filter with dried woodchips. At the last stage, bag filters, which can trap particulate matter, as tiny as 0.1 mm, were used to make sure that the produced gas was clean enough for the gas engine generator. Also, gas temperature prior to passing through the engine was approximately 35°C.
The impact of the air supplied in the process of steam co-gasification was examined by changing the syngas flow rate, using a blower installed in the gas line. The blower speed was adjusted in the inverter at three different frequencies, i.e., 10, 20, and 40 Hz, and the syngas flow rates were measured by employing an electronic flow gas meter (Model DIGSIDO-O, Nippon Flow Cell, and Japan) that was between the bag filters and the engine-generator set. In a meantime, the effects of the steam supplied on the steam co-gasification technology were examined by altering the steam flow rate using a ball valve installed in the steam line. The steam flow rates were measured using an electronic flow steam meter (SPIRAX SARCO Stream Flow Meter TVA, and USA) located the reduction zone of the gasifier. At the beginning of each experimental run, prior to supplying gas to the engine-generator set, the syngas was analyzed every 30 min to ensure its quality. Until an appropriate gas quality was attained (approximately 2-3 hours depending on the raw material), the gas produced was burned at the flare. Once the gas was quality enough to run the generator, measurements of the process parameters were begun until the end of each experiment (approximately 35 hours). The amount of biomass required to refill the gasifier to the predetermined level after a given amount of time was used to calculate the biomass consumption rate.
For the temperature monitoring within the gasifier, six K-type thermocouples were employed to measure the temperature inside the reactor. These were installed vertically, from the top of the gasifier, at 0.66, 1.06, 1.46, 1.86, 2.28 and 2.70 m respectively.
Gas Quality Analysis
Gas deriving from the coconut shell was gathered at the sampling port which was between the bag filters and the engine−generator set (Fig. 2). It was analyzed with means of gas chromatography (SIMADSU, GC-14B). Also, combustible gas can be used for calculating calorific values [low heating value (LHV)], considering the heating value of 13.1 MJ /Nm3 for CO, 11.2 MJ /Nm3 for H2, and 37.1 MJ/ Nm3 for CH4 .9
Gas Quality Analysis
The operation of the steam co-gasification technology could be evaluated by the following equations. 10, 11
where
ŋsg The steam co-gasification efficiency (%)
ŋe The engine-generator set efficiency (%)
ŋel The electrical efficiency (%)
mcoconut shell The coconut shell consumption rate (kg /h)
CVg The calorific value of gas produced (MJ/Nm3)
LHVcoconut shell The low heating value of biomass (MJ/ kg3)
Pe The electrical power output (kW)
Vg The volume flow rate of gas produce (Nm3 /h)
Hg The enthalpy of steam (MJ/ h)
Charcoal Quality Analysis
Characteristics of the charcoal was determined by means of proximate and ultimate analyses. Proximate analysis was determined as per ASTM standards (D1762-84, D2015-77). For final analysis, it was determined as CHNS element analysis (LECO, CHNS-932). Iodine test (ASME D4607-94) was conducted to estimate the specific surface area of residual carbon oxidation. Also, the morphology of the samples was examined with Scanning Electron Microscopy (SEM) using JEOL JSM-6010LV.
Results and Discussion
Temperature Profile
Temperature profiles varied according to the steam flow rates and the syngas flow rates (Fig. 4).The without steam condition, the temperature at different locations is quite constant along the height of the gasifier. The average temperature difference between the 0.66 and 1.06 m positions was little, as it was less than 200°C. Drying is the main process taking place in this zone. The moisture in the feedstock was released until the temperature rose up to 200°C.12 Then, the temperature rapidly increased from the 1.06 to 1.86 m position (~ 600°C), in which air was filled to the gasifier. Coconut shell was pyrolyzed at the temperatures ranging from 280 to 500°C in this zone, which left solid char behind and released volatiles composing of CO2 and tar .12 The highest temperature was achieved at 2.28 m, which is the prominent heat of the gasifier (combustion zone). At the end of the stage, the temperature was reduced to an average value of 590°C due to endothermic reactions where the product gases produced from the upper zone decreased with carbon (charcoal). This produced syngas that mainly contained CO and H2. In general, the temperature in this zone should be higher than 500°C .9 For the with steam condition, the process was controlled to gain different steam flow rate at 12 and 20 kg/h (the syngas flow rate = maximum) and used for generating electricity, as shown in Table 2. As a result, the temperature at 1.46 m positions of the with steam conditions small at less than 200 °C that lower the without steam condition as a result of the charcoal removal making them burn faster in the adjacent zone. 3 The temperature at 1.86, 2.28, and 2.70 m had increased average 17% because the increase of steam available for exothermic reactions in the gasifier .13 Furthermore, factors affecting temperature of gasification are air velocity, zone thickness, particle size and chemical composition of the feed .13
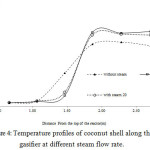 |
Figure 4: Temperature profiles of coconut shell along the gasifier at different steam flow rate.
|
Syngas Composition
Table 2. shows syngas composition derived from coconut shell under different steam flow rate. The syngas was composed mainly of CO, H2, CH4, and CO2 with a mean value (% v/v), the combustible gas concentration, which were CO, H2, and CH4, were likely to increase of CO and H2 with steam. In contrast, CH4 and CO2 were likely to decrease. Therefore, coconut shell thermal decomposing reaction was carbon reaction and methane reforming reaction.14 An increases or decrease of CO, H2, CH4, and CO2 had little effect on LHV of syngas; as a result, an engine-generator was generated suitable electricity. In addition, these LHV of syngas are high enough to be used in a gas engine generator where the minimum system requirement is 4.2 MJ /Nm3 as suggested by Wander, Altafini, & Barreto.15
Table 2: Experimental results of the steam co-gasification test.
| Parameter | Unit | Steam flow rate (kg/ h) | ||
| 0 | 12 | 20 | ||
| Power output (electricity) | kW | 88.14 | 65.50 | 61.20 |
| Syngas flow rate (db) | N m3/h | 202.52 | 195.20 | 205.40 |
| Steam to coconut shell ratio (S/C) | Kg/ kg | 0.00 | 0.10 | 0.14 |
| Coconut shell consumption rate | kg /h | 213.40 | 123.44 | 145.78 |
| Specific biomass consumption | kg /kWh | 2.42 | 1.88 | 2.38 |
| Charcoal removal rate | kg /h | 45.38 | 18.08 | 22.48 |
| % | 21.27 | 14.65 | 15.42 | |
| Syngas composition (db) | ||||
| CO | % | 14.42 | 15.44 | 13.93 |
| H2 | % | 13.19 | 16.58 | 14.89 |
| CH4 | % | 4.33 | 2.90 | 2.99 |
| CO2 | % | 18.96 | 15.17 | 16.27 |
| LHV of syngas | MJ/ Nm | 5.41 | 5.42 | 5.02 |
| Specific syngas yield | N m3/ kg | 0.95 | 1.58 | 1.41 |
| ŋgg | % | 25.25 | 41.63 | 34.17 |
| ŋe | % | 28.96 | 22.29 | 21.37 |
| ŋel | % | 7.31 | 9.28 | 7.30 |
Specific Enthalpy of Steam, hs @ 102.3 ◦C = 2680 kJ/ kg
Electrical Power Output
Clean syngas, which was supplied through the bag filter, was employed to generate electricity with an engine-generator set, which are presented in Table 3. Also, electrical load was used to determine the power consumed. The result of the steam flow rate on syngas power output is shown in Table 2. The number of 0, 12, and 20 kg/h of steam flow rate could be used to generate electricity, with 88.14, 65.50 and 61.20 kW of maximum power outputs, respectively. The power output had decrease when increasing the steam because CH4, H2 and CO2 mixtures had effects to power output of an engine−generator.16,17 In addition, the stoichiometric condition gave the maximum output, and slightly lean condition gave the maximum thermal efficiency.16
Table 3: Specifications of the gas engine-generator set.
|
Engine |
Engine make |
– |
CUMMIN |
|
Model |
– |
G855-G-B |
|
|
Bore and stroke |
mm |
140×152 |
|
|
Compression ratio |
– |
10:01 |
|
|
Number of cylinders |
– |
6 |
|
|
Power |
hp |
160 |
|
|
Generator |
Output |
kW |
90 |
|
Engine speed |
rpm |
1500 |
|
|
Voltage |
V |
400 |
|
|
Frequency |
Hz |
50 |
Coconut Shell Consumption Rate
In the comparison between without steam and with steam, the with steam of coconut shell consumption rate decrease to 42% and 32%,with steam flow rates of 12, and 20 kg/h, respectively (Table II). The decrease of coconut shell consumption is due to the fact that, when filling steam, and a gasifying agent raised the partial pressure of H2O in the gasifier which supported the water gas, water gas shift and methane reforming reactions, it led to increase H2 production.18 Thus, hydrogen produced in the gasifier is produced via steam-coconut shell reforming. In with steam, the coconut shell consumption rate increase when the syngas flow rate increase. Because when the syngas flow rate rose up, the air flow rate was raised as well, and it provided more oxygen to oxidize. Then, a higher amount of coconut shell would become combusted, not only a higher combustion rate but also an enhanced pyrolysis and drying rate.15 Inthis study, at the power output achieved and the less specific coconut shell consumption (the amount of biomass that was required to generate electricity) at 12 kg/hsteam, flow rates were 1.88 kg kW/h, which was equivalent to that of other forms of gasification.19,20
Table 4: Characterization of the charcoal.
| Parameter | Unit | Steam flow rate (kg/ h) | |||
| 0 | 12 | 20 | |||
| Proximate analysis of charcoal (wb) | wt.% | ||||
| Moisture | 0 | 0 | 0 | ||
| Volatile | 3.88 | 4.45 | 5.08 | ||
| Ash | 3.75 | 3.71 | 2.65 | ||
| Fixed carbon | 92.37 | 91.84 | 92.27 | ||
| LHV of charcoal | MJ /kg | 33.16 | 33.86 | 32.58 | |
| Ultimate analysis of charcoal (daf) | Wt.% | ||||
| C | 91.28 | 62.15 | 57.5 | ||
| H | 0.86 | 0.6 | 0.73 | ||
| O | 3.51 | 32.87 | 38.62 | ||
| N | 0.61 | 0.63 | 0.48 | ||
| S | 0 | 0.04 | 0.03 | ||
| Iodine number | mg/g | 279.49 | 600.1 | 563 | |
Charcoal Removal
Charcoal removal from the gasifier is significant in the gasification process. During operation, charcoal needs to be removed from the gasifier periodically. The charcoal removal rate was dependent on ash content of biomass: the higher the ash content, the higher the charcoal removal rate. The rate of charcoal removal could be calculated as the following:
% charcoal removal = charcoal removal rate (kg/h) / coconut shell consumption rate (kg/h) (4)
Since above 5% of ash content trends to effect clinker as well as slag formation. 12,22 The coconut shell ash was as 2.23%. Based on our experience, to keep temperature in the combustion zone stable, biomass with low ash content needs % charcoal removal approximately 3 times greater than its ash content. Therefore, the charcoal removal rates were calculated using Eq. (4). In with steam, as coconut shell consumption rate increased along with the increase in syngas flow rate and steam flow rate, the charcoal removal rate rose proportionally (Table II). The charcoal removal rates were below the 0, 12, and 20 kg/h steam flow rates were 45.38, 18.08, and 22.48 kg/h , respectively. In comparison to other studies, the amount of percentage of charcoal removal rate was higher to that of other forms of gasification 23 because this study focused on adding value to charcoal and energy production. Any charcoal removal rate either over or under these conditions may cause the shut-down of gasification by slag formation and flame extinguishment inside the gasifier, respectively.
Efficiencies of the Steam Co-Gasification System
The steam co-gasification technology was evaluated based upon specific syngas yield, steam co-gasification efficiency (ηsg), engine−generator set efficiency (ηe), and electrical efficiency (ηel). The steam was likely to increase the specific syngas yield, with the highest value as 1.58 Nm3/ kg, as shown in Table 2. The value of ηsg increased from 25.25% at steam flow rate = 0 kg/h to 41.63% at steam flow rate = 12 kg/h and then declined to 34.17 % at steam flow rate = 20 kg/h. The increase in ηsg was probably caused from the increase of the steam flow rate after the coconut shell consumption rate decreased. As the steam flow rate rose up, the methane reaction and water gas shift was enhanced by the increase of H2O feeding rate, and the greater heat in the oxidation zone affected higher endothermic gasification reactions. Therefore, the ηsg increases along with the increase of the steam flow rate. Nevertheless, the CO2 content in the syngas rose up with the combustion reaction, and the heating value of synthetic gas was reduced, so the ηg. decreased. From the experiment, the efficiency of steam co-gasification for coconut shell was shown to be in the range of those achieved with biomass consumption using gasification. 20,24The ηe was calculated (as the ratio of energy, which was similar to electrical power output) with the rate of energy supplied to the engine. The result of ηe as function of power output (electricity) is shown in Table 2. Also, ηe decreased can be seen along with the decrease in the electrical power output. For the maximum power output obtained with steam in this research (65.50 kW), the efficiency of engine−generator set was 22.29%. Finally, the ηel values at 88.14, 65.50 and 61.20 kW were 7.31, 9.28 and 7.30 %, respectively. The ηe and ηel obtained from the experiment of coconut shell were equivalent to those derived from various types of biomass employing the gasification system.23
Characterization of Activated Carbons
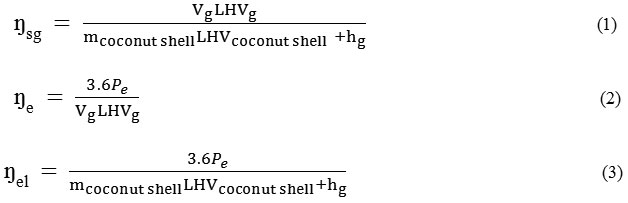
The effect of the steam flow rate on the charcoal properties of the activated carbons produced from the coconut shell by steam co- gasification under varying conditions is shown in Table IV.The increasing of steam flow rate had less effect on the proximate properties of charcoal but it had more effect on the element of carbon. In the comparison between without steam and with steam, the with steam of charcoal a carbon (C) decrease to 62.15 % and 57.50 %,with steam flow rates of 12, and 20 kg/h, respectively . The carbon had decreased when increasing the steam because the carbon in charcoal reforming is a method of producing synthesis gas from the water gas shift reaction. Hence, the porosity of charcoal appeared to increase as shown in the SEM images in Fig. 5, leading to increased iodine number and oxygen. The iodine number at 0, 12 and 20 kg/h were 279.49, 600.10 and 563.00 %, respectively. It can be seen that coconut shell could be efficiently employed as feedstock for generating electricity and activated carbon.
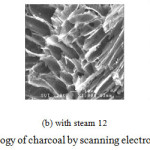 |
Figure 5: The morphology of charcoal by scanning electron Microscopy (SEM) |
Conclusions
In this research, coconut shell was employed to generate electricity and activated carbon with a pilot-scale downdraft steam co-gasification technology. The result of the equation of steam flow rate and steam co-gasification technology was examined. Temperature inside the reactor was equivalent to the steam flow rate and syngas flow rate. For generating electricity, the steam flow rate as 0, 12 and 20 kg/ h could be used in a generator set to generate electricity with power outputs as 88.14, 65.50 and 61.20 kW, respectively. The coconut shell consumption rate and the specific coconut shell consumption were found to decrease with the steam flow rate that was increased. An appropriate percentage of charcoal removal of the biomass consumption rate was about 14-21%. Steam gasification efficiency and electrical power output were at a maximum at a steam flow rate as 12 kg/h, whereas engine−generator set efficiency decreased along with the decrease in the power output (electricity). Overall, coconut shell was found to be suitable for generating electricity and activating carbon using steam co-gasification technology, but air fuel ratios for appropriate combustion and engine performance. It was because the proper amount of air and fuel must be merged.
Acknowledgments
The authors would like to thank Suranaree University of Technology and the Ampol Food Processing Ltd., Thailand for their support in this research.
References
- Caputo, A.C. ; Palumbo, M. ; Pelagagge, P.M. ; Scacchia, F. Biomass and Bioenergy. 2005, 28, 35–51 .
CrossRef - Babu, S.P. ; Whaley, T.P. Biomass and Bioenergy. 1992, 2,299-306.
CrossRef - E.D. Larson. Prepared for the biomass workshop Changchun,January 12-13; Jilin, China.1998,1-12.
- Klein, A. Masters dissertation, Engineering. Department of Earth and Environmental Engineering, Columbia University, Columbia .2002, 6-9.
- Nowell, G.P. American Methanol Institute, State University of New York at Albany .1999, 616–624.
- Petersen, I.;Werther, J. Chemical Engineering and Processing. 2005, 44, 717-36.
CrossRef - Lv, P.M.; Xionga, Z.H.; Changa, J.; Wua, C.Z.; Chena, Y; Zhub, J.X. .Bioresource Technology. 2004, 95, 95- 101.
CrossRef - Hernandez, J. J.; Arandaa, G.; Barbaa, J.; Mendozab , J.M. Fuel Processing Technology. 2012, 99, 43-55.
CrossRef - Reed, T. B.; Das, A. The Biomass Energy Foundation Press.1988,9-16.
- Sreejith, C.C.; Muraleedharan,C.;Arun,P. Fuel Processing Technology.2015, 130,197-207.
CrossRef - Bhattacharya, S. C.; Hla, S.S.; Pham, H.L. Biomass Bioenergy.2001,21,445-460.
CrossRef - Rajvanshi, A. K. Alternative Energy in Agriculture.1986,2,83-102.
- Kanniappan, K. International Journal of Science and Research.2013, 4, 2319-7064.
- Li, W.; Li, Q.; Chen, R.; Wu,Y.; Zhang, Y. International journal of hydrogen energy.2014 ,39 , 5580-5588 .
CrossRef - Wander, P. R.; Altafini, C. R.; Barreto, R. M. Biomass Bioenergy . 2004, 27, 467−476.
CrossRef - Chuayboona, S.; Prasertsana, S.; Theppayaa, T.; Maliwana, K.; Prasertsanb, P. Energy Procedia. , 2014, 52, 659 – 665.
CrossRef
- Kumar, A.; Jones D, D.; Hanna, M, A. Energies. 2009, 2 , 556-581.
CrossRef - Karagoz, Y.; Sandalc,T.; Yuksek,L.; Dalkılic,A,S.;Wongwises. Advances in Mechanical Engineering. 2016,8 , 1–13 .
- Zainal, Z. A.; Rifau, A.; Quadir, G. A.;Seetharamu, K. N. Biomass Bioenergy. 2002, 23, 283−289.
CrossRef - Arjharn, W.; Kongkapee, N.; Rabsombat, K.; Hinsui, T.J. National Research Council of Thailand. 2009, 40,127-146.
- McKendry, P. Bioresour Technol.2002, 83, 55−63.
CrossRef - Marrero, T. W.; McAuley, B. P.; Sutterlin, W. R.; Steven Morris,J.; Manahan, S. E. Waste Manage. 2004. 24, 193−198.
CrossRef - Arjharn, W.; Hinsui, T.; Liplap, P.; Raghavan, G. S. V. Biobase Materials and Bioenergy, 2012, 6, 1 – 11.
CrossRef - Yoon, S. J.; Son, Y.I.; Kim, Y. K.; Lee, J.G. Renewable Energy. 2012, 42, 163−167.
CrossRef

This work is licensed under a Creative Commons Attribution 4.0 International License.
About The Author
![]()
A New Edition of Web of Science
Journal Impact Factor
2022: 0.5
Five Year: 0.8
Journal is Indexed in

Cabells Whitelist
![]()


