
Manuscript accepted on :06-03-2020
Published online on: 24-03-2020
Plagiarism Check: Yes
Cherry E fouqueh, Mohsen S Selim, Hisham A Awad and Dina A .Aly Labib*
Department of Medical Pharmacology, Faculty of Medicine, Cairo University, Egypt, 11952
Corresponding Author E-mail: labibd5@gmail.com
DOI : https://dx.doi.org/10.13005/bpj/1900
Abstract
Hypertension is the second cause of end stage renal disease (ESRD). The role of sodium-glucose transporter inhibitor (SGLTi) in hypertensive nephropathy (HN) is still unexplored. This is the first study to evaluate the potential reno-protective effects of empagliflozin, SGLT2i, alone and in combination with lisinopril in a rat model of L-NAME-induced hypertension. A total of 50 adult healthy male Sprague-Dawley albino rats were used in this study. HN was induced by using L-NAME (75 mg/kg/day) for 6 weeks. Rats were treated orally by empagliflozin alone (10 mg/kg/day), lisinopril alone (10 mg/kg/day) and a combination of both drugs with the same previously mentioned doses. Body weight (BW) and mean arterial pressure (MAP) were measured at the start, 3rd & 6th weeks of the study. Urine volume, albumin, creatinine, glucose and sodium urine levels were measured also at the start, 3rd & 6th weeks of the study. Serum creatinine, urea, sodium and potassium levels were also measured at the same timings. At the end of the study, kidney weight & renal MDA levels were assessed as well as pathological examination of the kidneys for all groups was done. Co-administration of empagliflozin with lisinopril successfully improved the biochemical & the pathological parameters in the combined group, more than either of the groups receiving each drug alone. Combination therapy of empagliflozin and lisinopril attenuated the development of renal injury than administration of either drug alone in L-NAME- induced HN in rats.
Keywords
Empagliflozin; Hypertensive; Lisinopril; L-NAME; Nephropathy
Download this article as:| Copy the following to cite this article: Fouqueh C. E, Selim M. S, Awad H. A, Aly Labib D. A. Potential Effects of Empagliflozin in L-NAME- Induced Hypertensive Nephropathy in Albino Rats. Biomed Pharmacol J 2020;13(1). |
| Copy the following to cite this URL: Fouqueh C. E, Selim M. S, Awad H. A, Aly Labib D. A. Potential Effects of Empagliflozin in L-NAME- Induced Hypertensive Nephropathy in Albino Rats. Biomed Pharmacol J 2020;13(1). Available from: https://bit.ly/2xnn2uV |
Introduction
Hypertensive Nephropathy (HN) is a state of renal damage due to chronic high blood pressure (BP). It is a widely spread disease of increasing incidence [1].
Hypertension-induced renal injury is attributed to impaired renal autoregulation or due to a complex interaction between renin-angiotensin-aldosterone system (RAAS), oxidative stress, and endothelial dysfunction [2].
According to the current guidelines, the most effective treatment of proteinuric renal diseases whether diabetic or not is angiotensin converting enzyme inhibitors (ACEI) or angiotensin II type 1 receptor blockers (ARBs). However, being usually ineffective alone or due to their undesirable adverse effects, potential new treatments are identified [3].
Empagliflozin is a sodium glucose co-transporter 2 inhibitor (SGLT2i) which proved to be a very effective anti-hyperglycemic agent approved for the treatment of type 2 diabetes mellitus (T2DM). It has shown well characterized effects in lowering blood pressure in diabetes [4].
Other studies conducted that it had a reactive oxygen species scavenging effect [5]. Moreover, empagliflozin has been shown to have renoprotective effects with end organ protection in diabetic kidney disease through modulation of regulatory pathways [6].
Therefore, empagliflozin showed to be an attractive candidate for study as a protective agent in HN. This study aimed to explore its potential effects in a rat model of HN. To our knowledge, no other investigations had been done on empagliflozin regarding this concern.
Material and Methods
Drugs and Kits
Empagliflozin
(Boehringer Ingelheim Pharmaceuticals, Inc., CT, USA, Eli Lilly and Company, Indiana, USA). L-NG-Nitroarginine methyl ester (L-NAME) powder (Sigma/Aldrich, USA). Lisinopril (Astrazeneca Egypt, under license of Astrazeneca UK). Rat Malondialdhyde (MDA) Kit, used for measurement of tissue MDA (Ray Bio, USA).
Animals Used
A total of 50 male adult Sprague-Dawley albino rats, matched for age and weight (between 210 and 230 g), were housed in the animal house of Kasr Al-Aini, Medical school of Cairo University. After acclimatization for two weeks, they were randomly divided into five groups (10 rats each). Animals were caged (every two rats housed in a separate cage) in a fully ventilated room at room temperature with natural daily light/ dark cycle. They were maintained on standard rat chow and water ad libitum. All experiments followed the guidelines of the Institutional Animal Care and Use Committee (IACUC) Cairo University, approval number (CU/III/S/2/16), which comply with the international laws for use and care of laboratory animals.
Experimental Design and Animal Grouping
The animals were divided into five groups; each consists of 10 animals as follows:
A- Group I (-ve Control group)
Rats in this group received distilled water orally by oral gavage for 6 weeks. This group served as the -ve control group.
B- Group II (L-NAME- Induced, Hypertensive)
Rats in this group received L-NAME only by oral gavage at a dose of 75 mg/kg/day for 6 weeks as described by Öktem et al. [7]. This group served as the +ve control group or the hypertensive control group.
C- Group III (L-NAME+ Empagliflozin, Empagliflozin-Treated)
Rats in this group received empagliflozin by oral gavage at a dose of 10 mg/kg/day according to Vickers et al. [8] in combination with oral L-NAME at a dose of 75 mg/kg/day for 6 weeks.
D- Group IV (L-NAME+ Lisinopril, lisinopril-treated)
Rats in this group received lisinopril by oral gavage at a dose of 10 mg/kg/day as described by Kojima, et al. [9] in combination with oral L-NAME at a dose of 75 mg/kg/day for 6 weeks.
E- Group V (L-NAME+ Empagliflozin + Lisinopril, combined- treated)
Rats in this group received empagliflozin at a dose of 10 mg/kg/day + lisinopril at a dose of 10 mg/kg/day by oral gavage in combination with oral L-NAME at a dose of 75 mg/kg/day for 6 weeks.
Induction of Hypertensive Nephropathy
Hypertension was induced in a total number of 40 rats (group II, III, IV and V) using freshly daily prepared L-NAME added to drinking water and given orally for six weeks, at a dose of 75 mg/kg/day as described by Öktem et al. [7] for six weeks.
Blood Pressure Measurement
The tail was passed through a miniature cuff with a tail-cuff sensor attached to an amplifier (ML 125 NIBP, AD Instruments, Australia) [10]. Blood pressure was measured using rat tail cuff blood pressure measuring system (Harvard Apparatus Ltd, Edenbridge, Kent, England) [11]. Blood pressure was recorded at the same time of the day at; the start, three weeks later and at the end of the experiment. Mean arterial pressure (MAP) was calculated using the following equation: diastolic blood pressure + 1/3 (systolic blood pressure – diastolic blood pressure) described by Rogers & Oosthuyse, [12].
Body Weight (BW) Measurement
A digital weighing balance (Max 1500g d 0.1g) by Adam equipment was used. Rats’ BW was measured at the same time of the day at the start, three weeks later and at the end of the study.
Biochemical Studies
For urine samples collection, rats were individually housed in metabolic cages to ensure separation efficiency of urine and faeces. Animals were allowed free access to water during sample collection time. Prior to using the samples for measurements, urine volume was measured per 24 hours and recorded, with values expressed in (ml/day). Collected samples were then centrifuged at 1500 rpm for 5 minutes and the clear supernatant was then stored at -20 °C and thawed just before use to measure urinary glucose execretion (UGE), albumin, creatinine and sodium levels. The urine volume was measured for all rats in all groups at the start, 3rd week and 6th week of the study.
Blood samples (about 1 ml) were obtained from the lateral tail vein of the animals and centrifuged at 3500 rpm for 15 minutes. Serum taken was then stored at -20 °C and thawed just before use to measure serum sodium, urea, creatinine, potassium. This procedure was done at the start, three weeks later and at the end of the study.
At the end of the experiment, the animals were sacrificed and the weight of kidneys` was recorded. Tissue from one kidney was homogenized in ice cold 100 mmol/l phosphate buffer (pH 7.4). Homogenates were centrifuged and the supernatant was used for biochemical analysis of tissue MDA content. The other kidney was also removed and kept in 10% phosphate buffered formalin. Samples were embedded in paraffin wax, and stained for routine pathological examination with Hematoxylin and Eosin (H&E staining) [13], Periodic Acid Schiff (PAS) [14] and Masson’s trichrome [15] Examination was performed by two blinded observers.
Measurement of Urine Volume
Urine volume was measured per 24 hours. Values were expressed in ml/day.
Measurement of Urine Albumin
Determination of urinary levels of albumin was done as described by Webster et al. [16]. Values were expressed in mg/day.
Measurement of Urine Creatinine
Determination of urinary levels of creatinine was done as described by Bowers and Wong [17]. Values were expressed in mg/dl.
Measurement of Urine glucose
Determination of urinary levels of glucose was done as described by Zilversmit et al. [18]. Values were expressed in mg/day.
Measurement of Urine Sodium
Determination of urinary levels of sodium was done using flame photometry (NOVA Biochemical model NOVA 11, Waltham, MA). Values were expressed in mEq/L.
Measurement of Serum Urea
Determination of serum levels of urea was done as described by Shephard and Mezzachi, [19]. Values were expressed in mg/dl.
Measurement of Serum Creatinine
Determination of serum levels of urea was done as described by Bowers and Wong [17]. Values were expressed in mg/dl.
Measurement of Serum sodium
Determination of serum levels of sodium was done using flame photometry (NOVA Biochemical model NOVA 11, Waltham, MA). Values were expressed in mEq/L.
Measurement of Serum potassium
Determination of serum levels of potassium was done using flame photometry (NOVA Biochemical model NOVA 11, Waltham, MA). Values were expressed in mmol/L.
Measurement of renal malondialdehyde (MDA)
Renal MDA, lipid peroxidation product, was measured in renal tissue homogenates as described by Zdenek, et al. [20], values were expressed in nmol/gm tissue weight.
Statistical methodology
Data were coded and entered using the statistical package SPSS version 25. Data was summarized using mean and standard deviation for quantitative variables. Comparisons between groups were done using analysis of variance (ANOVA) with multiple comparisons post hoc test in normally distributed quantitative variables while non-parametric Kruskal-Wallis test and Mann-Whitney test were used for non-normally distributed quantitative variables [21]. P-values less than 0.05 were considered statistically significant.
Results
Mean arterial pressure (MAP)
At the beginning of the study, there was no significant difference in the MAP values among the 5 studied groups. At the 3rd and 6th weeks of the study, the hypertensive group showed statistically significant increase in the mean values of MAP compared to the –ve control group. Empagliflozin caused non-significant decrease in the MAP. Meanwhile, the lisinopril- treated and the combined treated groups showed statistically significant reduction (p<0.05) in the MAP compared to the hypertensive group at the 3rd and 6th weeks of the study. The reduction was statistically significant (p<0.05) in the combined group compared to the lisinopril-treated group (Fig. 1).
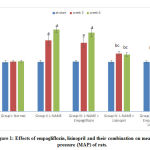 |
Figure 1: Effects of empagliflozin, lisinopril and their combination on mean arterial pressure (MAP) of rats. |
Mean body weight
At the beginning of the study, there was no statistically significant difference in the rats’ mean BW among the studied groups. The hypertensive group showed no statistically significant increase in the mean values of BW compared to the –ve control group at the 3rd and the 6th weeks. Lisinopril treated group showed non- significant decrease in the mean BW at the 3rd and the 6th weeks. Meanwhile, both the empagliflozin- treated group and the combined group showed non- significant decrease in BW values at the 3rd week with significant reduction in its value (p<0.05) at the 6th week compared to the hypertensive group. There was no statistically significant difference between the reductions caused by the two groups at the 6 th week. (Fig. 2).
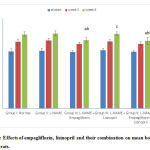 |
Figure 2: Effects of empagliflozin, lisinopril and their combination on mean body weight (BW) of rats. |
Biochemical results
Mean 24 hr urine volume
At the beginning of the study, there was no statistically significant difference in the mean 24 hr urine volume levels among the studied groups. At the 3rd and 6th weeks of the study, the hypertensive group showed non-significant decrease in the mean values of 24 hr urine volume compared to the –ve control group. Empagliflozin-treated, lisinopril-treated and the combined groups all showed statistically significant increase (p<0.05) in the mean 24 hr urine volume at the 3rd and 6th weeks of the study. In addition, the increase in urine volume by empagliflozin was statistically significant (p<0.05) compared to lisinopril. As for the combined treated group, there was a statistically significant increase (p<0.05) in the mean 24 hr urine volume compared to both treated groups (Fig. 3).
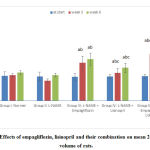 |
Figure 3: Effects of empagliflozin, lisinopril and their combination on mean 24 hr urine volume of rats. |
Mean 24 hr urinary glucose excretion (UGE)
At the beginning of the study, there was no statistically significant difference in the mean 24 hr UGE levels among the studied groups (Figure 4). At the 3rd and 6th weeks of the study, the hypertensive group showed no statistical difference in the mean values of 24 hr UGE compared to the –ve control group. The lisinopril- treated group showed non-significant change compared to the hypertensive group. Meanwhile, the empagliflozin-treated and the combined group showed statistically significant (p<0.05) increase in the 24 hr UGE compared to the control group. No statistically significant difference was found between the increases in the two groups. (Fig. 4).
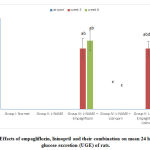 |
Figure 4: Effects of empagliflozin, lisinopril and their combination on mean 24 hr urinary glucose excretion (UGE) of rats. |
Mean 24 hr urine albumin
At the beginning of the study, there was no statistically significant difference in the mean 24 hr urine albumin levels among the studied groups. At the 3rd and 6th weeks of the study, the hypertensive group showed statistically significant increase (p<0.05) in the mean values of 24 hr urine albumin compared to the –ve control group. Empagliflozin- treated, showed non- significant change compared to the hypertensive group. Lisinopril- treated and combined- treated groups showed statistically significant reduction (p<0.05) compared to group II. The difference between the two groups was statistically significant (p<0.05) (fig. 5).
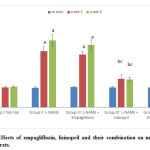 |
Figure 5: Effects of empagliflozin, lisinopril and their combination on mean 24 hr urine albumin of rats. |
Mean urine creatinine levels
At the beginning of the study, there was no statistically significant difference in the mean urine creatinine levels among all the groups. At the 3rd and 6th weeks of the study, the hypertensive group showed statistically significant reduction in the mean values of urine creatinine as compared to the –ve control group. The empagliflozin treated showed non-significant change, whereas, both the lisinopril-treated and the combined-treated showed statistically significant increase (p<0.05) compared to the hypertensive group with a statistically significant difference (p<0.05) between the two results (Fig. 6).
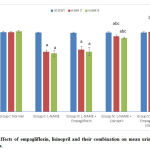 |
Figure 6: Effects of empagliflozin, lisinopril and their combination on mean urine creatinine levels of rats. |
Mean urine sodium levels
At the beginning of the study, there was no statistically significant difference in the mean urine sodium levels among the different groups. At the 3rd and 6th weeks of the study, the hypertensive group showed no statistically significant change in the mean values of urine sodium as compared to the control group at the 3rd week and the 6th week. The three treated groups showed non-significant changes compared to the hypertensive group with no significant differences between them. (Fig. 7).
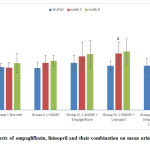 |
Figure 7: Effects of empagliflozin, lisinopril and their combination on mean urine sodium levels of rats. |
Mean serum urea levels
At the beginning of the study, there was no statistically significant difference in the mean serum urea levels among all the groups. At the 3rd and 6th weeks of the study, the hypertensive group showed statistically significant increase (p<0.05) in its mean values compared to the –ve control group. The empagliflozin treated, showed non-significant decrease compared to the hypertensive group. Lisinopril-treated and the combined- treated group showed statistically significant reduction (p<0.05) compared to the hypertensive group, with a statistically significant difference (p<0.05) between the two results (Table 1).
Table 1: Effects of empagliflozin, lisinopril and their combination on mean serum urea levels of rats
|
|
Group I: Normal | Group II: L-NAME | Group III:
L-NAME +Empagliflozin |
Group IV:
L-NAME +Lisinopril |
Group V:
L-NAME +Empagliflozin +Lisinopril |
| Serum urea (mg/dl) at the start
Serum urea (mg/dl) at 3rd week
Serum urea (mg/dl) at 6th week |
37.54±0.82
37.38±1.13
38.18±0.77 |
37.68±0.85
49.33±1.75a
57.33±1.42a |
38.28±0.98
47.28±3.52a
53.62±4.34a |
38.31±1.02
42.44±2.2bc
43.03±1.71bc |
37.43±0.76
37.37±1.14bcd
38.22±2.18bcd |
Values are presented as mean ±SD (n =10).
a statistically significant compared to corresponding value in group I (P<0.05)
b statistically significant compared to corresponding value in group II (P<0.05)
c statistically significant compared to corresponding value in group III (P<0.05)
d statistically significant compared to corresponding value in group IV (P<0.05)
Mean serum creatinine levels
At the beginning of the study, there was no statistically significant difference in the mean serum creatinine levels in the different groups. At the 3rd and 6th weeks of the study, the hypertensive group showed statistically significant increase (p<0.05) in its mean values compared to the –ve control group. Empagliflozin-treated, showed non-significant change compared to hypertensive group. Lisinopril-treated and combined-treated showed statistically significant reduction (p<0.05) compared to the hypertensive group with a statistically significant difference between them (Table 2).
Table 2: Effects of empagliflozin, lisinopril and their combination on mean serum creatinine levels of rats
| Group I: Normal | Group II: L-NAME | Group III:
L-NAME +Empagliflozin |
Group IV:
L-NAME +Lisinopril |
Group V:
L-NAME +Empagliflozin +Lisinopril |
|
| Mean serum creatinine (mg/dl) at the start
Mean serum creatinine (mg/dl) at 3rd week
Mean serum creatinine (mg/dl) at 6th week |
0.2±0.01
0.21±0.01
0.21±0.02 |
0.21±0.02
1.07±0.1a
1.29±0.21a |
0.2±0.02
0.97±0.08a
1.19±0.1a |
0.2±0.02
0.38±0.04abc
0.42±0.04abc |
0.2±0.01
0.22±0.02bcd
0.22±0.03bcd |
Values are presented as mean ±SD (n =10).
a statistically significant compared to corresponding value in group I (P<0.05)
b statistically significant compared to corresponding value in group II (P<0.05)
c statistically significant compared to corresponding value in group III (P<0.05)
d statistically significant compared to corresponding value in group IV (P<0.05)
Mean serum sodium levels
At the beginning of the study, there was no statistically significant difference in the mean serum sodium levels among the different groups. At the 3rd and 6th weeks of the study, the hypertensive group showed no statistically significant change in the mean values of serum sodium compared to control group. The three treated groups showed non-significant changes compared to the hypertensive group with no significant differences between them.
Table 3: Effects of empagliflozin, lisinopril and their combination on the mean serum sodium levels of rats.
| Group I: Normal | Group II:
L-NAME |
Group III:
L-NAME +Empagliflozin |
Group IV:
L-NAME +Lisinopril |
Group V:
L-NAME +Empagliflozin +Lisinopril |
|
| Mean serum sodium (mEq/L) at the start
Mean serum sodium (mEq/L) at 3rd week
Mean serum sodium (mEq/L) at 6th week |
140.75±3.33
141.61±3.4
142.38±3.41 |
141.27±2.65
142.83±2.44
142.93±2.09 |
140.26±3.11
139.79±2.63
139.11±1.57 |
140.46±2.05
139.43±2.33
138.67±2.03
|
140.38±4.23
138.44±1.84
138.53±2.06
|
Mean serum potassium levels
At the beginning of the study, there was no statistically significant difference in the mean serum potassium levels among the studied groups. At the 3rd and 6th weeks of the study, the hypertensive group showed no statistically significant change in the mean values of serum potassium compared to control group. Empagliflozin-treated showed no significant difference as compared with hypertensive group. Meanwhile, lisinopril-treated and combined-treated groups showed statistically significant increase (p<0.05) in comparison to the hypertensive group with no significant difference found between the two groups (Table 4).
Table 4: Effects of empagliflozin, lisinopril and their combination on the mean serum potassium levels of rats.
| Group I: Normal | Group II: L-NAME | Group III:
L-NAME +Empagliflozin |
Group IV:
L-NAME +Lisinopril |
Group V:
L-NAME +Empagliflozin +Lisinopril |
|
| Mean serum potassium (mmol/L) at the start
Mean serum potassium (mmol/L) at 3rd week
Mean serum potassium (mmol/L) at 6th week |
4.21±0.27
4.22±0.21
4.21±0.22 |
4.21±0.23
4.32±0.17
4.32±0.18 |
4.21±0.21
4.22±0.21
4.23±0.19 |
4.2±0.22
5.62±0.39abc
5.69±0.27abc |
4.2±0.21
5.6±0.51abc
5.66±0.45abc |
Values are presented as mean ±SD (n =10).
a statistically significant compared to corresponding value in group I (P<0.05)
b statistically significant compared to corresponding value in group II (P<0.05)
c statistically significant compared to corresponding value in group III (P<0.05)
Mean kidney weights
At the end of the study, mean rats’ kidney weights in the hypertensive group showed statistically significant reduction compared to the –ve control group. Empagliflozin-treated, lisinopril-treated and the combined treated showed statistically significant increase (p<0.05) in kd weights compared to the hypertensive group. There was statistically significant difference (p<0.05) found between empagliflozin-treated and lisinopril-treated groups. There was a statistically significant difference (p<0.05) between the combined- treated group and each of the empagliflozin and lisinopril-treated groups at the end of the study (Table 5).
Table 5: Effects of empagliflozin, lisinopril and their combination on mean kidney weights and renal malondialdehyde (MDA) levels of rats
| Group I: Normal | Group II:
L-NAME |
Group III:
L-NAME +Empagliflozin |
Group IV:
L-NAME +Lisinopril |
Group V:
L-NAME +Empagliflozin +Lisinopril |
|
| Mean kidney weights (gm) at the end of the study
Mean renal MDA (nmol/gm tissue) at the end of the study |
1.48±0.48
48.21±8.05 |
0.90±0.11a
154.41±13.73a |
1.02±0.07ab
120.36±11.4ab |
1.22±0.1abc
98.33±12.72abc |
1.43±0.05bcd
73.26±8.3abcd |
Values are presented as mean ±SD (n =10).
a statistically significant compared to corresponding value in group I (P<0.05)
b statistically significant compared to corresponding value in group II (P<0.05)
c statistically significant compared to corresponding value in group III (P<0.05)
d statistically significant compared to corresponding value in group IV (P<0.05)
Mean renal malondialdehyde (MDA) level
At the end of the study, the hypertensive group showed statistically significant elevation in the mean values of renal MDA compared to control group. Empagliflozin-treated, lisinopril treated and the combined- treated groups all showed statistically significant reduction (p<0.05) compared to the hypertensive group. A statistically significant difference (p<0.05) was found between empagliflozin and lisinopril- treated groups. There was a statistically significant difference between the combined group and each of the treated groups in the mean renal MDA (Table 5).
Results of the pathological study of the kidneys of the different studied groups
Microscopic examination
Group I (-ve control)
In group I, H&E staining shows normal renal tissue where normal renal Malpighian corpuscle showing intact bowman’s capsule surrounding the glomeruli with intact basement membrane and normal tubular structure with normal lumen. PAS staining shows normal strong PAS reaction of the basement membrane of the renal corpuscle. Masson’s trichrome staining shows normal interstitium of the kidney with non-congested blood vessels and no fibrosis inbetween (Fig. 8).
Group II (L-NAME, hypertensive)
In group II, H&E staining shows extensive renal tissue damage in the form of glomerulosclerosis, manifested by thickening of the glomerular capillary basement membrane with the surrounding tubules showing hyaline casts deposition leading to obliterated lumen. The convoluted tubular lesion is manifested by attenuated tubular lining with numerous tubular hyaline casts. PAS staining shows shrunken glomeruli with patchy sclerosis. Masson’s trichrome staining shows interstitial congested vessels and tubular atrophy with hyaline casts deposition (Fig. 8).
Group III (L-NAME+ Empagliflozin, empagliflozin-treated)
In group III, H&E staining shows moderate glomerular lesion manifested by moderate glomerulosclerosis with hyaline casts and moderate mesangial expansion and proliferation. PAS staining shows moderate glomerulosclerosis. Masson’s trichrome staining shows thickened artery with perivascular fibrosis (Fig. 8).
Group IV (L-NAME+ Lisinopril, lisinopril-treated)
In group IV, H&E staining shows mild glomerular lesion manifested by mild glomerulosclerosis with moderate interstitial lymphoplasmacytic inflammatory cellular infiltrate. PAS staining shows mild thickening of the basement membrane of the glomeruli. Masson’s trichrome staining shows patchy interstitial fibrosis (Fig. 8).
Group V (L-NAME + Empagliflozin+Lisinopril, combined-treated)
In group V, H&E staining shows near normal glomerular structure (as the changes seen considered unremarkable) with bowman’s space surrounded by normal convoluted tubules. PAS staining shows minimal glomerularosclerotic changes. Masson’s trichrome staining minimal glomerulosclerosis of the tufts with non- congested blood vessels and near normal renal interstitium with only minimal patchy fibrosis (Fig 8).
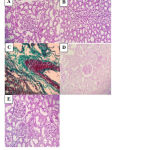 |
Figure 8: Histopathological sections of rat kidney in the different studied groups (A-E). |
A: Normal glomerulus and tubule (H&E x 400) in group I. B: Attenuated tubular lining with numerous tubular hyaline casts (H&E x 400) in group II. C: thickened artery with perivascular fibrosis (Masson’s Trichrome x 400) in group III. D: Mild thickening of glomerular basement membrane (PAS x 400) in group IV. E: Near normal renal structure with unremarkable glomerular and tubular changes (H&E x 400) in group V.
Discussion
To our knowledge, this is the first study investigating the potential effects of empagliflozin in a model of L-NAME-induced hypertension in albino rat. Hypertension is actually the second leading cause of ESRD. The oxidative stress has a basic role in the structural and functional renal damage in hypertensive rats [22].
Current therapeutic regimens aim at reduction of urinary protein excretion and control of blood pressure. Blocking the renin-angiotensin system (RAS) with ACEI or angiotensin II type 1 receptor blockers is the mainstay therapy in proteinuric renal diseases. However, they have several adverse effects and the need of combining other drugs is always recommended [3].
Empagliflozin is a potent highly selective SGLT2i and generally well tolerated for the treatment of type 2 diabetic patients. SGLT2 is the main co-transporter responsible for nearly 97% of glucose reabsorption in the proximal convoluted tubules (PCT). SGLT2i showed to have a blood pressure lowering effect in diabetes [4]. By lowering blood glucose levels and increasing UGE, it has a subsequent diuretic effect [23]. This creates a rationale for testing the therapeutic potential of this class of drugs in non-diabetic chronic kidney diseases. Our target was to assess the effects of empagliflozin alone and combined with lisinopril on different parameters in a rat model of L-Name-induced HN.
L-NAME induced a successful model of hypertension & hypertensive kidney disease. This was approved by the study of Ahmed et al. [10]. Treatment with oral empagliflozin, was associated with a non- significant decrease in the MAP at both; the 3rd & the 6th weeks. Its effects on preventing the rise in blood pressure did not reach significance, suggesting the need to test larger doses. This was in accordance with the results of Kusaka, et al. [24] but contradictory to Takeshige et al. [25] who found blood pressure lowering effect for the SGLTi.
Regarding lisinopril, it prevented the rise in blood pressure, the MAP was significantly lower at the 3rd week and the 6th weeks. As for the combined treated group, it was associated with a significant reduction in the MAP at both; the 3rd & the 6th weeks with near normal values to those of –ve control group. It is worthy to notice that no previous experiments have previously studied this combination whether in diabetic or hypertensive kidney disease. Moreover, it showed better anti- hypertensive effect than lisinopril- treated group at both the 3rd & the 6th weeks. This was supported by Kojima et al. [9, 26] in a near similar study.
Although the mechanisms responsible for the blood pressure lowering effects of SGLT2i remain unclear; yet natriuresis and decreased or improving arterial stiffness seem to be the main mediators responsible for this effect [27]. It was found that SGLT2i improved endothelial function and vascular compliance due to reduction of oxidative stress and inflammation [28, 29]. In the same context, blood pressure reduction by SGLT2 inhibitors was associated with a reduction in the arterial stiffness in diabetic patients [30, 31].
Regarding, the mean BW, the results of the current study suggested that L-NAME had no effect on mean BW of the rats; as no significant change was noticed at the 3rd week & the 6th week, as compared to the –ve group. This was in accordance with Ozkurt et al. [32]. On the contrary; these results was contradictory to those of Cheng, et al. [33].
As for lisinopril, it showed non- significant decrease in the mean BW at 3rd and 6th weeks of the study. Treatment with empagliflozin caused a non- significant decrease at the 3rd week followed by a significant decrease at the 6th week, as compared to the hypertensive group. This result was in accordance with Kusaka, et al., [24] but contradictory to Takeshige et al. [25] The hypothesis for weight loss was the glycosuria, which would be projected to produce weight loss of 2 to 3 pounds per month [34, 35]. Weight loss of 5 to 7 pounds is common after 3 or more months of treatment with SGLT2i [36]. The weight loss effect appears to plateau after about 6 months. One possible explanation for this is a gradual compensatory increase in calorie intake [37]. Weight loss may contribute to a reduction in albuminuria and glomerular hyperfiltration [38].
In the present study, a statistically significant reduction was detected in mean BW values in the combined group at the 6th week compared to the hypertensive group. No statistically significant difference, in the mean BW values, was detected between the combined group & empagliflozin- treated group. Thus; treatment with both drugs showed better results regarding weight loss compared to treatment with lisinopril alone, but not empagliflozin alone. Similar data was reported with luseogliflozin in combination with lisinopril by Kojima et al [9].
In the present study, L-NAME showed non-significant change in rats’ mean urine volume at both settings; the 3rd & the 6th weeks, as compared to the –ve control group. This finding was in accordance with those of Mojiminiyi, et al. [39] but opposite to those of Benter et al. [40].
All treated groups either; empagliflozin or lisinopril or the combined treatment showed statistically significant increase in the mean urine volume when compared to the hypertensive group at the 3rd & the 6th weeks. The results of empagliflozin increasing urinary volume came in accordance with Kusaka et al. [24]. The increase in urine volume by empagliflozin came statistically significant to that by lisinopril. This result was in accordance with Cassis et al. [6]. This was contradictory to the results of Kojima et al. [26]. Also, the combined treatment showed a significant increase in the mean urine volume compared to each of the drugs alone. This result was supported by the study of Kojima et al. [26].
In the present study, L-NAME showed no statistical change in the mean UGE as compared with the –ve control group at both; the 3rd & the 6th weeks. This result was in accordance with Suanarunsawat et al. [41]. As regards Lisinopril-treatment, it showed non-significant increase in the mean 24 hr UGE in comparison to the hypertensive group. Treatment with empagliflozin showed a statistically significant increase in the mean UGE compared to the hypertensive group. This result was in accordance with Takeshige el al. [25]. Though Gallo et al. [42] mentioned that treatment with empagliflozin in non-diabetic mice model increased UGE levels by less than 100 folds. The combination of both drugs showed a statistically significant increase in the mean UGE compared to hypertensive group with no signigicant difference compared to the results of the empagliflzin- treated group. This was supported by Kojima, et al. [9] studying a similar combination.
In the current study, L-NAME was associated with significant elevation in the means of; urine albumin, serum urea & serum creatinine and significant reduction in the mean urine creatinine level, compared to the –ve control group. These findings were in accordance with the results of Abd Allah and Shoman [43]. Empagliflozin administration was associated with a non-significant reduction in the means of urinary albumin levels, and renal functions; serum urea & serum creatinine and a non-significant elevation in the mean urine creatinine level compared to the hypertensive group. Similar data was found in Li et al. [44] study. Meanwhile, these results were disapproved by Gallo et al. [42].
Lisinopril treatment was associated with significant reduction in the means of albuminuria, serum urea & serum creatinine and a significant elevation in the mean urine creatinine level. The result of our study was in accordance with Kojima et al. [26]. However, they were contradictory to results of Cassis et al. [6]. Also the combination therapy (lisinopril+empagliflozin) caused statistically significant reduction in the means of albuminuria, serum urea & serum creatinine which came statistically significant compared to the reduction caused by Lisinopril. Meanwhile, it caused a statistically significant elevation in the mean urine creatinine level with a statistically significant difference when compared to lisinopril. Therefore, the dual RAS-SGLT2 inhibition in this study afforded greater reno-protection effect than administration of either drug alone. This result was in accordance with Kojima et al. [26].
Moreover, L-NAME caused non- significant change in the means of; urinary Na+ excretion, serum Na+ & serum K+ levels as compared with normal rats. These results were in accordance with those of Mojiminiyiet al. [39]. However; results of Xavier et al. [45] were not similar.Treatment with empagliflozin was associated with non- significant changes in the means of; urinary sodium excretion, serum Na+ & serum K+ levels as compared with hypertensive group. These results were in accordance with those of Al-Jobori & his colleagues [46]. Moreover; Kusaka and his colleagues [24] mentioned that treatment with empagliflozin increased significantly 24-h urinary Na+ excretions at the first week only of the experiment; similar results were concluded by Kulikov et al. [47].
Lisinopril was associated with non-significant changes in both; mean urinary and serum sodium excretion level with a significant increase in serum potasium compared to hypertensive group. In a near scenario study, Cassis et al. [6] found no significant difference in the mean serum sodium levels, with significant decrease in the mean urinary Na+ excretion, on lisinopril administration versus dapagliflozin. The authors referred the difference in the urinary sodium excretion, between the two drugs, to the significant increase in urinary Na+ excretion caused by the dapagliflozin while lisinopril kept the levels around normal values.
The combined treated group showed non- significant change in urinary sodium, serum sodium with a significant increase in serum potasium compared to the hypertensive group. No significant difference was found between the results of lisinopril and combined treated group regarding serum potassium.
At the end of this study, L-NAME showed statistically significant reduction in the mean kidney weights’ and a significant increase in renal MDA levels of the rats as compared with the –ve control group. This was in accordance with Cheng, et al. [33] but contradictory to Chandran et al. [48]. Empagliflozin treatment showed significant increase in mean kidney weights and significant reduction in the renal MDA means as compared with the hypertensive group. This came similar to results of Andreadou et al. [50] but opposite to those of Nagata et al. [49].
Lisinopril treatment was associated with; significant increase in the mean kidney weights and significant reduction in the mean renal MDA, when compared to empagliflozin-treated group. Contradictory results were concluded by Abdel-Wahab et al. [51]. Administration of both empagliflozin and lisinopril caused significant elevation in the mean kidney weights and significant reduction in the mean renal MDA, when compared with either drug alone. Similar data was reported by Abdel-Wahab et al. [51].
As for the pathological examination of rats’ kidney tissues, the findings in the hypertensive group were in agreement with Abd Allah and Shoman [43]. Treatment with empagliflozin alone attenuated the degree of glomerulosclerosis, compared to the hypertensive group. The results were in agreement with Lee et al. [52]. However, Gallo et al. [42] reported that glomerulosclerosis was increased and not affected by empagliflozin treatment. Regarding lisinopril treatment, it showed better results than empagliflozin alone concerning rats’ renal pathology. Administration of both empagliflozin and lisinopril was associated with near normal glomerular structure. These findings were in partial agreement with those of Kojima et al. [26].
Therefore, we deduced from our results that combined empagliflozin with lisinopril provided superior renoprotective effects than either drug alone. The improvement of renal injury is arttributed to decreased oxidative stress and cytokines due to blocking of RAAS [26]. Many hypotheses explain the nephroprotective effect exerted by empagliflozin. The ability of the combination to decrease blood pressure is a very important factor [27].
Normalization of the glomerular hyperfiltration has been involved in the mechanisms behind the renoprotective effect of SGLT2i. Sodium glucose co-transporters 2 decrease glucose and sodium reabsorption in the PCT which further decreases sodium to the macula densa, causing afferent arteriolar VD, and glomerular hyperfiltration [53]. SGLT2i restores solute delivery to the macula densa causing reversal of afferent VD and normalization of glomerular hyperfilteration. Among the mechanisms by which empagliflozin may normalize glomerular hyperfiltration is the decrease in renal blood flow and renal vascular resistance [54].
Another postulated mechanism for renoprotection is the relation of SGLT2i to RAAS [55]. SGLT2i mediates activation of the depressor arm of the RAAS. In contrast to the pressor arm of the RAAS, the depressor arm exerts beneficial effects in kidney diseases; both diabetic & hypertensive [56] . Muskiet & his colleagues, [57] mentioned that these favorable effects of SGLT2i-mediated activation of the depressor arm of the RAAS, may occur only in combination with RAAS inhibition by ACE inhibitors and ARBs. [30]. Further evidence will be required to elucidate the beneficial effects of RAAS activation by SGLT2i
Another postulation in the mechanisms of reno-protection of SGLT2i is its relation to erythropoietin (EPO). SGLT2i stimulate renal erythropoietin production. EPO attenuated albuminuria and reduced tubular injury, inflammation, and interstitial fibrosis by inhibiting inflammatory markers and oxidative stress [59, 28].
Conclusion
In summary; due to the increasing morbidity and mortality caused by hypertensive nephropathy, there is a continuous search for novel therapeutic strategies. Empagliflozin in combination with lisinopril can be introduced aiming to maximally reduce albuminuria, control blood pressure, and delay progression of HN to ESRD [55]. These new drug regimens attenuated the development of renal injury in the L-NAME-induced rat model of HN. Therefore, for those individuals in which nephroprotection by RAS blockade is only partial, SGLT2i could be a promising new class of drugs to provide further reno-protective benefits when added to ACE inhibitors or RAS blockers. We concluded that empagliflozin could show new insights in hypertensive kidney disease, especially in combination with lisinopril. A higher dose, longer duration of empagliflozin and other SGLT2i is recommended for further studying, alone and in combination with RAS blockade therapeutics in HN disease. Further researches to refine our results should be done.
Acknowledgment
The authors would like to thank dr. Lobna Omar El Farouk, assistant professor of pathology, faculty of medicine, cairo university for her effort in doing the pathological study.
Conflict of interest
No potential conflict of interest relevant to this article was reported.
Funding Source
The study did not receive any funds or financial support from any organization.
References
- Morgado, E., & Neves, P. L. Hypertension and chronic kidney disease: cause and consequence–therapeutic considerations. In: Babaei, H (ed). Antihypertensive drugs. Rijeka, Croatia; 2012; p.45-66.
- Mennuni, S., Rubattu, S., Pierelli, G., Tocci, G., Fofi, C., & Volpe, M. Hypertension and kidneys: unraveling complex molecular mechanisms underlying hypertensive renal damage. Journal of human hypertension; 2014; 28(2): 74.
- Perico, N., Ruggenenti, P., & Remuzzi, G. ACE and SGLT2 inhibitors: the future for non-diabetic and diabetic proteinuric renal disease. Current opinion in pharmacology; 2017; 33: 34-40.
- Kim, G., Jo, C., Kim, S., & Park, J. The antihypertensive effect of empagliflozin in rats with non-diabetic. Journal of Hypertension; 2017; 35: e174.
- Cheng, S. T. W., Chen, L., Li, S. Y. T., Mayoux, E., & Leung, P. S. The effects of empagliflozin, an SGLT2 inhibitor, on pancreatic β-cell mass and glucose homeostasis in type 1 diabetes; 2016; PloS one; 11(1): e0147391.
- Cassis, P., Locatelli, M., Cerullo, D., Corna, D., Buelli, S., Zanchi, C., … & Zoja, C. SGLT2 inhibitor dapagliflozin limits podocyte damage in proteinuric nondiabetic nephropathy. JCI insight; 2018; 3(15).
- Öktem, F., Kirbas, A., Armagan, A., Kuybulu, A. E., Yilmaz, H. R., Özguner, F., & Uz. Lisinopril attenuates renal oxidative injury in L-NAME-induced hypertensive rats. Molecular and cellular biochemistry; 2011; 352(1-2): 247
- Vickers, S. P., Cheetham, S. C., Headland, K. R., Dickinson, K., Grempler, R., Mayoux, E., … & Klein, T. Combination of the sodium-glucose cotransporter-2 inhibitor empagliflozin with orlistat or sibutramine further improves the body-weight reduction and glucose homeostasis of obese rats fed a cafeteria diet. Diabetes, metabolic syndrome and obesity: targets and therapy; 2014; 7: 265.
- Kojima, N., Williams, J. M., Takahashi, T., Miyata, N., & Roman, R. J. Effects of a new SGLT2 inhibitor, luseogliflozin, on diabetic nephropathy in T2DN rats. Journal of Pharmacology and Experimental Therapeutics; 2013; 345(3): 464-472.
- Ahmed, M. M., Mousa, N. M., Awad, H. A., Khorshid, O. A., Aldin, R. K., & Darweesh, M. F. Potential effect of sitagliptin on experimentally induced hypertensive nephropathy in Albino rats. World J Med Sci; 2016; 13(2): 93-102
- Irvine, R. J., White, J., & Chan, R. The influence of restraint on blood pressure in the rat. Journal of pharmacological and toxicological methods; 1997; 8(3): 157-162.
- Rogers, G., & Oosthuyse, T. A comparison of the indirect estimate of mean arterial pressure calculated by the conventional equation and calculated to compensate for a change in heart rate. International journal of sports medicine; 2000; 21(02): 90-95.
- Drury, R. A., Wallington, E. A. In: Carleton’s Histological Technique. 5th ed. 1980 Oxford University Press, Oxford.
- Sheehan, D. C. & Hrapchak B. B. In: Theory and Practice of Histotechnology. 2nd ed. St. Louis: Mosby; 1980. p. 164-168.
- Bancroft, J. D., & Stevens, A. In: Theory and Practice of Histological Techniques, 2nd ed. Churchill Livingstone. New York, Edinburgh, London; 1982.
- Webster, D., Bignell, A. H. C., & Attwood, E. C. An assessment of the suitability of bromocresol green for the determination of serum albumin. Clinica Chimica Acta; 1974; 53(1): 101-108.
- Bowers, L. D., & Wong, E. T. Kinetic serum creatinine assays. II. A critical evaluation and review. Clinical chemistry; 1980; 26(5): 555-561
- Zilversmit, D. B., Chaikoff, I. L., Feller,D. D., and Masoro, E. J. Oxidation of glucose labeled with radioactive carbon by normal and alloxan-diabetic rats. J. Biol. Chem. 1948;176: 389
- Shephard, M. D. & Mezzachi, R. D. Scientific and technical committee, Technical report no. 8. The collection, preservation, storage and stability of urine specimens for routine clinical biochemical analysis. Clin. Biochem.;1983; 4: 61-67.
- Zdenek, A. P., Cushman, L. L. & Conner, B. J. Estimation of product of lipid peroxidation (malondialdehyde) in biochemical systems. Anal Biochem;1966; 16: 359-364
- Chan, Y. H. Biostatistics 102: quantitative data–parametric & non-parametric tests. Blood pressure; 2003; 140:79.
- Kopkan, L., & Majid, D. S. Enhanced superoxide activity modulates renal function in NO-deficient hypertensive rats. Hypertension; 2006; 47(3): 568-572.
- Aoki, Y., Aoki, M., & Jenkins, D. J. A. Sodium-glucose co-transporter 2 inhibitors could improve the bioavailability of vitamin C at the kidney in diabetes treatment. Cell Mol Med; 2017; 3: 2.
- Kusaka, H., Koibuchi, N., Hasegawa, Y., Ogawa, H., & Kim-Mitsuyama, S. Empagliflozin lessened cardiac injury and reduced visceral adipocyte hypertrophy in prediabetic rats with metabolic syndrome. Cardiovascular diabetology; 2016; 15(1): 157.
- Takeshige, Y., Fujisawa, Y., Rahman, A., Kittikulsuth, W., Nakano, D., Mori, H., … & Nishiyama, A. A sodium-glucose co-transporter 2 inhibitor empagliflozin prevents abnormality of circadian rhythm of blood pressure in salt-treated obese rats. Hypertension Research; 2016; 39(6): 415.
- Kojima, N., Williams, J. M., Slaughter, T. N., Kato, S., Takahashi, T., Miyata, N., & Roman, R. J. Renoprotective effects of combined SGLT2 and ACE inhibitor therapy in diabetic Dahl S rats. Physiological reports; 2015; 3(7).
- Heerspink, H. J., Perkins, B. A., Fitchett, D. H., Husain, M., & Cherney, D. Z. Sodium glucose cotransporter 2 inhibitors in the treatment of diabetes mellitus: cardiovascular and kidney effects, potential mechanisms, and clinical applications. Circulation; 2016; 134(10): 752-772
- Cherney, D. Z., Perkins, B. A., Soleymanlou, N., Har, R., Fagan, N., Johansen, O. E., … & Broedl, U. C. The effect of empagliflozin on arterial stiffness and heart rate variability in subjects with uncomplicated type 1 diabetes mellitus. Cardiovascular diabetology; 2014a; 13(1): 28
- Chilton, R., Tikkanen, I., Cannon, C. P., Crowe, S., Woerle, H. J., Broedl, U. C., & Johansen, O. E. Effects of empagliflozin on blood pressure and markers of arterial stiffness and vascular resistance in patients with type 2 diabetes. Diabetes, Obesity and Metabolism; 2015; 17(12): 1180-1193.
- Ferrannini, E., Muscelli, E., Frascerra, S., Baldi, S., Mari, A., Heise, T., … & Woerle, H. J. Metabolic response to sodium-glucose cotransporter 2 inhibition in type 2 diabetic patients. The Journal of clinical investigation; 2014; 124(2): 499-508.
- Cherney, D. Z., Perkins, B. A., Soleymanlou, N., Maione, M., Lai, V., Lee, A., … & von Eynatten, M. Renal hemodynamic effect of sodium-glucose cotransporter 2 inhibition in patients with type 1 diabetes mellitus. Circulation; 2014 b; 129(5): 587-597.
- Ozkurt, M., Uzuner, K., Erkasap, N., Kus, G., Ozyurt, R., Uysal, O., … & Kutlay, O.. Erythropoietin Protects the Kidney by Regulating the Effect of TNF-α in L-NAME-Induced Hypertensive Rats. Kidney and Blood Pressure Research; 2018; 43(3): 807-819.
- Cheng, M. C., Wu, T. H., Huang, L. T., & Tain, Y. L. Renoprotective effects of melatonin in young spontaneously hypertensive rats with L-NAME. Pediatrics & Neonatology; 2014; 55(3): 189-195.
- Sjöström, C. D., Hashemi, M., Sugg, J., Ptaszynska, A., & Johnsson, E. Dapagliflozin‐induced weight loss affects 24‐week glycated haemoglobin and blood pressure levels. Diabetes, Obesity and Metabolism; 2015; 17(8); 809-812
- Kovacs, C. S., Seshiah, V., Swallow, R., Jones, R., Rattunde, H., Woerle, H. J. Empagliflozin improves glycaemic and weight control as add‐on therapy to pioglitazone or pioglitazone plus metformin in patients with type 2 diabetes: a 24‐week, randomized, placebo‐controlled trial. Diabetes, Obesity and Metabolism; 2014; 16(2): 147-158
- Abdul-Ghani, M. A., Norton, L., & DeFronzo, R. A. Role of sodium-glucose cotransporter 2 (SGLT 2) inhibitors in the treatment of type 2 diabetes. Endocrine reviews; 2011; 32(4): 515-531.
- Cherney, D. Z., Cooper, M. E., Tikkanen, I., Pfarr, E., Johansen, O. E., Woerle, H. J. et al. Pooled analysis of phase III trials indicate contrasting influences of renal function on blood pressure, body weight, and HbA1c reductions with empagliflozin. Kidney Int.; 2018; 93(1): 231-244.
- Alicic, R. Z., Patakoti, R., & Tuttle, K. R. Direct and indirect effects of obesity on the kidney. Advances in chronic kidney disease; 2013; 20(2): 121-127
- Mojiminiyi, F. B., Anigbogu, C. N., Sofola, O. A., & Adigun, S. A. Role of nitric oxide in salt and water excretion in experimental hypertension in hooded (Aguti) rats. The Nigerian postgraduate medical journal; 2007; 14(2): 99-104.
- Benter, I. F., Francis, I., Cojocel, C., Juggi, J. S., Yousif, M. H. M., & Canatan, H. Contribution of cytochrome P450 metabolites of arachidonic acid to hypertension and end‐organ damage in spontaneously hypertensive rats treated with l‐NAME. Autonomic and Autacoid Pharmacology; 2005; 25(4): 143-154
- Suanarunsawat, T., Klongpanichapak, S., & Chaiyabutr, N. Role of nitric oxide in renal function in rats with short and prolonged periods of streptozotocin‐induced diabetes. Diabetes, Obesity and Metabolism; 2001; 1(6): 339-346.
- Gallo, L. A., Ward, M. S., Fotheringham, A. K., Zhuang, A., Borg, D. J., Flemming, N. B., … & Koepsell, H. Once daily administration of the SGLT2 inhibitor, empagliflozin, attenuates markers of renal fibrosis without improving albuminuria in diabetic db/db mice. Scientific reports; 2016; 6; 26428
- Abd Allah, O. M. A., & Shoman, A. A. Renoprotective effect of saxagliptin and Hibiscus sabdariffa Linn extract in Nω-nitro-L-arginine methyl ester-induced hypertensive nephropathy in male albino rats: the role of proinflammatory and fibrogenic cytokines. Benha Medical Journal; 2017; 34(1): 17
- Li, L., Konishi, Y., Morikawa, T., Zhang, Y., Kitabayashi, C., Kobara, H., … & Nishiyama, A. Effect of a SGLT2 inhibitor on the systemic and intrarenal renin–angiotensin system in subtotally nephrectomized rats. Journal of pharmacological sciences; 2018; 137(2): 220-223.
- Xavier, F., Magalhães, A. M. F., & Gontijo, J. A. R. Effect of inhibition of nitric oxide synthase on blood pressure and renal sodium handling in renal denervated rats. Brazilian Journal of Medical and Biological Research; 2000; 33(3): 347-354.
- Al-Jobori, H., Daniele, G., Cersosimo, E., Triplitt, C., Mehta, R., Norton, L., … & Abdul-Ghani, M. Empagliflozin and kinetics of renal glucose transport in healthy individuals and individuals with type 2 diabetes. Diabetes; 2017; 66(7): 1999-2006
- Kulikov, A. N., Beresneva, O. N., Parastaeva, M. M., Okovityy, S. V., Ivanova, G. T., Ivkin, D. Yu. et al. Effect of empagliflozin on the condition of kidneys in normoglycemic rats with heart failure. Nephrology; 2017; 21 (2): 83-92.
- Chandran, G., Sirajudeen, K. N. S., Yusoff, N., Syamimi, N., Swamy, M., & Samarendra, M. S. Effect of the antihypertensive drug enalapril on oxidative stress markers and antioxidant enzymes in kidney of spontaneously hypertensive rat. Oxidative Medicine and Cellular Longevity; 2014
- Nagata, T., Fukuzawa, T., Takeda, M., Fukazawa, M., Mori, T., Nihei, T., … & Kawabe, Y. Tofogliflozin, a novel sodium–glucose co‐transporter 2 inhibitor, improves renal and pancreatic function in db/db mice. British journal of pharmacology; 2013; 170(3): 519-531.
- Andreadou, I., Efentakis, P., Balafas, E., Togliatto, G., Davos, C. H., Varela, A., … & Ikonomidis, I. Empagliflozin limits myocardial infarction in vivo and cell death in vitro: role of STAT3, mitochondria, and redox aspects. Frontiers in physiology; 2017; 8: 1077.
- Abdel-Wahab, A. F., Bamagous, G. A., Al-Harizy, R. M., ElSawy, N. A., Shahzad, N., Ibrahim, I. A., & Al Ghamdi, S. S. Renal protective effect of SGLT2 inhibitor dapagliflozin alone and in combination with irbesartan in a rat model of diabetic nephropathy. Biomedicine & Pharmacotherapy; 2018; 103: 59-66.
- Lee, K., Jin, H. Y., Lee, N. Y., Kim, Y. J., & Park, T. S. Effect of Empagliflozin, a Selective Sodium-Glucose Cotransporter 2 Inhibitor, on Kidney and Peripheral Nerves in Streptozotocin-Induced Diabetic Rats. Diabetes & metabolism journal; 2018; 42(4): 338-342.
- De Nicola, L., Gabbai, F. B., Liberti, M. E., Sagliocca, A., Conte, G., & Minutolo, R. Sodium/glucose cotransporter 2 inhibitors and prevention of diabetic nephropathy: targeting the renal tubule in diabetes. American Journal of Kidney Diseases; 2014; 64(1): 16-24.
- Škrtić, M., Yang, G. K., Perkins, B. A., Soleymanlou, N., Lytvyn, Y., von Eynatten, M., … & Silverman, M. Characterisation of glomerular haemodynamic responses to SGLT2 inhibition in patients with type 1 diabetes and renal hyperfiltration. Diabetologia; 2014 ;57(12): 2599-2602.
- Hart, P. D., & Bakris, G. L. Hypertensive nephropathy: prevention and treatment recommendations. Expert opinion on pharmacotherapy; 2010; 11(16): 2675-2686.
- Padda, R. S., Shi, Y., Lo, C. S., Zhang, S. L., & Chan, J. S. Angiotensin-(1-7): a novel peptide to treat hypertension and nephropathy in diabetes?. Journal of diabetes & metabolism; 2015; 6(10).
- Muskiet, M. H., van Raalte, D. H., van Bommel, E. J., Smits, M. M., & Tonneijck, L. Understanding Empa-Reg Outcome. The Lancet Diabetes & Endocrinology; 2015; 3(12): 928-929.
- Kawanami, D., Matoba, K., Takeda, Y., Nagai, Y., Akamine, T., Yokota, T., … & Utsunomiya, K. SGLT2 inhibitors as a therapeutic option for diabetic nephropathy. International journal of molecular sciences; 2017; 18(5): 1083.
- Serizawa, K., Yogo, K., Tashiro, Y., Aizawa, K., Kawasaki, R., Hirata, M., & Endo, K. Epoetin beta pegol prevents endothelial dysfunction as evaluated by flow-mediated dilation in chronic kidney disease rats. European journal of pharmacology; 2015; 767: 10-16.

