

Manuscript accepted on : 20 June 2017
Published online on: --
Plagiarism Check: Yes
Firoz Ahmad1 and Laxmi Goparaju2
1Vindhyan Ecology and Natural History Foundation, Mirzapur, Uttar Pradesh, India.
2Vindhya Bachao Secretariat, 36/30, Shivpuri Colony, Station Road, Mirzapur-231001, Uttar Pradesh, India.
Corresponding Author E-mail: goparajulaxmi@yahoo.com
DOI : http://dx.doi.org/10.13005/bbra/2491

ABSTRACT: Agroforestry has the capacity to reduce the poverty, enhance livelihood, improve food security and mitigate the climate change impact. The agroforestry suitability mapping is performed using geospatial technology based on similar guideline documented by FAO for Land suitability mapping. The study aims for applying remote sensing and GIS technology towards various spatial (soil and environmental) datasets in Dumka district of Jharkhand, India to achieve a nutrient availability and agroforestry suitability map. The Landsat satellite data, ASTER DEM and decadal annual rainfall datasets were utilized to generate wetness, landuse/ land cover (LULC), elevation, slope, and rainfall map. LULC map was utilized to identify the open area land in which agroforestry suitability was evaluated. Various thematic layers such as soil nitrogen (N), phosphorus (P), potassium (K), organic carbon (C), pH and sulphur (S) were used for generating nutrient availability map. The agroforestry suitability map was generated utilizing the layers viz. nutrient availability, slope, wetness, rainfall and elevation by GIS integration/modeling in ArcGIS 10.1 software by providing different weight to each thematic layer as per its importance in the study area. The thematic layer weight was calculated based on pairwise comparisons (a standard statistical procedure). Finally agroforestry suitability maps were generated in the form of high, medium and low grid with spacing (1km × 1km). We also generated poverty map, one of the complete watersheds in the part of the study area and drainage map in whole study area to understand its proximity toward high agroforestry suitability grid. The study shows that the total open area land grids were 3421 out of which 50% of grid was found to be highly suitable towards agroforestry. Furthermore a watershed, drainage pattern and poverty map were analyzed based on its proximity toward high agroforestry suitability. The study reveals high agroforestry suitability land grid proximity towards high poverty grid was approximately more than 70%, whereas the proximity to the drainage pattern was roughly 60%. One of the completed watershed in the part of the study area evaluation reveals approximately 50% of the watershed area grid has the proximity of high agroforestry suitable land grid. The high agroforestry suitability and its proximity/relationship with high poverty, drainage pattern and in watershed based analysis provides golden opportunity to the local poor people to harness agroforestry practices by adopting intensive soil and water conservation measures if supported by sufficient funds/technology will largely help in mitigating poverty and enhancing the livelihood. The ongoing agroforestry projects can be further extended in the open areas of high agroforestry suitability grid for long term benefits of diversified output.
KEYWORDS: Agroforestry suitability; FAO; Jharkhand, Dumka; Nutrient availability; GIS and remote sensing
Download this article as:| Copy the following to cite this article: Ahmad F, Goparaju L. Geospatial Approach for Agroforestry Suitability Mapping: to Enhance Livelihood and Reduce Poverty, FAO Based Documented Procedure (Case Study of Dumka District, Jharkhand, India). Biosci Biotech Res Asia 2017;14(2). |
| Copy the following to cite this URL: Ahmad F, Goparaju L. Geospatial Approach for Agroforestry Suitability Mapping: to Enhance Livelihood and Reduce Poverty, FAO Based Documented Procedure (Case Study of Dumka District, Jharkhand, India). Biosci Biotech Res Asia 2017;14(2). Available from: https://www.biotech-asia.org/?p=26059 |
Introduction
Agroforestry is an integration of trees with agriculture crops (spatial mixture) and /or animals has been practiced on the same land management unit since old times across the world in both the tropics and temperate geographical regions. Traditionally this agroforestry system provides diversified output 6Fs, i.e. food, fruit, fodder, fuel, fertilizer and fibre. Most of the agroforestry systems are part of old indigenous traditional knowledge of local/tribal community (Quli, 2001). Multifunctional and traditional resource management practice such as agroforestry systems has the huge potential on land-use options that enhance livelihood security and breaking/mitigating the poverty through simultaneous production of food, fodder and firewood and reduce vulnerability to climate and environmental change ( Kumar, 2016; Pandey, 2005).
In the year 1976 FAO has documented methods to evaluate the suitability of land. Land evaluation is defined as “the study of land performance/ capability when utilized for a specified purpose adequately, this includes the execution and interpretation of surveys and analysis of land forms, soils, vegetation, climate and other spatial characteristics of land in order to recognize and make a comparison of promising kinds of land use in terms of its suitability to the objectives of the evaluation” (FAO, 1976).
Various agroforestry system have been widely adopted in different countries because of its economic, social, and ecological benefits (Kumar, 2016; Depommier, 2003;Watson et al., 2000). Various research has shown agroforestry contribution towards farm productivity and incomes (Kumar, 2016; Verchot et al. 2007; Garrity, 2006), by growing specific high value of tree species on the farms/lands (Mbow et al. 2014), improves/enhance the soil and land fertility through biological nitrogen fixation, efficient nutrient cycling (Nair, 2011), improve livelihood security to weaker section (Sahoo, 2009;Kumar, 2016;Pandey, 2005), increase resilience of farming systems and on households (NRCAF 2013;Mbow et al. 2014), improve impacts of climate change adaptation and mitigation (Newaj et al. 2013;Schoeneberger et al. 2012;Thorlakson et al. 2012; Nguyen et al. 2013), conserving, shielding and safeguarding biodiversity (McNeely, 2004; McNeely& Schroth 2006; Jose, 2012) and ameliorating air and water quality (Anderson et al. 2009; Hernandez et al. 2012; Asbjornsen et al. 2014).
Agriculture is the core sector of the Indian economy; it accounts for about 34.8 percent of the national income and provides livelihood to 66.7 percent of the working population of the country. Nearly 75% of India’s families depend on rural incomes. The majority of India’s poor (some 770 million people or about 70 percent) are found in rural areas. India’s food security fully depends on producing agriculture crops, as well as increasing its production of fruits, vegetables and milk to meet the demands of a growing population with rising incomes. In India agriculture practice of small and marginal farmers which mostly depends on the monsoon. The climate change has changed the rainfall pattern and an increase in the severity and frequency of extreme weather events (Alley et al. 2007). Several suicide deaths of farmers reported per years from various part of India due to poor to nil agriculture productivity due to their dependency on monsoon rain. On an average 12000 farmers in India die each year by suicide due to poor performance of agriculture and diminishing livelihood/farm income (Mahapatra, 2017). In such uncertain monsoon situation the production of agriculture outputs have been put on risk thus agroforestry practice is the most viable alternative to meet the challenges of food, nutrition, energy, livelihood and environmental security. Seeing its potentiality to achieve sustainable growth, India became the first country in the world to adopt an agroforestry policy in the year 2014 (http://iksa.in/gs3/india-national-agroforestry-policy/860/).
Jharkhand retain old tradition to the practice of agroforestry system is the land rich in mineral, forest resources and land exhibit poor in agricultural production ( Singh et al. 2012) dominated by tribal, backward and weaker section of the population. Poverty in this state is among the highest in the country (World Bank, 2016). About a two-third of the districts of Jharkhand with more than 50% to 80% of the poor population (Singh et al. 2012) struggling for their livelihood and food. Dumka is among the poorest district, located in the north eastern part of the state of Jharkhand is also one of the drought prone districts. Agriculture is the main occupation here which exhibits low productivity because it is not managed scientifically. Thus in such situation there is an urgent need to harness the land for agroforestry practices intensively for achieving sustainable growth in the agriculture sector by optimizing the productivity (National Agroforestry Policy 2014). Thus finally we can conclude “there is an urgent need to harness agroforestry practices intensively” seeing its potentiality to reduce poverty by enhancing livelihood and house hold income.
Remote sensing, GIS with free data sets availability online became a boon for researchers in the mapping industry in recent decades. Various researchers have been widely used remote sensing and GIS to map and monitor urban sprawl, city mapping and predictions and urban forest suitability mapping (Ahmad and Goparaju 2016a; Ahmad et al. 2017b; Ahmad and Goparaju 2016b), natural resource (Ahmad et al. 2017a), mines expansion dynamic (Ahmad and Goparaju 2017a), malaria epidemic vulnerability identification (Qayum et al. 2015; Ahmad et al 2017c) and conservation prioritization and planning of forest land (Ahmad and Goparaju 2017b), but it has not been adequately utilized in the field of agroforestry (Ellis et al. 2000). Little study has been carried out based on utilizing the geospatial mapping approach for evaluating the land suitability towards agroforestry. Very recently Ahmad et al. (2017d) evaluated land suitability based on FAO guideline towards agroforestry of Chakardharpur subdivision of West Singhbhum district of Jharkhand, India utilizing the weight and ranks approach in GIS modeling. The thematic layers used for generating nutrient availability map were soil nitrogen (N), phosphorus (P), potassium (K), organic carbon (C), pH and sulphur (S) whereas agroforestry suitability map’s layers utilized were wetness, rainfall, slope, elevation, and nutrient availability map. The total open area was identified 42.4% out of which 21.6% area was found to have high suitability towards agroforestry. Reisner et al. (2007) studied land of part of Europe using the data soil, climate, topography, and land cover and integrated in GIS domain and identified agroforestry target regions for some tree species (Juglans spp., Prunus avium, Populus spp., Pinus pinea, and Quercus ilex) suitability. The study reveals Silvoarable agroforestry (SAF) systems have the adequate potentiality to mitigate the risk of soil erosion, nitrate leaching and increase landscape diversity. Ritung et al. (2007) recommended land suitability towards various agroforestry crops based on documented FAO guideline by evaluating of land suitability of Aceh Barat District of Indonesia utilizing climatic, soil and topographical data.
Yedage et al. (2013) followed FAO guideline and studied land suitability towards agroforestry fruits crop (Pomegranate) in the Sangola Tahsil of Solapur district of Maharashtra, India using multi-criteria approach in GIS domain. The spatial layers used for analysis are slope, soil pH, soil organic carbon, soil NPK, soil texture, soil electric conductivity, soil depth, ground water availability and the present land use/ land cover (LULC). The analysis reveals aproximately 27 % and 18% of study area land is highly and moderately suitable respectively for fruit crop (pomegranate). Ahmad and Goparaju (2016 b) analyzed land suitability towards urban forest trees of Ranchi city, Jharkhand, India using weighted mean approach in GIS domain. The spatial parameter used for study was wetness, slope, soil organic carbon, drainage buffer and urban buffer. They identified the potential sites within the existing open space for urban forest trees were 27% as highly suitable, 38% as medium suitable and 35% as least suitable.
The objective in the present study is to evaluate land (open area) suitability towards agroforestry using geospatial technology. Such data is not presently available for agroforestry policy/decision makers, is a research gap. The study area selected was Dumka district of Jharkhand state of India because this region suffers from drought and people face poverty.
The study aims for applying RS and various GIS datasets of land, soil, climate and topographical to manifest its trends and relationship and production of soil nutrient availability and agroforestry suitability map in the open area. We also produced poverty map, one of the complete watersheds in the part of the study area and drainage map for whole study area to understand its vicinity toward high agroforestry suitability grid.
Materials and Methods
The Study Area
The geographical coordinates of the study area comprise of Latitude 23 º 58′ 56” N to 24 º 38′ 25”N and Longitude 86º 52′ 50”E to 87º 41′ 48” E, whereas total geographical area roughly is 3,771 km² (Figure 1). The elevation varies from 27 to 491 m from the mean sea level. The administrative headquarters of this district is Dumka which is primarily rural dominated area with the large population still residing in the villages. The decadal rainfall average varies from 1088 mm to 1244 mm. The total population of the district 2011 census has been recorded as 1,321,096 whereas the tribal population is 43% of the total population. Agriculture practices are the main source of economy for the rural people of the district.
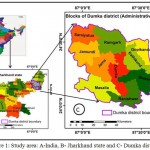 |
Figure 1: Study area: A-India, B- Jharkhand state and C- Dumka district Click here to View figure |
Data Preprocessing and Analysis
The satellite data (Table 1) used for the study was Landsat-8 OLI (Path/ Row: 139/43, dated 28-12-2015) having spatial resolution 30 m with projection system (UTM- Zone 45). The Landsat satellite data of the study area (Dumka district of Jharkhand) was downloaded from the website of United States Geological Survey (USGS). The satellite image was found free from clouds and geometrically corrected to carry out our study. Various bands of the image were layer stacked to obtain a single composite image for further analysis and evaluation. The scene was subset using the study area vector file. This subset satellite image was used to generate wetness map and land use/land cover (LULC) map for further study.
Table 1: Landsat 8 OLI data and its specification
| Satellite | Sensor | Path/ Row | Dates |
| Landsat 8 | OLI_TIRS | 139/43 | 28-12-2015 |
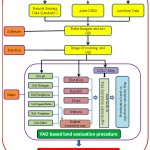 |
Figure 2: Flowchart for agroforestry suitability mapping Click here to View figure |
ASTER DEM (30m resolution) of the study area was obtained by downloading it from the USGS website for further analysis. Thematic layer such as slope and elevation were generated from study area DEM using spatial analyst tools of ArcGIS Software. Ancillary decadal rainfall data (1993-2002) was downloaded (Indian Water Portal 2016) and used to obtain rainfall map based on interpolation method. The detail of the methodology is presented in flowchart (Figure 2).
Generation of Various Thematic Layers for Nutrient Availability Mapping
Dumka district soil map viz. nitrogen (N), phosphorus (P), potassium (K), organic carbon (C), pH and soil sulphur (S) was utilized and each map was projected, digitized and polygon id was assigned and brought in GIS domain (Figure 3).
Generation of Various Thematic Layers for Agroforestry Suitability Mapping
Digital Elevation Model
Altitude/elevation is considered as an important parameter in agroforestry (Bijalwan et al. 2015) suitability mapping and the tree growth declined with high altitude (Coomes and Allen, 2007). Temperature and vegetation decreases due to increase in altitude/elevation. Tree doesn’t grow above tree line/timber line due to presence of low air pressure and reduced level of carbon dioxide. Carbon dioxide is needed for plant metabolism and growth. The elevation map was further reclassified into three sub groups and new values were re-assigned based upon the agroforestry potentiality, were ranked as 3, 2, and 1 and described as high, medium, low, respectively (Figure 5).
Rainfall Intensity
Rainfall intensity and spatial pattern is considered as an important influential climatic parameter in crop/tree production. Increase in rainfall shows positive correlation with the plant growth and widely used in agroforestry suitability mapping (Ahmad et al. 2017d). The decadal annual rainfall data from the year 1993 to the year 2002 (10 years average) was used to generate spatial rainfall pattern (continuous surface) in ArcGIS software by kriging interpolation technique. Based upon agroforestry potentiality, the rainfall map was further classified into three classes (<1000, 1000-1100, >1100 mm); were ranked as 1, 2 and 3 and described as low, medium and high, respectively (Figure 5).
Slope Percent
The steepness of a slope of land affects plant growth. Steeper/high slopes allow faster movement of water thus increases soil erosion and soil loss. Land with low slopes is potential good for plant growth as water stays there for some period provides adequate moisture to the soil. Thus the low slopes areas are more favorable for agroforestry than steep/high slopes area. The slope was generated from aster DEM and it was reclassified into three groups (<5°, 5-15°, >15°) and were ranked as 3, 2, and 1 with high, moderate and low respectively (Figure 5).
Wetness Index
Soil wetness is the important parameter for any type of plant growth. Adequate soil moisture improves the nutrient uptake in plant (http://broome.soil.ncsu.edu/ssc051/Lec3.htm) therefore it is an important parameter for adopting any agroforestry practices. Baig et al. (2014) have developed a formula for deriving wetness by generating different coefficient for Landsat -8 images which was widely accepted by scientific communities (Table 2). Based upon suitability towards agroforestry, the wetness map surface value was grouped into three classes (<-0.20, -0.20 to 0.0, >0.0) have been identified and were ranked as 1, 2 and 3 with description of low, medium and high, respectively (Figure 5).
Table 2: Wetness coefficients for Landsat 8 OLI reflectance
| Band | Blue | Green | Red | NIR | SWIR 1 | SWIR 2 |
| Wetness | 0.1511 | 0.1973 | 0.3283 | 0.3407 | -0.7117 | -0.4559 |
LULC Mapping
The Landsat FCC image was analyzed to obtain a LULC map. The supervised classification technique was used over the images with providing 10-15 training sets of each clearly visible class distributed uniformly throughout the whole image. Image alarm technique was executed to understand, validate and finalize the each class training sets. All derived classified dataset retain four classes namely vegetation, water, settlement and open area. The derived open area land in our study was evaluated for the agroforestry suitability mapping was the objective of this research. The potentially suitable site in this area should be identified for further agroforestry extension / development projects.
Agroforestry Mapping Parameters
The various potential themes (Figure 5) which is important for the growth of various agroforestry plants are nutrient availability, slope, wetness, rainfall and elevation (written in order of importance) whose weights were statistically evaluated. Pairwise comparison introduced by Saaty et al 1980 was used for calculating weight for each thematic maps (Table 3 and 4).
Table 3: Pairwise comparison matrix
| Criteria | Pairwise comparison matrix | ||||
| Nutrient availability | Slope | Wetness factor | Rainfall | Elevation | |
| Nutrient availability | 1 | 2 | 2 | 3 | 3 |
| Slope | 1/2 | 1 | 2 | 3 | 6 |
| Wetness factor | 1/2 | 1/2 | 1 | 2 | 4 |
| Rainfall | 1/3 | 1/3 | 1/2 | 1 | 2 |
| Elevation | 1/3 | 1/6 | 1/4 | 1/2 | 1 |
Table 4: Normalized matrix of various thematic layer with weight
| Criteria | Normalized pairwise comparison matrix | ||||||
| Nutrient availability | Slope | Wetness factor | Rainfall | Elevation | Priority vector | Weight (%) | |
| Nutrient availability | 0.375 | 0.5 | 0.3478 | 0.3158 | 0.1875 | 0.35 | 35 |
| Slope | 0.1875 | 0.25 | 0.3478 | 0.3158 | 0.375 | 0.296 | 29.6 |
| Wetness factor | 0.1875 | 0.125 | 0.1739 | 0.2105 | 0.25 | 0.187 | 18.7 |
| Rainfall | 0.125 | 0.08333 | 0.0869 | 0.1026 | 0.125 | 0.104 | 10.4 |
| Elevation | 0.125 | 0.04666 | 0.0435 | 0.0513 | 0.0675 | 0.063 | 6.3 |
| Consistency Ratio (CR) = 4.2% Principal Eigen Value = 5.19 | |||||||
Table 5: Weight matrix for parameters for agroforestry suitability mapping
| Agroforestry factor | Weight
(%) |
Value/Description | Ranks | Suitability |
| Nutrient availability | 35 | Three categories based on weighted average output | 3
2 1 |
High
Medium Low |
| Slope | 30 | <5
5-15 > 15 |
3
2 1 |
High
Medium Low |
| Wetness factor | 19 | Three categories based on weighted average output | 1
2 3 |
Low
Medium High |
| Rainfall | 10 | <1000 mm
1000-1100mm >1100mm |
1
2 3 |
Low
Medium High |
| Elevation | 6 | <300 meter
300-400 meter >400 meter |
3
2 1 |
High
Medium Low |
Agroforestry Suitability Analysis
The GIS modeling was performed by integrating all thematic layers with their calculated/derived weightage (Table 5) using weighted overlay technique. Agroforestry suitability mapping grid (1km X 1km) was finally obtained based on their surface values and they are further classified into 3 agroforestry suitability classes (high, medium and low).
Results and Discussion
Nutrient Availability Mapping
Canopy growth in crops/trees is directly affected by availability of soil nutrient to them ( Hartz-Rubin and DeLucia, 2001). The potential soil nutrient layers which are essential for plant growth such as nitrogen, phosphorus, potassium, sulpher, pH and organic carbon were used for the generation of nutrient availability map. Various agroforestry plant need adequate soil nutrient for its growth and its metabolic activity. Nutrient availability map (Figure 4) was generated by providing equal weights (Table 6) to all soil nutrient layers. Similar study has been carried out by Ahmad et al. (2017d) for land suitability mapping for agroforestry crop in part of Jharkhand state of India.
Table 6: Weight matrix for parameters and ranking for nutrient availability mapping
| Nutrient factor | Weight factor | Value/Description | Ranks | Suitability |
| Nitrogen | 1 | >560 kg/ha
560-280 kg/ha < 280kg/ha |
3
2 1 |
High
Medium Low |
| Phosphorus | 1 | >25 kg/ha
25-10 kg/ha <10 kg/ha |
3
2 1 |
High
Medium Low |
| Potassium | 1 | >280 kg/ha
280-108 kg/ha < 108 kg/ha |
3
2 1 |
High
Medium Low |
| Organic carbon (%) | 1 | >0.75
0.75-.50 < 0.50 |
3
2 1 |
High
Medium Low |
| pH | 1 | 6.6-7.3
7.4-8.4, 6.5-5.6 < 5.5, >8.5 |
3
2 1 |
High
Medium Low |
| Sulfur | 1 | >20 mg/kg
20-10 mg/kg <10 mg/kg |
3
2 1 |
High
Medium Low |
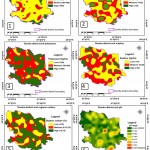 |
Figure 3: Soil map: 1. Nitrogen 2. Phosphorous 3. Potassium 4. Sulphur 5. Organic carbon 6. pH Click here to View figure |
A grid of 1km X 1km was generated over the Dumka district in the form of shape file for further evaluation. The final nutrient availability map (Figure 4) was produced in form of grid is highly useful layer for agriculture/forestry/ agroforestry related management and planning.
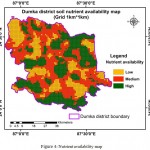 |
Figure 4: Nutrient availability map. Click here to View figure |
Agroforestry Suitability Mapping
The potential themes which is important for the growth of various agroforestry plant such as nutrient availability, slope, wetness, rainfall and elevation was brought for GIS integration and weight are assigned to each thematic layer based on the table 5 which was generated by using pairwise comparisons (Saaty et al. 1980) a widely acceptable statistical tool in GIS mapping (Sarkar et al. 2014). The agroforestry suitability map produced (Figure 6) is shown in figure 4.6. The result exhibit 2083, 744 and 507 of the study area (open land) grid are as high, medium and low respectively suitable for agroforestry practices (Table 7). Similar finding has been endorsed by Ahmad et al. (2017d) for agroforestry suitability mapping.
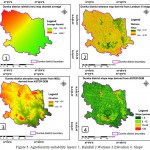 |
Figure 5: Agroforestry suitability layers: 1. Rainfall 2.Wetness 3.Elevation 4. Slope. Click here to View figure |
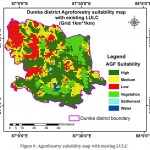 |
Figure 6: Agroforestry suitability map with existing LULC
|
Table7: Agroforestry suitability with LULC grids (in open area) of study area with area statistics
| No. of grid | Percentage | ||
| Agroforestry suitability
(In open land) |
High | 1695 | 42.4 |
| Medium | 941 | 23.6 | |
| Low | 785 | 19.6 | |
| LULC
( Existing land use/ land cover) |
Settlement | 6 | 0.2 |
| Water | 24 | 0.6 | |
| Vegetation | 544 | 13.6 |
Watershed, Drainage and Poverty Grid Based Spatial Evaluation of Land Towards Agroforestry Suitability
The objective of this research was to bring the outcomes to the end users, who are local citizen/villagers/farmer of this district. Watershed is the natural boundary is best suited to tap the local resources in conjunction with the rainwater harvest for conservation and planning for agroforestry crop. It was found approximately 50% of the land of one of this watershed area consist of high agroforestry suitability grid. Agroforestry potential suitable land and its proximity to drainage show very strong correlation. Approximately 60% of high agroforestry potentially suitable land shows adequate proximity with drainage pattern (Figure 8) provides a good opportunity to explore agroforestry practices in combination with soil and water conservation measures in the rain fed area. Adequate soil and water conservation structure should be made in flow of seasonal rivers utilizing local knowledge to tap the monsoon rain water which will not only enhance soil moisture after monsoon season but also provide the opportunity to harness agroforestry crops for longer period.
The poverty map (Figure 7) was produced using visual interpretation technique of grid map generated by Bhandari and Chakraborty, (2014) was further analyzed with respect to agroforestry map which shows the high poverty grid roughly consist more than 70% of the high agroforestry suitable land can provide good opportunity to the villagers/local people to harness various agroforestry practices. Poverty in these areas potentially removed if the local inhabitant can get adequate funds/technology by Government/NGO’ to carry out watershed based agroforestry projects including soil and water conservation measures in high agroforestry suitable land grid. This will provide diversified benefit to the local people including enhancing the small scale household income and improving their livelihood gradually.
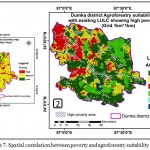 |
Figure 7: Spatial correlation between poverty and agroforestry suitability
|
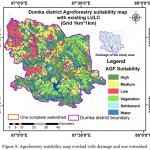 |
Figure 8: Agroforestry suitability map overlaid with drainage and one watershed Click here to View figure |
Validation of Result
Agroforestry suitability map of one of the delineated watershed was validated with reference to Google Earth map and field verification (Figure 9). These high agroforestry suitable areas in open space were found covered with least to no vegetation even though being the potential high suitable sites for agroforestry practices due to low slope, high fertility status and has the capacity to retain moisture if it is scientifically utilized.
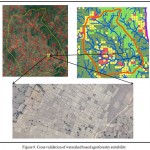 |
Figure 9: Cross validation of watershed based agroforestry suitability Click here to View figure |
Agroforestry Suitability Rating
High Priority Areas
These high agroforestry suitable areas roughly exhibit optimum soil nutrient, adequate wetness with gentle slope and low elevation which provide adequate favorable condition for the agroforestry plant/ crop growth. It comprises of 1695 grids. These land areas are highly fertile and best suitable for agri–silvi-horticulture system. Agriculture crop specially paddy crop in low land (locally called don) areas can be suitably harvested due sufficient availability of water and moisture during monsoon season whereas after monsoon season these area can have enormous potential for various horticulture crops as these area can retain soil moisture if scientifically managed even after monsoon season. Large chunks of uplands (locally called tar) area with adequately favorable climatic condition and high nutrient status that offers immense potential towards horticultural crops (fruit crops such as Mango, Litchi, Guava, Bel, Lemon, Papaya and Jackfruit etc. whereas vegetables such as french beans, radish, potato, chilies, cauliflower, brinjal, tomato, cabbage, okra etc. The tree species such as Sisam (Dalbergia sissoo), Ber (Zizyphus mauritiana) tree, Palas (Butea monosperma), Kusum (Schleichera oleosa), Asan (Terminalia tomentosa), Arjun (Terminalia arjuna), neem (Azadarchta indica) can be planted.
Soil and water conservation measures (mechanical or structural ) such as small check dam construction, water harvesting structure and ridge raised along the slope can help to conserve seasonal rainwater in the area. This stored rainwater will certainly secure soil moisture throughout the year and also reduce soil erosion due to control on surface runoff velocity will provide adequate opportunity to harness the agroforestry technology.
Medium Priority Areas
These medium agroforestry suitable areas mostly exhibit high to medium soil nutrient, moderate wetness, moderate rainfall with low to moderate slope and low to medium elevation provide an average favorable condition towards agroforestry crops. It comprises of 941 grids. These land areas generally have an average to low soil fertility, inadequate soil moisture except during rainy seasons and sign of soil erosion is common due to moderate slope. Soil and water conservation measure should be adopted in this area intensively to make the land more feasible. These areas can be utilized for silvi-pastural system and plantation purpose for few species such as Acacia nilotica, Zizyphus mauritiana, Grewia optiva (beul) tree with soil binder grasses (Saccharum munja) is likely to produce the good results.
These areas can be used for silvi-pastural system and plantation of species such as Acacia nilotica, Zizyphus mauritiana, Grewia optiva (beul) tree with soil binder grasses (Saccharum munja) is likely to produce the good results.
These areas mostly exhibit high to medium soil nutrient, moderate wetness, moderate rainfall with low to moderate slope and low to medium elevation provided average favorable condition towards agroforestry plant/ crop growth. It comprises of 941 grids. These areas exhibit average to low soil fertility, inadequate soil moisture except during rainy seasons and sign of soil erosion is common due to average slope. There is a need to adopt soil and water conservation measure intensively to make the land more feasible. These areas can be used for silvi-pastural system and plantation of species such as Acacia nilotica, Zizyphus mauritiana, Grewia optiva (beul) tree with soil binder grasses (Saccharum munja) is likely to produce better result.
Low Priority Areas
These low agroforestry suitable areas shows low soil nutrient, poor to nil wetness, low rainfall, steep slope and high elevation which provides the least favorable condition for the plant growth. It accounted for 785 grids and it mostly comprises of highly exposed rocks with low to nil soil depth with eroded sloppy land. These areas strongly exhibit poor fertility needed to be treated with good organic matter by farm yard manure (FYM) and green manure. Soil moisture in this area is found very low and sign of high soil erosion due to steep slope thus make this area mandatory for soil and water conservation practices. These area can be used for dry land farming after the improvement. The trees Acacia nilotica (kikar), Zizyphus mauritiana (ber), Azadirachta indica(neem) crops can be grown in this area. Munj (Saccharum munja) and kas (Saccharum spontaneum) grasses can be utilized in sloppy area to reduce/check soil erosion.
Conclusion
To enhance the livelihood of the poor people/farmers suffering from crop failure, food scarcity there is a strong need to adopt/implement various agroforestry practices in the identified potential sites. This research shows the potentiality of geospatial technology in delineating suitable sites for studying agroforestry practices. The use of ancillary data sets and pooling in GIS domain as thematic layer and its spatial pattern can have enormous scope to map the land for the benefit of the villagers /farmers.
Our study analysis leads a great expectation for the villagers of Dumka district to harness agroforestry practices if it is supported financially by Government, NGO/s, World Bank and other international donor along with appropriate technology. Such data has greater importance as India has adopted the agroforestry policy as well as our Govt. has dedicated to increase farmers income to double up to year 2022. The agroforestry suitability mapping in Dumka district was done based on similar guidelines documented by FAO for land suitability. There is an urgent need to generate such map with high resolution satellite data with better DEM quality, highly accurate ancillary data sets and various themes will certainly fetch better spatial information of land suitability towards agroforestry which is currently missing by the policy makers/decision makers, is a research gap. Our research finding highlights the honest approach to fulfill such gap. The watershed based various agroforestry practices with intensive soil and water conservation measures in drought prone area of Dumka district should be suitably adopted by village community participation approach for long term benefits in highly potentially suitable sites.\
Authors’ Contributions
FA proposed the idea, analyzed the satellite and ancillary data in GIS domain and drafted the manuscript, LG supervised the analysis and improved the manuscript. Both authors read and approved the final manuscript.
Competing Interests
The authors declare that they have no competing interests.
Funding
No funding in any form has been received by any of the author for current work.
Acknowledgements
The authors are grateful to the USGS for free download of Landsat and DEM (ASTER) data which was used in the analysis. Required GIS layers were downloaded from DIVA GIS website.
Reference
- Ahmad F & Goparaju L. Analysis of Urban Sprawl Dynamics Using Geospatial Technology in Ranchi City, Jharkhand. India. J. Environ. Geogr. 2016;9(1–2):7–13.
CrossRef - Ahmad F & Goparaju L. Urban Forestry: Identification of Suitable sites in Ranchi city, India using Geospatial Technology. Ecological Question. 2016;24:45–58. http://dx.doi.org/10.12775/EQ. 2016.011 (in press)
CrossRef - Ahmad F & Goparaju L. Spatio-temporal dynamics of mines in Singrauli, India: An analysis using geospatial technology. Journal of Geomatics. 2017;11(1):53-59
- Ahmad F & Goparaju L. Conservation prioritization and planning of forest land a reciprocal approach by measuring forest disturbance using geospatial technology. The Ecoscan. 2017;10(3&4). (in press)
- Ahmad F., Goparaju L & Qayum A. Natural Resource Mapping Using Landsat and Lidar towards Identifying Digital Elevation, Digital Surface and Canopy Height Models. Int. J. Environ. Sci. Nat. Res. 2017;2(1):555580.
- Ahmad F., Goparaju L & Qayum A. LULC analysis of urban spaces using Markov chain predictive model at Ranchi in India. Inf. Res. 2017. DOI: 10.1007/s41324-017-0102-x
CrossRef - Ahmad F.,Goparaju L & Qayum A. Studying malaria epidemic for vulnerability zones: Multi-criteria approach of geospatial tools. Journal of Geoscience and Environment Protection. 2017;5(5):30-53.
CrossRef - Ahmad F., Goparaju L & Qayum A. Agroforestry suitability analysis based upon nutrient availability mapping: a GIS based suitability mapping. AIMS Agriculture and Food. 2017;2(2):201-220. doi: 10.3934/agrfood. 2017.2.201
CrossRef - Alley R., Berntsen T., Bindoff N., Chen Z., Chidthaisong A, Solomon S., Qin D & Manning M. The Physical Science Basis. Contribution of Working Group I to the 4th Assessment Report of the Intergovernmental Panel on Climate Change. Cambridge, UK: Cambridge University Press. 2007.
- Anderson S. H., Udawatta R. P., Seobi T & Garrett H. E. Soil water content and infiltration in agroforestry buffer strips. Agrofor. 2009;75:5-16.
CrossRef - Asbjornsen H., Hernandez-Santana V., Liebman M., Bayala J., Chen J., Helmers M., Ong C & Schulte L. Targeting perennial vegetation in agricultural landscapes for enhancing ecosystem services. Renew Agric Food Syst. 2014;29: 101-125.
CrossRef - Baig M. H. A., Zhang L., Shuai T & Tong Q. Derivation of a tasselled cap transformation based on Landsat 8 at-satellite reflectance. Remote Sensing Letters. 2014;5:423–431. doi:10.1080/2150704X.2014.915434.
CrossRef - Bhandari L & Chakraborty M. Spatial poverty in Jharkhand http://www.livemint.com/Specials/bqVly6xj4usB3DiTibS3DK/Spatial-poverty-in-Jharkhand.html) Accessed on 9th May 2017.
- Bijalwan A., Upadhyay A. P & Dobriyal M. J. R. Tree-crop Combinations, Biomass and Carbon Estimation in Conventional Agrisilviculture (Agroforestry) System along Altitude and Aspects in the Hills of Uttarakhand Himalaya, India . Int. J. Curr. Res. Biosci. Plant Biol. 2015;2(6):214-217.
- Ellis E. A., Nair P. K., Linehan P. E., Beck H. W & Blanche C. A. A GIS-based database management application for agroforestry planning and tree selection. Computers and Electronics in Agriculture. 2000;27:41-55.
CrossRef - FAO, 1976 A framework for Land evaluation. FAO Soils bulletin 32. (https://www.mpl.ird.fr/crea/taller-colombia/FAO/AGLL/pdfdocs/framele.pdf) Accessed on 22nd April 2017.
- Garrity D., Edited by: Garrity D., Okono A., Grayson M., Parrott S. Science based agroforestry and the achievement of the millennium development goals. World Sgroforestry into the Future.2006, Nairobi, Kenya: World Agroforestry Centre. 2006.
- Hartz-Rubin J. S & DeLucia E. H. Canopy development of a model herbaceous community exposed to elevated atmospheric CO2 and soil nutrients. Physiologia Plantarum. 2001;113(2):258-266. DOI: 1034/j.1399-3054.2001.1130214.x
- Hernandez G., Trabue S., Sauer T., Pfeiffer R & Tyndall J. Odor mitigation with tree buffers: Swine production case study. Agric Ecosyst Environ. 2012;149:154–163.
CrossRef - Indian Water Portal (2016) (http://www.indiawaterportal.org/met_data/) Accessed on 10th March 2017.
- Jose S. Agroforestry for conserving and enhancing biodiversity. Agro for Syst. 2012;85:1-8.
CrossRef - Mbow C., Noordwijk M. V., Luedeling E., Neufeldt H., Minang P. A & Kowero G. Agroforestry solutions to address food security and climate change challenges in Africa. Curr Opin Environ Sustain. 2014;6:61–67.
CrossRef - McNeely J. A. Nature vs. nurture: Managing relationships between forests, agroforestry and wild biodiversity. Agrofor Syst. 2004;61:155-165.
CrossRef - National Agroforestry Policy, 2014, Government of India. (www.nrcaf.res.in/NAF_Policy.pdf) Accessed on 22nd October 2016.
- Nguyen Q., Hoang M. H., Oborn I & Noordwijk M. V. Multipurpose agroforestry as a climate change resiliency option for farmers: An example of local adaptation in Vietnam. Clim Change. 2013;117:241-257.
CrossRef - Pandey D. N. Multifunctional Agroforestry Systems in India for Livelihoods: Current Knowledge and Future Challenges. (http://services.iriskf.org/data/articles/Document 11092005230. 3497126. pdf ) Accessed on 7th May 2017.
- Qayum A., Arya R., Kumar P & Lynn A. M. Socio-economic, epidemiological and geographic features based GIS-integrated mapping to identify malarial hotspot. Malaria J. 2015;14:192. doi: 10.1186/s12936-015-0685-4.
CrossRef - Quli S. M. S. Agroforestry for NTFPs conservation and economic upliftment of farmers. Indian Forester. 2001;127:1251-1262.
CrossRef - Reisner Y., de Filippi., Herzog F & Palma J. Target regions for silvoarable agroforestry in Europe. Ecological engineering. 2007;29:401–418.
- Ritung S., Wahyunto F. A & Hidayat H. Land Suitability Evaluation with a case map of Aceh Barat District. Indonesian Soil Research Institute and World Agroforestry Centre, Bogor, Indonesia. 2007.
- Saaty T. L. The Analytic Hierarchy Process; McGraw-Hill International: New York, NY. 1980.
- Sarkar A., Ghosh A & Banik P. Multi-criteria land evaluation for suitability analysis of wheat a case study of a watershed in eastern plateau region, India. Geospatial Information Science. 2014;17(2):119-128.doi: 10.1080/10095020.2013.774106.
CrossRef - Schoeneberger M., Bentrup G., De Gooijer H., Soolanayakanahally R., Sauer T., Brandle J & Current D. Branching out: Agroforestry as a climate change mitigation and adaptation tool for agriculture. Journal of Soil and Water Conservation. 2012;67(5). DOI: 2489/jswc.67.5.128A
- Singh K. M.,Meena M. S., Singh R. K. P., Kumar A & Kumar A. Rural Poverty in Jharkhand, India : An Empirical Study based on Panel Data. 2012. ICAR-RCER, Patna, NCAP, New Delhi. https://mpra.ub.uni-muenchen.de/45258/1/MPRA_paper_45258.pdf (Accessed on 7th May 2017)
- Thorlakson T., Neufeldt H & Dutilleul F. C. Reducing subsistence farmers’ vulnerability to climate change: Evaluating the potential contributions of agroforestry in western Kenya. Agric. Food Secur. 2012;1:1-13.
CrossRef - Verchot L.V., Noordwijk M.V., Kandji S., Tomich T., Ong C., Albrecht A., Mackensen J., Bantilan C., Anupama K & Palm C. Climate change: linking adaptation and mitigation through agroforestry. Mitig Adapt Strat Glob Chang. 2007;12:901-918. 10.1007/s11027-007-9105-6.
CrossRef - Watson R. T., Noble I. R., Bolin B. Ravindranath N. H. Verardo J. D & Dokken D. J. Land Use, Land-Use Change and Forestry. IPCC Special Report, Cambridge Univ. Press, Cambridge. 2000;388.
- World Bank, 2016, Jharkhand Poverty, Growth & Inequality. (http://documents.worldbank.org/curated/en/767291467992476557/pdf/105854-BRI-P157572-PUBLIC-Jharkhand-Proverty.pdf) Accessed on 7th May 2017
- Yedage A. S., Gavali R. S & Jarag A. P. Land Assessment for Horticulture (Pomegranate) Crop Using GIS and Fuzzy Decision Analysis in the Sangola Taluka of Solapur District. International Journal of Remote Sensing and GIS. 2013;2(3):104-113.
- Kumar V. Multifunctional Agroforestry Systems in Tropics Region. Nature Environment and Pollution Technology. 2016;15(2):365-376
- Depommier D. The tree behind the forest: Ecological and economic importance of traditional agroforestry systems and multiple uses of trees in India. Trop. Ecol. 2003;44:65-71.
- Nair P. K. R. Agroforestry systems and environmental quality: introduction. Journal of Environmental Quality. 2011;40(3):784-790.
CrossRef - Sahoo U. K. Traditional homegardens and livelihood security in northeast India. J. Food. Agric. Env. 2009;7:665-670.
- NRCAF NRCAF Vision 2050. National Research Centre for Agroforestry, Jhansi. 2013;03.
- Newaj R., Chavan S and Prasad R. Agroforestry as a strategy for climate change adaptation and mitigation. Indian J. Agroforestry. 2013;15(2):41-48.
- McNeely J. A and Schroth G. Agroforestry and biodiversity conservation-traditional practices, present dynamics, and lessons for the future. Biodivers. Conserv. 2006;15:549-554.
CrossRef - Mahapatra D. Over 12,000 farmer suicides per year, Centre tells Supreme Court. http://timesofindia.indiatimes.com/india/over-12000-farmer-suicides-per-year-centre-tells-supreme-court/articleshow/58486441.cms ( Accessed on 5th May 2017).
- Coomes D. A and Allen R. B. Effects of size, competition and altitude on tree growth. Journal of Ecology. 2007;95: 1084–1097.
CrossRef

This work is licensed under a Creative Commons Attribution 4.0 International License.


