


Abstract
Context: Understanding the menopause association with body weight is important because excess weight increases risk for stroke, incident cardiovascular disease, cardiovascular mortality, and all-cause mortality among the middle-aged.
Objective: The objective of this study was to examine chronological age and ovarian age and consider how these could influence body size and composition in midlife women.
Design and Setting: The Study of Women’s Health Across the Nation is a longitudinal, community-based study. This report uses data from the Michigan Study of Women’s Health Across the Nation site.
Participants: Participants were 543 premenopausal or early perimenopausal African-American and Caucasian women aged 42–52 yr at baseline examination.
Main Outcome Measures: Waist circumference, fat mass and skeletal muscle mass, from bioelectrical impedance, were assessed in seven annual serial measures. Annual FSH values were assayed by ELISA. The final menstrual period was defined retrospectively after 12 months of amenorrhea.
Results: There was an absolute cumulative 6-yr increase in fat mass of 3.4 kg and a 6-yr decrease in skeletal muscle mass of approximately 0.23 kg. There was an absolute cumulative 6-yr increase of approximately 5.7 cm in waist circumference. The logFSH change was positively correlated with log(fat mass) change. Waist circumference increased over the time period, but 1 yr after final menstrual period, the rate of increase slowed. Fat mass continued to increase with no change in rate.
Conclusions: Both time (chronological aging) and ovarian aging contributed to substantial changes in body composition (fat and skeletal muscle mass) and waist circumference. These changes have important ramifications for establishing a metabolic environment that can be healthy or unhealthy.
OBESITY HAS BEEN labeled as the epidemic of the 21st century, but until recently, the role of body composition compartments, especially fat mass, was not considered central to understanding the health-related implications of the obesity epidemic. Now, fat mass is no longer considered just a passive storage unit for fat, but an active contributor to the metabolic profiles affecting health, so a more precise estimate is increasingly valuable compared with the proxy body mass index (BMI; kg/m2) measure (1). The relative changes in body composition, particularly fat mass and skeletal muscle mass, during the menopause, are less well-documented than weight changes with age. Cross-sectional studies suggest an age-related increase in the prevalence of overweight and obesity, as measured by BMI (2, 3), more often occurring in women than men, across multiple populations (2, 4). Longitudinal studies of body weight change document a rapid increase in weight among young adults, followed by a lesser increase among middle-aged adults, and a decrease in weight in elderly adults (4, 5).
Some, but not all, cross-sectional studies (6) suggest greater fat mass and less lean mass in postmenopausal compared with premenopausal women, but no longitudinal studies have evaluated body composition changes across the menopause transition. Studies of fat distribution or topology suggest that there may be increased likelihood of a menopause effect (7). In longitudinal studies, measures of abdominal adiposity, such as waist circumference or abdominal skinfold thickness, steadily increase with aging (5, 8). This would suggest a general increase in fat mass, but lack of change or decrease in fat-free mass, with aging (9, 10).
Understanding the menopause contribution to weight and its distribution is important because of the potential impact on health status in women. Excess weight increases risk for stroke, incident cardiovascular disease, cardiovascular mortality, and all-cause mortality among the middle-aged; therefore, identifying a potential contribution of menopause to this risk is important (11, 12). Furthermore, these risks take on new relevance as current research increasingly identifies that adipose tissue functions as an endocrine organ, secreting a variety of cytokines including leptin, adiponectin, resistin, plasminogen activator inhibitor-1, TNF-α, and IL-6 (13) with immunological, vascular, and metabolic actions (14). The purpose of this study was to determine, in women at the midlife, if changes in body size and body composition were related to chronological aging and/or to ovarian aging. In this longitudinal study, we used time in study (from seven annual serial examinations) to describe the effect of chronological aging. Ovarian aging was characterized using annual measures of FSH or menopause status defined by the interval lengths between self-reported menses and time since final menstrual period (FMP).
Subjects and Methods
Sample
Although the Study of Women’s Health Across the Nation (SWAN) is a multisite, multirace/multiethnic longitudinal study of women at midlife as they approach and traverse menopause, this report is limited to the Michigan SWAN data, the location of a body composition site-specific study begun at the SWAN baseline.
The SWAN study population was recruited using a two-stage design with different criteria for inclusion at each stage, and this has been previously described (15). In the first stage, conducted in 1995, potential Michigan SWAN enrollees were identified from a census of 24,283 households located in census tracts associated with two suburban communities near Detroit, Michigan. We successfully interviewed 2621 (65%) eligible women, aged 40–55 yr, residing in the preselected census tracts, by telephone (25% of contacts) or in-person contact (75%). The list of successfully interviewed women in the first stage served as the sampling frame for identification of women eligible for enrollment in the longitudinal cohort (second stage). Women eligible for the longitudinal cohort were aged 42–52 yr, either African-American or Caucasian by self-definition, reported menstrual bleeding within the previous 3 months of enrollment, and no use of hormone replacement therapy within 3 months of enrollment. A longitudinal cohort of 543 (72%) women (325 African-American; 218 Caucasian) was enrolled. This number was reduced in the first follow-up year to reduce study costs, but in the fifth follow-up, 62 enrollees with baseline data were rerecruited. Since then, participation has been more than 80% of the baseline sample. There have been 18 deaths among members of the cohort. Table 1 describes the baseline sample numbers and characteristics of those women whose data contributed to this report.
Baseline characteristics of women age 42–52 yr at baseline, Michigan SWAN
| Overall (n = 543) | African-American (n = 325) | Caucasian (n = 218) | ||||
|---|---|---|---|---|---|---|
| Mean | sd | Mean | sd | Mean | sd | |
| Age (yr) | 45.6 | 2.7 | 45.5 | 2.8 | 45.7 | 2.6 |
| Body size measures | ||||||
| Height (cm) | 163.5 | 6.2 | 163.8 | 6.1 | 162.9 | 6.2 |
| Weight (kg) | 85.8 | 21.8 | 86.7 | 22.0 | 84.3 | 21.5 |
| BMI (kg/mb) | 32.1 | 8.1 | 32.3 | 8.1 | 31.8 | 8.0 |
| Waist circumference (cm) | 94.1 | 17.2 | 94.8 | 16.9 | 93.2 | 17.6 |
| Hip circumference (cm) | 113.9 | 16.2 | 113.8 | 16.3 | 113.9 | 16.1 |
| Waist to hip ratio | 0.83 | 0.1 | 0.83 | 0.1 | 0.82 | 0.1 |
| Fat mass (kg) | 36.4 | 16.4 | 37.2 | 16.9 | 35.0 | 15.5 |
| Lean mass (kg) | 49.4 | 8.7 | 49.3 | 8.7 | 49.6 | 8.6 |
| Skeletal muscle mass (kg) | 21.8 | 3.4 | 21.7 | 3.4 | 21.8 | 3.3 |
| SMI (kg/mb) | 8.1 | 1.2 | 8.1 | 1.2 | 8.2 | 1.1 |
| LogFSH (mIU/ml)a | 2.9 | 0.7 | 2.9 | 0.8 | 2.8 | 0.6 |
| FSH (mIU/ml)b | 17.8 | 13.1 | 18.9 | 13.9 | 16.3 | 12.0 |
Log-transformed values are presented due to the skewed distribution of FSH.
FSH values presented have been transformed back to their original scale.
Measures
Michigan SWAN enrollees participated in annual examinations that were scheduled to coincide with the anniversary of their initial assessment and within a window to allow phlebotomy to be indexed to the early follicular phase of the menstrual cycle, if women were still menstruating. Written informed consent was obtained annually from all participants, and data were collected via protocols reviewed and endorsed by the University of Michigan Institutional Review Board.
Body composition measures
The SWAN core protocol included annual measures of weight and height measured with calibrated electronic or balance beam scales and stadiometer, and those data were used to calculate BMI. Other annual measures included waist circumference, measured at the narrowest part of the torso, and hip circumference, measured at the iliac crest. The former was used to approximate central adiposity in this report. To supplement this information, in 1996/1997, a site-specific substudy of body composition and physical functioning was implemented in the Michigan SWAN longitudinal population. The Michigan substudy included the use of bioelectrical impedance analysis (BIA) to assess body composition since study inception; other sites added this measure at the sixth annual follow-up.
BIA is based on measurement of the transmission speed of a 1/4 volt electrical pulse between electrodes attached at the feet and electrodes attached across the knuckles of the hand. Because fat-free mass is comprised of water, proteins, and electrolytes, conductivity is greater in fat-free mass than in fat mass (16). Resistance and reactance are used to estimate total body water, and by extension, fat mass and lean mass, with the latter including bone (17). Skeletal muscle mass was calculated by the method of Janssen et al. (18), who subsequently indexed skeletal muscle mass to height for a skeletal muscle index (SMI) and developed cutpoints relating to the risk of disability associated with SMI (19). These variables were treated as time-varying covariates.
FSH assay
The phlebotomy protocol specified a blood draw after 12-h fast and in the 2- to 5-d window of the early follicular phase of the menstrual cycle. If a blood sample could not be obtained in the d-2 to -5 window in the 60 d after the anniversary visit date (usually because of irregular menstrual cycles), blood was obtained in the subsequent 30 d without respect to menstrual bleeding. Serum was analyzed for FSH. Serum FSH concentrations were measured with a two-site chemiluminometric immunoassay using constant amounts of two monoclonal antibodies. Each antibody is directed to different regions on the β-subunit (one coupled to paramagnetic particles and the other labeled with a dimethylacridinium ester) with specificity for intact FSH. Interassay and intraassay coefficients of variation (CV) were 12.0 and 6.0%, respectively, at an FSH level of 15 mIU/ml.
Menopausal status measures
Menopausal status assignment was based on annual reports about menstrual bleeding and its regularity. Premenopause was identified as no decreased regularity in menstrual bleeding during the previous year. Other classifications were early perimenopause (decreased menses regularity in the 3 months before the interview), late perimenopause (no menses for 3–11 months), and postmenopause (no menses for 12 or more months). Surgical menopause was defined by report of either hysterectomy or oophorectomy.
The number of women classified as premenopausal declined progressively from 50.4% at the baseline examination to 8% at the sixth follow-up examination. Conversely, the number of women who became postmenopausal [without hormone therapy (HT) use] rose progressively from 1% at the first follow-up examination to 15% at the sixth follow-up examination. HT use and medication use was identified from interviews and, when possible, confirmed by observing the medication packaging. There was no use of HT at the baseline examination as a condition of study eligibility, although by the sixth follow-up visit, cumulatively, 20.4% of women had reported HT use. Data from women reporting HT use were classified into a separate menopause group; these data were treated as time-varying covariates. FMP is defined retrospectively as the last menstrual period before 12 months amenorrhea.
Other measures
Self-administered questionnaires were used to assess current smoking status (yes/no) (20). Physical activity, assessed at baseline and at the sixth follow-up exam, was a summary score reflecting activities of living, home, recreation, plus work, if relevant (21, 22). A variable of 6-yr physical activity change was created for analysis purposes.
Analysis approaches
Analyses were based on a total of 3426 observations from 543 women, with women contributing one to seven data points, depending upon the frequency of their participation in follow-up visits. There were 830 observations from 130 women with an FMP during the study period. Univariate distributions of eight continuous measures of body composition were examined for normality. To meet the assumptions of normality and to reduce skewness, natural log transformations were applied to FSH concentrations and seven of the eight body composition measures (excluding height). The frequencies of categorical covariates were examined overall and by year of visit.
The variability of the eight body composition outcomes was evaluated and expressed as a CV for each visit and the output was plotted. The lowest CV (not surprisingly) were in height (centimeters, 3.7%) followed by waist (centimeters, 3.8%), lean mass (kilograms, 4.4%), skeletal muscle (kilograms, 5%), weight (kilograms, 5.5%), BMI (7%), and fat mass (kilograms, 12%). The variation was consistent over the 7-yr data collection period being examined (no drift upward with time or increasing body size) and similar in both African-American and Caucasian women.
The nature of influential individuals and/or data points was examined using likelihood distance. Influential values were retained as real biological fluctuations (e.g. some body measures/compositions may exhibit cycling patterns within certain time frame).
Participant characteristics at baseline and each of the six follow-up visits were described with means and sds calculated in the transformed scale and back-transformed to original scale. Differences in these characteristics according to race/ethnicity were tested for statistical significance at α = 0.05.
Repeated measures mixed modeling (SAS, Proc Mixed) for continuous variables was used to evaluate the relationship between body composition and menopause status (approximated by levels of FSH and intervals of bleeding frequency). See the Appendix, published as supplemental data on The Endocrine Society’s Journals Online web site at http://www.jcem.endojournals.org, for model development. This approach combined the cross-sectional (between women) and longitudinal (within women) estimates of association while correcting those estimates for multiple and correlated measures within women. Random intercepts, random slopes, and/or quadratic terms were included as appropriate. These mixed models also allowed the specification of the variance and covariance of measures so that ses used in testing significance of associations were robust. Sample variograms and goodness-of-fit statistics were used to evaluate the covariance structures and we selected the auto-regressive option. The appropriateness of model fitting was assessed both graphically and using residual analyses. Within the general frame of linear mixed-effect model, a piecewise linear mixed-effect model was developed to evaluate the change of slope at or near FMP for body composition measures.
The “chronological aging” or time effect was decomposed into a cross-sectional effect (approximated by baseline age) and a longitudinal “time” effect (baseline and six annual follow-up visits). Models included a quadratic time term (centered at visit three). The effect of “ovarian age” was modeled by incorporating terms for menopause status based on timing of menstrual bleeding and by incorporating values of FSH.
FSH concentrations (continuous variable) or menopausal status (categorical variable) were treated as time-varying covariates in the models, whereas baseline age and baseline body composition variables were treated as single-time variables. Interaction terms were incorporated to assess the relative effects of ovarian age on body composition with greater chronological age. Covariates were retained in models if their inclusion changed the β-coefficients for either FSH or menopause status (independent variables) by 10% or more. Models of associations between ovarian or chronological aging with measures of body composition are adjusted for race and not stratified by race because there were no differences in associations between races.
The population-averaged annual change and accumulated change (sixth follow-up visit vs. baseline) for each body composition measure were reported in absolute and/or relative (percent) values. The mean and 95% confidence interval (CI) from bootstrapping were used for Fig. 3. The marginal mean from mixed models at each year related to FMP were constructed and graphed.
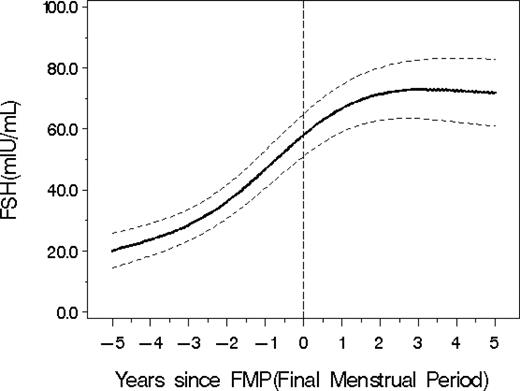
Average FSH values (with 95% CI from bootstrapping) in relation to the FMP.
SAS 9.1 and Macro facilities (SAS Institute, Cary, NC) were used to perform the statistical analyses and plot the findings. The experimental features in SAS 9.1 were used to perform the influence analysis.
Results
At baseline in 1996/1997, the 543 participants, of whom approximately 60% were African-American, had a mean age of 45 yr and mean BMI and waist circumference of 32.1 kg/m2 and 94.1 cm, respectively (see Table 1). Mean baseline FSH was 18.9 (sd = 13.9) and 16.3 (sd = 12.0) mIU/ml for African-American and Caucasian women, respectively, with the value for African-American women being statistically significantly higher than for Caucasian women.
Body composition and race
The average amount of fat mass in African-American women was 8.1% (95% CI: 0.5%, 16.3%) higher than the average fat mass in Caucasian women, as estimated using linear mixed models. There were no other statistically significant differences in other body composition measures between African-American and Caucasian women.
Body composition changes with time
Body composition measures changed over time with increasing age at each annual visit (see Fig. 1, left). The changes in weight, BMI, and waist circumference were linear, whereas the changes in height, fat mass, lean mass, and skeletal muscle mass had a more curvilinear pattern over time.
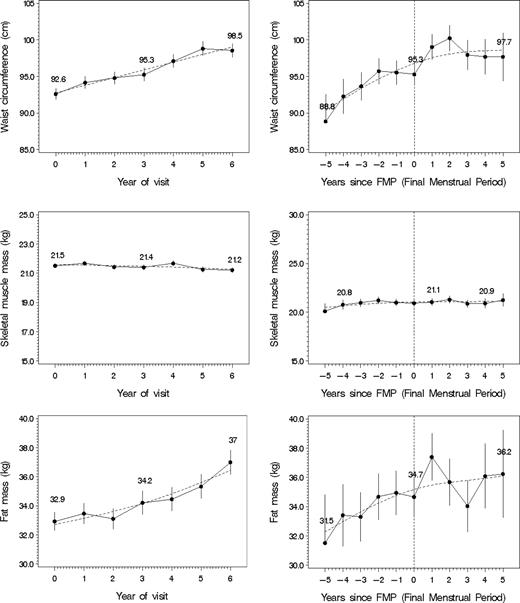
Changes in waist circumference, skeletal muscle mass, and fat mass over time (left: back-transformed LSmean plot with 1 se) or before and after FMP (right: back-transformed LSmean plot with 1 se) reflecting ovarian aging with spline smoothing. The solid line represents the actual data, and the dashed line represents the fitted line. Upper left, Waist circumference vs. time. Middle left, Skeletal muscle mass vs. year of visit. Lower left, Fat mass vs. year of visit. Upper right, Waist circumference vs. FMP. Middle right, Skeletal muscle mass vs. FMP. Lower right, Fat mass vs. FMP.
There was a 0.6% (∼0.5 kg) annual increase in weight [β: 0.0056 (95% CI: 0.004, 0.007)], which represents a relative and absolute cumulative 6-yr increase of 3.4% and approximately 2.9 kg, respectively (Table 2). There was a decrease in height of 0.064 cm per year (95% CI: −0.073, −0.055) and a cumulative 6-yr decrease of 0.38 cm. With the decrease in height and increase in weight, there was a significant annual increase of 0.7% in BMI (∼0.2 kg/m2) [β: 0.0065 (95% CI: 0.005, 0.008)], which represents a relative and absolute cumulative 6-yr increase of 4% and approximately 1.2 kg/m2, respectively.
Estimates of body composition changes with time from statistical models with body composition measures as the dependent variables and time as the linear or curvilinear independent variable(s)
| Body size/composition measures | Annual change | Relative 6-yr change (%) | Absolute cumulative 6-yr change |
|---|---|---|---|
| Weight (kg) | 0.6% (∼0.5 kg) | 3.4 | 2.9 kg |
| Height (cm) | −0.064 cma | 0.24 | −0.38 cm |
| BMI (kg/m2) | 0.7% (∼0.2 kg/m2) | 4 | 1.2 kg/m2 |
| Waist (cm) | 1% (∼0.9 cm) | 6.2 | 5.7 cm |
| Fat mass (kg) | 1.6% (∼0.57 kg) | 10.1 | 3.4 kg |
| Skeletal muscle mass (kg) | −0.18% (∼0.04 kg) | −1.06 | −0.23 kg |
Percent of annual change depends on time of visit.
There was a 1% (∼0.9 cm) annual increase in waist circumference [β: 0.0099 (95% CI: 0.009, 0.011)], which represents a relative and absolute cumulative 6-yr increase of 6.2% and approximately 5.7 cm, respectively.
A 1.6% (∼0.57 kg) increase in fat mass [β: 0.016 (95% CI: 0.013, 0.02)] was observed, which corresponds to a relative and absolute cumulative 6-yr increase of 10.1% and 3.4 kg. There was an annual 0.18% decrease in skeletal muscle mass [(∼0.04 kg) β: −0.0018 (95% CI: −0.003, −0.0007)] reflected in relative and absolute cumulative 6-yr decreases in skeletal muscle mass of 1.06% and approximately 0.23 kg, respectively. Annual measurements of lean mass did not change across the 6-yr time period.
Body composition and menopause stages
Three approaches were used to evaluate a potential ovarian aging contribution to body composition change including the amount explained by menopause stages, by FSH and its change, and the change before and after the FMP. There was no discernible change in body composition parameters associated with menopause stages defined by frequency of menstrual bleeding, independent of the effect of time.
Body composition, FSH, and FMP
Increasing levels of logFSH were associated with increasing fat mass and waist circumference, before and after adjusting for baseline age and baseline fat mass or baseline waist circumference, respectively. As shown in Fig. 2, there was a positive relationship between change in logFSH and change in log(fat mass) [correlation coefficient = 0.12 (95% CI: 0.09, 0.16)]. Increasing FSH was associated with decreasing lean mass and skeletal muscle mass. These associations were not related to either baseline age or to the interaction of baseline age with FSH concentration.
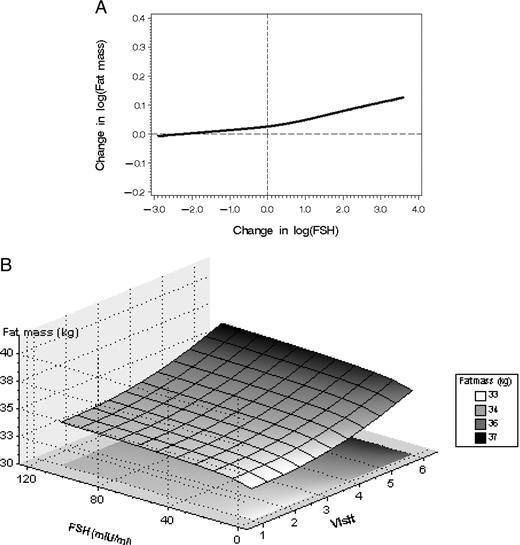
A, Greater change in FSH since baseline (horizontal axis) was associated with increased change in fat mass since baseline. B, Surface plot of adjusted associations between fat mass and ovarian and chronological aging.
Of the 543 enrollees, 130 (24%) experienced the FMP during the study time interval. When FSH values were considered in relation to time and FMP, the increasing average FSH was cubic; that is, FSH increased between −5 to −2 yr from the FMP, then increased markedly from −2 to 1 yr postmenopause, and then the fitted line tended to flatten, as shown in Fig. 3.
Over the study time, waist circumference continued to increase but approximately 1 yr after FMP, the rate of increase slowed (see Fig. 1, right). Women continued to gain fat mass, and no point was identified at which the rate of change increased or decreased. There was a modest loss of skeletal muscle mass until the year after the FMP, after which there was little evidence of change.
Discussion
Using longitudinal data with seven annual serial measures, we identified that the 6-yr increase in weight of women at the midlife was associated with both a substantially increased fat mass (an increase of 10%) and a smaller, nonetheless real, loss of skeletal muscle mass (a decrease of 1%). As expected, there was also an average 6% increase in waist circumference over the same time period. These body composition changes were explained, not only with the increasing age associated with the passage of time, but also with ovarian aging including progressively higher FSH concentrations and occurrence of the last menstrual period. Furthermore, these changes in body composition over this 6-yr period occurred similarly in both African-American and Caucasian women.
These data suggest that increase in waist circumference is more sensitive to ovarian aging than the increase in fat mass. The increase in waist circumference becomes less pronounced after the FMP coincident with a flattening of the FSH levels in the year after the FMP, whereas fat mass continues to increase with no evidence of a node when the rate of change is altered. Further investigation will have to explain why this alteration in waist should be observed in a year after the FMP. One might question whether this represents the response to a consolidation of a more androgenic profile; however, such a consolidation would appear to be more appropriate for an increase in the waist circumference rather than a diminished rate of change.
It is valuable to consider not only the change in weight with the menopause, but also additional measures of body composition. Adipose tissue became an acknowledged endocrine organ rather than just a passive reservoir for energy storage with the identification that adipocytes were sites of sex steroid metabolism and leptin production (23, 24). For example, leptin affects not only energy homeostasis but also regulates neuroendocrine function including the activation and suppression of the hypothalamic-pituitary axis (13). These are associated with metabolic attributes of cardiovascular disease including vascular injury and inflammation, disordered cholesterol metabolism, and hypertension (25). Thus, the increases in fat mass and its distribution to the waist around the menopause represent compelling risk factors for heart disease.
The changes in body composition also included a small but detectable loss of skeletal muscle mass. Loss of skeletal muscle mass also has implications for health in women after the menopause. A smaller skeletal muscle mass bed could be accompanied by diminished opportunity for synthesis of the Glut4 transport protein. In some (26, 27) but not all studies (28–30), levels of Glut4 mRNA and protein in adipose cells have been shown to be low in insulin-deficient diabetics, in those with impaired glucose tolerance, and in type 2 diabetes. Kahn (27) concluded that insulin resistance was due, in part, to defective translocation or activation of glucose transporters in the plasma membrane of skeletal muscle rather than changes in the levels of Glut4 in intracellular pools.
A number of factors are important in considering this study. These study results reflect information from women whose transition to postmenopause from a baseline premenopause or early perimenopause designation was relatively rapid. Additional longitudinal observations are needed to establish whether the greater changes in FSH associated with greater changes in fat mass are sustained in the postmenopause and how long this effect will be relevant. Additional observations will be required to assure that a similar pattern is replicated in those women with a longer transition time.
We used BIA to estimate body composition. This technique, although sensitive to hydration in the physically active, is quite useful in studies of middle-aged women. Size of women is not restricted in using bioelectrical impedance, whereas other technologies, such as dual energy x-ray densitometry, are restricted to those whose weight is within the examination table specifications, a requirement that would have excluded more than 7% of the women being evaluated. Indeed, BIA was the measurement methodology used in the National Health and Nutrition Examination Survey III (31). Additionally, there was little evidence of drift in this measure over time and there was substantial precision in the measures as shown with low CV.
In summary, we have shown that there were marked changes in body composition and body topology reflected in seven annual serial measures of women transitioning to the menopause. Furthermore, both chronological age and ovarian age contributed to the increase in fat mass, decrease in skeletal muscle mass, and increase in waist circumference. These changes have important ramifications for health in that adipose tissue, adipose tissue distribution, and skeletal muscle mass all make substantial contributions to the health-related environment.
Acknowledgments
The SWAN has grant support from the National Institutes of Health, Department of Health and Human Services, through the National Institute on Aging, the National Institute of Nursing Research, and the National Institutes of Health Office of Research on Women’s Health (Grants NR004061, AG017104, AG012505, AG012535, AG012531, AG012539, AG012546, AG012553, AG012554, AG012495).
Clinical Centers: University of Michigan, Ann Arbor—MaryFran Sowers, Principal Investigator (PI); Massachusetts General Hospital, Boston, MA—Robert Neer, PI 1994–1999, Joel Finkelstein, PI 1999–present; Rush University, Rush University Medical Center, Chicago, IL—Lynda Powell, PI; University of California, Davis/Kaiser—Ellen Gold, PI; University of California, Los Angeles—Gail Greendale, PI; University of Medicine and Dentistry, New Jersey Medical School, Newark—Gerson Weiss, PI 1994–2004, Nanette Santoro, PI 2004–present; and University of Pittsburgh, Pittsburgh, PA—Karen Matthews, PI.
NIH Program Office: National Institute on Aging, Bethesda, MD—Marcia Ory 1994–2001, Sherry Sherman, 1994–present; National Institute of Nursing Research, Bethesda, MD—Program Officers. Central Laboratory: University of Michigan, Ann Arbor—Daniel McConnell (Central Ligand Assay Satellite Services).
Coordinating Center: New England Research Institutes, Watertown, MA—Sonja McKinlay, PI 1995–2001; University of Pittsburgh, Pittsburgh, PA—Kim Sutton-Tyrrell, PI 2001–present.
Steering Committee: Chris Gallagher, Chair; Susan Johnson, Chair.
Disclosure Summary: M.S. consults for and received lecture fees from Wyeth. H.Z., K.T., C.K.-G., M.J., X.L., and M.Y. have nothing to declare. J.S. was previously employed by and has equity interests in Pfizer.
Abbreviations:
- BIA,
Bioelectrical impedance analysis;
- BMI,
body mass index;
- CV,
coefficient of variation;
- FMP,
final menstrual period;
- HT,
hormone therapy;
- SMI,
skeletal muscle index.
